july - december 2009 biannual economic and capacity survey
TRANSCRIPT
July - December 2009
Biannual Economic and Capacity Survey
CESA Biannual Economic and Capacity Survey January – June 2009
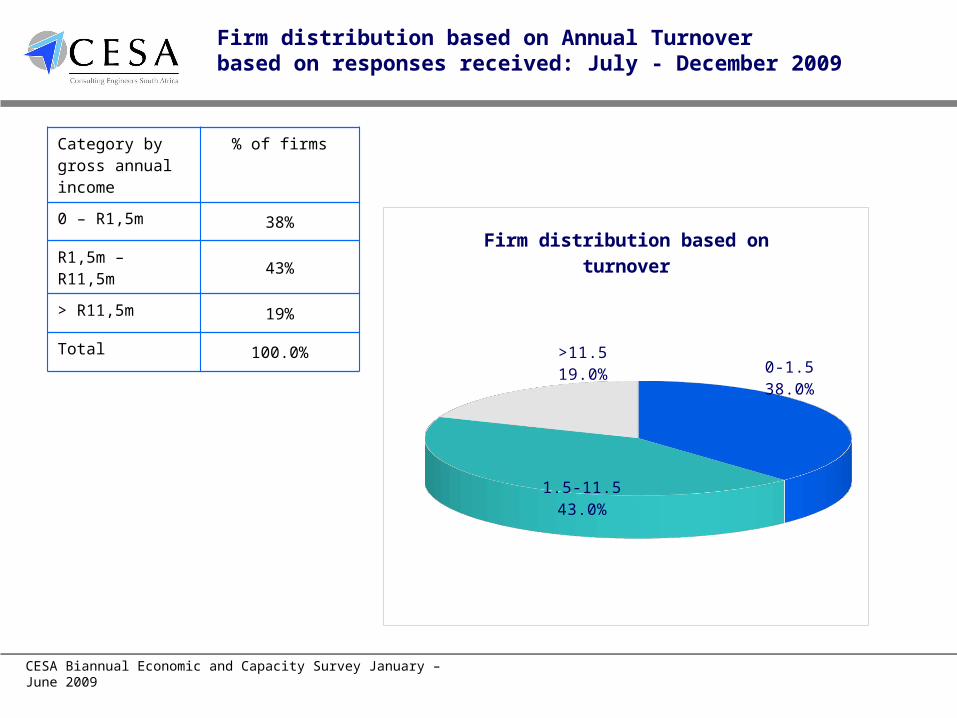
Firm distribution based on Annual Turnoverbased on responses received: July - December 2009
Category by gross annual income
% of firms
0 – R1,5m 38%
R1,5m – R11,5m 43%
> R11,5m 19%
Total 100.0%
0-1.538.0%
1.5-11.543.0%
>11.519.0%
Firm distribution based on turnover
CESA Biannual Economic and Capacity Survey January – June 2009
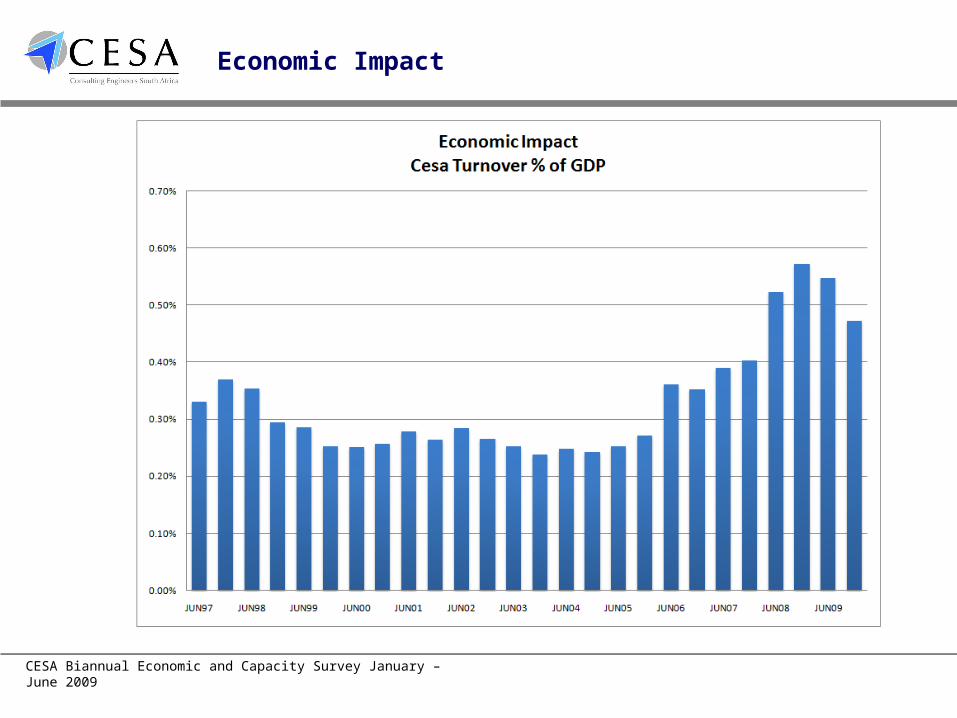
Economic Impact
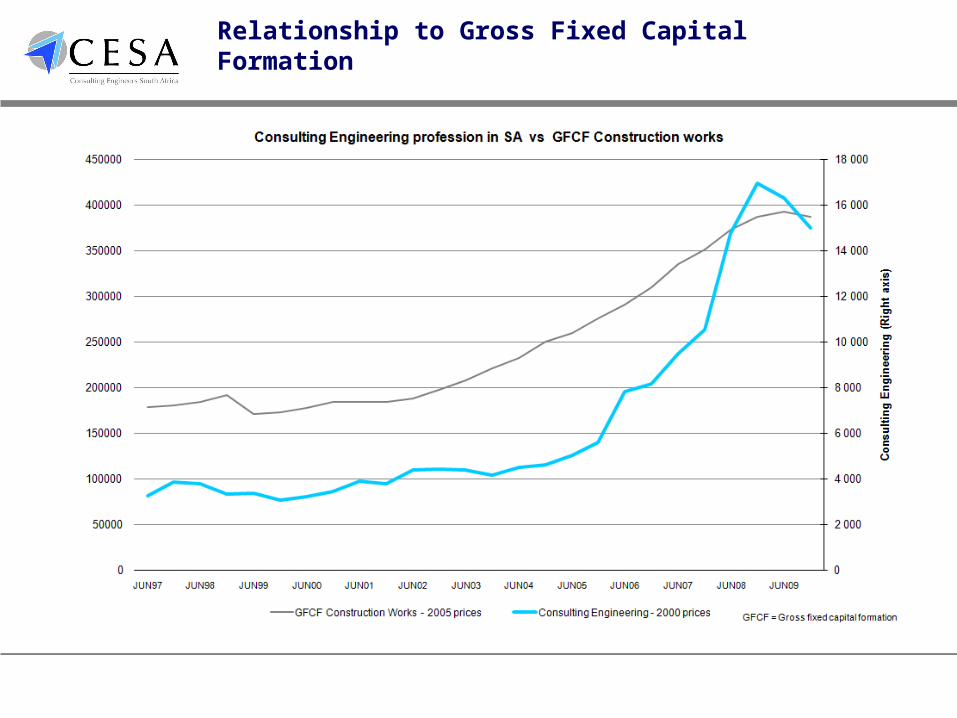
Relationship to Gross Fixed Capital Formation
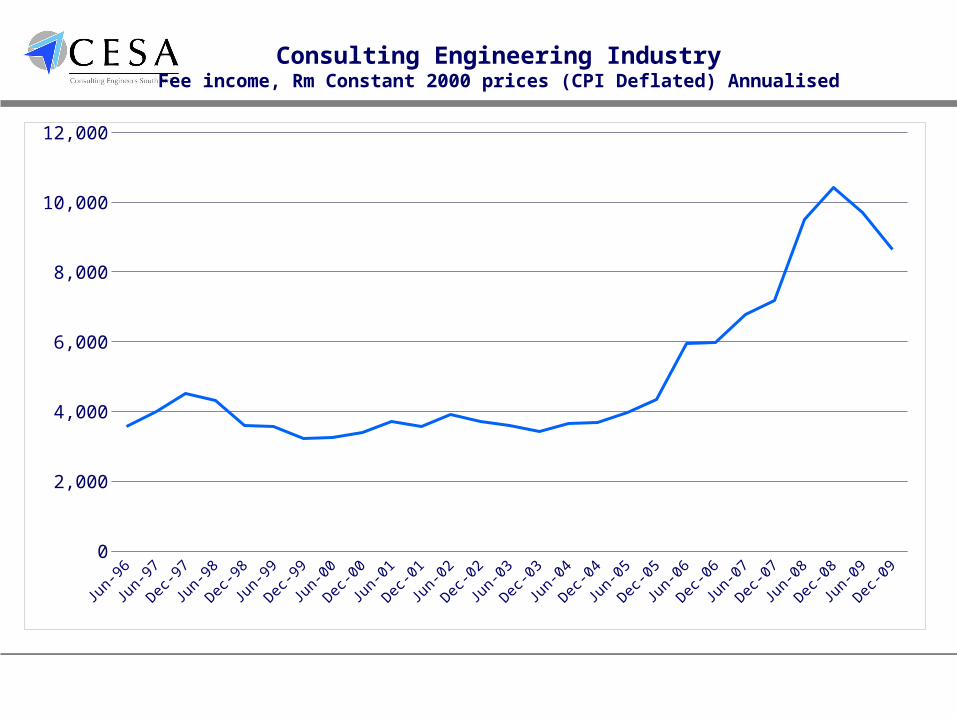
Consulting Engineering IndustryFee income, Rm Constant 2000 prices (CPI Deflated) Annualised
Jun-96 Jun-97 Jun-98 Jun-99 Jun-00 Jun-01 Jun-02 Jun-03 Jun-04 Jun-05 Jun-06 Jun-07 Jun-08 Jun-090
2,000
4,000
6,000
8,000
10,000
12,000
-30%
-20%
-10%
0%
10%
20%
30%
40%
50%
Survey period
PE
RC
EN
TA
GE
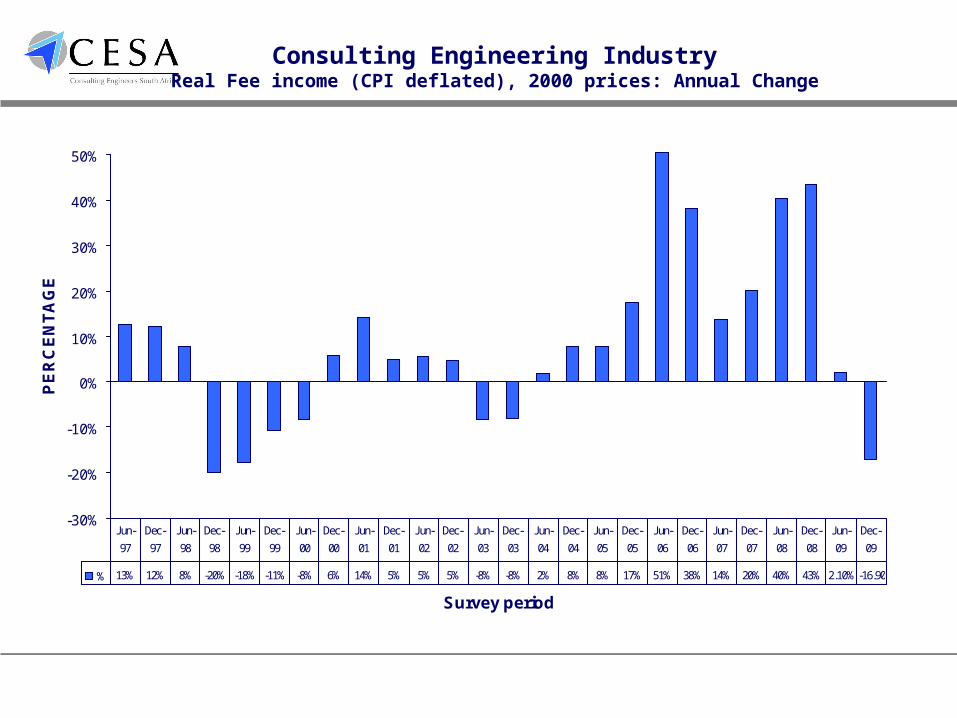
% 13% 12% 8% -20% -18% -11% -8% 6% 14% 5% 5% 5% -8% -8% 2% 8% 8% 17% 51% 38% 14% 20% 40% 43% 2.10% -16.90
Jun-
97
Dec-
97
Jun-
98
Dec-
98
Jun-
99
Dec-
99
Jun-
00
Dec-
00
Jun-
01
Dec-
01
Jun-
02
Dec-
02
Jun-
03
Dec-
03
Jun-
04
Dec-
04
Jun-
05
Dec-
05
Jun-
06
Dec-
06
Jun-
07
Dec-
07
Jun-
08
Dec-
08
Jun-
09
Dec-
09
Consulting Engineering IndustryReal Fee income (CPI deflated), 2000 prices: Annual Change
-60%
-40%
-20%
0%
20%
40%
60%
Jun
-95
Jun
-97
Jun
-98
Jun
-99
Jun
-00
Jun
-01
Jun
-02
Jun
-03
Jun
-04
Jun
-05
Jun
-06
Jun
-07
Jun
-08
Jun
-09
Jun
-09
% Change fro
m p
revio
us
surv
ey
-10
10
30
50
70
90
110
% R
esp
ondents
sati
sfied
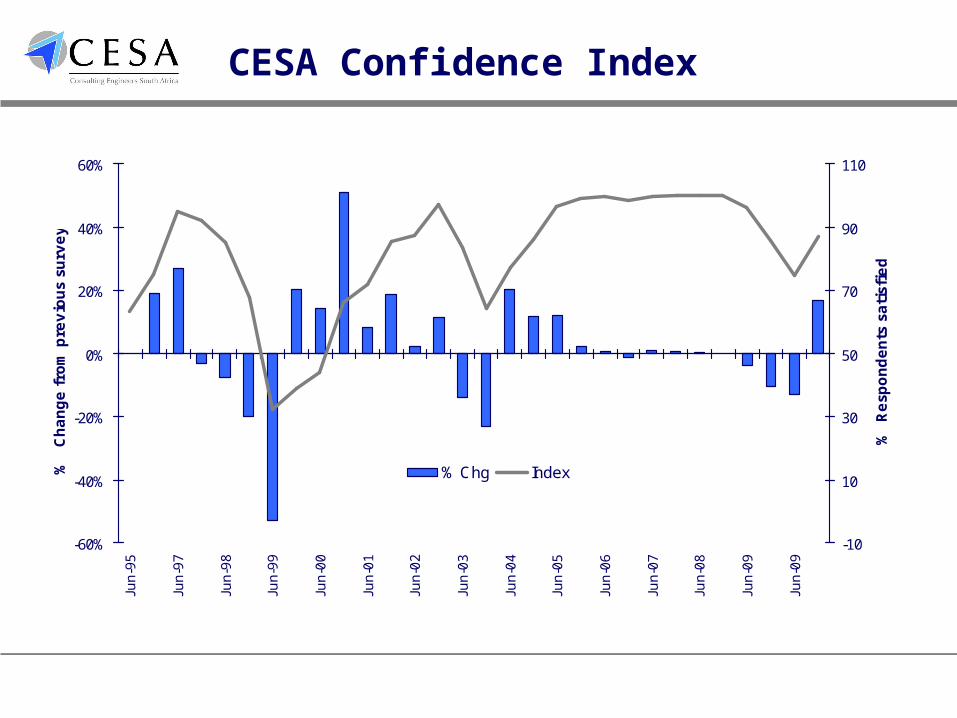
% Chg Index
CESA Confidence Index
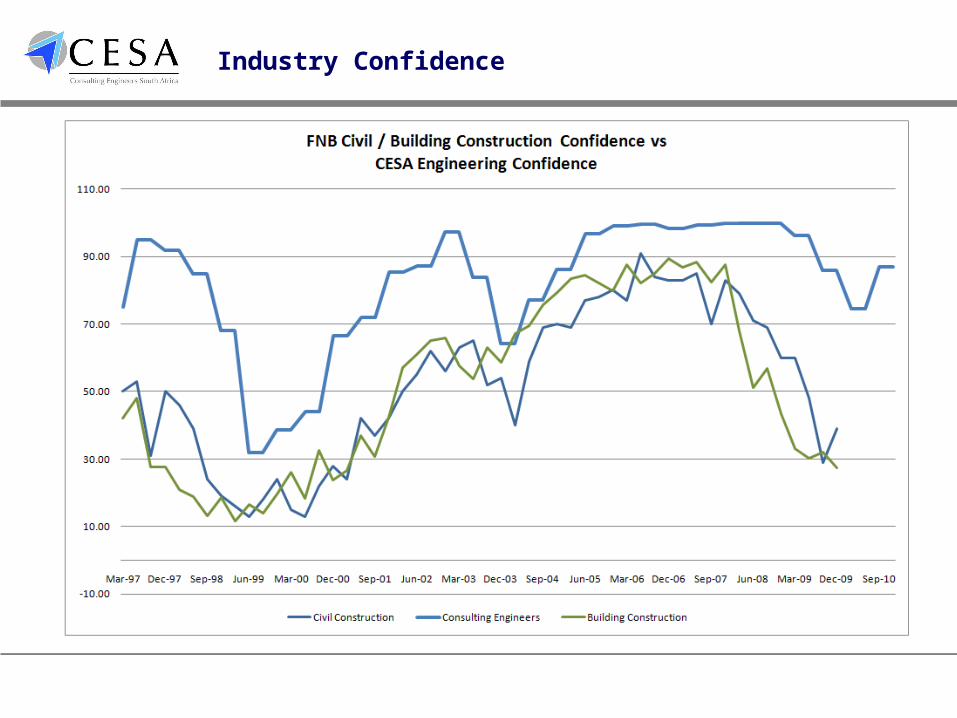
Industry Confidence
20
30
40
50
60
70
80
90
100
110
Jun-
96
Jun-
97
Jan-
98
Jun-
98
Jan-
99
Jun-
99
Jan-
00
Jun-
00
Dec
-00
Jun-
01
Dec
-01
Jun-
02
Dec
-02
Jun-
03
Dec
-03
Jun-
04
Dec
-04
Jun-
05
Dec
-05
Jun-
06
Dec
-06
Jun-
07
Dec
-07
Jun-
08
Dec
-08
Jun-
09
Dec
-09
Jun-
10
Dec
-10
CO
NF
IDE
NC
E IN
DE
X
0
2 000
4 000
6 000
8 000
10 000
12 000
Fee
inco
me
(con
stan
t pr
ices
)
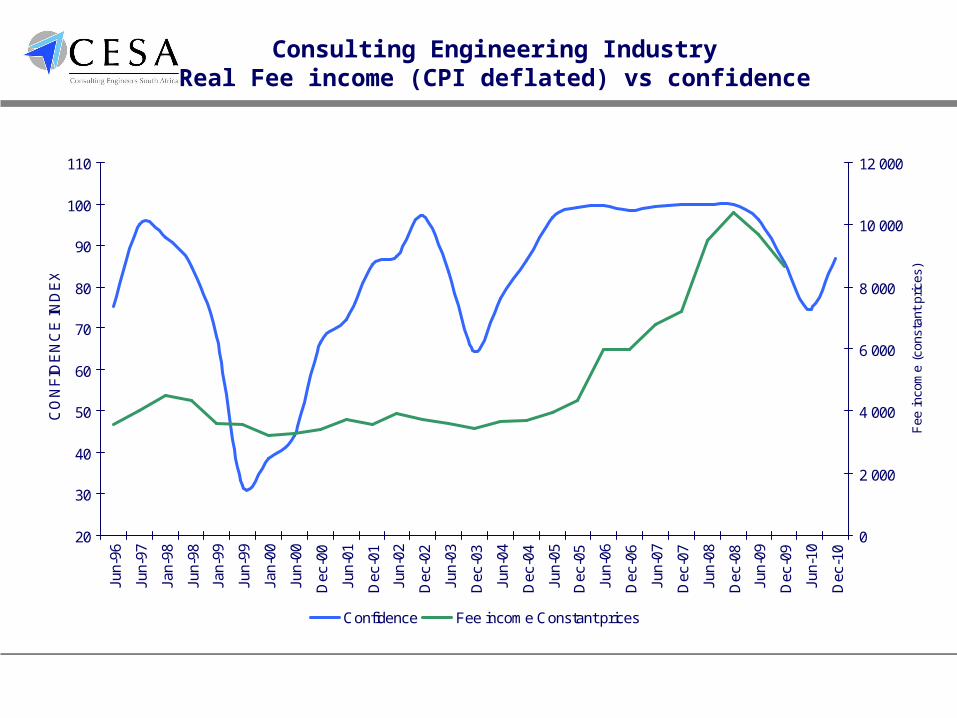
Confidence Fee income Constant prices
Consulting Engineering IndustryReal Fee income (CPI deflated) vs confidence
20
30
40
50
60
70
80
90
100
110
Jun-
96
Jun-
97
Jan-
98
Jun-
98
Jan-
99
Jun-
99
Jan-
00
Jun-
00
Dec
-00
Jun-
01
Dec
-01
Jun-
02
Dec
-02
Jun-
03
Dec
-03
Jun-
04
Dec
-04
Jun-
05
Dec
-05
Jun-
06
Dec
-06
Jun-
07
Dec
-07
Jun-
08
Dec
-08
Jun-
09
Dec
-09
Jun-
10
Dec
-10
CO
NF
IDE
NC
E I
ND
EX
2000
3000
4000
5000
6000
7000
8000
9000
10000
11000
12000
13000
14000
15000
16000
17000
18000
19000
20000
Fee
in
com
e, R
mil
l, c
urr
ent
pri
ces
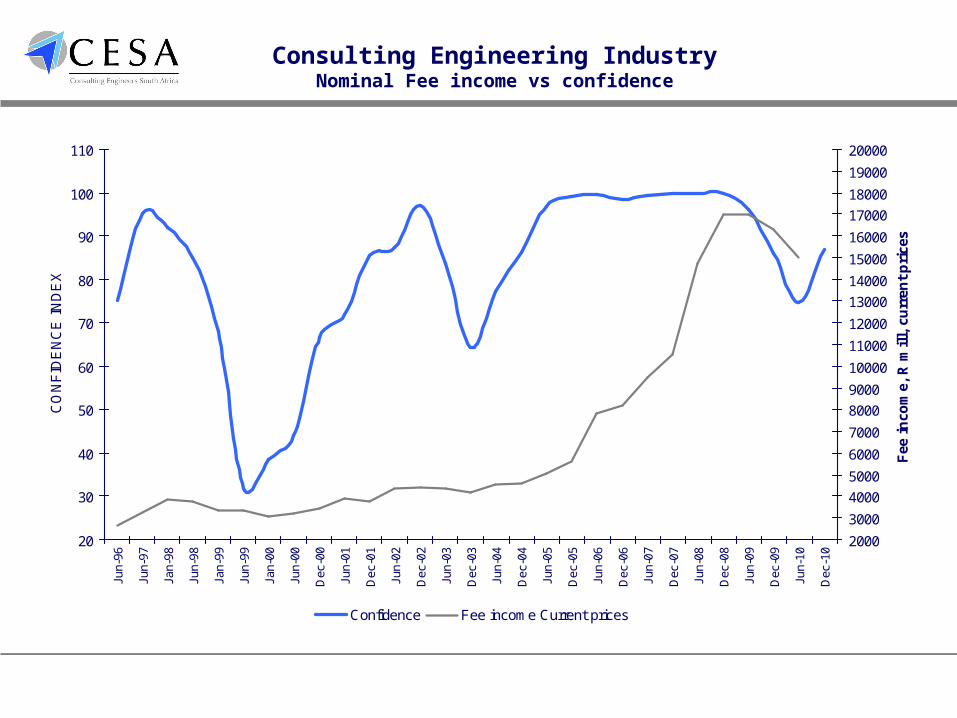
Confidence Fee income Current prices
Consulting Engineering IndustryNominal Fee income vs confidence
CESA Biannual Economic and Capacity Survey January – June 2009
-5%
0%
5%
10%
15%
20%
25%
30%
Jun-
98
Jan-
99
Jun-
99
Jan-
00
Jun-
00
Dec
-00
Jun-
01
Dec
-01
Jun-
02
Dec
-02
Jun-
03
Dec
-03
Jun-
04
Dec
-04
Jun-
05
Dec
-05
Jun-
06
Dec
-06
Jun-
07
Dec
-07
Jun-
08
Dec
-08
Jun-
09
Dec
-09
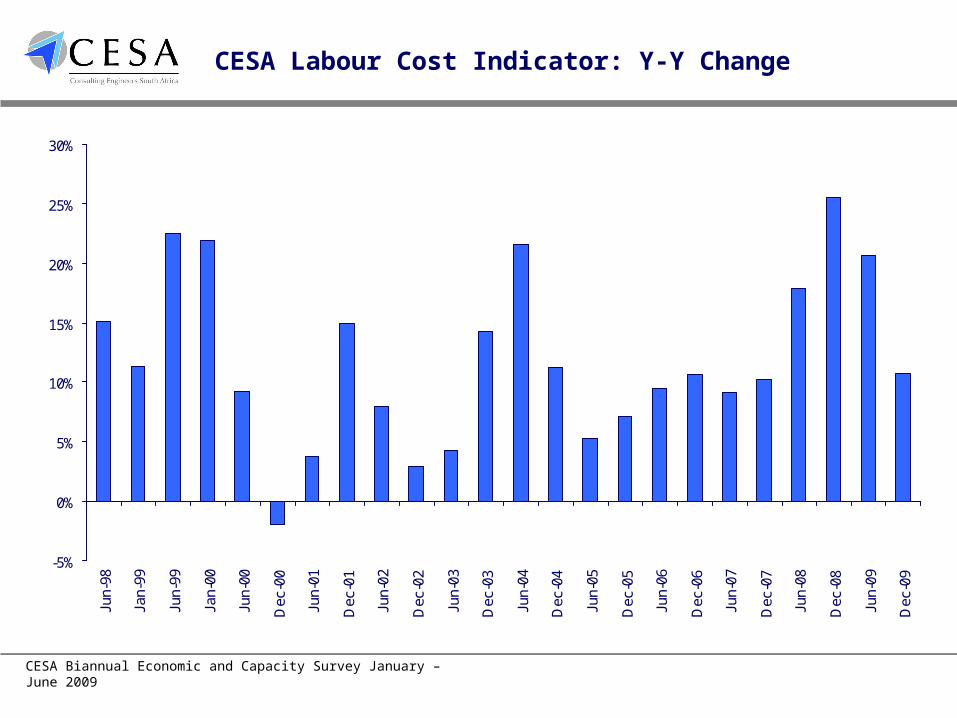
CESA Labour Cost Indicator: Y-Y Change
8 500
9 500
10 500
11 500
12 500
13 500
14 500
15 500
16 500
17 500
18 500
19 500
20 500
De
c-9
7
Jun
-98
De
c-9
8
Jun
-99
De
c-9
9
Jun
-00
De
c-0
0
Jun
-01
De
c-0
1
Jun
-02
De
c-0
2
Jun
-03
De
c-0
3
Jun
-04
De
c-0
4
Jun
-05
De
c-0
5
Jun
-06
De
c-0
6
Jun
-07
De
c-0
7
Jun
-08
De
c-0
8
Jun
-09
De
c-0
9
Em
ploy
men
t
2 000
3 000
4 000
5 000
6 000
7 000
8 000
9 000
10 000
11 000
Fee
inco
me
(con
stan
t pr
ices
)
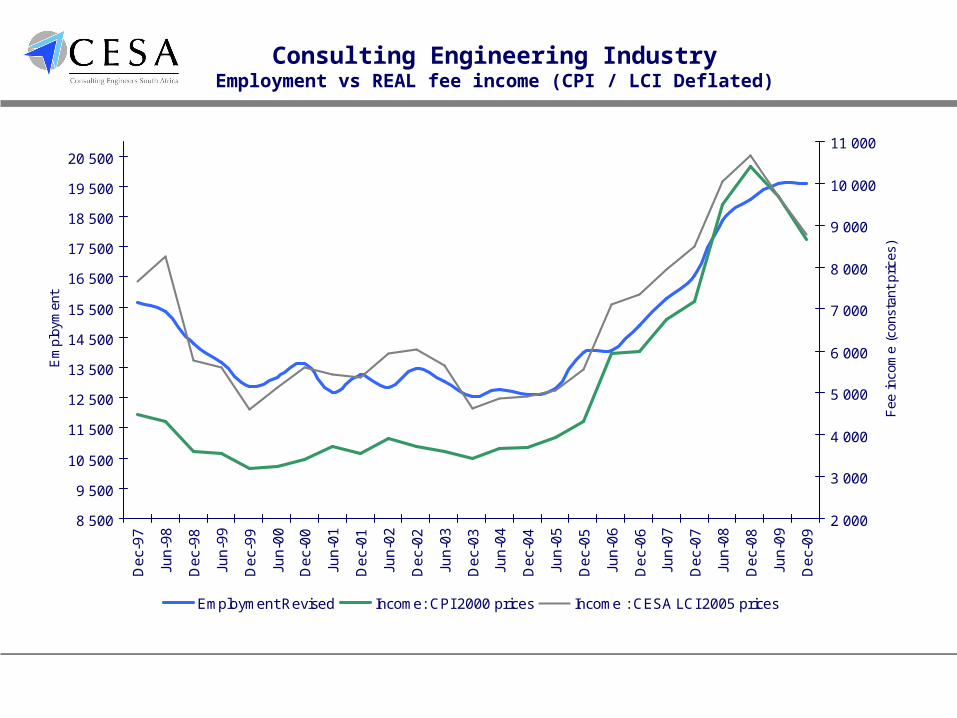
Employment Revised Income: CPI 2000 prices Income : CESA LCI 2005 prices
Consulting Engineering IndustryEmployment vs REAL fee income (CPI / LCI Deflated)
9 500
10 500
11 500
12 500
13 500
14 500
15 500
16 500
17 500
18 500
19 500
20 500
Dec
-97
Jun-
98
Dec
-98
Jun-
99
Dec
-99
Jun-
00
Dec
-00
Jun-
01
Dec
-01
Jun-
02
Dec
-02
Jun-
03
Dec
-03
Jun-
04
Dec
-04
Jun-
05
Dec
-05
Jun-
06
Dec
-06
Jun-
07
Dec
-07
Jun-
08
Dec
-08
Jun-
09
Dec
-09
Em
plo
yme
nt
0
300
600
900
1 200
1 500
1 800
2 100
2 400
2 700
3 000
3 300
3 600
3 900
4 200
4 500
4 800
5 100
5 400
Sa
lary
/Wa
ge
s (
R m
ill, 2
00
0 p
ric
es
)
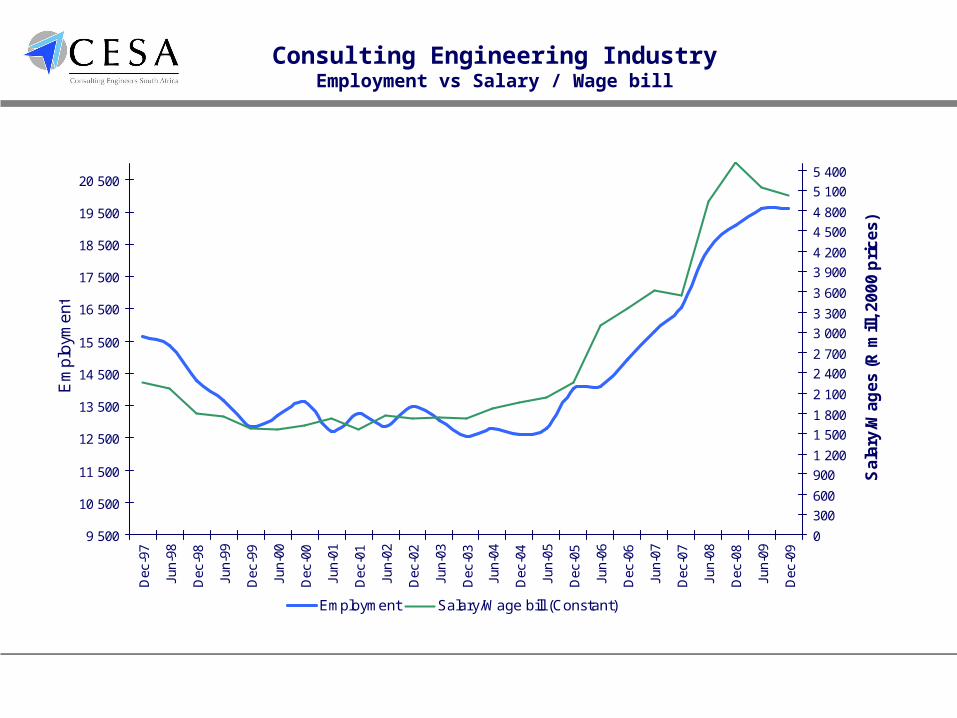
Employment Salary/Wage bill (Constant)
Consulting Engineering IndustryEmployment vs Salary / Wage bill
CESA Biannual Economic and Capacity Survey January – June 2009
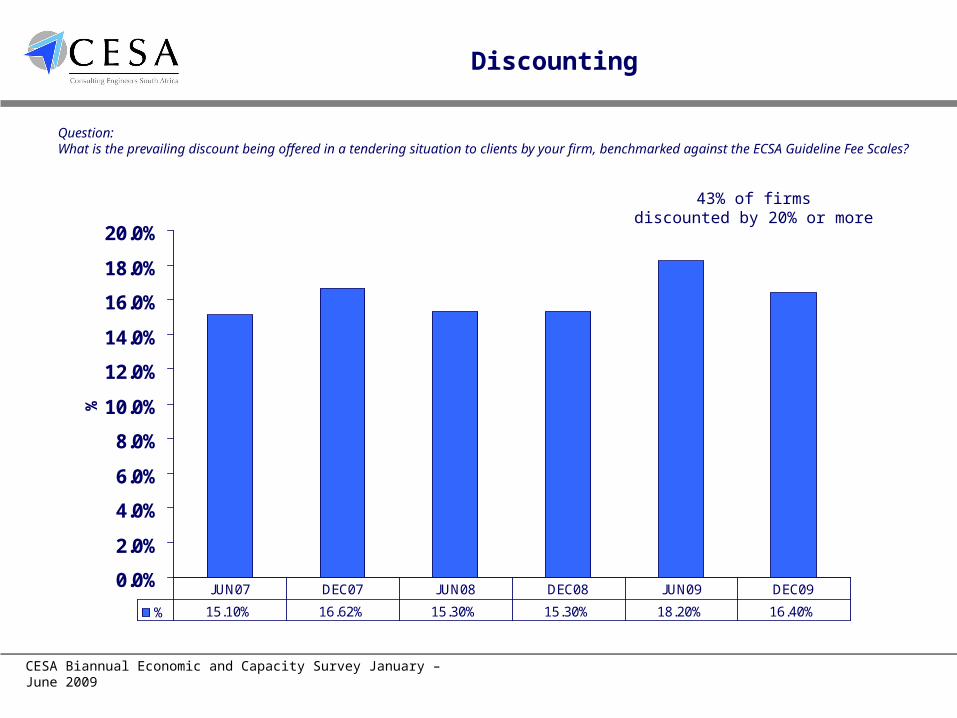
Discounting
0.0%
2.0%
4.0%
6.0%
8.0%
10.0%
12.0%
14.0%
16.0%
18.0%
20.0%
%
% 15.10% 16.62% 15.30% 15.30% 18.20% 16.40%
JUN07 DEC07 JUN08 DEC08 JUN09 DEC09
Question: What is the prevailing discount being offered in a tendering situation to clients by your firm, benchmarked against the ECSA Guideline Fee Scales?
43% of firmsdiscounted by 20% or more
CESA Biannual Economic and Capacity Survey January – June 2009
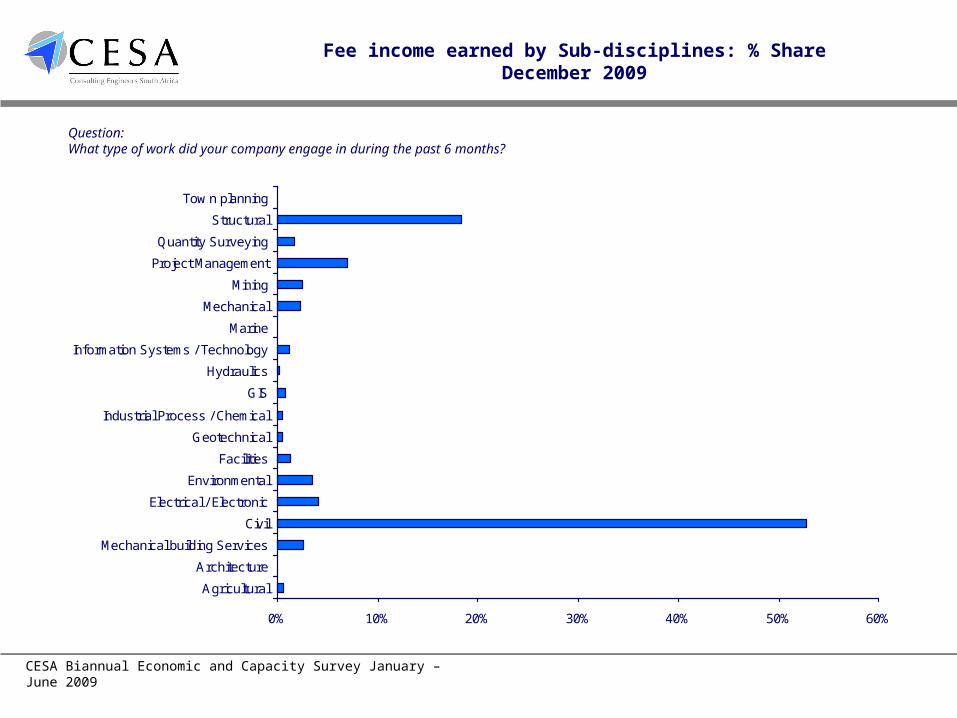
Fee income earned by Sub-disciplines: % ShareDecember 2009
0% 10% 20% 30% 40% 50% 60%
Agricultural
Architecture
Mechanical building Services
Civil
Electrical / Electronic
Environmental
Facilities
Geotechnical
Industrial Process / Chemical
GIS
Hydraulics
Information Systems / Technology
Marine
Mechanical
Mining
Project Management
Quantity Surveying
Structural
Tow n planning
Question: What type of work did your company engage in during the past 6 months?
CESA Biannual Economic and Capacity Survey January – June 2009
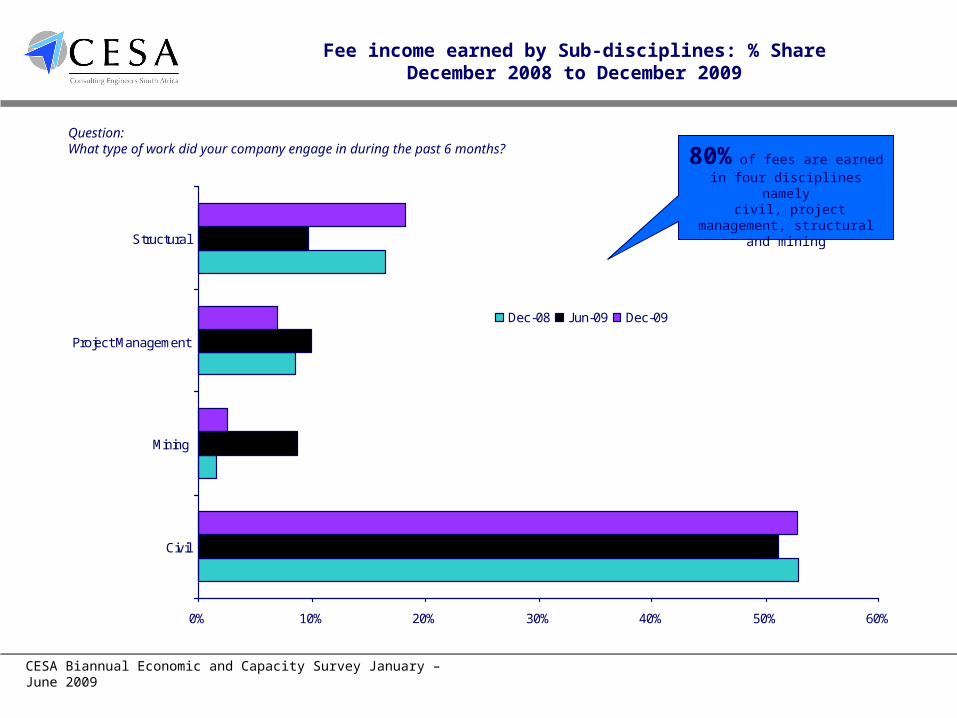
Fee income earned by Sub-disciplines: % ShareDecember 2008 to December 2009
0% 10% 20% 30% 40% 50% 60%
Civil
Mining
Project Management
Structural
Dec-08 Jun-09 Dec-09
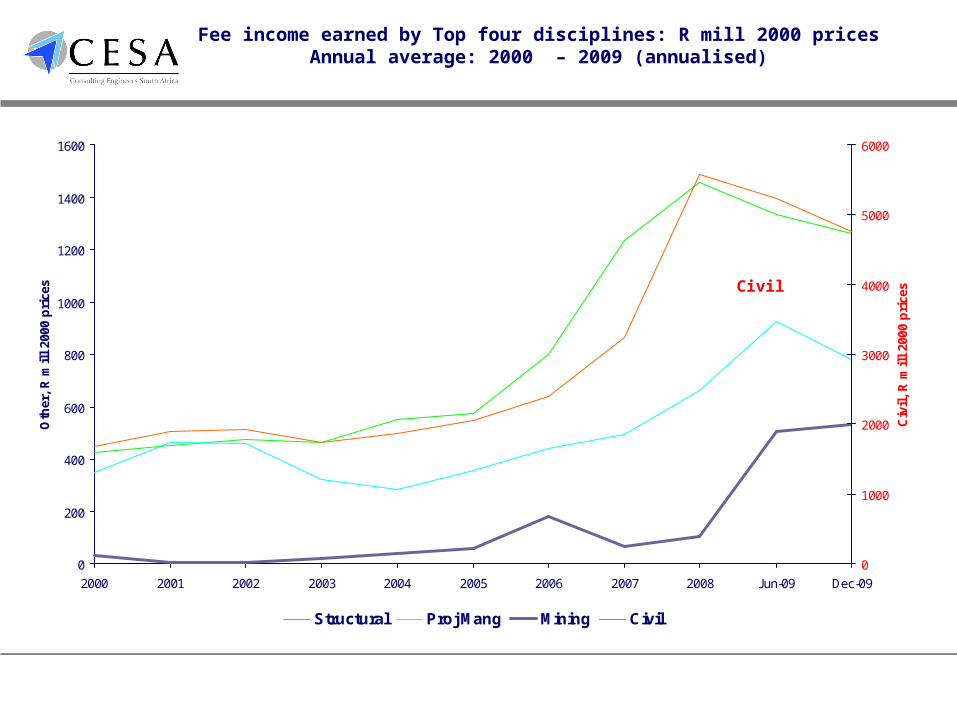
Question: What type of work did your company engage in during the past 6 months? 80% of fees are earned in four
disciplines namely civil, project management,
structural and mining
CESA Biannual Economic and Capacity Survey January – June 2009
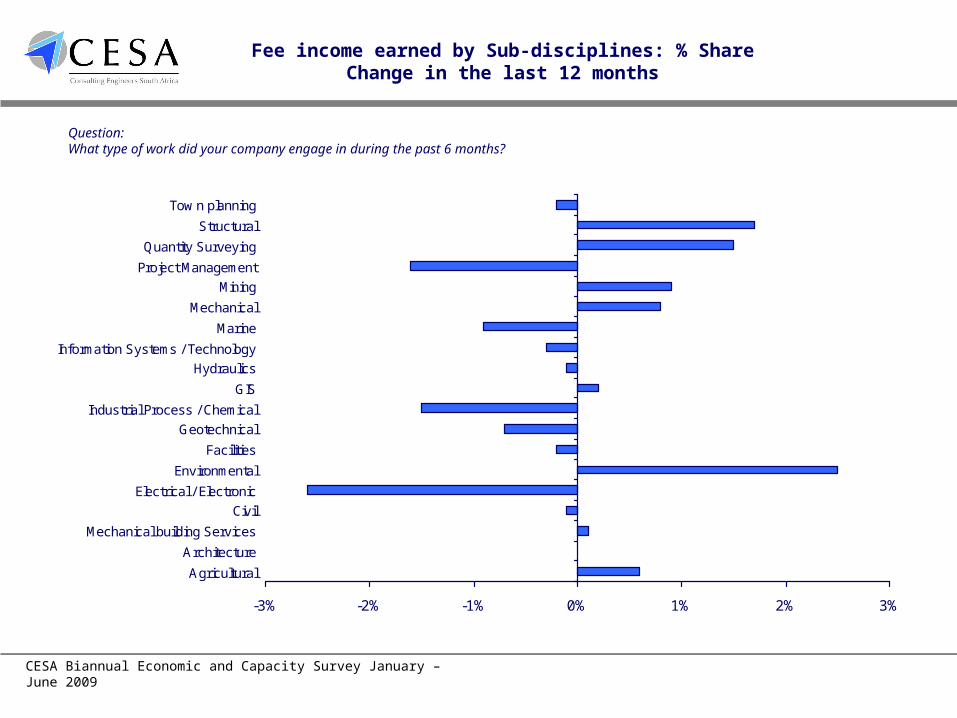
Fee income earned by Sub-disciplines: % ShareChange in the last 12 months
-3% -2% -1% 0% 1% 2% 3%
Agricultural
Architecture
Mechanical building Services
Civil
Electrical / Electronic
Environmental
Facilities
Geotechnical
Industrial Process / Chemical
GIS
Hydraulics
Information Systems / Technology
Marine
Mechanical
Mining
Project Management
Quantity Surveying
Structural
Tow n planning
Question: What type of work did your company engage in during the past 6 months?
0
200
400
600
800
1000
1200
1400
1600
2000 2001 2002 2003 2004 2005 2006 2007 2008 Jun-09 Dec-09
Oth
er,
R m
ill
2000
pri
ces
0
1000
2000
3000
4000
5000
6000
Civ
il,
R m
ill
2000
pri
ces
Structural Proj Mang Mining Civil
Fee income earned by Top four disciplines: R mill 2000 pricesAnnual average: 2000 – 2009 (annualised)
Civil

0.00%
5.00%
10.00%
15.00%
20.00%
25.00%
30.00%
35.00%
40.00%
45.00%
Wat
er
Tra
nspo
rtat
ion
Ene
rgy
Min
ing/
Qua
rryi
ng
Edu
catio
n
Hea
lth
Tou
rism
Hou
sing
Com
mer
cial
Agr
icul
ture
Oth
er
Per
cen
tag
e sh
are
Jun-08 Dec-08 Jun-09 Dec-09
Fee income earned by economic sectorPercentage market share June 2008 – December 2009
Section A General Questions: Question: Income distribution per economic sector
0
500
1000
1500
2000
2500
3000
3500
4000
4500
Jun-05 Dec-05 Jun-06 Dec-06 Jun-07 Dec-07 Jun-08 Dec-08 Jun-09 Dec-09
Oth
er,
R m
ill
2000
pri
ces
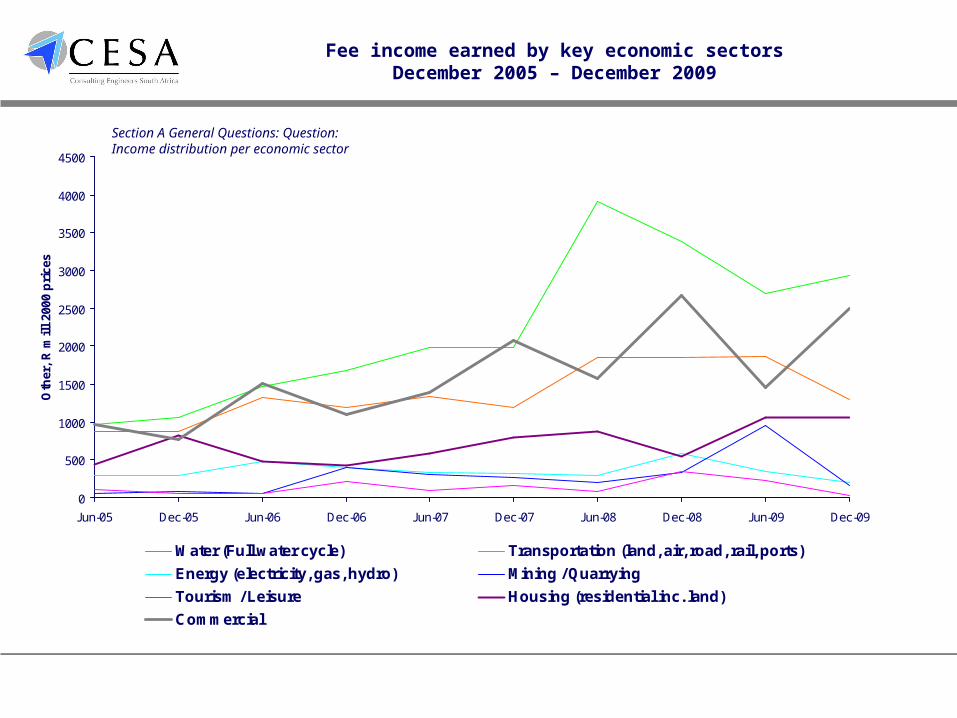
Water (Full water cycle) Transportation (land, air, road, rail, ports)
Energy (electricity, gas, hydro) Mining / Quarrying
Tourism / Leisure Housing (residential inc. land)
Commercial
Fee income earned by key economic sectorsDecember 2005 – December 2009
Section A General Questions: Question: Income distribution per economic sector
CESA Biannual Economic and Capacity Survey January – June 2009
0
5
10
15
20
25
30
35
% S
ha
re (
ba
r)
-10
-8
-6
-4
-2
0
2
4
6
% Share Change last 12 months
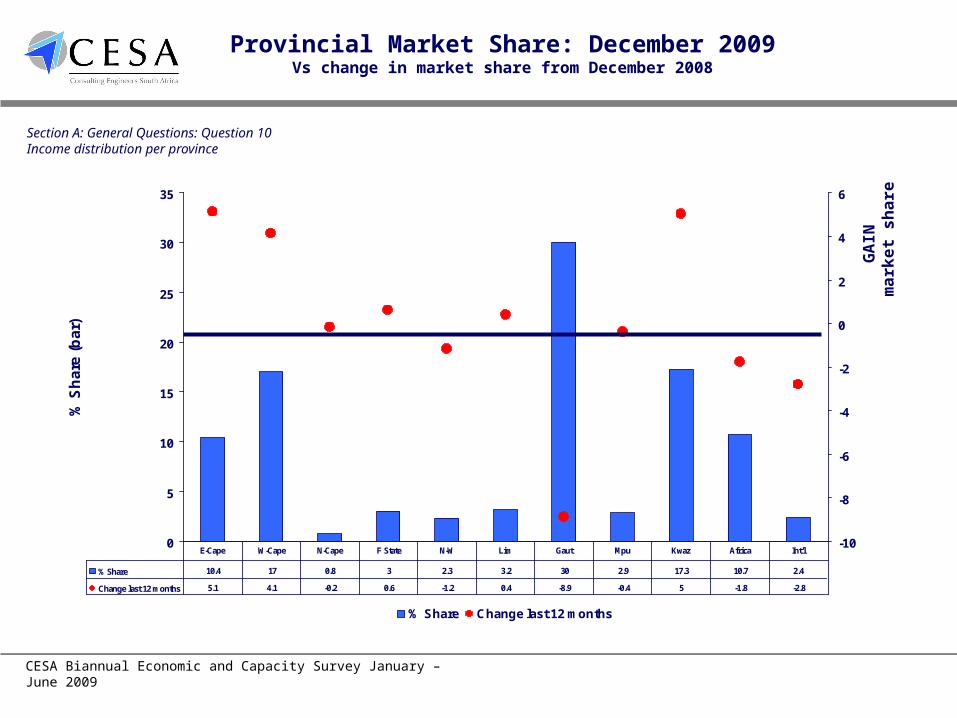
% Share 10.4 17 0.8 3 2.3 3.2 30 2.9 17.3 10.7 2.4
Change last 12 months 5.1 4.1 -0.2 0.6 -1.2 0.4 -8.9 -0.4 5 -1.8 -2.8
E-Cape W-Cape N-Cape F State N-W Lim Gaut Mpu Kwaz Africa Int'l
Provincial Market Share: December 2009Vs change in market share from December 2008
GA
IN
mark
et
sh
are
Section A: General Questions: Question 10Income distribution per province
CESA Biannual Economic and Capacity Survey January – June 2009
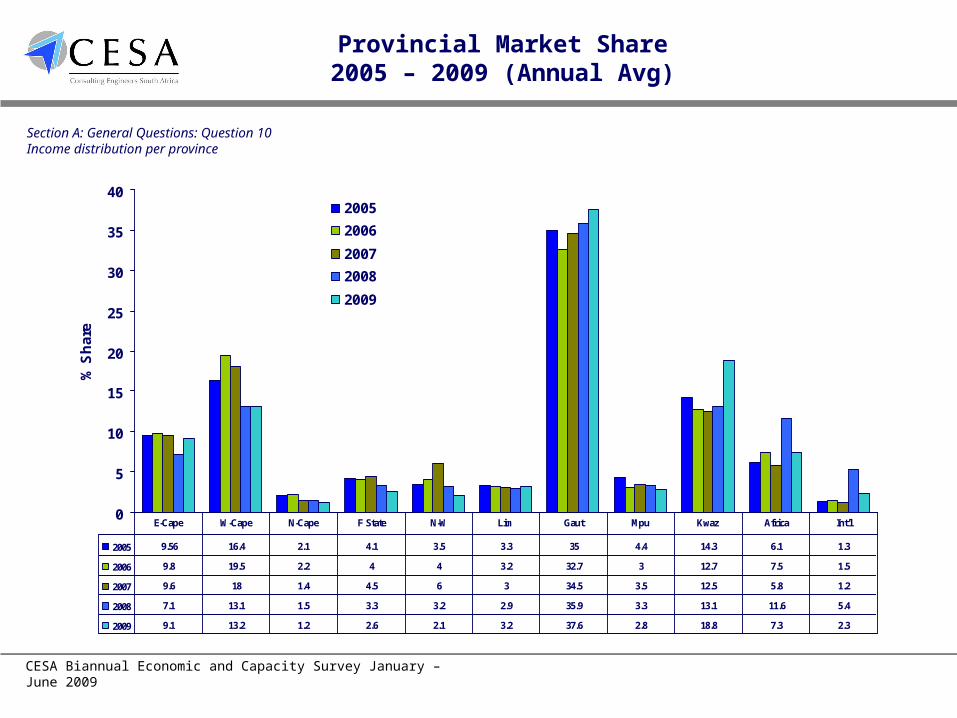
0
5
10
15
20
25
30
35
40
% S
ha
re
2005
2006
2007
2008
2009
2005 9.56 16.4 2.1 4.1 3.5 3.3 35 4.4 14.3 6.1 1.3
2006 9.8 19.5 2.2 4 4 3.2 32.7 3 12.7 7.5 1.5
2007 9.6 18 1.4 4.5 6 3 34.5 3.5 12.5 5.8 1.2
2008 7.1 13.1 1.5 3.3 3.2 2.9 35.9 3.3 13.1 11.6 5.4
2009 9.1 13.2 1.2 2.6 2.1 3.2 37.6 2.8 18.8 7.3 2.3
E-Cape W-Cape N-Cape F State N-W Lim Gaut Mpu Kwaz Africa Int'l
Provincial Market Share2005 – 2009 (Annual Avg)
Section A: General Questions: Question 10Income distribution per province
0
500
1000
1500
2000
2500
3000
3500
4000
4500
R m
ill,
Co
nst
ant
2000
pri
ces
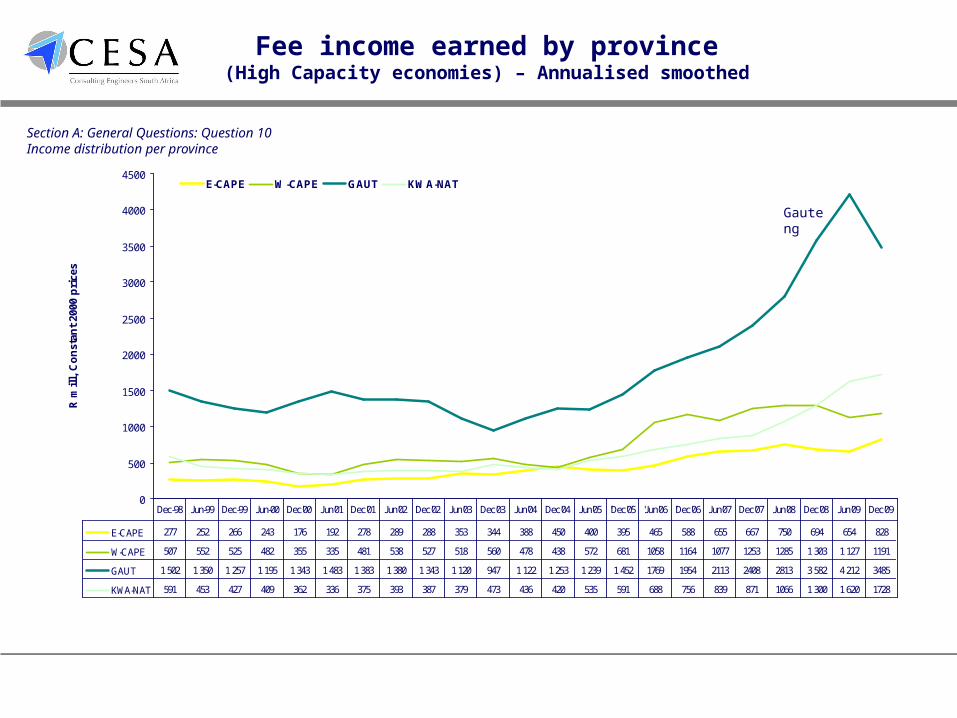
E-CAPE W-CAPE GAUT KWA-NAT
E-CAPE 277 252 266 243 176 192 278 289 288 353 344 388 450 400 395 465 588 655 667 750 694 654 828
W-CAPE 507 552 525 482 355 335 481 538 527 518 560 478 438 572 681 1058 1164 1077 1253 1285 1 303 1 127 1191
GAUT 1 502 1 350 1 257 1 195 1 343 1 483 1 383 1 380 1 343 1 120 947 1 122 1 253 1 239 1 452 1769 1954 2113 2408 2813 3 582 4 212 3485
KWA-NAT 591 453 427 409 362 336 375 393 387 379 473 436 420 535 591 688 756 839 871 1066 1 300 1 620 1728
Dec-98 Jun-99 Dec-99 Jun-00 Dec'00 Jun'01 Dec'01 Jun'02 Dec'02 Jun'03 Dec'03 Jun'04 Dec'04 Jun'05 'Dec'05 'Jun'06 'Dec'06 Jun'07 Dec'07 Jun'08 Dec'08 Jun'09 Dec'09
Fee income earned by province(High Capacity economies) – Annualised smoothed
Gauteng
Section A: General Questions: Question 10Income distribution per province
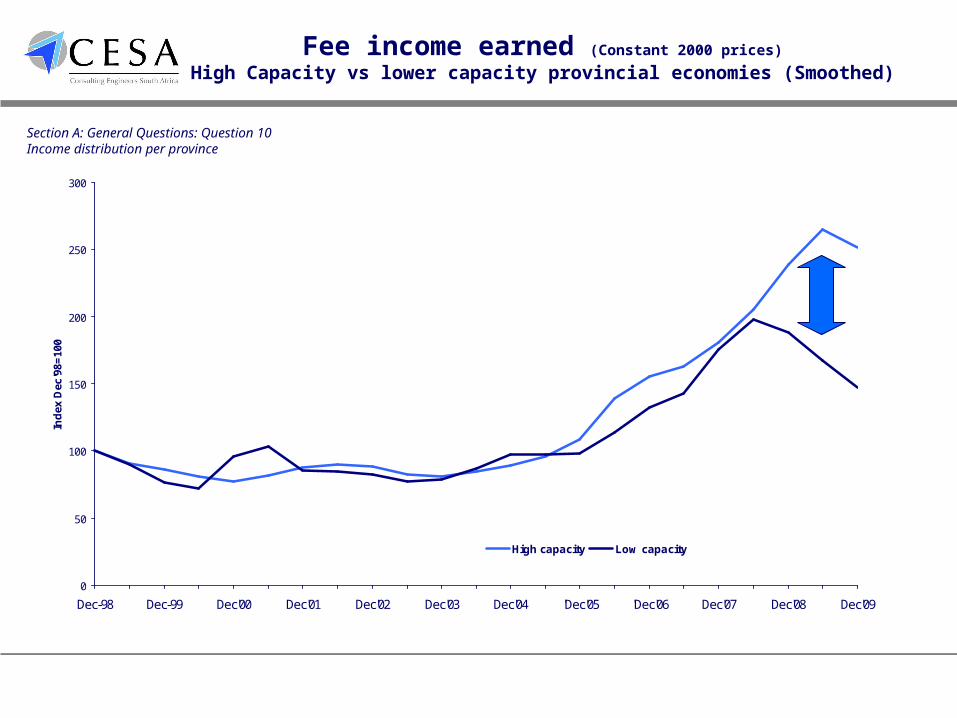
0
50
100
150
200
250
300
Dec-98 Dec-99 Dec'00 Dec'01 Dec'02 Dec'03 Dec'04 'Dec'05 'Dec'06 Dec'07 Dec'08 Dec'09
Ind
ex D
ec'9
8=10
0
High capacity Low capacity
Fee income earned (Constant 2000 prices)
High Capacity vs lower capacity provincial economies (Smoothed)
Section A: General Questions: Question 10Income distribution per province
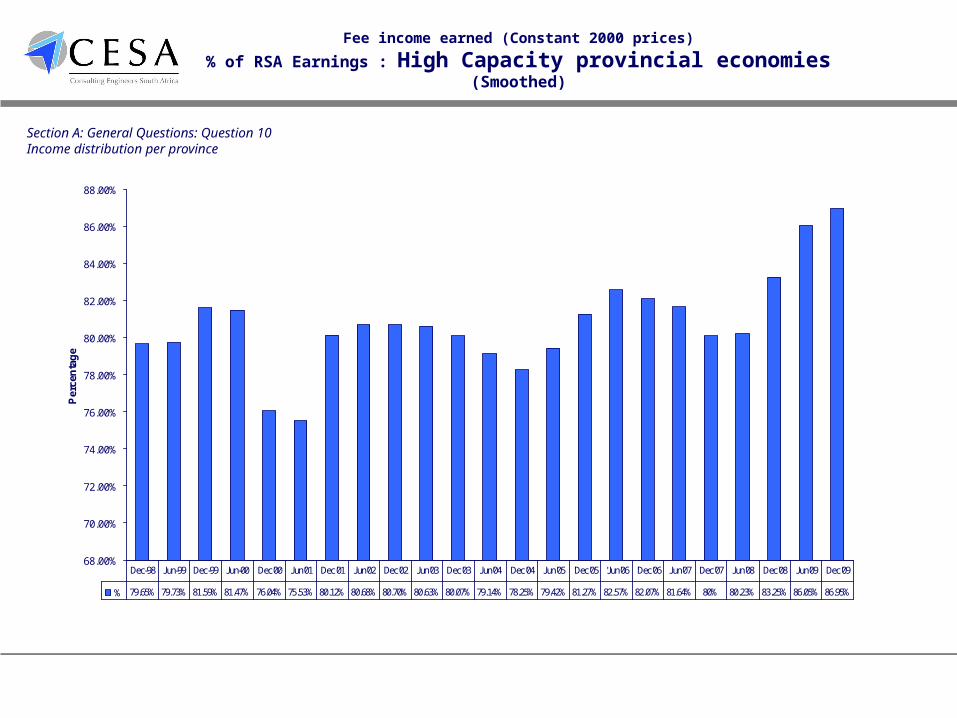
68.00%
70.00%
72.00%
74.00%
76.00%
78.00%
80.00%
82.00%
84.00%
86.00%
88.00%
Per
cen
tag
e
% 79.65% 79.73% 81.59% 81.47% 76.04% 75.53% 80.12% 80.68% 80.70% 80.63% 80.07% 79.14% 78.25% 79.42% 81.27% 82.57% 82.07% 81.64% 80% 80.23% 83.25% 86.05% 86.95%
Dec-98 Jun-99 Dec-99 Jun-00 Dec'00 Jun'01 Dec'01 Jun'02 Dec'02 Jun'03 Dec'03 Jun'04 Dec'04 Jun'05 'Dec'05 'Jun'06 'Dec'06 Jun'07 Dec'07 Jun'08 Dec'08 Jun'09 Dec'09
Fee income earned (Constant 2000 prices)
% of RSA Earnings : High Capacity provincial economies (Smoothed)
Section A: General Questions: Question 10Income distribution per province
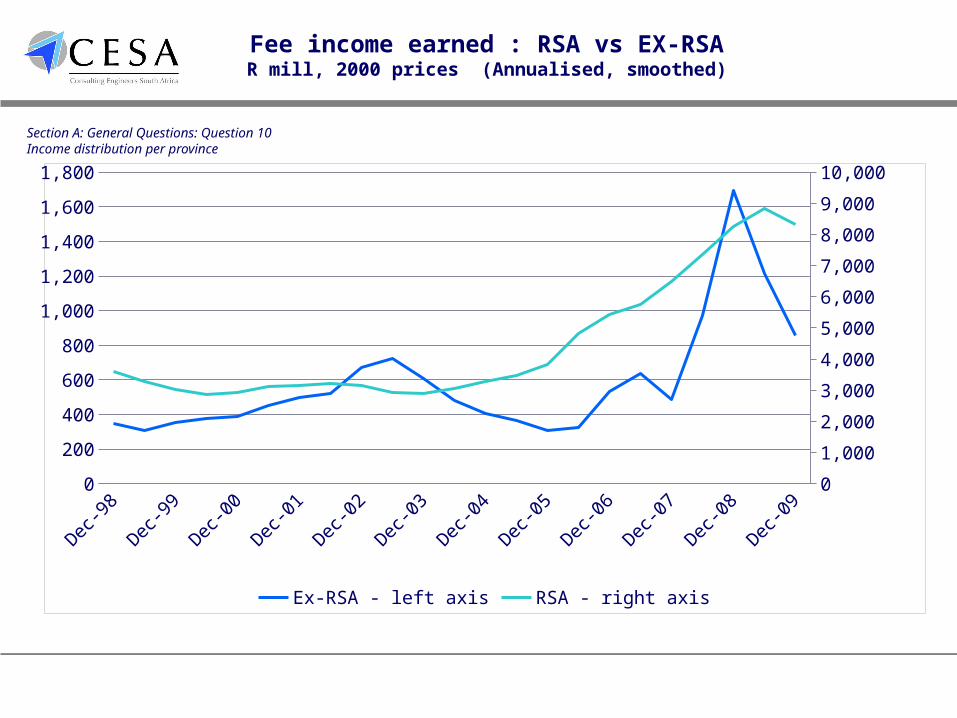
Fee income earned : RSA vs EX-RSAR mill, 2000 prices (Annualised, smoothed)
Section A: General Questions: Question 10Income distribution per province
Dec-9
8
Jun-
99
Dec-9
9
Jun-
00
Dec-0
0
Jun-
01
Dec-0
1
Jun-
02
Dec-0
2
Jun-
03
Dec-0
3
Jun-
04
Dec-0
4
Jun-
05
Dec-0
5
Jun-
06
Dec-0
6
Jun-
07
Dec-0
7
Jun-
08
Dec-0
8
Jun-
09
Dec-0
90
200
400
600
800
1,000
1,200
1,400
1,600
1,800
0
1,000
2,000
3,000
4,000
5,000
6,000
7,000
8,000
9,000
10,000
Ex-RSA - left axis RSA - right axis
CESA Biannual Economic and Capacity Survey January – June 2009
0
10
20
30
40
50
60
% S
ha
re
Jun-07
Dec-07
Jun-08
Dec-08
Jun-09
Dec-09
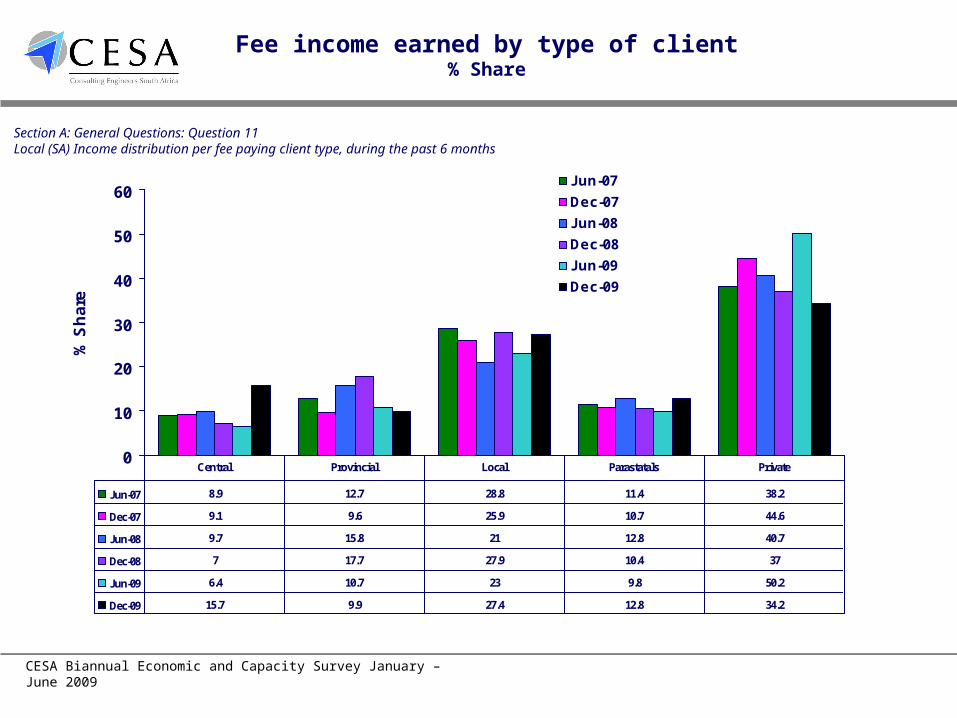
Jun-07 8.9 12.7 28.8 11.4 38.2
Dec-07 9.1 9.6 25.9 10.7 44.6
Jun-08 9.7 15.8 21 12.8 40.7
Dec-08 7 17.7 27.9 10.4 37
Jun-09 6.4 10.7 23 9.8 50.2
Dec-09 15.7 9.9 27.4 12.8 34.2
Central Provincial Local Parastatals Private
Fee income earned by type of client% Share
Section A: General Questions: Question 11Local (SA) Income distribution per fee paying client type, during the past 6 months
CESA Biannual Economic and Capacity Survey January – June 2009
0
500
1000
1500
2000
2500
3000
3500
4000
4500
5000
DE
C98
JUN
99
DE
C99
JUN
00
DE
C00
JUN
01
DE
C01
JUN
02
DE
C02
JUN
03
DE
C03
JUN
04
DE
C04
JUN
05
DE
C05
JUN
06
DE
C06
JUN
07
DE
C07
JUN
08
DE
C08
JUN
09
DE
C09
R m
ill, C
on
sta
nt
20
00
pri
ce
s
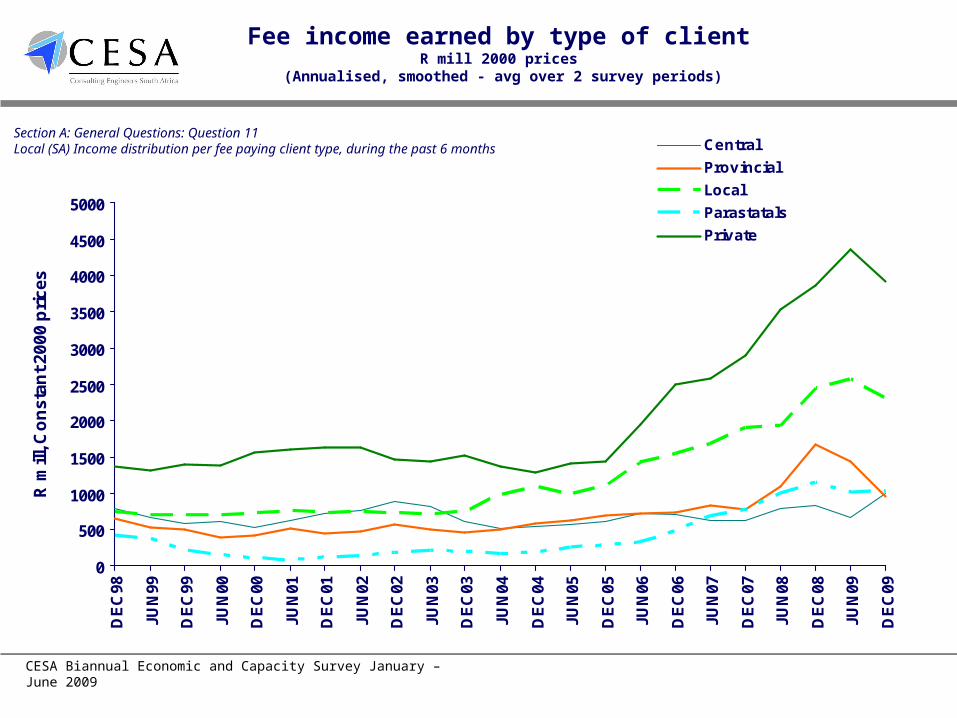
Central
Provincial
Local
Parastatals
Private
Fee income earned by type of clientR mill 2000 prices
(Annualised, smoothed - avg over 2 survey periods)
Section A: General Questions: Question 11Local (SA) Income distribution per fee paying client type, during the past 6 months
CESA Biannual Economic and Capacity Survey January – June 2009
0
1 000
2 000
3 000
4 000
5 000
6 000
7 000
Rm
, 20
00
pri
ce
s
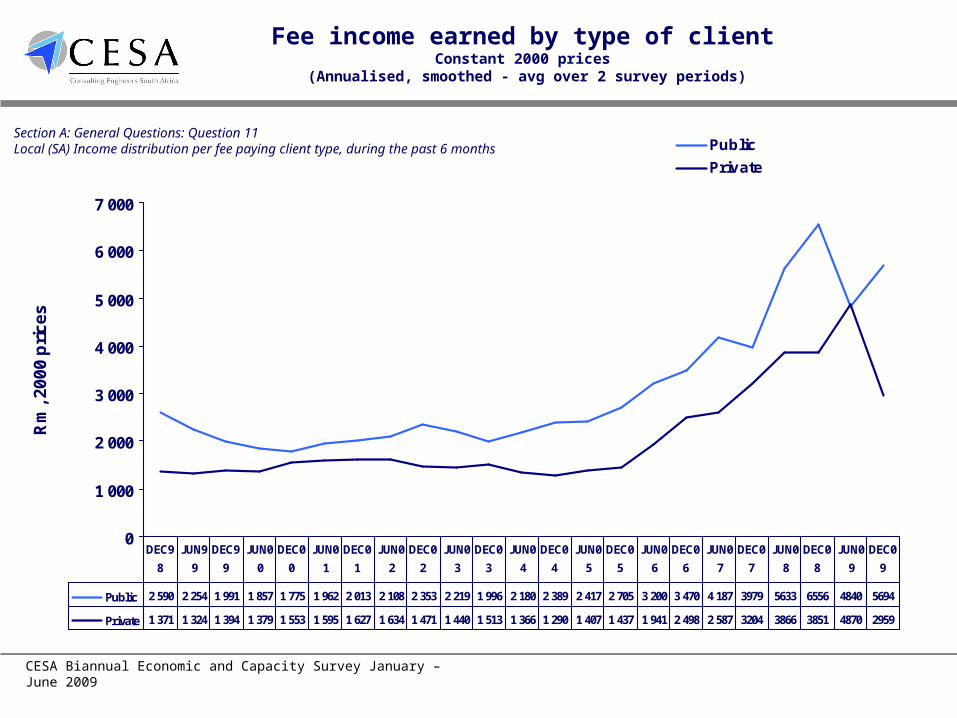
Public
Private
Public 2 590 2 254 1 991 1 857 1 775 1 962 2 013 2 108 2 353 2 219 1 996 2 180 2 389 2 417 2 705 3 200 3 470 4 187 3979 5633 6556 4840 5694
Private 1 371 1 324 1 394 1 379 1 553 1 595 1 627 1 634 1 471 1 440 1 513 1 366 1 290 1 407 1 437 1 941 2 498 2 587 3204 3866 3851 4870 2959
DEC9
8
JUN9
9
DEC9
9
JUN0
0
DEC0
0
JUN0
1
DEC0
1
JUN0
2
DEC0
2
JUN0
3
DEC0
3
JUN0
4
DEC0
4
JUN0
5
DEC0
5
JUN0
6
DEC0
6
JUN0
7
DEC0
7
JUN0
8
DEC0
8
JUN0
9
DEC0
9
Fee income earned by type of clientConstant 2000 prices
(Annualised, smoothed - avg over 2 survey periods)
Section A: General Questions: Question 11Local (SA) Income distribution per fee paying client type, during the past 6 months
CESA Biannual Economic and Capacity Survey January – June 2009
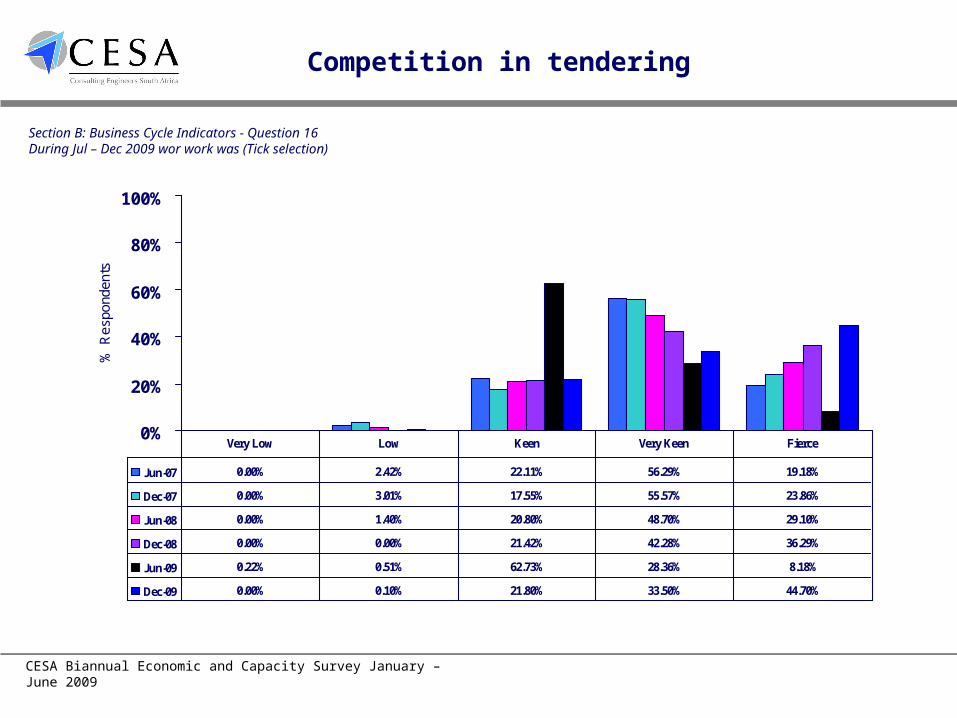
Competition in tendering
0%
20%
40%
60%
80%
100%
% R
espo
nden
ts
Jun-07 0.00% 2.42% 22.11% 56.29% 19.18%
Dec-07 0.00% 3.01% 17.55% 55.57% 23.86%
Jun-08 0.00% 1.40% 20.80% 48.70% 29.10%
Dec-08 0.00% 0.00% 21.42% 42.28% 36.29%
Jun-09 0.22% 0.51% 62.73% 28.36% 8.18%
Dec-09 0.00% 0.10% 21.80% 33.50% 44.70%
Very Low Low Keen Very Keen Fierce
Section B: Business Cycle Indicators - Question 16During Jul – Dec 2009 wor work was (Tick selection)
CESA Biannual Economic and Capacity Survey January – June 2009
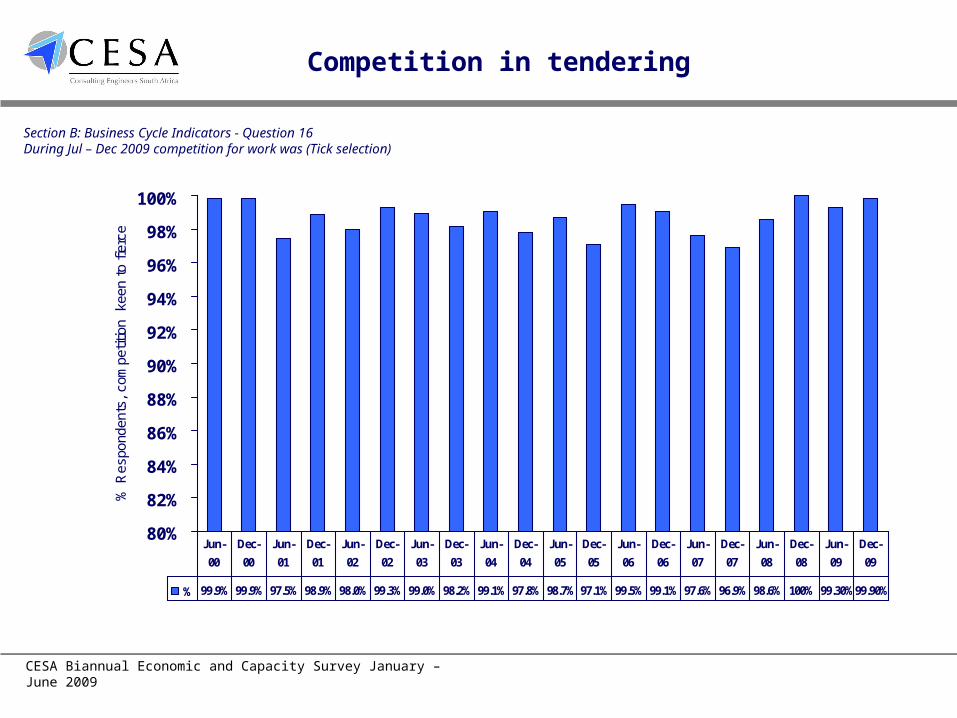
Competition in tendering
80%
82%
84%
86%
88%
90%
92%
94%
96%
98%
100%
% R
espo
nden
ts,
com
petit
ion
kee
n to
fie
rce
% 99.9% 99.9% 97.5% 98.9% 98.0% 99.3% 99.0% 98.2% 99.1% 97.8% 98.7% 97.1% 99.5% 99.1% 97.6% 96.9% 98.6% 100% 99.30%99.90%
Jun-
00
Dec-
00
Jun-
01
Dec-
01
Jun-
02
Dec-
02
Jun-
03
Dec-
03
Jun-
04
Dec-
04
Jun-
05
Dec-
05
Jun-
06
Dec-
06
Jun-
07
Dec-
07
Jun-
08
Dec-
08
Jun-
09
Dec-
09
Section B: Business Cycle Indicators - Question 16During Jul – Dec 2009 competition for work was (Tick selection)
CESA Biannual Economic and Capacity Survey January – June 2009
0
10
20
30
40
50
60
70
80
90
100
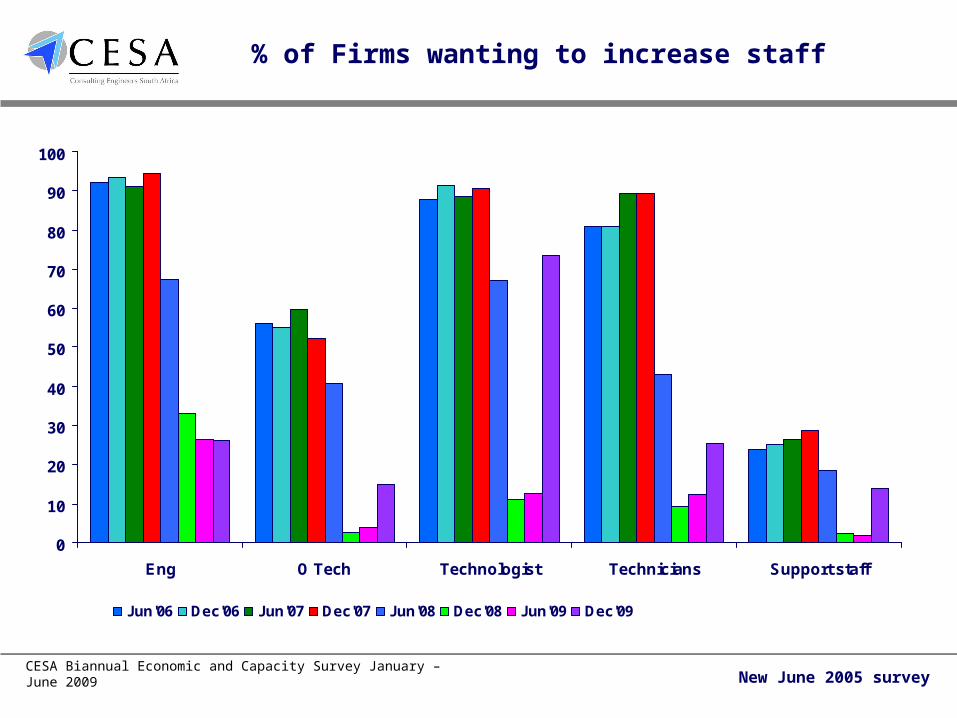
Eng O Tech Technologist Technicians Support staff
Jun'06 Dec'06 Jun'07 Dec'07 Jun'08 Dec'08 Jun'09 Dec'09
% of Firms wanting to increase staff
New June 2005 survey
CESA Biannual Economic and Capacity Survey January – June 2009
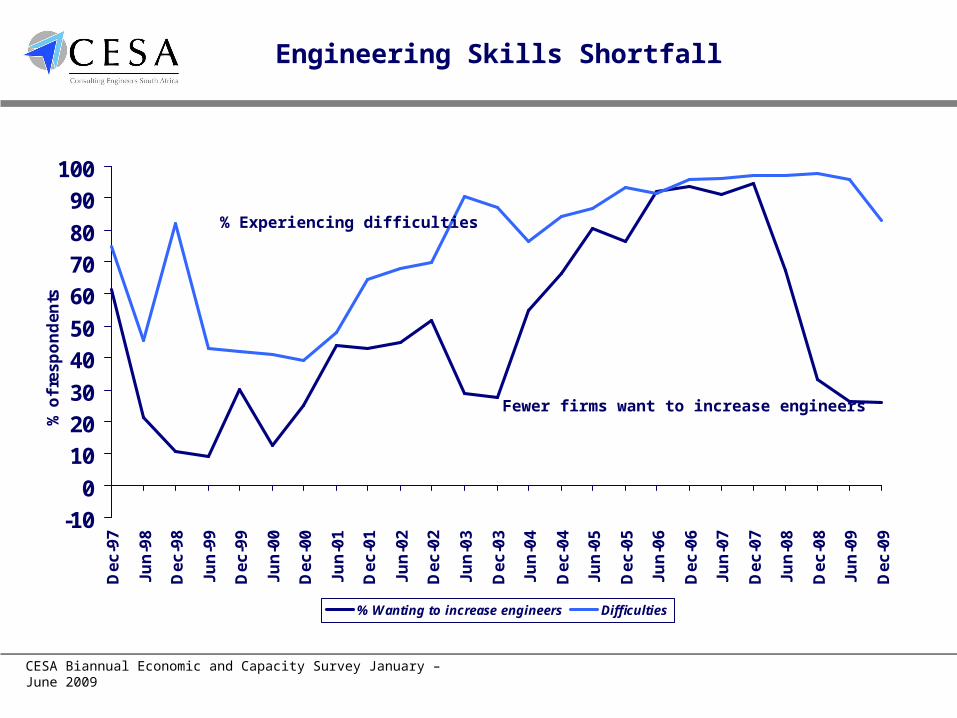
Engineering Skills Shortfall
-10
0
10
20
30
40
50
60
70
80
90
100
De
c-9
7
Ju
n-9
8
De
c-9
8
Ju
n-9
9
De
c-9
9
Ju
n-0
0
De
c-0
0
Ju
n-0
1
De
c-0
1
Ju
n-0
2
De
c-0
2
Ju
n-0
3
De
c-0
3
Ju
n-0
4
De
c-0
4
Ju
n-0
5
De
c-0
5
Ju
n-0
6
De
c-0
6
Ju
n-0
7
De
c-0
7
Ju
n-0
8
De
c-0
8
Ju
n-0
9
De
c-0
9
% o
f re
sp
on
de
nts
% Wanting to increase engineers Difficulties
Fewer firms want to increase engineers
% Experiencing difficulties
CESA Biannual Economic and Capacity Survey January – June 2009
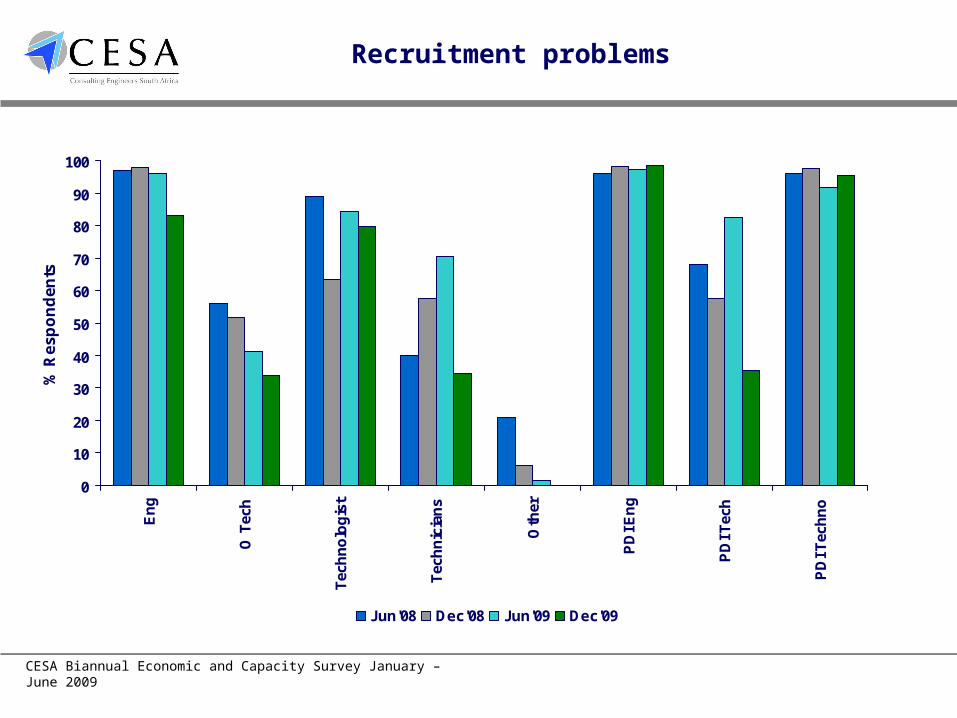
0
10
20
30
40
50
60
70
80
90
100E
ng
O T
ech
Tec
hn
olo
gis
t
Tec
hn
icia
ns
Oth
er
PD
I En
g
PD
I Tec
h
PD
I Tec
hn
o
% R
es
po
nd
en
ts
Jun'08 Dec'08 Jun'09 Dec'09
Recruitment problems
CESA Biannual Economic and Capacity Survey January – June 2009
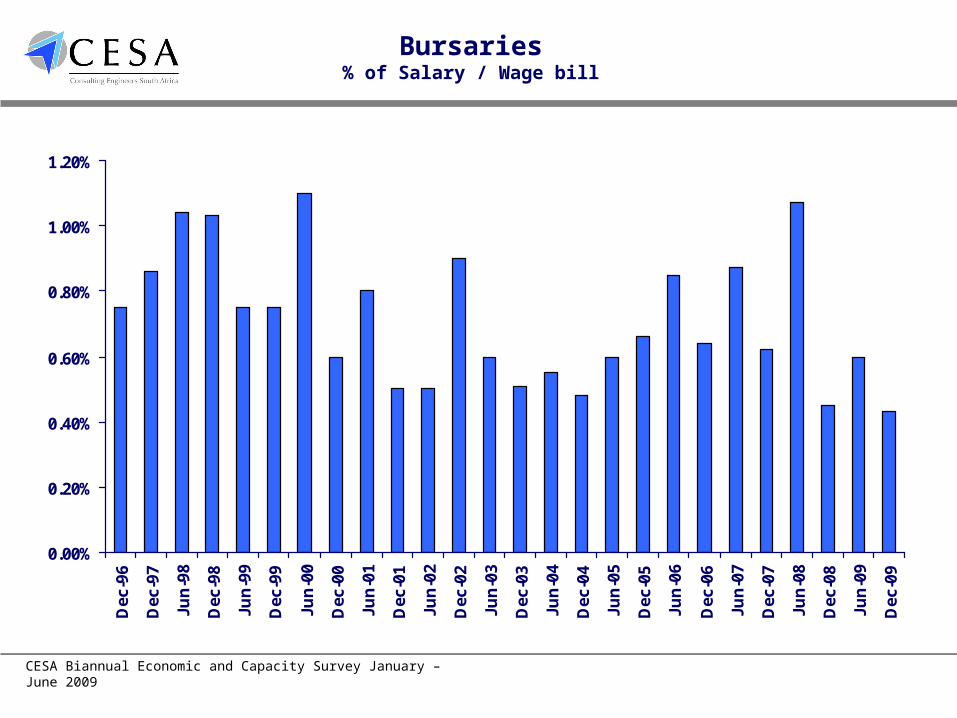
Bursaries% of Salary / Wage bill
0.00%
0.20%
0.40%
0.60%
0.80%
1.00%
1.20%
Dec
-96
Dec
-97
Jun
-98
Dec
-98
Jun
-99
Dec
-99
Jun
-00
Dec
-00
Jun
-01
Dec
-01
Jun
-02
Dec
-02
Jun
-03
Dec
-03
Jun
-04
Dec
-04
Jun
-05
Dec
-05
Jun
-06
Dec
-06
Jun
-07
Dec
-07
Jun
-08
Dec
-08
Jun
-09
Dec
-09
CESA Biannual Economic and Capacity Survey January – June 2009
0
10
20
30
40
50
60
70
80
90
Dec
-96
Jun
-98
Jun
-99
Jun
-00
Jun
-01
Jun
-02
Jun
-03
Jun
-04
Jun
-05
Jun
-06
Jun
-07
Jun
-08
Jun
-09
R m
ill, 2
000
pri
ces
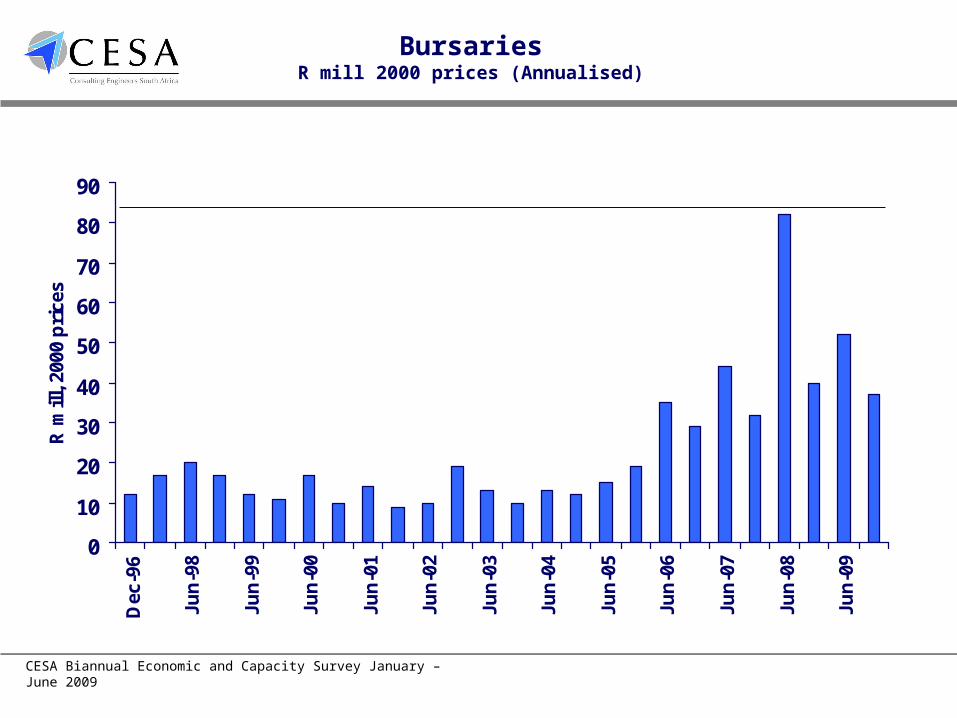
BursariesR mill 2000 prices (Annualised)
CESA Biannual Economic and Capacity Survey January – June 2009
0.00%
5.00%
10.00%
15.00%
20.00%
25.00%
30.00%
35.00%
40.00%
Jun
e 20
05
Dec
emb
er20
06
Jun
-06
Dec
-06
Jun
-07
Dec
-07
Jun
-08
Dec
-08
Jun
-09
Dec
-09
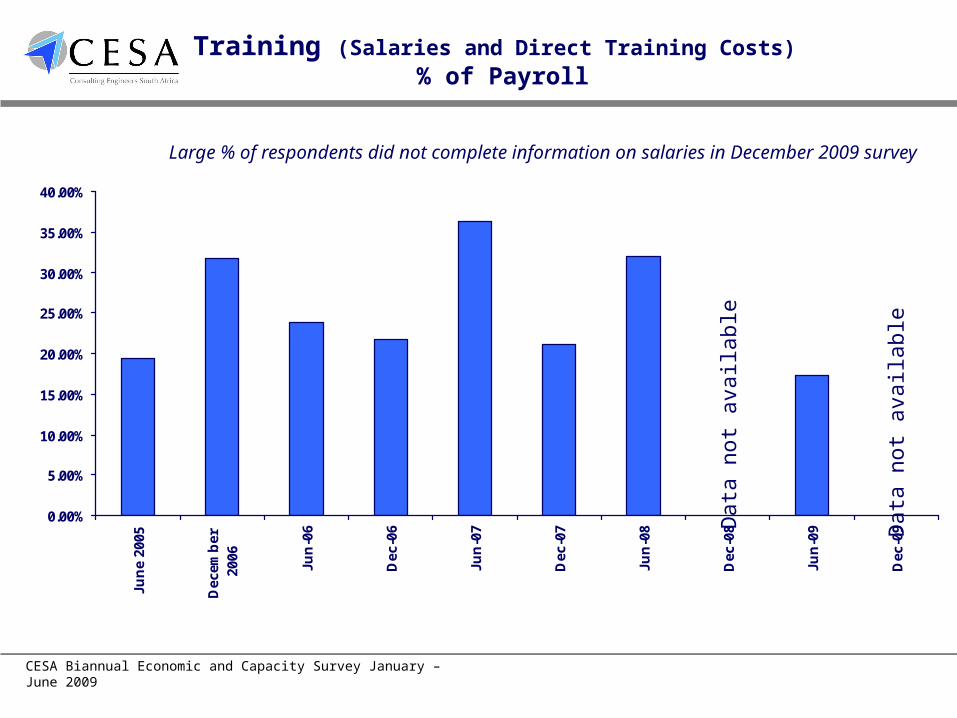
Training (Salaries and Direct Training Costs) % of Payroll
Dat
a no
t ava
ilab
le
Large % of respondents did not complete information on salaries in December 2009 survey
Dat
a no
t ava
ilab
le
CESA Biannual Economic and Capacity Survey January – June 2009
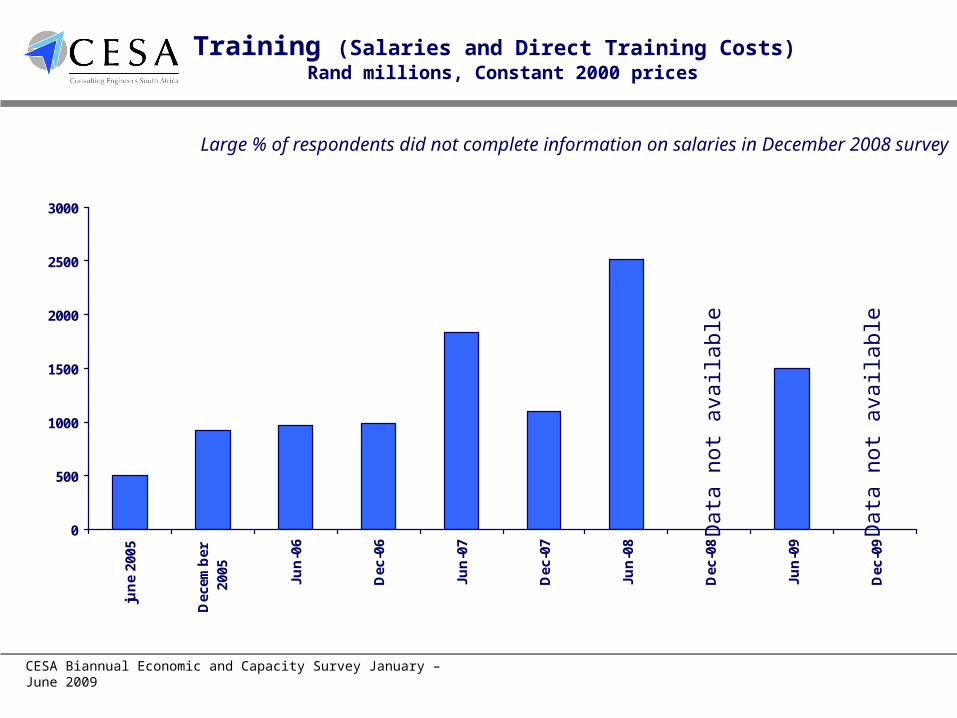
0
500
1000
1500
2000
2500
3000
jun
e 20
05
Dec
emb
er20
05
Jun
-06
Dec
-06
Jun
-07
Dec
-07
Jun
-08
Dec
-08
Jun
-09
Dec
-09
Training (Salaries and Direct Training Costs) Rand millions, Constant 2000 prices
Dat
a no
t ava
ilab
le
Large % of respondents did not complete information on salaries in December 2008 survey
Dat
a no
t ava
ilab
le
CESA Biannual Economic and Capacity Survey January – June 2009
0.00%
0.50%
1.00%
1.50%
2.00%
2.50%
3.00%
3.50%D
ec
-97
Ju
n-9
8
De
c-9
8
Ju
n-9
9
De
c-9
9
Ju
n-0
0
De
c-0
0
Ju
n-0
1
De
c-0
1
Ju
n-0
2
De
c-0
2
Ju
n-0
3
De
c-0
3
Ju
n-0
4
De
c-0
4
Ju
n-0
5
De
c-0
5
Ju
n-0
6
De
c-0
6
Ju
n-0
7
De
c-0
7
Ju
n-0
8
De
c-0
8
Ju
n-0
9
De
c-0
9
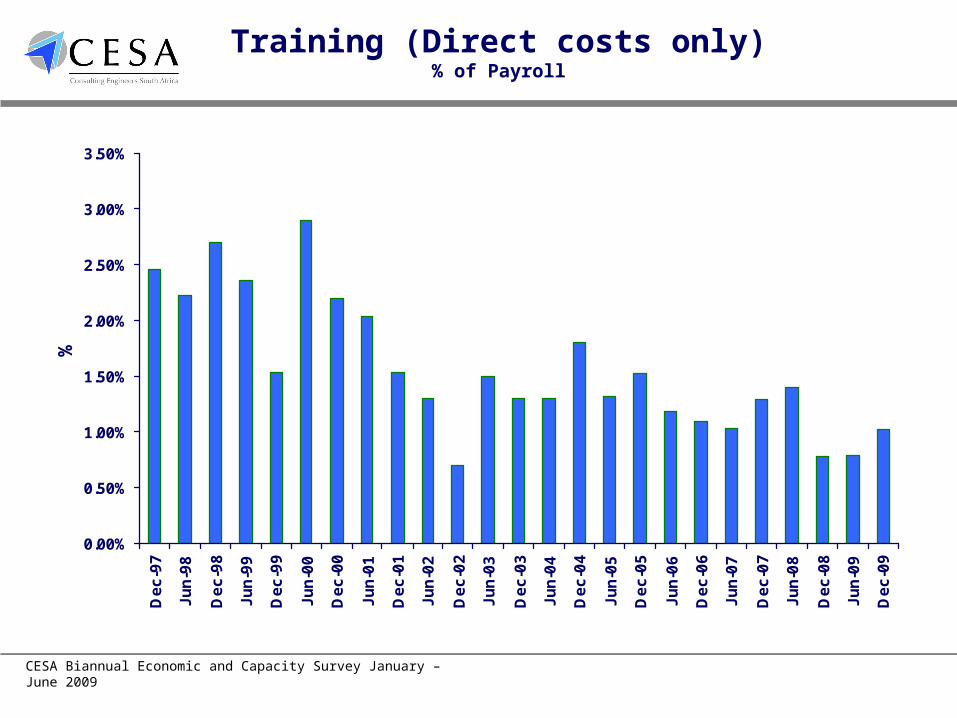
%Training (Direct costs only)
% of Payroll
CESA Biannual Economic and Capacity Survey January – June 2009
0
10
20
30
40
50
60
70
80
90
100D
ec-9
7
Jun
-98
Dec
-98
Jun
-99
Dec
-99
Jun
-00
Dec
-00
Jun
-01
Dec
-01
Jun
-02
Dec
-02
Jun
-03
Dec
-03
Jun
-04
Dec
-04
Jun
-05
Dec
-05
Jun
-06
Dec
-06
Jun
-07
Dec
-07
Jun
-08
Dec
-08
Jun
-09
Dec
-09
R m
ill 2
000
pri
ces
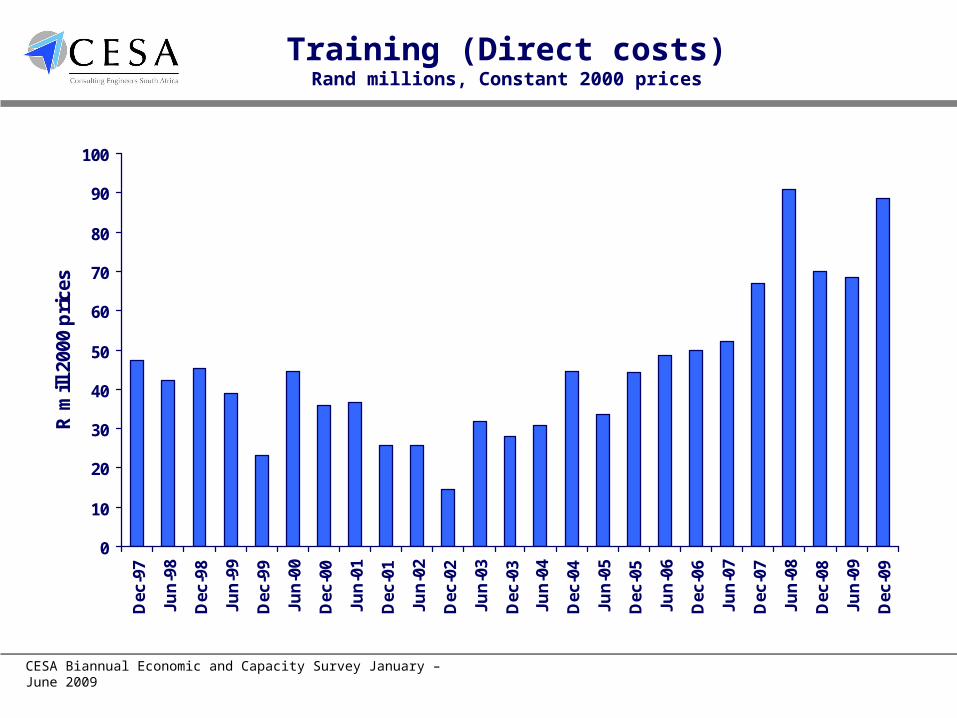
Training (Direct costs)Rand millions, Constant 2000 prices
CESA Biannual Economic and Capacity Survey January – June 2009
0
50000
100000
150000
200000
25000020
01
2002
2003
2004
2005
2006
2007
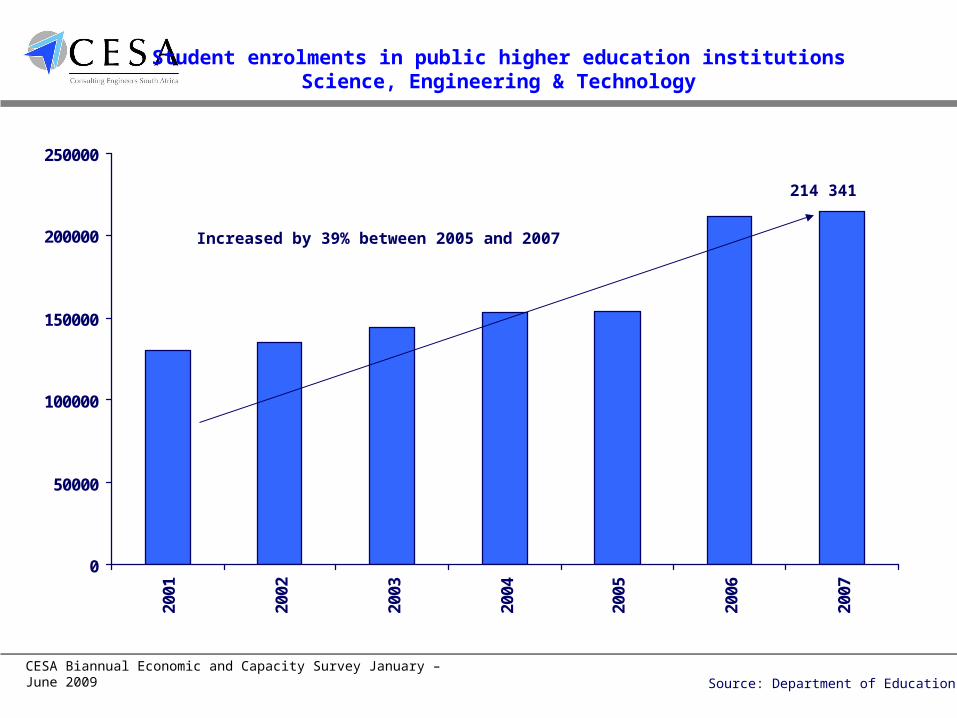
Student enrolments in public higher education institutionsScience, Engineering & Technology
Increased by 39% between 2005 and 2007
214 341
Source: Department of Education
CESA Biannual Economic and Capacity Survey January – June 2009
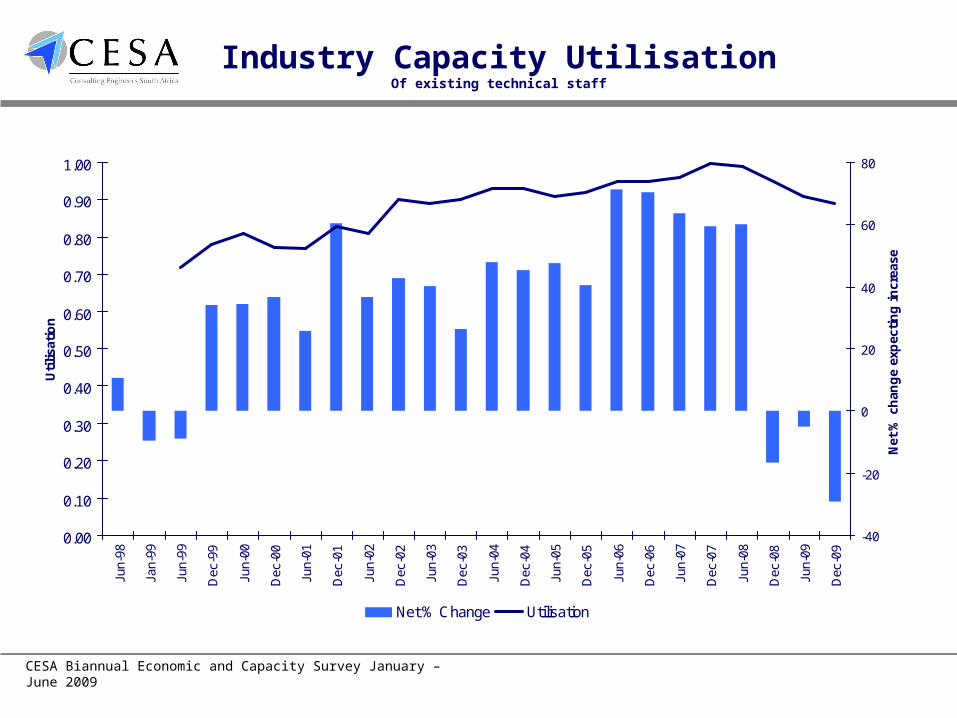
0.00
0.10
0.20
0.30
0.40
0.50
0.60
0.70
0.80
0.90
1.00
Jun-
98
Jan-
99
Jun-
99
Dec
-99
Jun-
00
Dec
-00
Jun-
01
Dec
-01
Jun-
02
Dec
-02
Jun-
03
Dec
-03
Jun-
04
Dec
-04
Jun-
05
Dec
-05
Jun-
06
Dec
-06
Jun-
07
Dec
-07
Jun-
08
Dec
-08
Jun-
09
Dec
-09
Uti
lisa
tio
n
-40
-20
0
20
40
60
80
Net
% c
han
ge
exp
ecti
ng
in
crea
se
Net % Change Utilisation
Industry Capacity UtilisationOf existing technical staff
CESA Biannual Economic and Capacity Survey January – June 2009
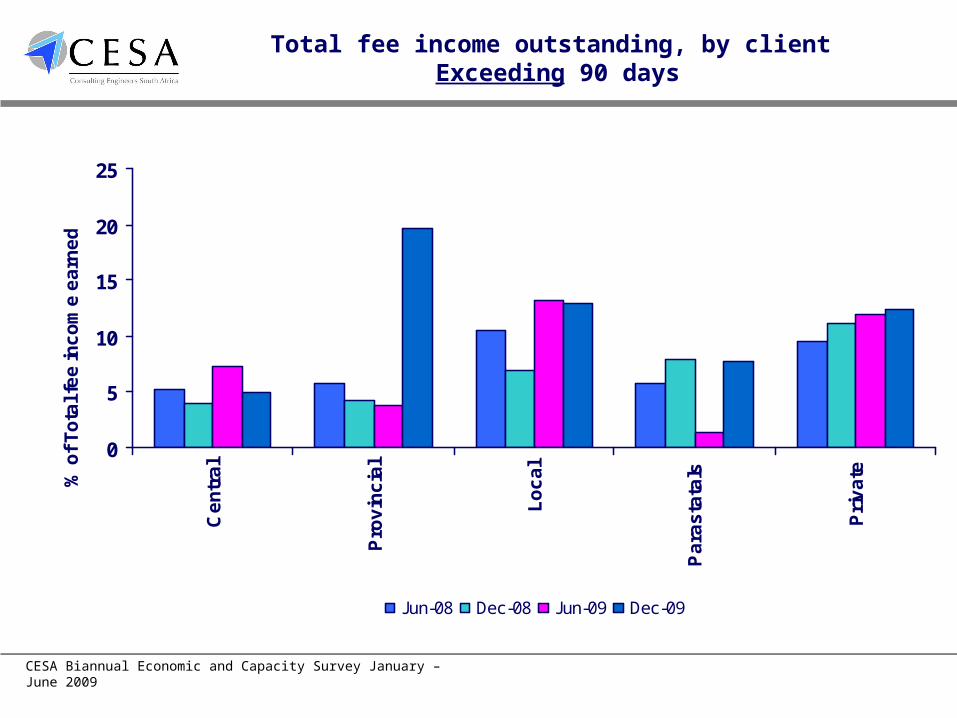
Total fee income outstanding, by client Exceeding 90 days
0
5
10
15
20
25
Ce
ntr
al
Pro
vin
cia
l
Lo
ca
l
Pa
ras
tata
ls
Pri
va
te% o
f T
ota
l fe
e in
co
me
ea
rne
d
Jun-08 Dec-08 Jun-09 Dec-09
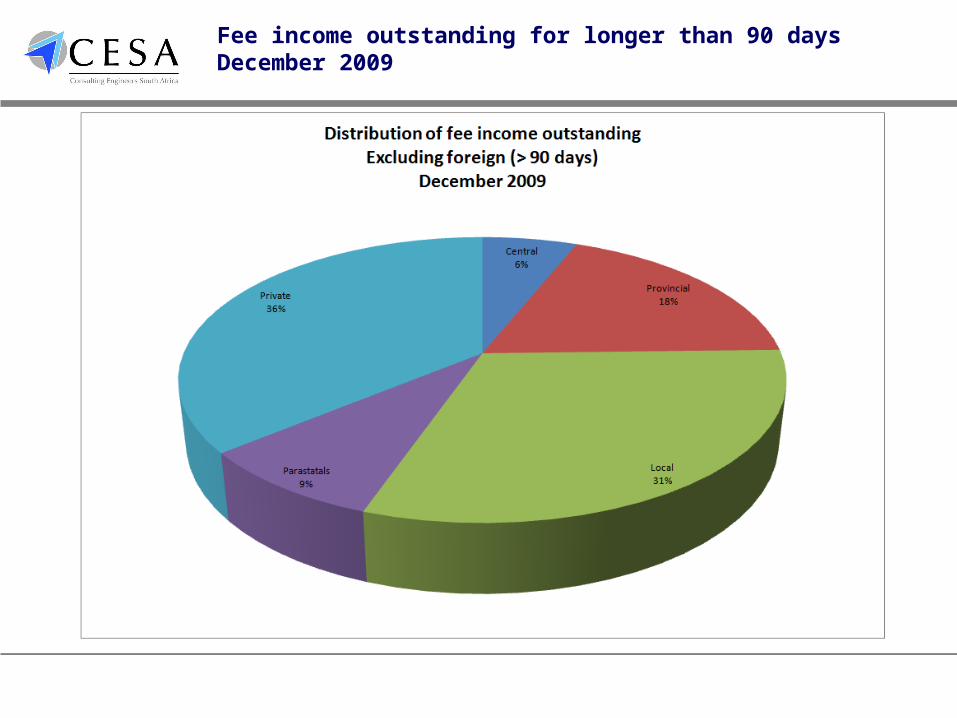
Fee income outstanding for longer than 90 daysDecember 2009
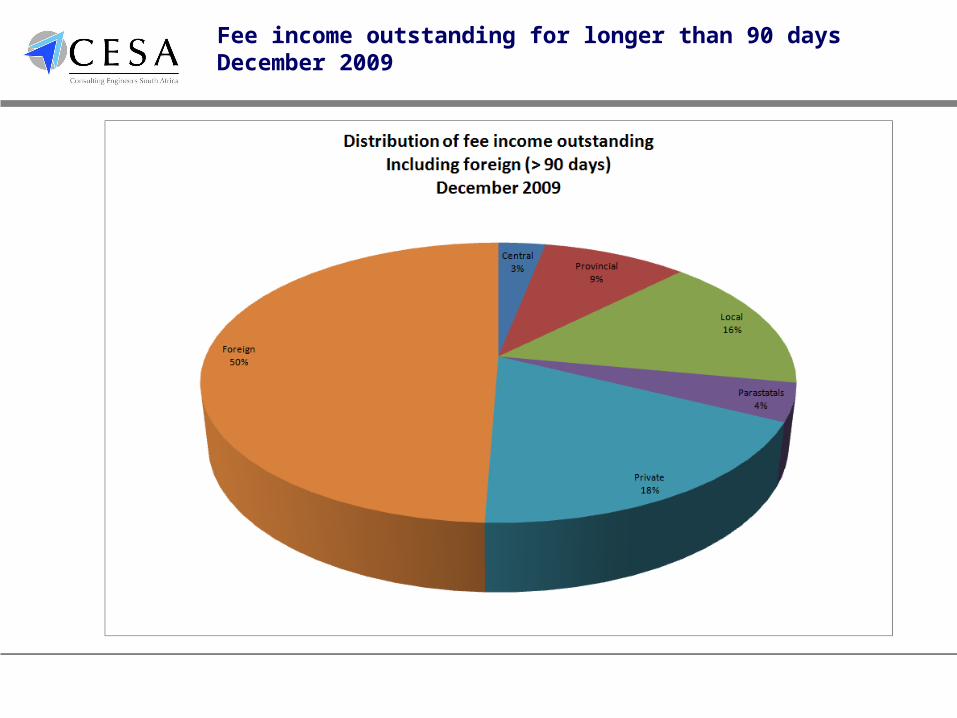
Fee income outstanding for longer than 90 daysDecember 2009
CESA Biannual Economic and Capacity Survey January – June 2009
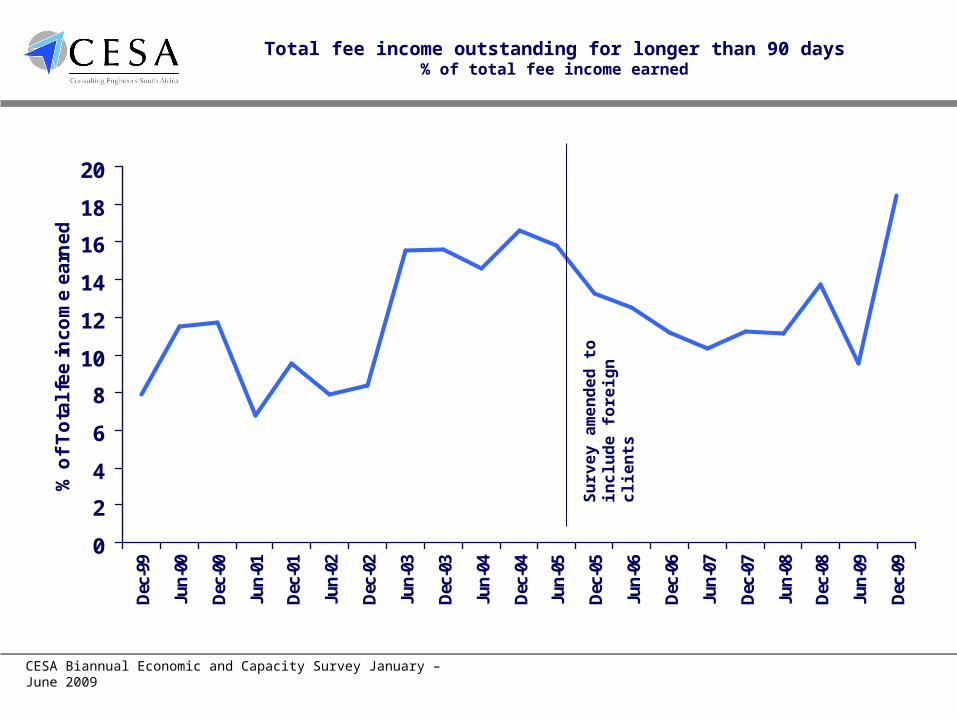
Total fee income outstanding for longer than 90 days% of total fee income earned
0
2
4
6
8
10
12
14
16
18
20
Dec
-99
Jun-
00
Dec
-00
Jun-
01
Dec
-01
Jun-
02
Dec
-02
Jun-
03
Dec
-03
Jun-
04
Dec
-04
Jun-
05
Dec
-05
Jun-
06
Dec
-06
Jun-
07
Dec
-07
Jun-
08
Dec
-08
Jun-
09
Dec
-09
% o
f T
ota
l fe
e i
nc
om
e e
arn
ed
Su
rvey a
men
ded
to
in
clu
de f
ore
ign
clien
ts
CESA Biannual Economic and Capacity Survey January – June 2009
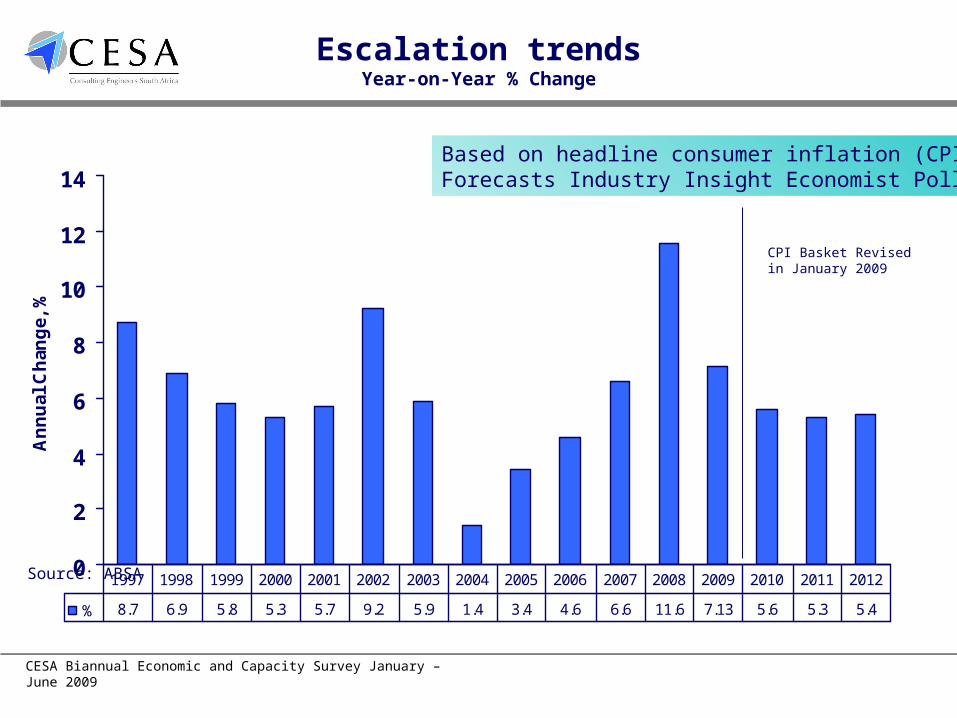
Escalation trendsYear-on-Year % Change
0
2
4
6
8
10
12
14
An
nu
al C
han
ge,
%
% 8.7 6.9 5.8 5.3 5.7 9.2 5.9 1.4 3.4 4.6 6.6 11.6 7.13 5.6 5.3 5.4
1997 1998 1999 2000 2001 2002 2003 2004 2005 2006 2007 2008 2009 2010 2011 2012
Based on headline consumer inflation (CPI)Forecasts Industry Insight Economist Poll
Source: ABSA
CPI Basket Revised in January 2009
CESA Biannual Economic and Capacity Survey January – June 2009
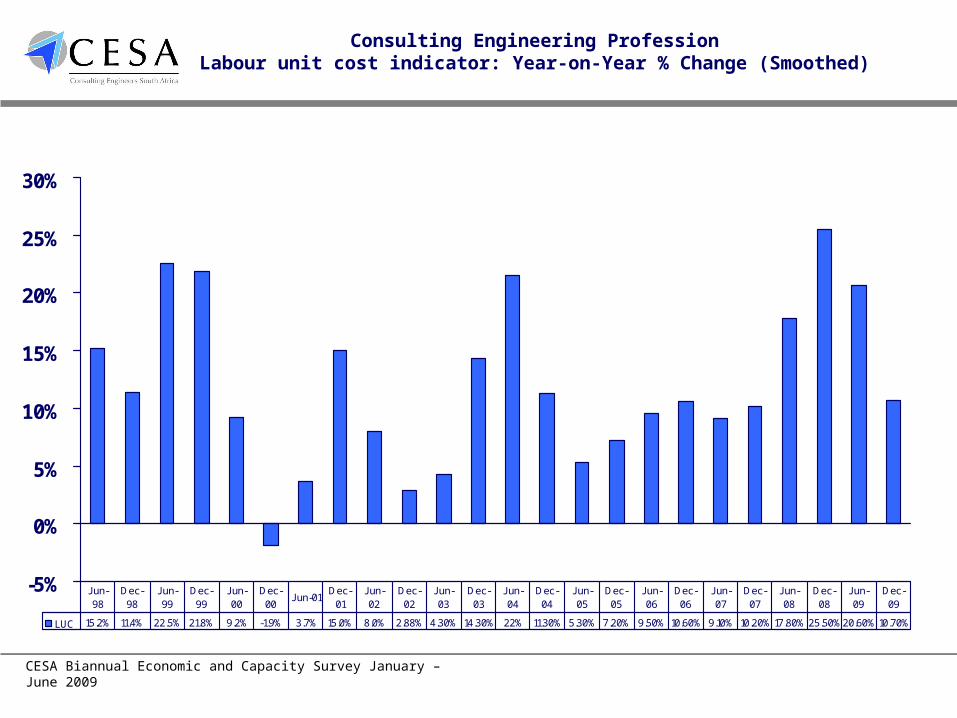
Consulting Engineering ProfessionLabour unit cost indicator: Year-on-Year % Change (Smoothed)
-5%
0%
5%
10%
15%
20%
25%
30%
LUC 15.2% 11.4% 22.5% 21.8% 9.2% -1.9% 3.7% 15.0% 8.0% 2.88% 4.30% 14.30% 22% 11.30% 5.30% 7.20% 9.50% 10.60% 9.10% 10.20% 17.80%25.50%20.60%10.70%
J un-98
Dec-98
J un-99
Dec-99
J un-00
Dec-00
J un-01Dec-
01J un-02
Dec-02
J un-03
Dec-03
J un-04
Dec-04
J un-05
Dec-05
J un-06
Dec-06
J un-07
Dec-07
J un-08
Dec-08
J un-09
Dec-09
CESA Biannual Economic and Capacity Survey January – June 2009
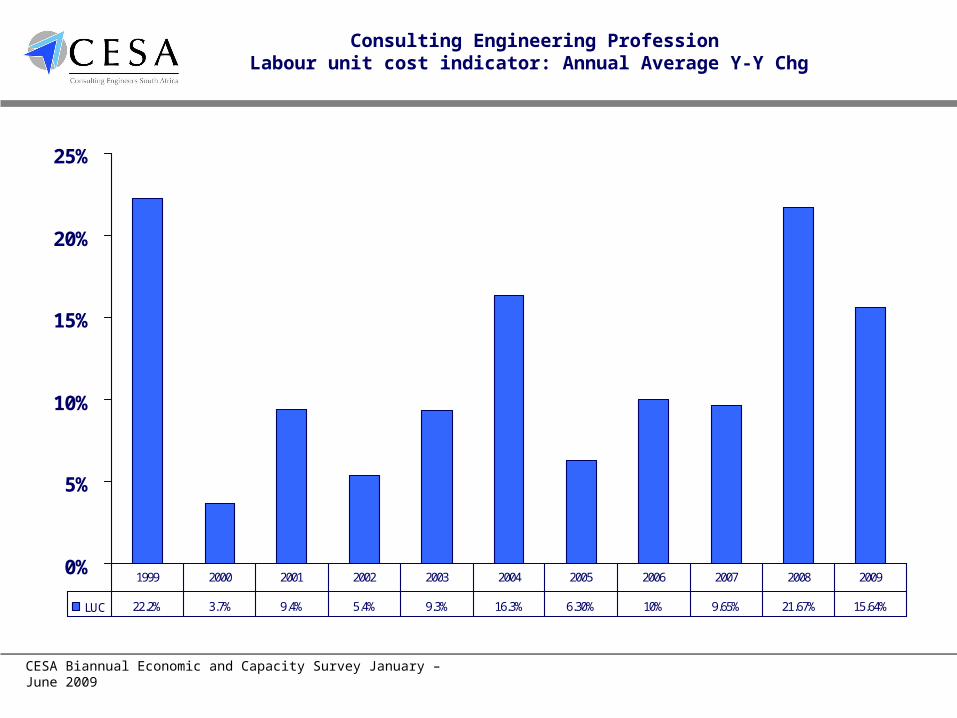
Consulting Engineering ProfessionLabour unit cost indicator: Annual Average Y-Y Chg
0%
5%
10%
15%
20%
25%
LUC 22.2% 3.7% 9.4% 5.4% 9.3% 16.3% 6.30% 10% 9.65% 21.67% 15.64%
1999 2000 2001 2002 2003 2004 2005 2006 2007 2008 2009
CESA Biannual Economic and Capacity Survey January – June 2009
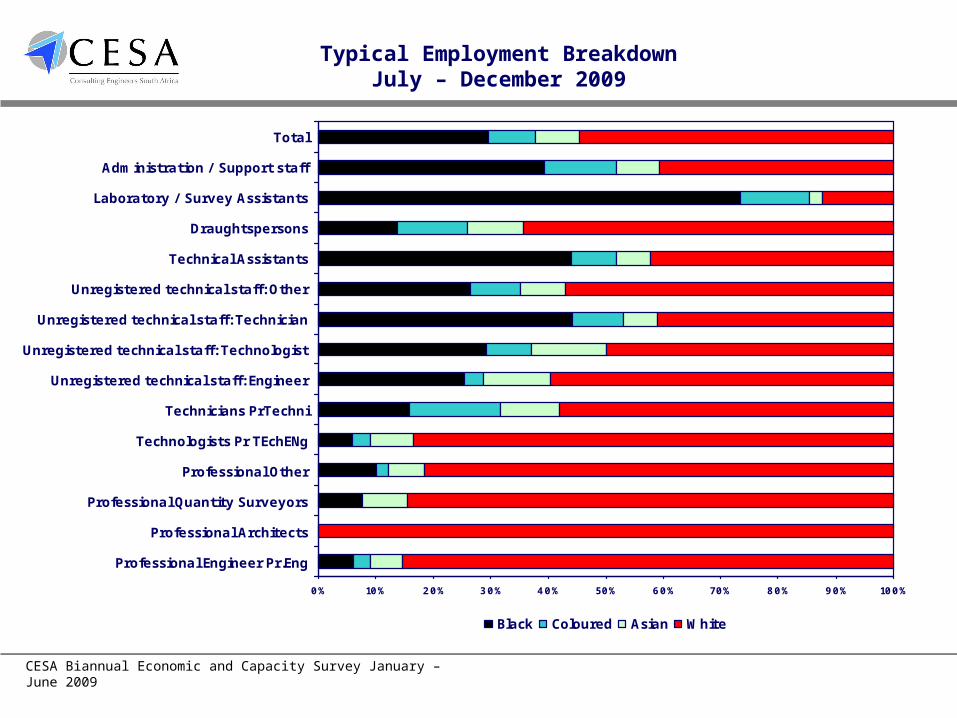
Typical Employment BreakdownJuly – December 2009
0% 10% 20% 30% 40% 50% 60% 70% 80% 90% 100%
Professional Engineer Pr.Eng
Professional Architects
Professional Quantity Surveyors
Professional Other
Technologists Pr TEchENg
Technicians PrTechni
Unregistered technical staff: Engineer
Unregistered technical staff: Technologist
Unregistered technical staff: Technician
Unregistered technical staff: Other
Technical Assistants
Draughtspersons
Laboratory / Survey Assistants
Administration / Support staff
Total
Black Coloured Asian White
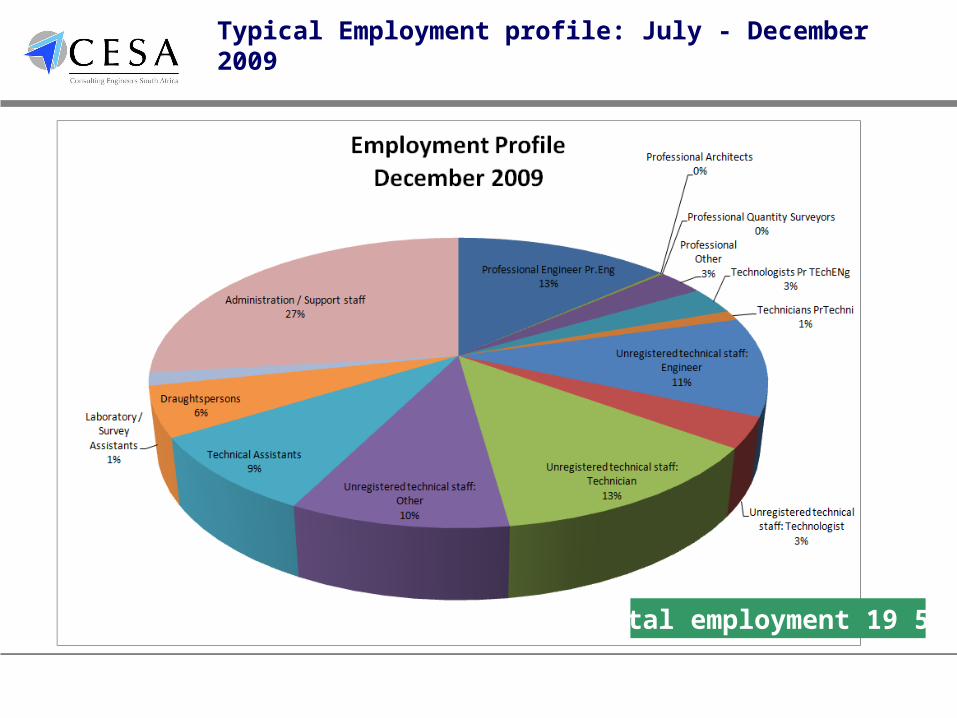
Typical Employment profile: July - December 2009
Total employment 19 596
CESA Biannual Economic and Capacity Survey January – June 2009
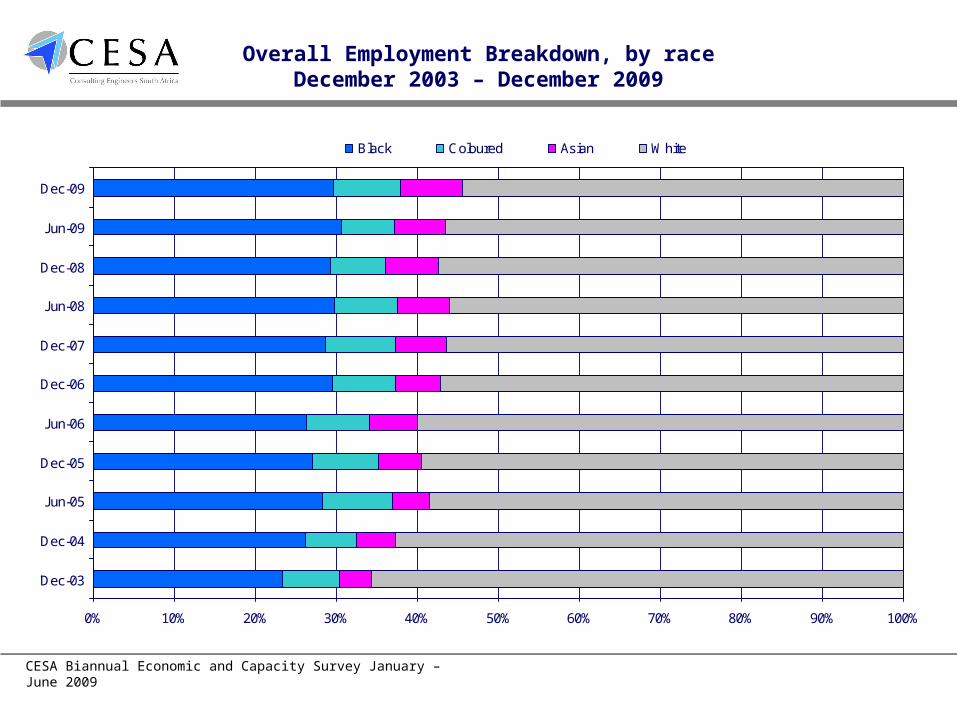
0% 10% 20% 30% 40% 50% 60% 70% 80% 90% 100%
'Dec-03
Dec-04
Jun-05
Dec-05
Jun-06
Dec-06
Dec-07
Jun-08
Dec-08
Jun-09
Dec-09
Black Coloured Asian White
Overall Employment Breakdown, by raceDecember 2003 – December 2009
CESA Biannual Economic and Capacity Survey January – June 2009
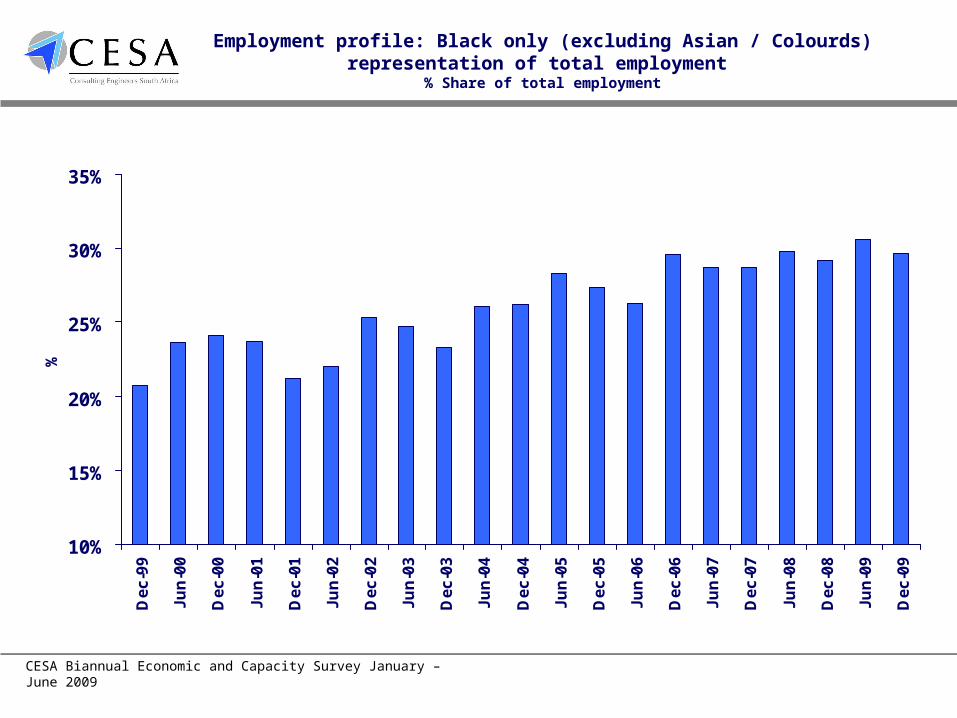
10%
15%
20%
25%
30%
35%
De
c-9
9
Ju
n-0
0
De
c-0
0
Ju
n-0
1
De
c-0
1
Ju
n-0
2
De
c-0
2
Ju
n-0
3
De
c-0
3
Ju
n-0
4
De
c-0
4
Ju
n-0
5
De
c-0
5
Ju
n-0
6
De
c-0
6
Ju
n-0
7
De
c-0
7
Ju
n-0
8
De
c-0
8
Ju
n-0
9
De
c-0
9
%Employment profile: Black only (excluding Asian / Colourds)
representation of total employment % Share of total employment
CESA Biannual Economic and Capacity Survey January – June 2009
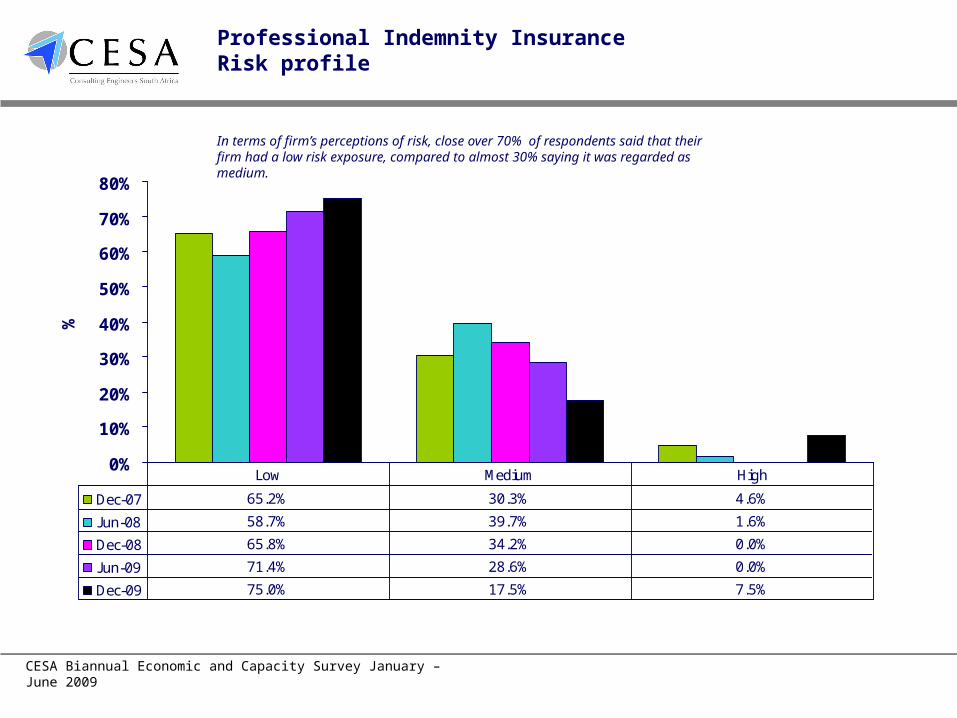
Professional Indemnity InsuranceRisk profile
0%
10%
20%
30%
40%
50%
60%
70%
80%
%
Dec-07 65.2% 30.3% 4.6%
Jun-08 58.7% 39.7% 1.6%
Dec-08 65.8% 34.2% 0.0%
Jun-09 71.4% 28.6% 0.0%
Dec-09 75.0% 17.5% 7.5%
Low Medium High
In terms of firm’s perceptions of risk, close over 70% of respondents said that their firm had a low risk exposure, compared to almost 30% saying it was regarded as medium.
CESA Biannual Economic and Capacity Survey January – June 2009
0%
10%20%
30%40%
50%
60%70%
80%90%
100%
JU
N0
6
DE
C0
6
JU
N0
7
DE
C0
7
JU
N0
8
DE
C0
8
JU
N0
9
DE
C0
9
%
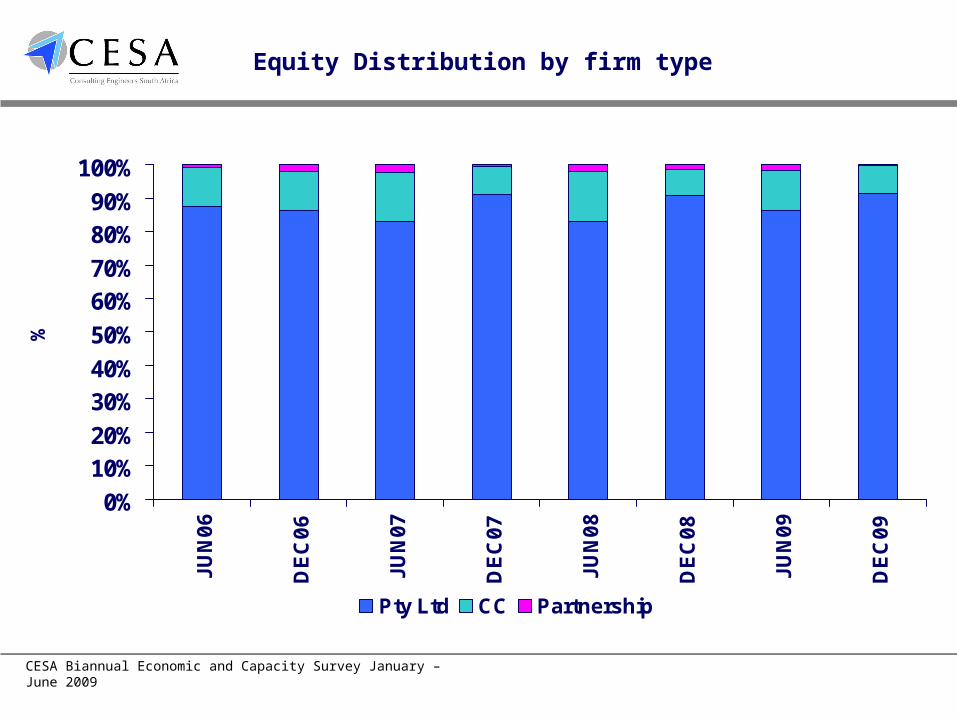
Pty Ltd CC Partnership
Equity Distribution by firm type
CESA Biannual Economic and Capacity Survey January – June 2009
0.0%
2.0%
4.0%
6.0%
8.0%
10.0%
12.0%
JU
N0
6
DE
C0
6
JU
N0
7
DE
C0
7
JU
N0
8
DE
C0
8
JU
N0
9
DE
C0
9
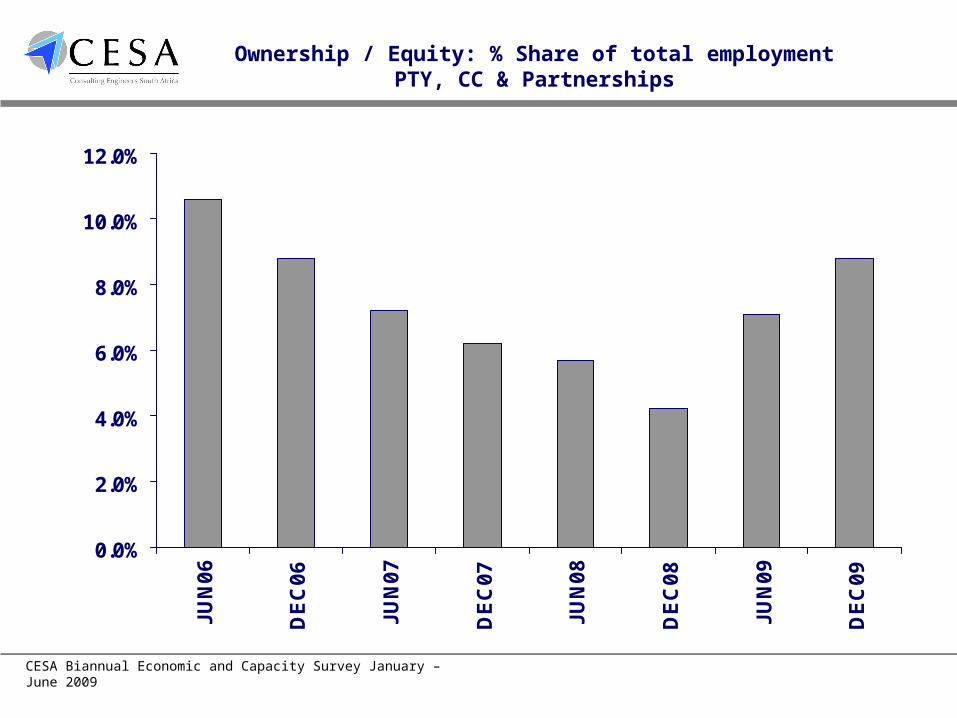
Ownership / Equity: % Share of total employmentPTY, CC & Partnerships
CESA Biannual Economic and Capacity Survey January – June 2009
0.0%
5.0%
10.0%
15.0%
20.0%
25.0%
30.0%
JU
N0
6
DE
C0
6
JU
N0
7
DE
C0
7
JU
N0
8
DE
C0
8
JU
N0
9
DE
C0
9
Bla
ck
eq
uit
y a
s %
of
tota
l Eq
uit
y
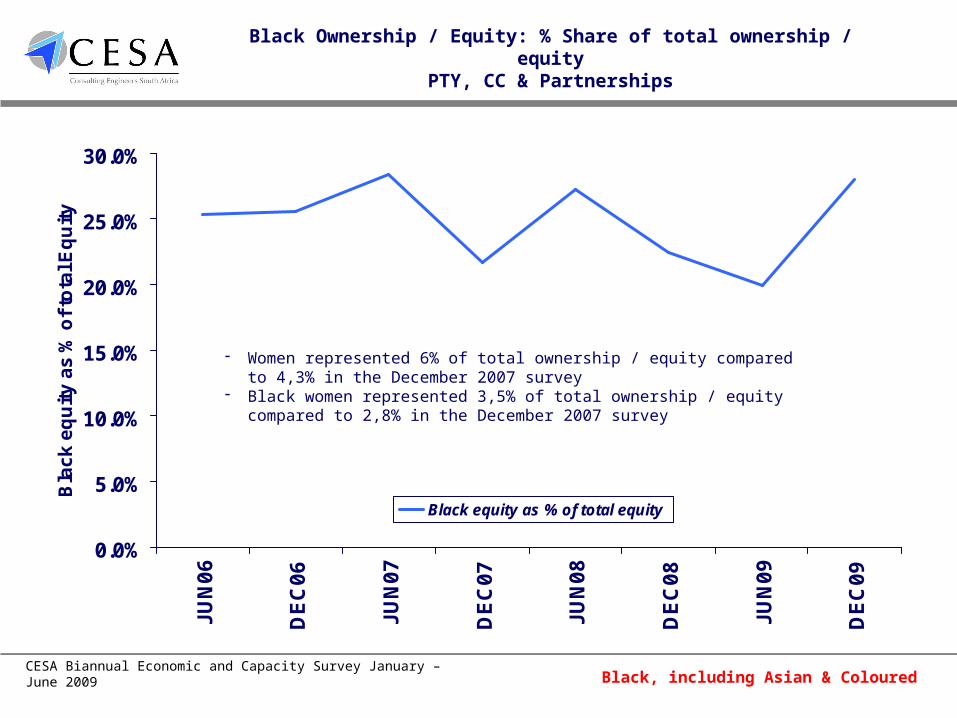
Black equity as % of total equity
Black Ownership / Equity: % Share of total ownership / equityPTY, CC & Partnerships
Black, including Asian & Coloured
- Women represented 6% of total ownership / equity compared to 4,3% in the December 2007 survey
- Black women represented 3,5% of total ownership / equity compared to 2,8% in the December 2007 survey
CESA Biannual Economic and Capacity Survey January – June 2009
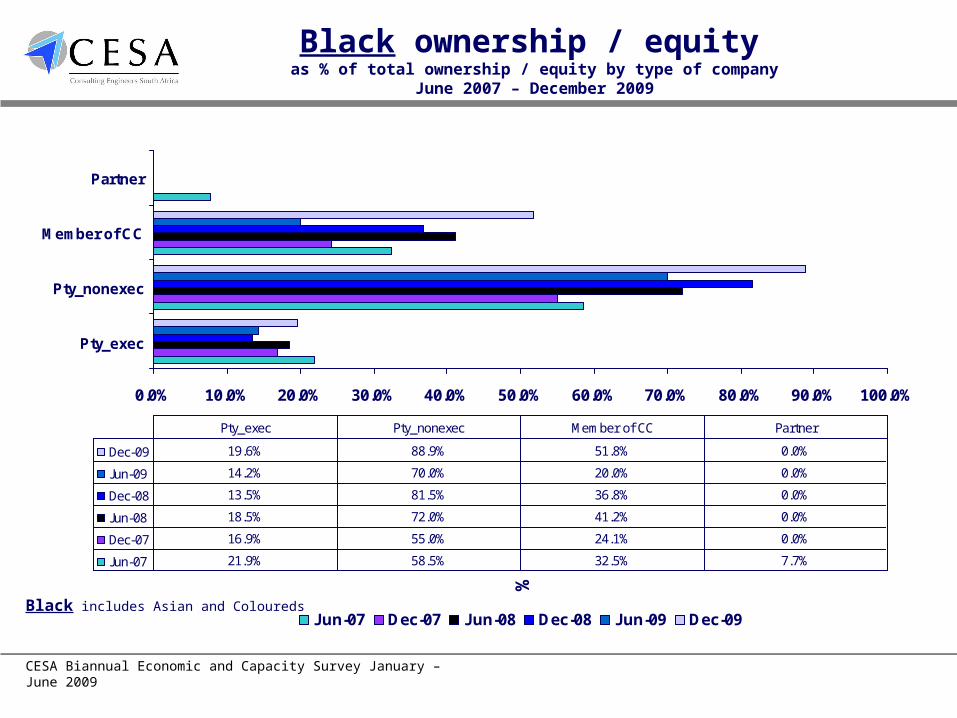
0.0% 10.0% 20.0% 30.0% 40.0% 50.0% 60.0% 70.0% 80.0% 90.0% 100.0%
Pty_exec
Pty_nonexec
Member of CC
Partner
%
Jun-07 Dec-07 Jun-08 Dec-08 Jun-09 Dec-09
Dec-09 19.6% 88.9% 51.8% 0.0%
Jun-09 14.2% 70.0% 20.0% 0.0%
Dec-08 13.5% 81.5% 36.8% 0.0%
Jun-08 18.5% 72.0% 41.2% 0.0%
Dec-07 16.9% 55.0% 24.1% 0.0%
Jun-07 21.9% 58.5% 32.5% 7.7%
Pty_exec Pty_nonexec Member of CC Partner
Black ownership / equity as % of total ownership / equity by type of company
June 2007 – December 2009
Black includes Asian and Coloureds
CESA Biannual Economic and Capacity Survey January – June 2009
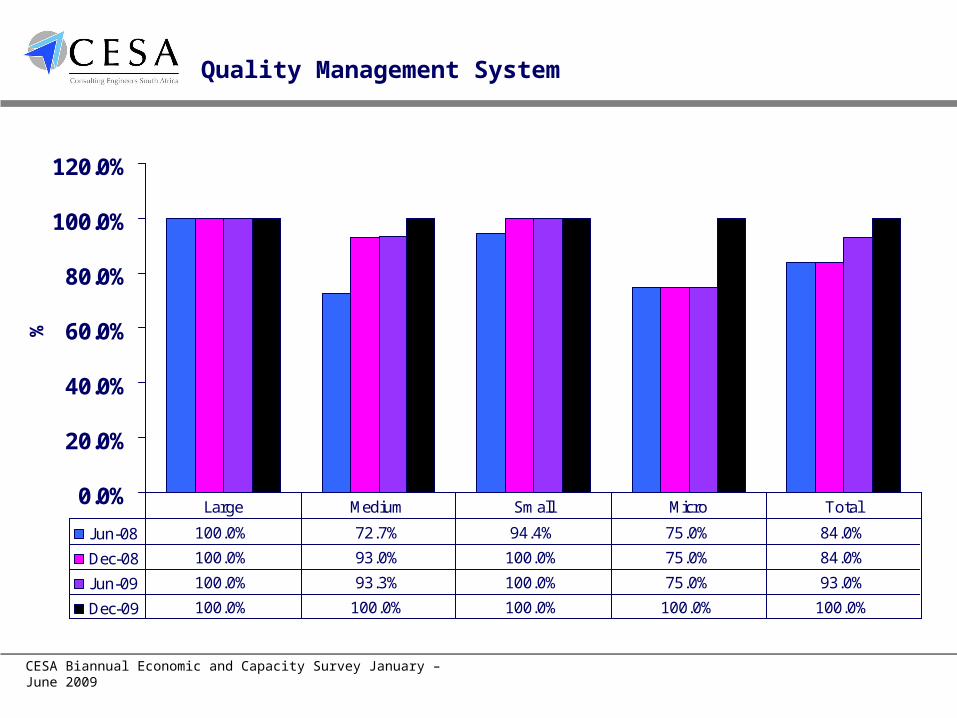
0.0%
20.0%
40.0%
60.0%
80.0%
100.0%
120.0%
%
J un-08 100.0% 72.7% 94.4% 75.0% 84.0%
Dec-08 100.0% 93.0% 100.0% 75.0% 84.0%
Jun-09 100.0% 93.3% 100.0% 75.0% 93.0%
Dec-09 100.0% 100.0% 100.0% 100.0% 100.0%
Large Medium Small Micro Total
Quality Management System
CESA Biannual Economic and Capacity Survey January – June 2009
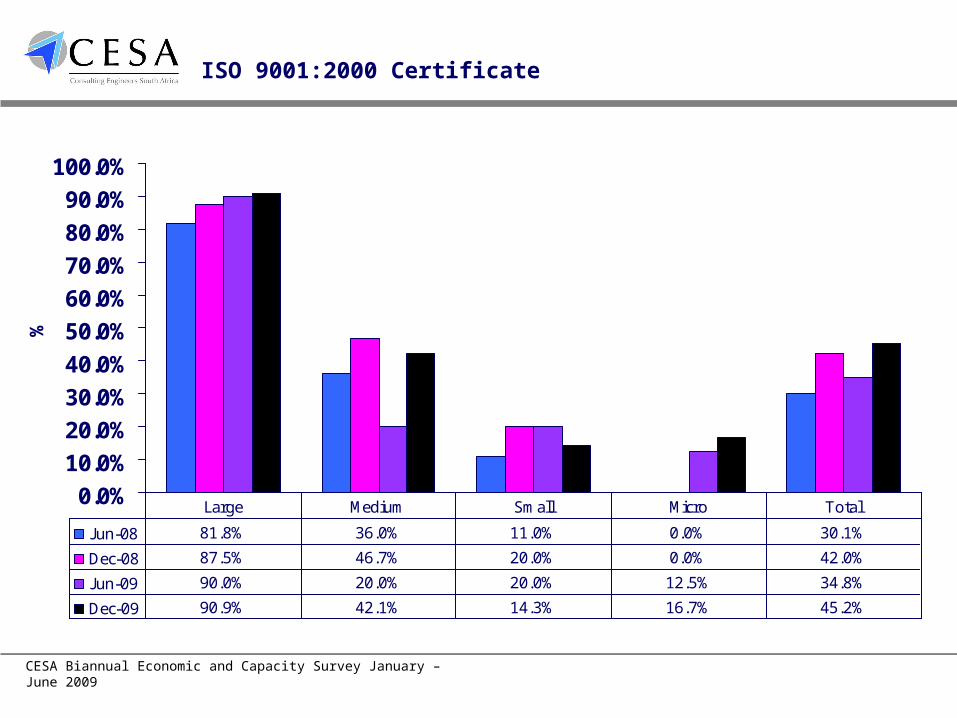
0.0%
10.0%
20.0%
30.0%
40.0%
50.0%
60.0%
70.0%
80.0%
90.0%
100.0%
%
J un-08 81.8% 36.0% 11.0% 0.0% 30.1%
Dec-08 87.5% 46.7% 20.0% 0.0% 42.0%
Jun-09 90.0% 20.0% 20.0% 12.5% 34.8%
Dec-09 90.9% 42.1% 14.3% 16.7% 45.2%
Large Medium Small Micro Total
ISO 9001:2000 Certificate