july 2021 - mof.gov.na
TRANSCRIPT

1
MINISTRY OF FINANCE •
Economic Policy Advisory
Services (EPAS)
Quarterly Economic Update
MINISTRY OF FINANCE - EPAS Quarterly Economic Update
REGIONAL ECONOMIES
COVID-19 IN SUB-SAHARAN AFRICA
Sub-Saharan Africa is in the grips of a third wave of
COVID-19 infections that threatens to be even more brutal
than the first two waves.
This is yet more evidence of a dangerous divergence in the
global economy. One wave-length for countries with good
access to vaccines, where strong recoveries are increasing,
and another for those countries that are still waiting and at
risk of falling behind even further.
The growth of infections in sub-Saharan Africa is now the
fastest in the world, with an explosive trajectory that is
outpacing the record set in the second wave. At this pace,
this new wave will likely surpass previous peaks in a matter
of days—and in some countries, infections are already more
than double, or even triple, their January peaks. The latest
(delta) variant—reportedly 60 percent more transmissible
than earlier variants—has been detected in 14 countries.
When the pandemic first hit, quick action by policymakers
helped prevent infection rates seen elsewhere around the
world. But it pushed already strained local health systems to
the breaking point. The second wave outpaced the scale and
speed of the first, and a year later sub-Saharan Africa faces
its third devastating wave.
The only way for the region to break free from this vicious
pandemic cycle is to swiftly implement a widespread
vaccination program.
RISKS TO THE REGION
The vaccine rollout in sub-Saharan Africa remains the
slowest in the world. Less than 1 adult in every hundred is
fully vaccinated, compared to an average of over 30 in more
advanced economies. This means even most essential
frontline workers continue to work unprotected. In this
context, some of the world’s more fortunate countries have
stockpiled enough vaccines to cover their populations many
times over.
Without significant, upfront, international assistance—and
without an effective region-wide vaccination effort—the
near-term future of sub-Saharan Africa will be one of
repeated waves of infection, which will exact an ever-
increasing toll on the lives and livelihoods of the region’s
most vulnerable, while also paralyzing investment,
productivity, and growth. In short, without help the region
risks being left further and further behind.
This Issue…
Regular Updates
Regional Developments: COVID-19
CPI May 2021
Q1 2021 GDP
Special Feature
Summary of analysis of VAT trend in Namibia
ISSUE
36 July 2021
MINISTRY OF FINANCE – July 2021, P.1
CONSUMER PRICE MAY 2021
The annual inflation for May 2021 increased to 3.8 percent from 2.1
percent recorded during the same period in 2020, an increase of 170
basis points. The monthly increase in the inflation rate was recorded
at 0.3 percent down from an increase of 0.4 percent recorded in
April 2021.
The increase in growth of annual inflation for May 2021 was mainly
as a result of increases in the price levels of transport, food &non-
alcoholic beverages, alcoholic beverages & tobacco, health,
communication, & Housing, water, electricity, gas and other fuels.
This was despite the decline in the price levels of clothing &
footwear.
Figure 1: Categories inflation (%)
Source: NSA May, 2021
Transport recorded inflation of 7.3 percent compared to a decline of
0.1 during the same period last year; the increase in inflation for
transport was prompted by increase in the price level of personal
transport and sale of vehicles, although the operation of public
transport declined significantly.
Food & non-alcoholic beverages recorded inflation of 6.6 percent
compared to 4.7 percent during the same period in 2020. Food was
the largest contributor to the increase in annual inflation, accounting
for 1.2 percentage points of the total 3.8 percent annual inflation
rate. The increase emanated mainly from price increases in most
sub-categories with the exception of milk & cheese, fruits as well as
food products that recorded slower growth in price levels.
Housing, water, electricity, gas and other fuels recorded an increase
of 1.3 percent compared to a decline of 0.6 percent recorded the
same period in 2020. The increase was mainly reflected in the price
levels of rental payments, which increased by 1.3 percent compared
to a decline in price levels of 2.3 percent.
Clothing and footwear recorded a decline of 4.5 percent compared
to growth of -1.3 percent recorded during the same period of 2020.
The decrease in the price levels of this group emanated from all the
subcategories except infant clothing, accessories, & dry cleaning.
The decline emanates from prolonged lockdowns that negatively
affected disposable income and weak demand for items in this
category.
.
-6.0
-4.0
-2.0
0.0
2.0
4.0
6.0
8.0
2020 2021
MIN
IST
RY
OF
FIN
AN
CE
•
Eco
nom
ic P
olic
y A
dvis
ory
Ser
vice
s (E
PA
S)
Qu
arte
rly
Eco
no
mic
Up
dat
e
2
MINISTRY OF FINANCE – July 2021, P.2
Q1 2021 GDP OUTTURN
The Q1 GDP figures indicates deeper contraction of 6.5 percent on an annual basis compared to a contraction of 2.5 percent
which was recorded during the same quarter the previous year as per the latest release data by NSA, the economy is also
estimated to have contracted by 9.3 percent on a quarterly basis. The contraction was induced by the aftermath of COVID-19
and its effect on the global, regional, and domestic economy. The effects were mainly caused by lockdowns, travel bans, and
subsequent health regulations that were impose to help reduce the spread of COVID-19 2nd wave global.
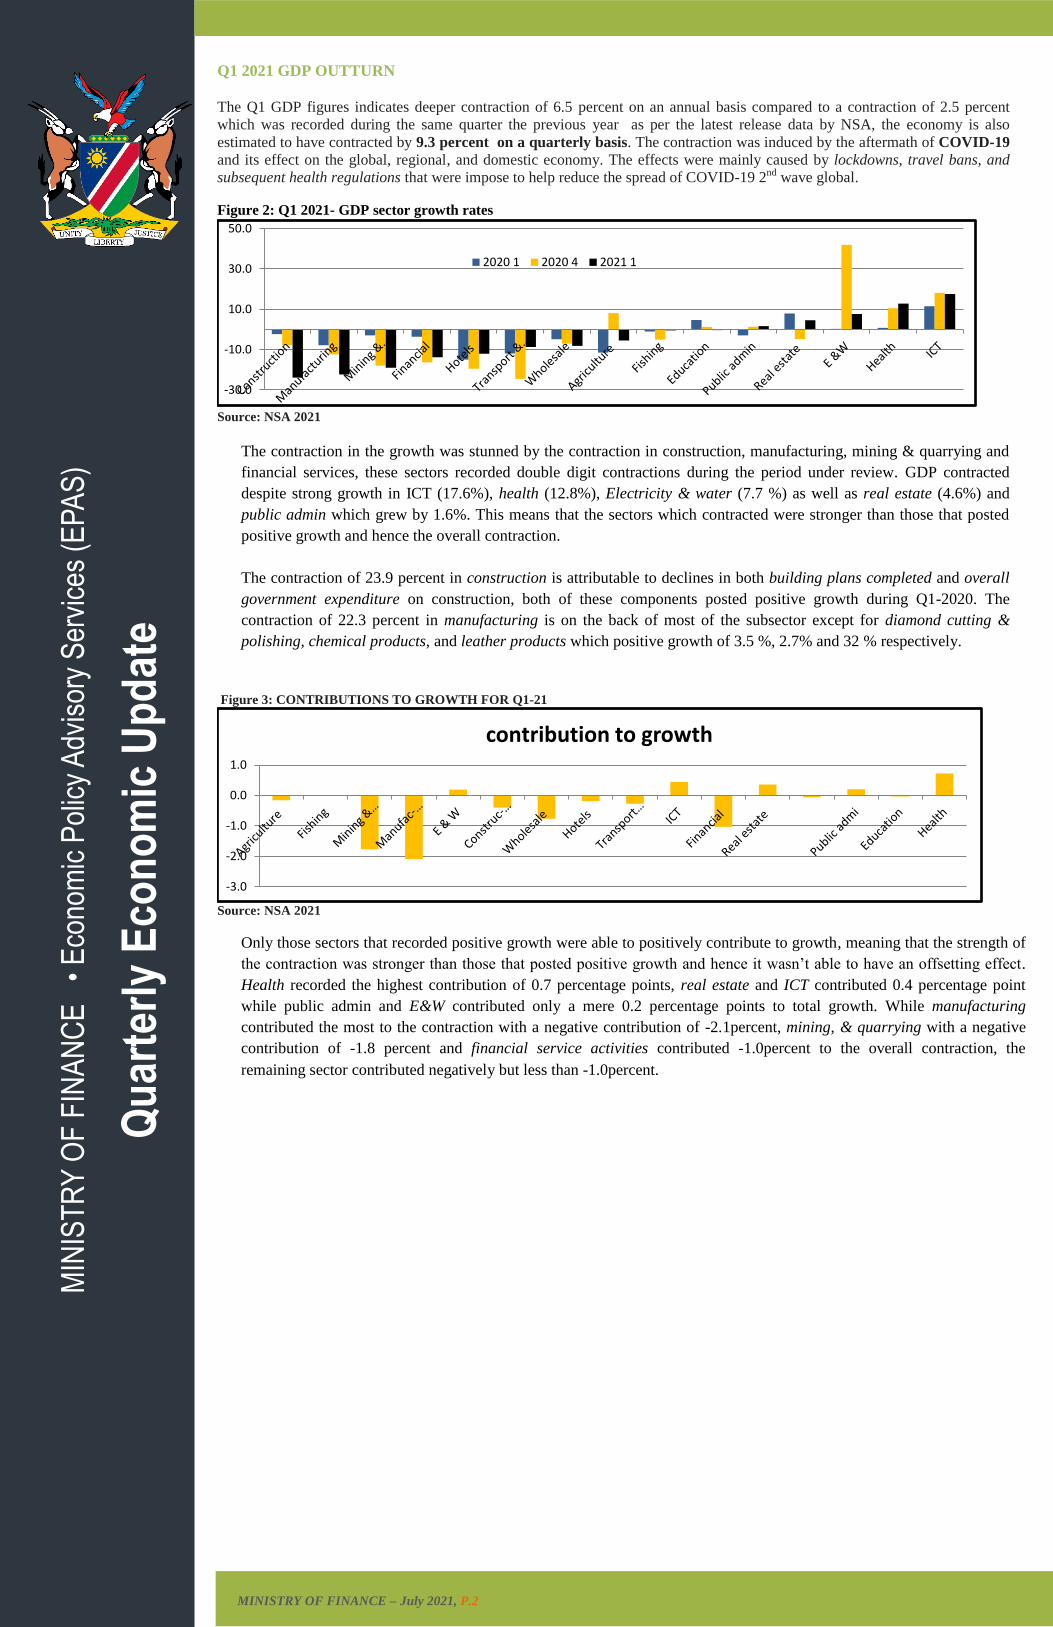
Figure 2: Q1 2021- GDP sector growth rates
Source: NSA 2021
The contraction in the growth was stunned by the contraction in construction, manufacturing, mining & quarrying and
financial services, these sectors recorded double digit contractions during the period under review. GDP contracted
despite strong growth in ICT (17.6%), health (12.8%), Electricity & water (7.7 %) as well as real estate (4.6%) and
public admin which grew by 1.6%. This means that the sectors which contracted were stronger than those that posted
positive growth and hence the overall contraction.
The contraction of 23.9 percent in construction is attributable to declines in both building plans completed and overall
government expenditure on construction, both of these components posted positive growth during Q1-2020. The
contraction of 22.3 percent in manufacturing is on the back of most of the subsector except for diamond cutting &
polishing, chemical products, and leather products which positive growth of 3.5 %, 2.7% and 32 % respectively.
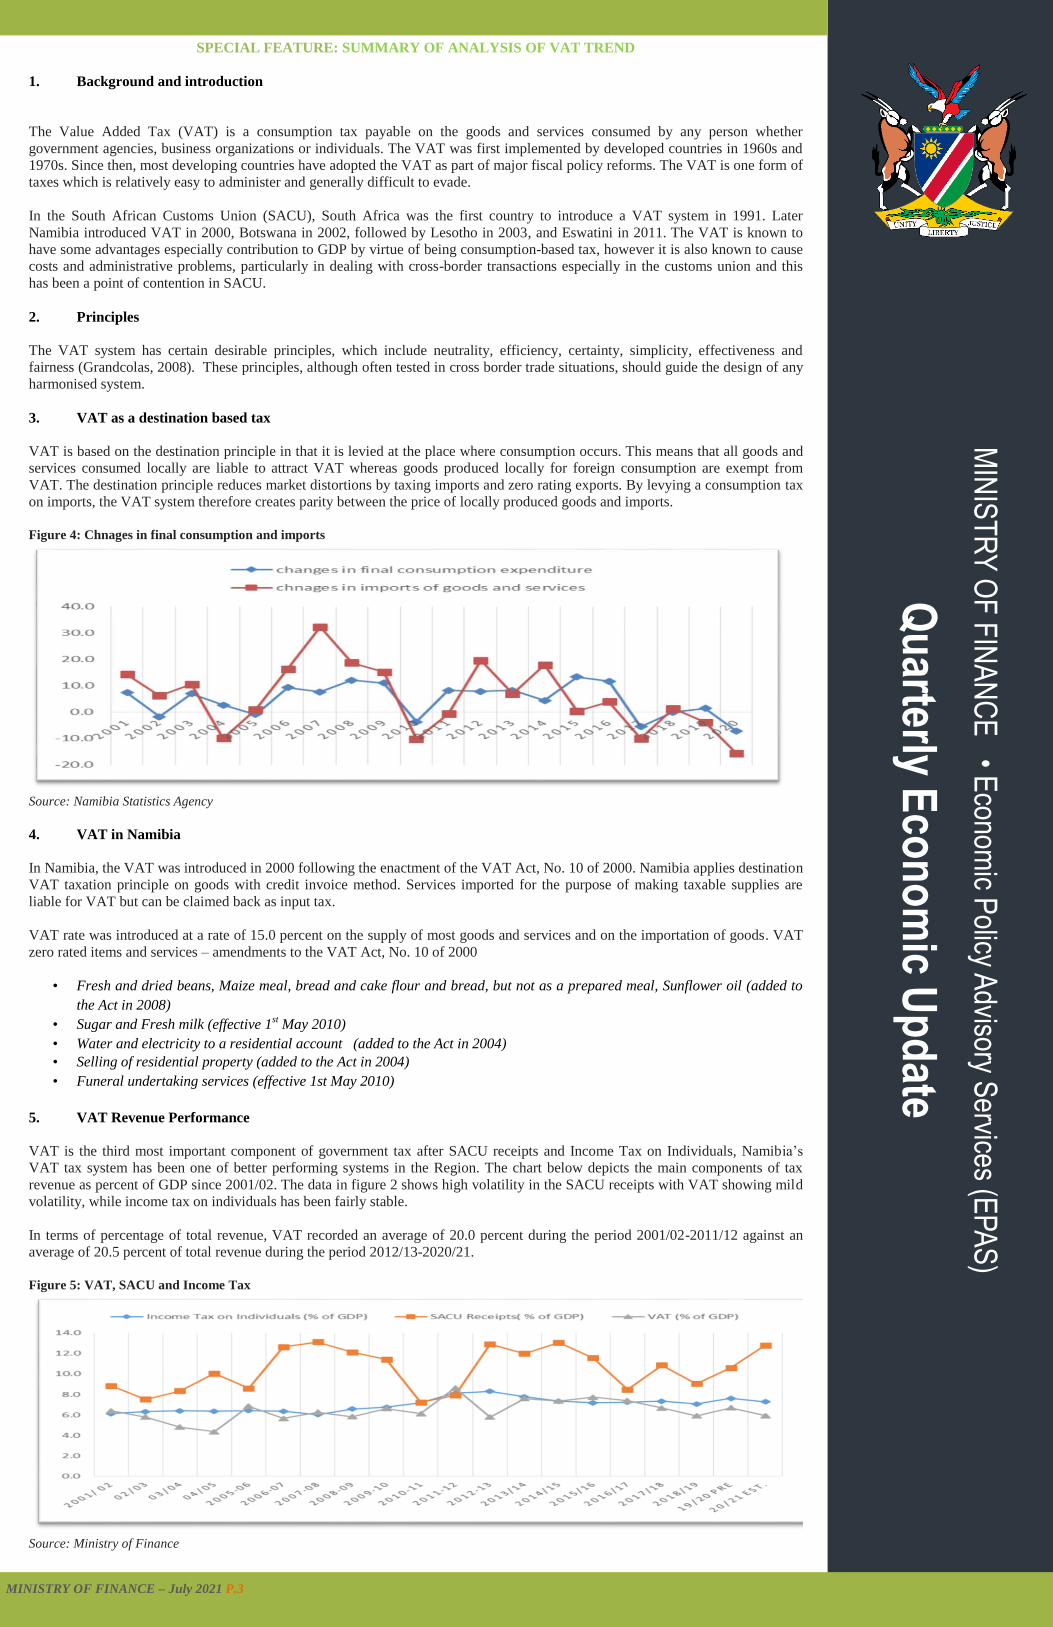
Figure 3: CONTRIBUTIONS TO GROWTH FOR Q1-21
Source: NSA 2021
Only those sectors that recorded positive growth were able to positively contribute to growth, meaning that the strength of
the contraction was stronger than those that posted positive growth and hence it wasn’t able to have an offsetting effect.
Health recorded the highest contribution of 0.7 percentage points, real estate and ICT contributed 0.4 percentage point
while public admin and E&W contributed only a mere 0.2 percentage points to total growth. While manufacturing
contributed the most to the contraction with a negative contribution of -2.1percent, mining, & quarrying with a negative
contribution of -1.8 percent and financial service activities contributed -1.0percent to the overall contraction, the
remaining sector contributed negatively but less than -1.0percent.
-30.0
-10.0
10.0
30.0
50.0
2020 1 2020 4 2021 1
-3.0
-2.0
-1.0
0.0
1.0
contribution to growth
MIN
IST
RY
OF
FIN
AN
CE
•
Eco
nom
ic P
olic
y A
dvis
ory
Ser
vice
s (E
PA
S)
Qu
arte
rly
Eco
no
mic
Up
dat
e
3
SPECIAL FEATURE: SUMMARY OF ANALYSIS OF VAT TREND
1. Background and introduction
The Value Added Tax (VAT) is a consumption tax payable on the goods and services consumed by any person whether
government agencies, business organizations or individuals. The VAT was first implemented by developed countries in 1960s and
1970s. Since then, most developing countries have adopted the VAT as part of major fiscal policy reforms. The VAT is one form of
taxes which is relatively easy to administer and generally difficult to evade.
In the South African Customs Union (SACU), South Africa was the first country to introduce a VAT system in 1991. Later
Namibia introduced VAT in 2000, Botswana in 2002, followed by Lesotho in 2003, and Eswatini in 2011. The VAT is known to
have some advantages especially contribution to GDP by virtue of being consumption-based tax, however it is also known to cause
costs and administrative problems, particularly in dealing with cross-border transactions especially in the customs union and this
has been a point of contention in SACU.
2. Principles
The VAT system has certain desirable principles, which include neutrality, efficiency, certainty, simplicity, effectiveness and
fairness (Grandcolas, 2008). These principles, although often tested in cross border trade situations, should guide the design of any
harmonised system.
3. VAT as a destination based tax
VAT is based on the destination principle in that it is levied at the place where consumption occurs. This means that all goods and
services consumed locally are liable to attract VAT whereas goods produced locally for foreign consumption are exempt from
VAT. The destination principle reduces market distortions by taxing imports and zero rating exports. By levying a consumption tax
on imports, the VAT system therefore creates parity between the price of locally produced goods and imports.
Figure 4: Chnages in final consumption and imports
Source: Namibia Statistics Agency
4. VAT in Namibia
In Namibia, the VAT was introduced in 2000 following the enactment of the VAT Act, No. 10 of 2000. Namibia applies destination
VAT taxation principle on goods with credit invoice method. Services imported for the purpose of making taxable supplies are
liable for VAT but can be claimed back as input tax.
VAT rate was introduced at a rate of 15.0 percent on the supply of most goods and services and on the importation of goods. VAT
zero rated items and services – amendments to the VAT Act, No. 10 of 2000
• Fresh and dried beans, Maize meal, bread and cake flour and bread, but not as a prepared meal, Sunflower oil (added to
the Act in 2008)
• Sugar and Fresh milk (effective 1st May 2010)
• Water and electricity to a residential account (added to the Act in 2004)
• Selling of residential property (added to the Act in 2004)
• Funeral undertaking services (effective 1st May 2010)
5. VAT Revenue Performance
VAT is the third most important component of government tax after SACU receipts and Income Tax on Individuals, Namibia’s
VAT tax system has been one of better performing systems in the Region. The chart below depicts the main components of tax
revenue as percent of GDP since 2001/02. The data in figure 2 shows high volatility in the SACU receipts with VAT showing mild
volatility, while income tax on individuals has been fairly stable.
In terms of percentage of total revenue, VAT recorded an average of 20.0 percent during the period 2001/02-2011/12 against an
average of 20.5 percent of total revenue during the period 2012/13-2020/21.
Figure 5: VAT, SACU and Income Tax
Source: Ministry of Finance
MIN
IST
RY
OF
FIN
AN
CE
• Econom
ic Policy A
dvisory Services (E
PA
S)
Qu
arterly Eco
no
mic U
pd
ate
MINISTRY OF FINANCE – July 2021 P.3

4
M
INIS
TR
Y O
F F
INA
NC
E •
Eco
nom
ic P
olic
y A
dvis
ory
Ser
vice
s (E
PA
S)
Qu
arte
rly
Eco
no
mic
Up
dat
e
MINISTRY OF FINANCE – July 2021 P.4
This publication was produced by:
Ministry of Finance
Economic Policy Advisory Services Head Office, Moltke Street
P/Bag 13259, Windhoek
Tel: (061) 209 2131
SUMMARY OF ANALYSIS OF VAT TREND…continued
The same trend reflects volatility in VAT as a share of total government revenue. The volatility mirrors the changes in both imports
and consumption during the same period. The data provides evidence of stability in the VAT revenue trend since its introduction
with variations only observed in relations to other major variables such as final consumption expenditure, imports and GDP as
reflected in the chart below.
Figure 6: Changes in final consumption, imports and GDP
Source: Namibia Statistics Agency
For analysis purpose, we divided the trend into two periods for example, from 2001/02-2011/12 and 2012/13-2020/21. On average,
VAT revenue as percentage of GDP was recorded at 6.1 percent during the period 2001/02-2011/12, while during the period
2012/13-2020/21 an average of 6.8 percent was recorded.
In terms of percentage of total revenue, VAT recorded an average of 20.0 percent during the period 2001/02-2011/12 against an
average of 20.5 percent of total revenue during the period 2012/13-2020/21.
Figure 7: VAT as % of GDP and as % of Revenue
Source Ministry of Finance Namibia
Conclusion
It was observed from the trend analysis that VAT revenue as a proportion of GDP slowed down marginally from 2015/2016 but it
has been relatively stable. This is consistent with the main variables directly linked to VAT namely final consumption expenditure
and imports of goods and services.
It was further observed that from the theoretical point of view, the VAT revenue does not necessarily dependent on the rate but more
on disposable income, imports and consumption. Furthermore, taking into account the current standard VAT rate of 15 percent, VAT
revenue as a percent of GDP VAT was supposed to be as close to 15 percent, we then conclude that VAT collection is effective.
Effective VAT rate is basically what government can effectively collect from the economy all things but it is lower than 15 percent
as per evidence of the analysis. The cause of the ineffective VAT collection can be attributed to a number of factors including
exemptions (zero-rated goods), over-claiming (higher VAT refunds), avoidance but just to mention a few.