july 2018 - stella international holdings limited · mr. johnny chen, ined, ... •surabaya •bay...
TRANSCRIPT


Disclaimer
This presentation and the accompanying slides (the “Presentation”) which have been prepared by Stella International Holdings Limited (“Stella” or the “Company”) do not constitute any offer or invitation to purchase or subscribe for any securities, and shall not form the basis for or be relied on in connection with any contract or binding commitment whatsoever. They are only being furnished to you and may not be photocopied, reproduced or distributed to any other persons at any time without the prior written consent of the Company. This Presentation has been prepared by the Company based on information and data which the Company considers reliable, but the Company makes no representation or warranty, express or implied, whatsoever, and no reliance shall be placed on, the truth, accuracy, completeness, fairness and reasonableness of the contents of this Presentation. This Presentation may not be all inclusive and may not contain all of the information that you may consider material. Any liability in respect of the contents of or any omission from this Presentation is expressly excluded.
2
any omission from this Presentation is expressly excluded.
Certain matters discussed in this presentation may contain statements regarding the Company’s market opportunity and business prospects that are individually and collectively forward-looking statements. Such forward-looking statements are not guarantees of future performance and are subject to known and unknown risks, uncertainties and assumptions that are difficult to predict. The Company’s actual results, levels of activity, performance or achievements could differ materially and adversely from results expressed in or implied by this Presentation, including, amongst others: whether the Company can successfully penetrate new markets and the degree to which the Company gains traction in these new markets; the sustainability of recent growth rates; the anticipation of the growth of certain market segments; the positioning of the Company’s products and services in those segments; the competitive environment; and general market conditions. The Company assumes no obligation to update any forward-looking information contained in this presentation. Any forward-looking statements and projections made by third parties included in this Presentation are not adopted by the Company and the Company is not responsible for such third-party statements and projections.

COMPANYOVERVIEW

Our Management Team
Strong senior management with in-depth industry knowledgeand an established track record
Name PositionYears of Relevant Experience
Years with Stella
Executive Directors:
Jack Chiang Chairman & Executive Director 33 33
Eric Chao Executive Director 34 34
Lawrence Chen Executive Director & Group CEO 31 31
Stephen ChiExecutive Director, CEO of the Women’s Footwear Business Division and Retail Business Division
21 21
Business Division:
Dermot Smowton Group COO 35 2
Ray Chen GM of Men’s Footwear Business Division 31 31
4
Experienced Independent Non-Executive Boardwith diversified background and competencies
Mr. Johnny Chen, INED, over 20 years experience in China’s capital market and professional service sectors
Mr. Peter Bolliger, INED, over 30 years experience in footwear and retail
Mr. William Chan, INED, over 30 years experience in human resources profession
Mr. Thomas Yue, INED, over 35 years experience in accounting profession
Mr. Jie Lian, INED, over 15 years experience in investment banking and private equity
Ray Chen GM of Men’s Footwear Business Division 31 31
Steve Chu GM of Oversea’s Footwear Business Division 22 20
Roger Yang GM of Fashion Footwear Business Division 30 30
Jerry ChangGM of Sports Fashion Footwear Business Division
29 22
Corporate Division:
Don Lee Group CFO 33 11
Sean Chiu Operation Director 24 2

Corporate and Shareholder Structure
CordwalnerBonaventure Inc.
Directors Public
33.00% 11.52% 55.48%
STELLASTELLA
5
Manufacturing Retailing
Contractualarrangement
Processingfactories
WFOEDistributor(Asia, GCC)
EuropeGreaterChina
1836

Employee Participation
Pre IPO Combat Team- 2011
Vesting Period 5-year (in 5 tranches) 5-year (one-time), KPI triggered
Arrangement Held under Cordwalner Bonaventure and several SPVs
Held under several Special Purpose Vehicles (SPVs)
Ownership 33% 6%
Background Around 500 senior managements and other employees shared 1/3 of the company. 30% already distributed to employees
Founding families distributed 50mn shares to 500 middle managements and supervisors
Considerations Employees contributed capital to build PRC factories
Discount to book value
Roughly more than 1000 employees own about 40% of the company, which ensures Stella’s long term sustainability
6

Key Milestones
International outreachManufacturing focus Expansion to retail
1982: Established in Taiwan 2006: Opens first Stella Lunastore in Shanghai
2009: A global fashion brand –1982: Established in Taiwan
1991: Relocation to PRC
1998: First factory in Vietnam
2010: Diversified into inland China
2012: New Indonesian production line
2013: Invested in and developed our design and manufacturing capability for leather accessories, such as handbags
2014: Established footholds in Philippines and Myanmar
store in Shanghai
2007: Opens first What For store in Shanghai
2008: Opens 100th Stella Lunastore
2009: A global fashion brand –Stella Luna opens first non-East Asia store in Dubai
2011: Launches new men’s affordable luxury footwear brand –JKJY
2012: Opens first Stella Luna store in Paris
2013: Opens first What For store in Paris
7

FINANCIAL SUMMARY

Financial Performance
For the six-months ended 30 June
US$ mn
2017
(unaudited)
2018
(unaudited) Change
Revenue 762.4 739.3 -3.0%
Gross Profit 140.9 121.8 -13.6%
EBIT 31.5 26.8 -14.9%
Net Profit 28.5 22.9 -19.6%
EPS (US¢) 3.6 2.9 -19.4%
9
Adjusted EBIT 36.9 42.5 15.2%
Adjusted Net Profit 33.9 38.7 14.2%
Excluding one-off non-recurring items and impact from RMB appreciation in 1H 2018: US$15.8 million (2017: US$5.4 million)
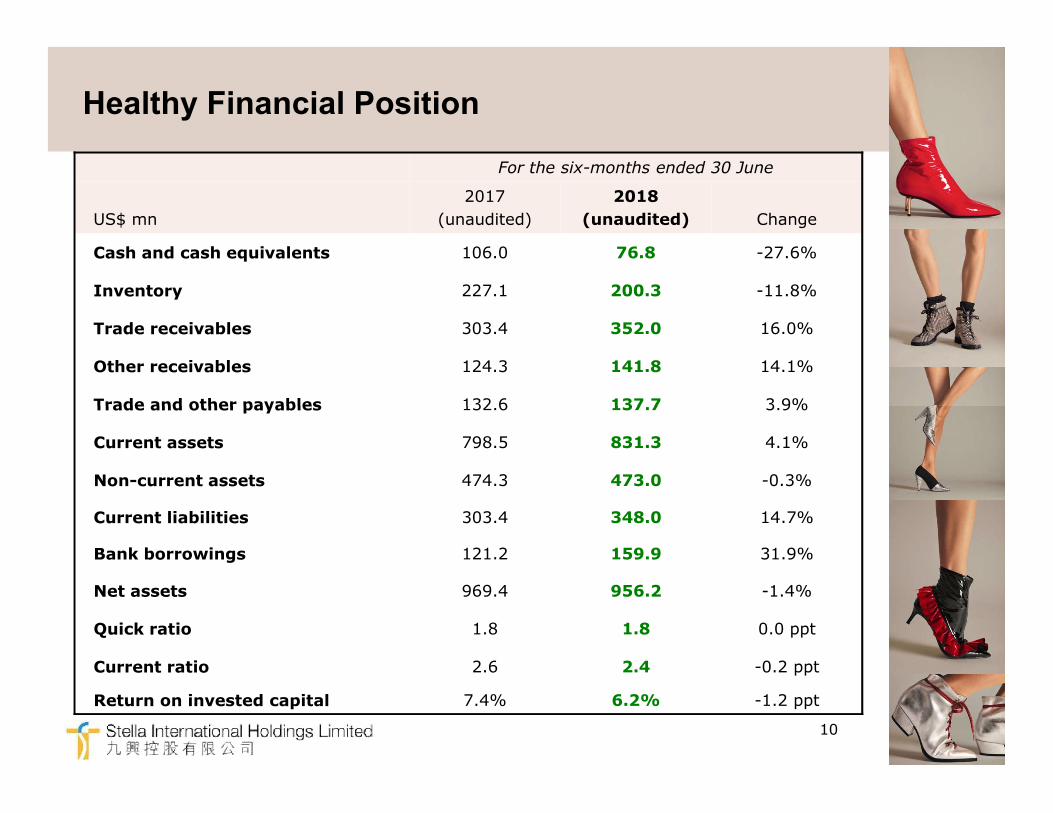
Healthy Financial Position
For the six-months ended 30 June
US$ mn
2017
(unaudited)
2018
(unaudited) Change
Cash and cash equivalents 106.0 76.8 -27.6%
Inventory 227.1 200.3 -11.8%
Trade receivables 303.4 352.0 16.0%
Other receivables 124.3 141.8 14.1%
Trade and other payables 132.6 137.7 3.9%Trade and other payables 132.6 137.7 3.9%
Current assets 798.5 831.3 4.1%
Non-current assets 474.3 473.0 -0.3%
Current liabilities 303.4 348.0 14.7%
Bank borrowings 121.2 159.9 31.9%
Net assets 969.4 956.2 -1.4%
Quick ratio 1.8 1.8 0.0 ppt
Current ratio 2.6 2.4 -0.2 ppt
Return on invested capital 7.4% 6.2% -1.2 ppt
10
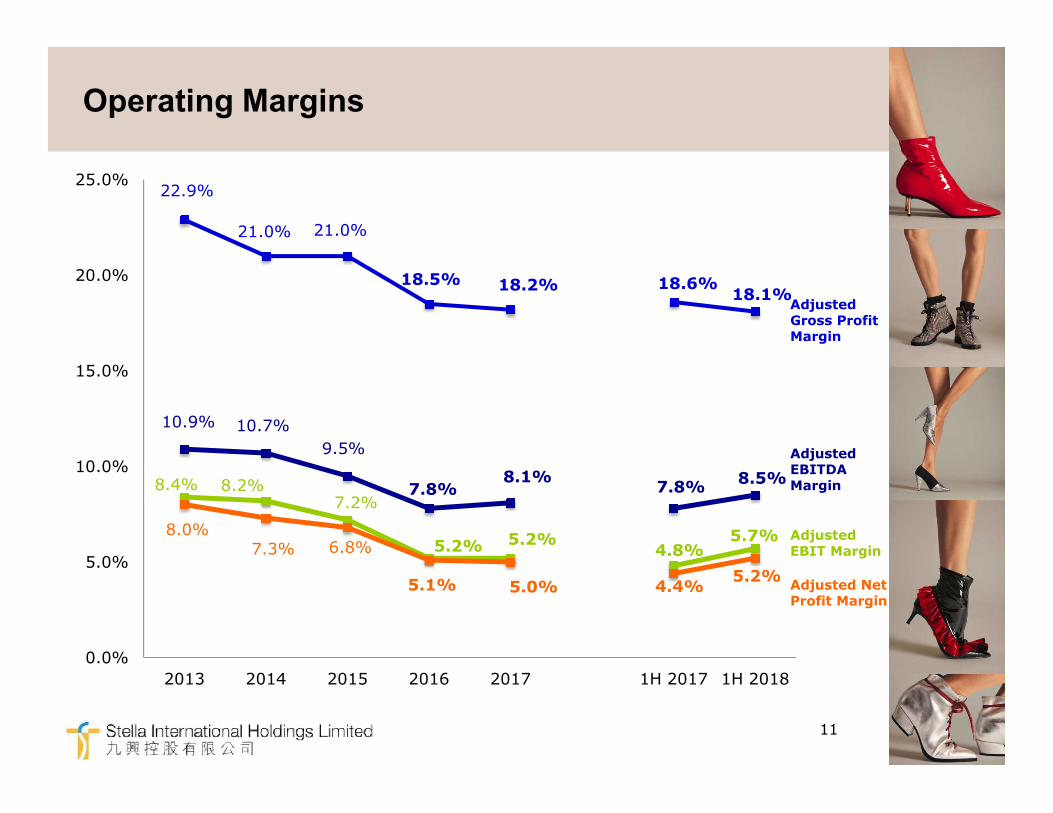
Operating Margins
22.9%
21.0% 21.0%
18.5% 18.2% 18.6%18.1%
15.0%
20.0%
25.0%
Adjusted Gross Profit Margin
10.9% 10.7%
9.5%
7.8%8.1%
7.8%8.5%8.4% 8.2%
7.2%
5.2% 5.2%4.8%
5.7%8.0%7.3% 6.8%
5.1% 5.0% 4.4%5.2%
0.0%
5.0%
10.0%
2013 2014 2015 2016 2017 1H 2017 1H 2018
11
Adjusted EBITDA Margin
Adjusted EBIT Margin
Adjusted Net Profit Margin

Operating Leverage
15.2% 11.8%
1.0% 0.6%2.9% 2.8%6.0% 6.5%
50%
75%
100%
Breakdown of Costs of Sale (as % of Revenue)
59.8% 62.7%
0%
25%
50%
1H 2017 1H 2018
Manufacture overhead Depreciation
Subcontracting costs Direct labour
Direct material/finished goods
12
*Manufacturing only

Summary of Cash Flow
For the six months ended 30 June
US$ mn
2017
(unaudited)
2018
(unaudited) Change
Cash flow used in operating activities
(55.6) (45.8) 17.6%
Cash flow used in investing activities
(22.6) (29.9) -32.3%
13
Capital Expenditure (23.5) (28.8) -22.6%
Others 0.9 (1.1) -222.2%
Cash flow from financing activities
76.7 64.8 -15.5%
Dividend paid (40.8) (30.4) 25.5%
Bank borrowings 117.7 96.7 17.8%
Others (0.2) (1.5) -650.0%
Net outflow of cash (1.5) (10.9) -626.7%

Interim Dividend in 2018
Earnings per share US 2.90 cents or HK 22.6 cents
14
Earnings per share US 2.90 cents or HK 22.6 cents
Interim dividend HK 30 cents

People Index
67,000
62,000
60,000
70,000
Size of Labour Force (FTE)
50,000
As at 30 June 2017 As at 30 June 2018
15
*Direct Labor Only; Annualized
For the six months ended 30 June
2017 2018
Turnover rate* 12.0% 16.8%

BUSINESS REVIEWManufacturing Business
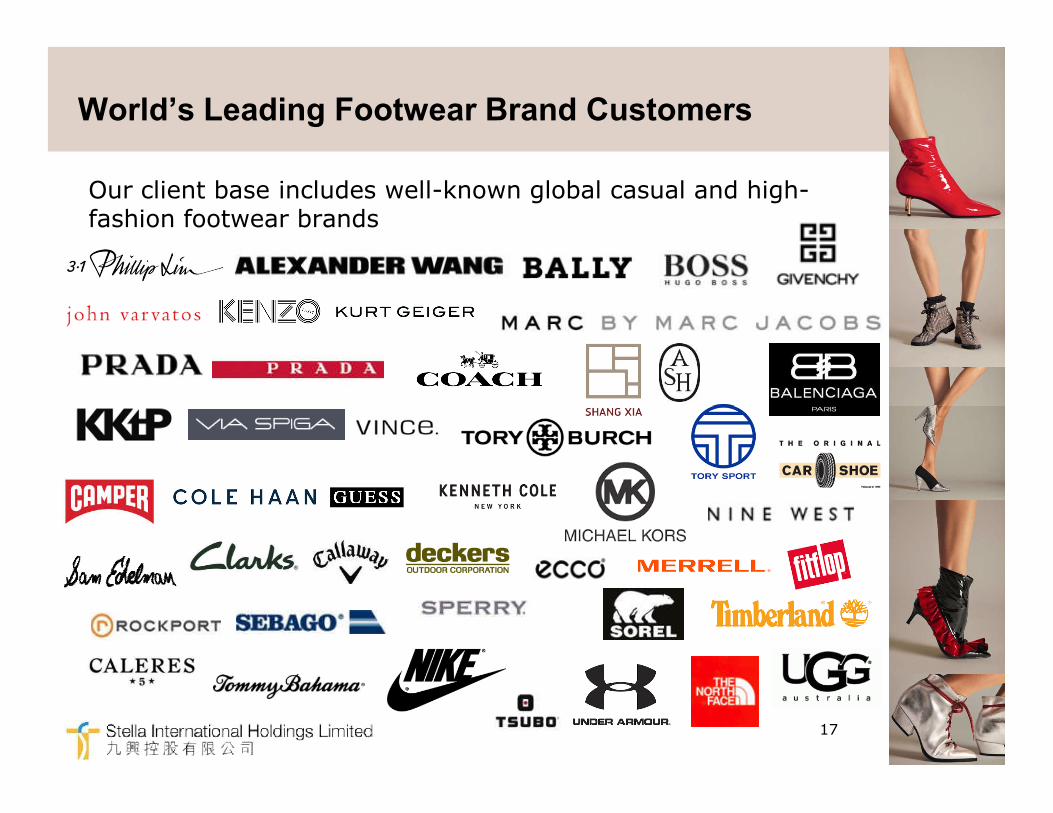
World’s Leading Footwear Brand Customers
Our client base includes well-known global casual and high-fashion footwear brands
17

1H 2017 Revenue
US$762.4 mn
Stable Geographic Breakdown
US$739.3 mn
1H 2018 Revenue
Asia (ex. PRC)7.6%
Other2.1%
PRC (inc. HK)
9.9%
Asia (ex. PRC)7.6%
Other2.9%
18
North America47.1%
Europe29.7%
PRC (inc. HK)
13.5% North America48.7%
Europe30.9%
9.9%

Breakdown by Business Type by Revenue
1H 2017 1H 2018
Casual 29.3%
Stella Brands 5.9%
Casual 31.1%Fashion
33.8%
Stella Brands 3.0%
19
Fashion Athletic 28.8%
Fashion 36.0%
Fashion Athletic 32.1%
33.8%

Stable Quantity & ASP Growth
Quantity • Higher shipment volume in 1H due to ongoing recovery in demand for fashion products, increased seasonal ordering activity for casual products and stabilisedordering activity
47.7 48.442.7
53.3 52.6 50.8 50.8 53.1 58.252.9 55.6
27.0 29.0
0
20
40
60
80
2007 2008 2009 2010 2011 2012 2013 2014 2015 2016 2017 1H 1H
(mn p
airs)
CAGR = 1.5%
20
ASP
ordering activity for our fashion athletic products
• Fall in ASP attributable to changes to our product mix and our customers’ product mix
2007 2008 2009 2010 2011 2012 2013 2014 2015 2016 2017 1H 2017
1H 2018
19.322.2 22.6 23.2
27.1 28.6 28.3 29.6 29.3 28.1 26.7 26.6 24.9
0
10
20
30
2007 2008 2009 2010 2011 2012 2013 2014 2015 2016 2017 1H 2017
1H 2018
(US$/p
air)
CAGR = 3.3%

Our Factories
Hebei• BDF• Weiyuan
Guangxi
Hunan• Shuangfeng• Shaoyang Liantai• Dongkou Selena• Longhui Stella
Factory Locations Capacity by Locations
China46%43%11%2018
Guangxi• Rongxian• Beiliu• Lingshan Dongguan
• Selena• Stella• Longchuan
• Hai Phong• Quang Ninh• Taiping• Nike VN
• Surabaya
• Bay Footwear
21
• Clark
Philippines
Bangladesh
Vietnam
Indonesia
58%31%11%2019 (planned)
Coastal China
Inland China Overseas

Labour Cost Index 2018
40
60
80
100 100
3639
71
53
28
22
Incentive 26 14 5 7 7 6
Fringe Benefits 19 15 3 9 2 5
Over Time 21 12 3 4 4 9
Basic 34 29 2533
14 20
Data as of 30 June 2018
-
20
DG Inland China Indonesia Vietnam Bangladesh Phillippines

BUSINESS REVIEWBranding Business

Our Retail Brand Positioning: Affordable Luxury
Basic Classic Modern Fashion
Luxury(US$400+)
Premium
Hig
her
En
d
24
Premium(US$121-400)
Mid-price(US$51-120)
Value(below US$50)
Contemporary

MEDIA EXPOSUREUS CELEBRITY
Gigi Hadid, American fashion model while out in New York.
Jennifer Lawrence, American actress while out in New Orleans.
Taylor Swift, American top singer-songwriter for the fashion shooting of Harper's Bazaar
USA.
25

MEDIA EXPOSUREINTERNATIONAL BLOGGER
26
Julie Sarinana, American fashion blogger
Amiee Song, American fashion blogger
Irene Kim, Korean fashion influencer

MEDIA EXPOSUREASIA CELEBRITY
27
Crystal Zhang, Chinese top actress Chiling Lin, Taiwanese top model Mi Yang, Chinese top actress

MEDIA EXPOSUREINTERNATIONAL MAGAZINE
ELLE FranceMarch Issue 2018
Madame FigaroMarch Issue 2018
28
Madame FigaroFebruary Issue 2018
Madame FigaroApril Issue 2018
ELLE FranceMarch Issue 2018

MEDIA EXPOSUREINTERNATIONAL MAGAZINE
Harper's Bazaar USAMarch Issue 2018
29
Glamour SpainFebruary Issue 2018

MEDIA EXPOSUREINTERNATIONAL MAGAZINE
30
Holiday MagazineSpring Summer Issue 2018
Vogue Germany March Issue 2018
Vogue TurkeyFebruary Issue 2018

OUTLOOK

Challenges and Opportunities
• Currency movement of RMB against USD
• Counter-party risk control and management
• Rising labour costs, labour turnover and unstable labour supply
Challenges
• Continue to benefit from:• Increasing ordering activity for fashion
athletic products• Increasing seasonal demand for casual
products• Recovery in demand for fashion products• Strategic changes to production allocation
to align with market demand
• Focus on increasing operational efficiency to
Opportunities and Strategies
32
• Unstable macro environment from political risks including the trade war between the US and China
• Focus on increasing operational efficiency to drive margin improvement
• Continue diversification of manufacturing base to overseas, primarily Vietnam, to control labourcosts and secure a stable workforce

SUPPLEMENTARYMATERIALS

World Premium Footwear Market –Our Target Market
Shoe Industry and Markets in Western Europe and Brazil(2017, million pairs)
m pairs/ USD Production Export price(leather only) (USD per pair)
Italy 191 65
France 22 66
Spain 102 38
Portugal 83 32
Germany 40 39
Great Britain 6 29
Stella 57 27
STELLA’s addressable market size: around 500 million pairs
34
Source: 2018 Yearbook, Portuguese Footwear, components and leather goods manufacturers’ association

THANK YOU