jpe industry
DESCRIPTION
JPE INDUSTRY REVIEW NIGHT Presented by: Hagop Tchamkertenian Manager, Industry & Commercial Policy Printing Industries Association of Australia. JPE INDUSTRY. REVIEW NIGHT. •. Developments in the. industry during financial. year 2002-2003 and. over recent years. •. Latest data from. - PowerPoint PPT PresentationTRANSCRIPT

JPE INDUSTRY REVIEW NIGHT
Presented by:Hagop Tchamkertenian
Manager, Industry &Commercial Policy
Printing IndustriesAssociation of Australia

JPE INDUSTRYREVIEW NIGHT
• Developments in theindustry during financialyear 2002-2003 andover recent years
• Latest data fromPrinting Industry TrendsReport and Industry Benchmarking study
• Industry Prospects for2004 and beyond
Compared to 2002 how was 2003? • Good • Average• Bad
Industry ConditionsHow good are
we doing?

Importance of Our Industry A Historical Context
A ranking of the 100 most influential persons in history shows:
• Ts’ai Lun inventor of paper at number 7
• Johann Gutenberg “father of printing” developer of movable type at number 8
• Gutenberg’s invention facilitated an easier exchange of ideas throughout Europe and helped spread the ideas of the Renaissance
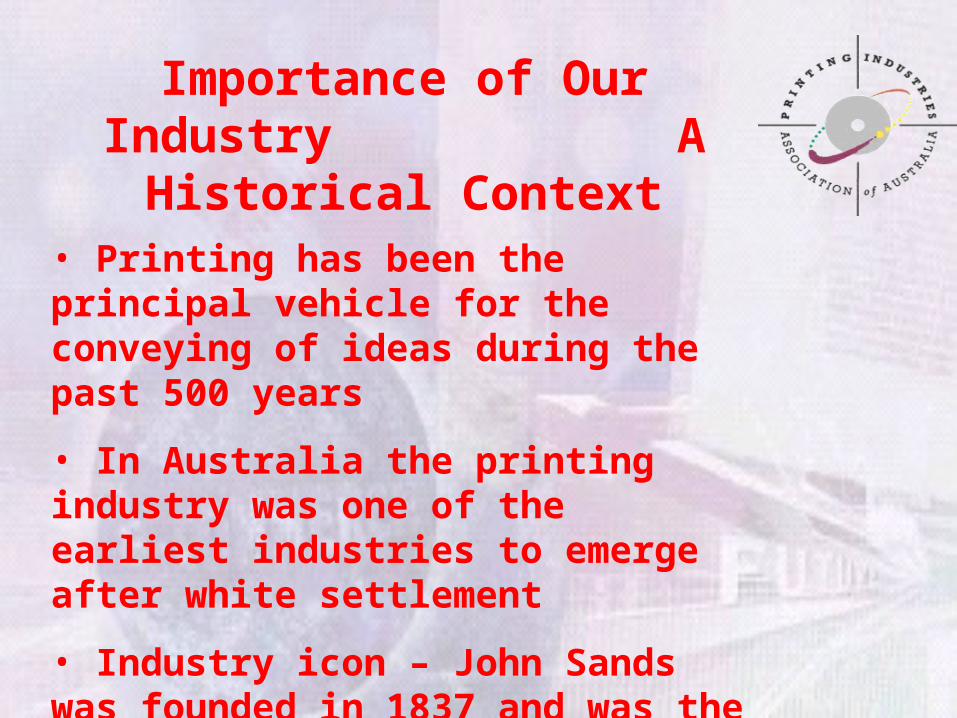
Importance of Our Industry A Historical Context
• Printing has been the principal vehicle for the conveying of ideas during the past 500 years
• In Australia the printing industry was one of the earliest industries to emerge after white settlement
• Industry icon – John Sands was founded in 1837 and was the 2nd company to be registered in Australia after the Bank of NSW

Industry Significance Current Demographics
• 5,000 plus firms
• Employment of more than 115,000
• Turnover of more than $17 billion
• Industry value added of more than $8.5 billion
• Exports of nearly $600 million
• Average annual capital expenditure of $724 million
• Physical presence in every region

Economic Growth 1993-2003
-40.0 -30.0 -20.0 -10.0 0.0 10.0 20.0 30.0 40.0 50.0 60.0
Food, beverage and tobacco
Textile, clothing, footwear
Wood and paper products
Printing, publishing and recorded media
Petroleum, coal, chemical, etc
Non-metallic mineral products
Metal products
Machinery and equipment
Other manufacturing
Total Manufacturing
Australian economy
Percentage change
How fast did we grow?
ABS Data

Economic Growth 12 months to December 2003
-8.0 -6.0 -4.0 -2.0 0.0 2.0 4.0 6.0
Food, beverage and tobacco
Textile, clothing, footwear
Wood and paper products
Printing, publishing and recorded media
Petroleum, coal, chemical, etc
Non-metallic mineral products
Metal products
Machinery and equipment
Other manufacturing
Total Manufacturing
Australian economy
Percent
How fast are we growing now?
ABS Data

Fastest Growing Sectors - 1993 to 2003
0.0 20.0 40.0 60.0 80.0 100.0 120.0
Communication services
Property & business services
Personal services
Wholesale trade
Finance & insurance
Accomodation, cafes & restaurants
Mining
Retail trade
Health & community services
Construction
Printing
Transport
Australian economy
Percent
Tortoise or hare?
ABS Data

Economic Growth - Printing
-4.0
-3.0
-2.0
-1.0
0.0
1.0
2.0
3.0
4.0
5.0
Dec
.199
3
Jun
.199
4
Dec
.199
4
Jun
.199
5
Dec
.199
5
Jun
.199
6
Dec
.199
6
Jun
.199
7
Dec
.199
7
Jun
.199
8
Dec
.199
8
Jun
.199
9
Dec
.199
9
Jun
.200
0
Dec
.200
0
Jun
.200
1
Dec
.200
1
Jun
.200
2
Dec
.200
2
Jun
.200
3
Dec
.200
3
Per
cen
tag
e ch
ang
e
Trend
Recession… technically speaking
ABS Data

Capital Expenditure - Printing
-30.0
-25.0
-20.0
-15.0
-10.0
-5.0
0.0
5.0
10.0
15.0
20.0
25.0
30.0
35.0
Dec
.199
3
Jun
.199
4
Dec
.199
4
Jun
.199
5
Dec
.199
5
Jun
.199
6
Dec
.199
6
Jun
.199
7
Dec
.199
7
Jun
.199
8
Dec
.199
8
Jun
.199
9
Dec
.199
9
Jun
.200
0
Dec
.200
0
Jun
.200
1
Dec
.200
1
Jun
.200
2
Dec
.200
2
Jun
.200
3
Dec
.200
3
Per
cen
tag
e ch
ang
e
Investment Trend Downward
ABS Data

Capital Expenditure
-30.0
-25.0
-20.0
-15.0
-10.0
-5.0
0.0
5.0
10.0
15.0
20.0
25.0
30.0
35.0
Dec
.199
3
Jun.
1994
Dec
.199
4
Jun.
1995
Dec
.199
5
Jun.
1996
Dec
.199
6
Jun.
1997
Dec
.199
7
Jun.
1998
Dec
.199
8
Jun.
1999
Dec
.199
9
Jun.
2000
Dec
.200
0
Jun.
2001
Dec
.200
1
Jun.
2002
Dec
.200
2
Jun.
2003
Dec
.200
3
Per
cen
tag
e ch
nag
e
PrintingAll industries
Contrasting Trends
ABS Data
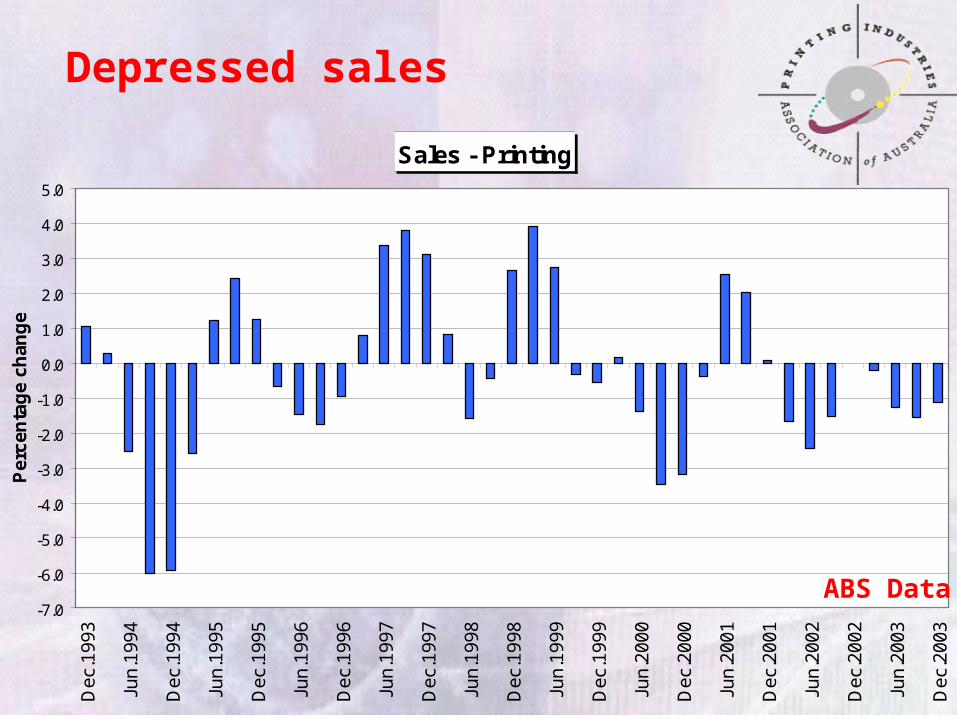
Sales - Printing
-7.0
-6.0
-5.0
-4.0
-3.0
-2.0
-1.0
0.0
1.0
2.0
3.0
4.0
5.0
Dec
.199
3
Jun
.199
4
Dec
.199
4
Jun
.199
5
Dec
.199
5
Jun
.199
6
Dec
.199
6
Jun
.199
7
Dec
.199
7
Jun
.199
8
Dec
.199
8
Jun
.199
9
Dec
.199
9
Jun
.200
0
Dec
.200
0
Jun
.200
1
Dec
.200
1
Jun
.200
2
Dec
.200
2
Jun
.200
3
Dec
.200
3
Per
cen
tag
e ch
ang
e
Depressed sales
ABS Data

Profits before tax - Printing
-14.0
-12.0
-10.0
-8.0
-6.0
-4.0
-2.0
0.0
2.0
4.0
6.0
8.0
10.0
12.0
14.0
16.0
Dec
.199
3
Jun
.199
4
Dec
.199
4
Jun
.199
5
Dec
.199
5
Jun
.199
6
Dec
.199
6
Jun
.199
7
Dec
.199
7
Jun
.199
8
Dec
.199
8
Jun
.199
9
Dec
.199
9
Jun
.200
0
Dec
.200
0
Jun
.200
1
Dec
.200
1
Jun
.200
2
Dec
.200
2
Jun
.200
3
Dec
.200
3
Per
cen
tag
e ch
ang
e
Booming profits? Read the fine print
ABS Data
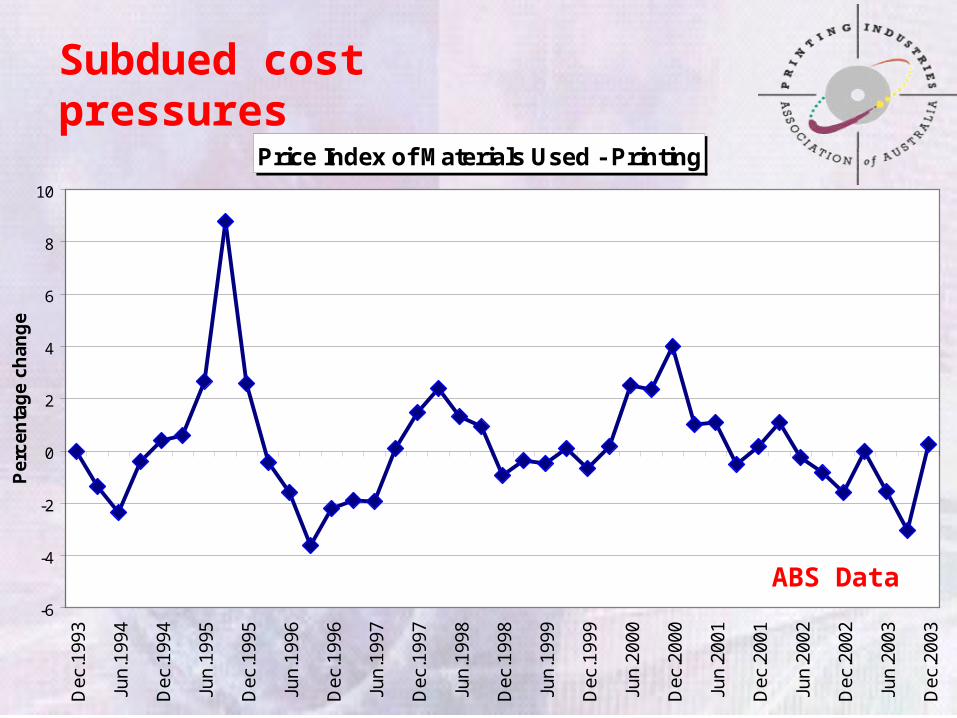
Price Index of Materials Used - Printing
-6
-4
-2
0
2
4
6
8
10
Dec
.199
3
Jun
.199
4
Dec
.199
4
Jun
.199
5
Dec
.199
5
Jun
.199
6
Dec
.199
6
Jun
.199
7
Dec
.199
7
Jun
.199
8
Dec
.199
8
Jun
.199
9
Dec
.199
9
Jun
.200
0
Dec
.200
0
Jun
.200
1
Dec
.200
1
Jun
.200
2
Dec
.200
2
Jun
.200
3
Dec
.200
3
Per
cen
tag
e ch
ang
e
Subdued cost pressures
ABS Data
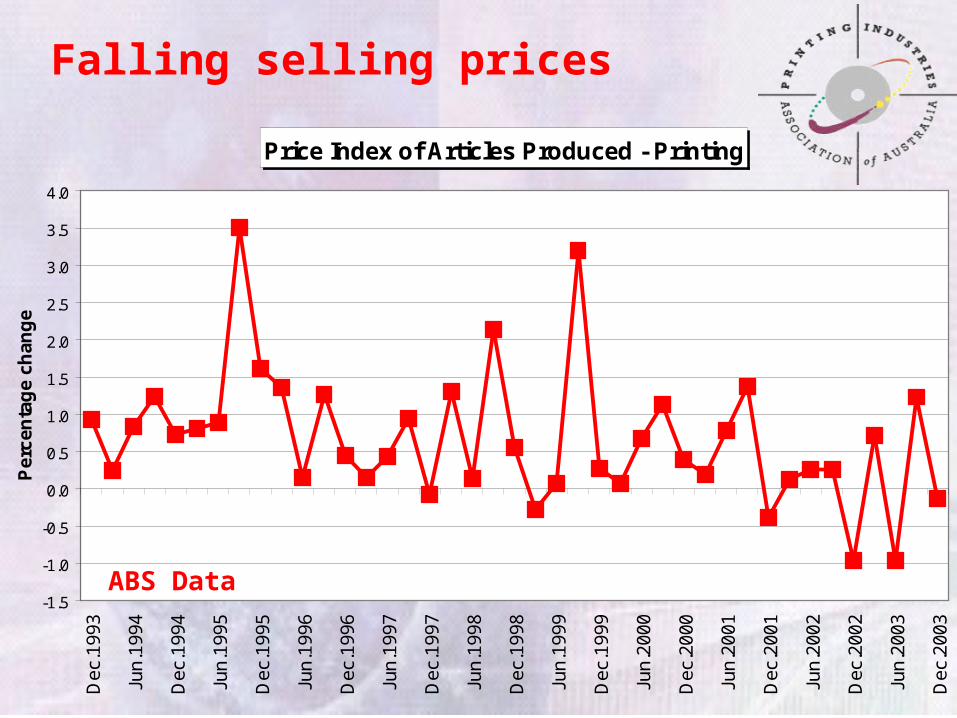
Price Index of Articles Produced - Printing
-1.5
-1.0
-0.5
0.0
0.5
1.0
1.5
2.0
2.5
3.0
3.5
4.0
Dec
.199
3
Jun
.199
4
Dec
.199
4
Jun
.199
5
Dec
.199
5
Jun
.199
6
Dec
.199
6
Jun
.199
7
Dec
.199
7
Jun
.199
8
Dec
.199
8
Jun
.199
9
Dec
.199
9
Jun
.200
0
Dec
.200
0
Jun
.200
1
Dec
.200
1
Jun
.200
2
Dec
.200
2
Jun
.200
3
Dec
.200
3
Per
cen
tag
e ch
ang
e
Falling selling prices
ABS Data

Price Index - Printing
-5.0
-3.0
-1.0
1.0
3.0
5.0
7.0
9.0
Dec
.199
3
Jun.
1994
Dec
.199
4
Jun.
1995
Dec
.199
5
Jun.
1996
Dec
.199
6
Jun.
1997
Dec
.199
7
Jun.
1998
Dec
.199
8
Jun.
1999
Dec
.199
9
Jun.
2000
Dec
.200
0
Jun.
2001
Dec
.200
1
Jun.
2002
Dec
.200
2
Jun.
2003
Dec
.200
3
Pec
ren
tag
e ch
ang
e
Articles producedMaterials used
Margins once again tighten
ABS Data

Business Expectations - Printing
-20
-10
0
10
20
30
40
50
60
D'9
3
J'94
D'9
4
J'95
D'9
5
J'96
D'9
6
J'97
D'9
7
J'98
D'9
8
J'99
D'9
9
J'00
D'0
0
J'01
D'0
1
J'02
D'0
2
J'03
D'0
3
Bal
ance
%
Business expectations remain positive
Printing Industry Trends data

Capital Expenditure Intentions - Printing
-15
-10
-5
0
5
10
15
20
25
30
D'9
3
J'94
D'9
4
J'95
D'9
5
J'96
D'9
6
J'97
D'9
7
J'98
D'9
8
J'99
D'9
9
J'00
D'0
0
J'01
D'0
1
J'02
D'0
2
J'03
D'0
3
Bal
ance
%
Investment intentions strengthen
Printing Industry Trends data

Capacity Utilisation Index
50
60
70
80
90
100
Dec
Q94
JunQ
95
Dec
Q95
JunQ
96
Dec
Q96
JunQ
97
Dec
Q97
JunQ
98
Dec
Q98
JunQ
99
Dec
Q99
June
Q00
Dec
Q00
JunQ
01
Dec
Q01
JunQ
02
Dec
Q02
JunQ
03
Dec
Q03
Per
cen
t
Utilisation rates improve
Printing Industry Trends data

Primary Barrier to Increased Production - Orders
40
45
50
55
60
65
70
75
80
85
90
95
100
D'9
3
J'94
D'9
4
J'95
D'9
5
J'96
D'9
6
J'97
D'9
7
J'98
D'9
8
J'99
D'9
9
J'00
D'0
0
J'01
D'0
1
J'02
D'0
2
J'03
D'0
3
Per
cen
t
Lack of orders less of a problem
Printing Industry Trends data

Level of Production
-50
-40
-30
-20
-10
0
10
20
30
40
50
60
D'00 M'01 J'01 S'01 D'01 M'02 J'02 S'02 D'02 M'03 J'03 S'03 D'03 M'04
Bal
ance
%
ActualExpected
Production improves
Printing Industry Trends data

Level of Sales
-50
-40
-30
-20
-10
0
10
20
30
40
50
D'00 M'01 J'01 S'01 D'01 M'02 J'02 S'02 D'02 M'03 J'03 S'03 D'03 M'04
Bal
ance
%
ActualExpected
So does sales
Printing Industry Trends data

Selling Prices
-40
-30
-20
-10
0
10
20
30
D'00 M'01 J'01 S'01 D'01 M'02 J'02 S'02 D'02 M'03 J'03 S'03 D'03 M'04
Bal
ance
%
ActualExpected
Selling prices fall
Printing Industry Trends data

Net Profits
-60
-50
-40
-30
-20
-10
0
10
20
30
40
D'00 M'01 J'01 S'01 D'01 M'02 J'02 S'02 D'02 M'03 J'03 S'03 D'03 M'04
Bal
ance
%
Actual Expected
Profits improve
Printing Industry Trends data

Number of Outstanding Debtors
0
5
10
15
20
25
30
35
40
D'00 M'01 J'01 S'01 D'01 M'02 J'02 S'02 D'02 M'03 J'03 S'03 D'03 M '04
Bal
ance
%
ActualExpected
Debtors profile worsens
Printing Industry Trends data

Profit Margin Index
12.6
8.5
3.3
-2.1
-7.4
13.0
7.9
2.4
-1.9
-8.6
11.7
7.5
3.5
0.2
-7.5
-10.0
-5.0
0.0
5.0
10.0
15.0
Highest 10% Highest 25% Median Lowest 25% Lowest 10%
Per
cen
t
200020012002
Low margins
Benchmarking data

ROTA
20.8
14.9
5.5
1.2
-11.0
-15.0
-10.0
-5.0
0.0
5.0
10.0
15.0
20.0
25.0
Highest 10% Highest 25% Median Lowest 25% Lowest 10%
Per
cen
t
For many printing ≠ good returns
Benchmarking data

Sales Index
0
20
40
60
80
100
120
140
160
Highest 10% Highest 25% Median Lowest 25% Lowest 10%
Per
cen
t
200020012002
Benchmarking data
Up for some, down for others

Value Added Component of Sales
0.0
10.0
20.0
30.0
40.0
50.0
60.0
70.0
80.0
90.0
Highest 10% Highest 25% Median Lowest 25% Lowest 10%
Per
cen
t
The key to profitability
Benchmarking data

Chargeable Proportion of Direct Labour Costs
0
10
20
30
40
50
60
70
80
90
100
Highest 10% Highest 25% Median Lowest 25% Lowest 10%
Per
cen
t
The higher the better
Benchmarking data

Effective Capacity Utilisation Rates
19
14
9
63
51
24
13
54
30
20
14
9
29
47
16
0
10
20
30
40
50
60
70
Highest 10% Highest 25% Median Lowest 25% Lowest 10%
Per
cen
t
pre-pressprintingbind/fin
Does idle capacity await you?
Benchmarking data

Cash flow gap – 26 days!
Cashflow Management
35
12
68
82
55
44
19
52
39
29
0
10
20
30
40
50
60
70
80
90
Highest 10% Highest 25% Median Lowest 25% Lowest 10%
Day
s
Average debtor daysAverage creditor days
Cas
h f
low
gap
Benchmarking data

INDUSTRY FORECASTSPaper and Paper Product Manufacturing
2004-2005 2005-2006
Employment -4.0 0.5
Production 0.0 2.6
Local Sales 0.1 0.9
Printing and Services to Printing
2004-2005 2005-2006
Employment 11.6 1.7
Production -0.7 1.9
Local Sales -0.6 1.8
Publishing
2004-2005 2005-2006
Employment 11.6 1.7
Production 2.5 5.2
Local Sales 2.4 4.7
Source: Econtech

• Improvements in printing industry economic conditions anticipated during 2004 • Pick up expected in advertising expenditure• 2004 is an election year• Further rationalisation and industry consolidation inevitable• Possible improvements in capacity utilisation rates• Possible reversal in labour force downsizing
Forecasts and Prospects

• Exports and import replacement efforts will remain at the mercy of currency movements• Currency probably has reached its peak and will begin to depreciate
•Capital expenditure likely to continue recent trend meaning it is unlikely to reach past peaks•Selling prices to continue to be driven down for traditional areas of printing • Targeted customisation campaigns to continue to overtake mass marketing campaigns• Benchmarking takes off!!!
Forecasts and Prospects

Compared to 2003 how will 2004 be?• Good• Average• Bad
Industry Expectations:How well are we going to do?