j.p. morgan thailand conference 2012 - listed...
TRANSCRIPT

1 Investor Relations Department
THAI AIRWAYS INTERNATIONAL PCLTHAI AIRWAYS INTERNATIONAL PCL
http://www.thaiairways.com/about-thai/investor-rela tions/en/investor.html
February 2, 2012
J.P. Morgan J.P. Morgan ’’s Thailand Conference 2012s Thailand Conference 2012

2 Investor Relations Department
DISCLAIMER
The information contained herein is intended to represent the Company’s operating and financial position at a given point in time and may also contain forward looking information which only reflects expectations based on the prevailing geo-political, economic and non-controllable factors. Such information has been obtained from sources believed to be most reliable and the means in analyzing and preparation of such information for disclosure are based on approved practices and principles in the investment industry. The views are based on assumptions subject to various risks and uncertainties and no assurance is made as to whether such future events will occur, that projections will be achieved, or that the assumptions here-in are correct. Consequently no assurance is made as to the accuracy or completeness of information presented in this document.
This document should not be construed as an investm ent guide or as an offer or solicitation of an offer to buy or sell the Company ’s equity shares.

3 Investor Relations Department
MINISTRY OF
FINANCE, 51.03%
VAYUPAK (MFC),
7.56%
VAYUPAK (KTAM),
7.56%
NVDR, 4.57%
GOVERNMENT
SAVING BANK
2.39%
THE BANK OF NEW
YORK MELLON,
1.33%
NORBAX INC., 13,
1.05%
HSBC
(SINGAPORE)
NOMINEES PTE
LTD, 0.87%
STATE STREET
BANK AND TRUST
COMPANY,
0.72%
OTHERS, 22.92% Thailand’s National Flag Carrier
51% directly, 68% indirectly owned
by the Royal Thai Government
Market Capitalization:
1,397 MUSD(As of Jan 2012)
As of Mar 11
Major ShareholdersMajor Shareholders
Company Facts

4 Investor Relations Department
Business Unit
Company Facts

5 Investor Relations Department
Airline PortfolioAirline Portfolio
49%55%
Thailand
Company Facts
Premium Services Airline
49% 49% 49%

6 Investor Relations Department
By Purpose of tripBy Nationality
(As of 3Q/2011)
Customer Breakdown
Others48% European
22%
Thai30% Holiday
46%Business39%
Personal Trip 15%

7 Investor Relations Department
Factors Affecting Aviation Business
Factors of Concern
ASEAN Open Sky and
Liberalization Policy
Competition fromLCCs / Traditional Airlines /
New Full Network Carriers
Rapid Rise inFuel Price
Rate of EconomicGrowth
FX Fluctuation
EU Carbon Emissions Guideline
New Aircraft
Technology/Trend
Natural Disasters
Availability of New Aircraft Acquisition,
Aging Fleet & Seat
THAI is taking precautionary actions to mitigate all risk factors
Global Politics Health
Availability of Aircraft Financing

8 Investor Relations Department
Snap Shot
Jan.-Sept. 2011 MTHB USD mn.
Equiv.% Change (YoY)
Assets 277,044 8,894 -1.5%
Total Revenue 147,371 4,731 + 9.3%
Net Profit (Exclude FX) - 1,484 - 48 - 132.0%
89*# of Aircraft
Destinations Served 72
Countries Served 35
*Excluding 6 B 737-400 leased to Nok Air
2011 Jan.-Dec. % Change YoY
Passenger carried (Million) 18.4 +1.3%
Million Revenue Passenger Kilometers (MRPK)
55,267 -0.7%
Freight carried (tons) 689,640 -3.4%
Million Revenue Freight Ton Kilometers (MRFTK)
2,766 -4.4%

9 Investor Relations Department
(E) 3.12
9.89
56.2
2,766
4,919
2.75
70.4
55,267
78,533
Jan.-Dec. 2011
2.25
9.50
61.5
2,895
4,708
2.57
73.6
55,676
75,600
Jan.-Dec. 2010
+31.4
+4.1%
-8.5
-14.0
-6.1
+7.0%
-12.0%
-11.0%
+1.1%
% Change
Units 4Q/2011 4Q/2010 % Change
Passenger Production MASK 19,953 19,734 +3.9%
Passenger Traffic MRPK 12,968 14,569 -0.7%
Cabin Factor % 65.0 73.8 -4.4%
Passenger Yield* THB/km 2.75(Jan-Dec)
2.57(Jan-Dec)
+7.0%
Freight Production MADTK 1,210 1,288 +4.5%
Freight Traffic MRFTK 669 778 -4.4%
Freight Factor % 55.3 60.4 -8.6%
Freight Yield* THB/km 9.89(Jan-Dec)
9.50(Jan-Dec)
+4.1%
Avg. Fuel Cost USD/gallon (E) 3.14 2.39 +38.7%
Operating Summary
Note : Yield includes fuel surcharge
10 Investor Relations Department
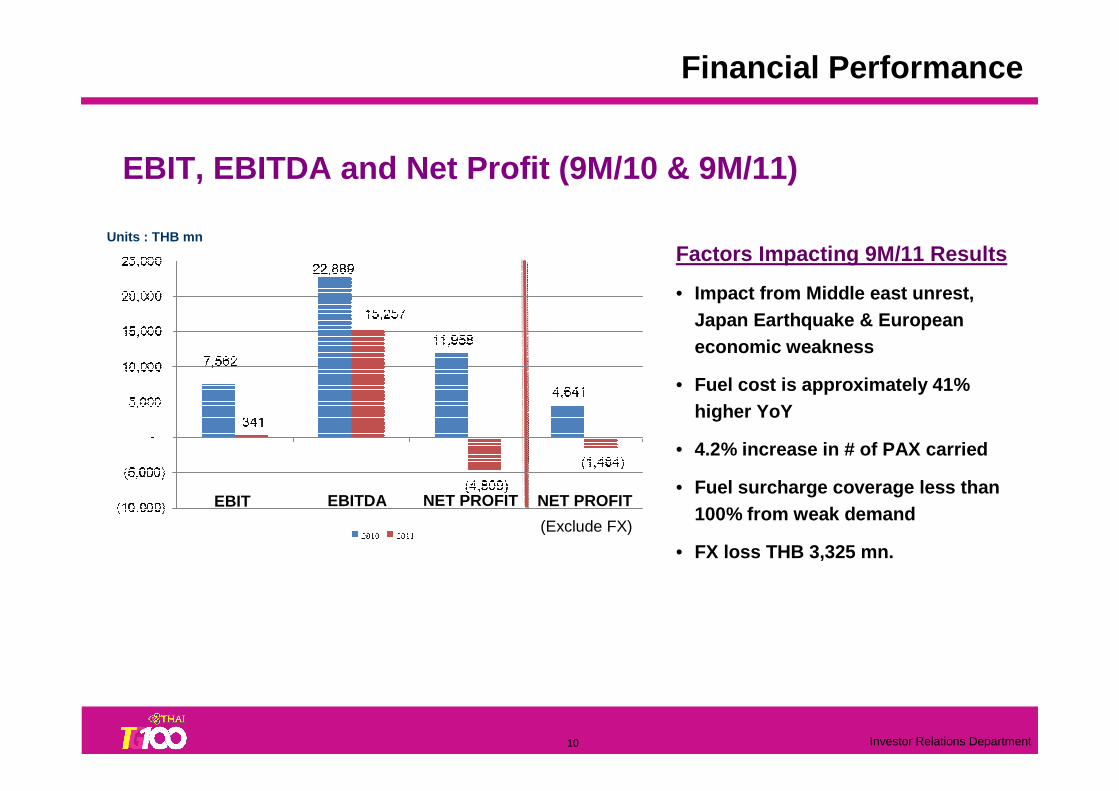
EBIT, EBITDA and Net Profit (9M/10 & 9M/11)
Units : THB mn
Financial Performance
(Exclude FX)
EBIT EBITDA NET PROFIT NET PROFIT
Factors Impacting 9M/11 Results
• Impact from Middle east unrest, Japan Earthquake & European economic weakness
• Fuel cost is approximately 41% higher YoY
• 4.2% increase in # of PAX carried
• Fuel surcharge coverage less than 100% from weak demand
• FX loss THB 3,325 mn.
11 Investor Relations Department
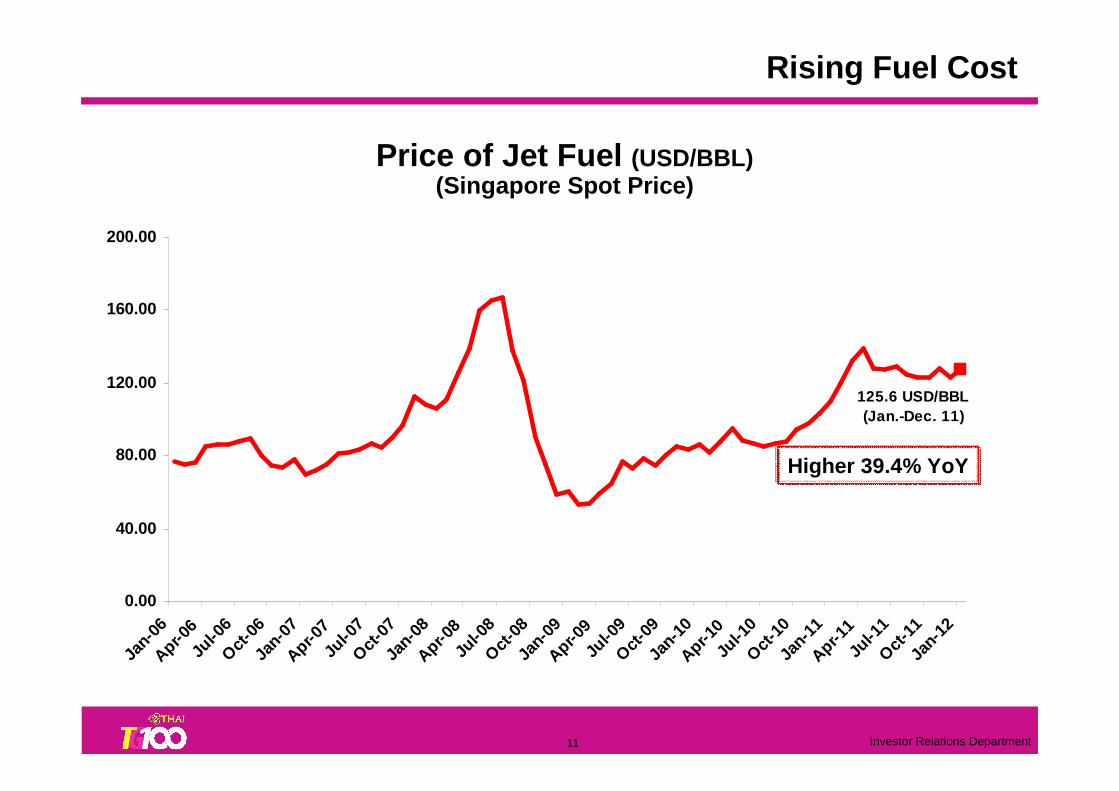
Rising Fuel Cost
125.6 USD/BBL(Jan.-Dec. 11)
0.00
40.00
80.00
120.00
160.00
200.00
Jan-
06Ap r-0
6Ju
l-06
Oct-0
6Ja
n-07
Ap r-07
Jul -0
7Oct
-07
Jan-
08Ap r-0
8Ju
l -08
Oct-08
Jan-
09Ap r-0
9Ju
l-09
Oct-0
9Ja
n-10
Ap r-10
Jul-1
0Oct
-10
Jan-
11Ap r-1
1Ju
l -11
Oct-11
Jan-1
2Price of Jet Fuel (USD/BBL)
(Singapore Spot Price)
Higher 39.4% YoY

12 Investor Relations Department
Revenue
Passenger revenue * = 138,345 MTHB
By Class By Area
Jan.-Nov. 2012
* Schedule flight only
Business class21.1%
Premium economy class1.2%First class
1.6%
Economy class76.1%
Europe30.6%
Australia10.7%
Middle East1.5%
North Pacific2.4% Africa
0.8%
Southern7.6%
Northern26.4%
Domestic9.3%
W estern8.2%
Indo-China2.4%

13 Investor Relations Department
Total passengers in 2011 = 16.8 mn.
# of PAX
By Class By Area
Total passengers in 2010 = 16.8 mn.
Indo-China4.8%
W estern9.9%
Domestic29.2%
Northern25.6%
Southern8.9%
Non-Schedule0.3%
Africa0.4%
North Pacific0.7%Middle East
1.3%
Australia5.8%
Europe13.1%
Jan.-Nov. 2012
Economy class87.6%
Non Revenue3.1%
First class0.3%
Premium economy class0.3%
Business class8.7%

14 Investor Relations Department
Competitors Have Increased Significantly
Low Cost Carriers
Newly established full service airlines
Traditional full service airlines

15 Investor Relations Department
0
5
10
15
0
5
10
15
20
25
Domestic Market Regional Market
39.8%
45.2%
15.0%
33.2%
19.1%
47.6%
-2.3%
32.4%
7.4%
Avg. Growth Rate (2003-2010)
3.2%
46.8%
4.4%
83.8%
16.2%
42.2%
55.7%
2.1%
Mn Passengers Market Share Market Share
Market Share of LCCs Up Dramatically
Mn Passengers
Avg. Growth Rate (2003-2010)
2003 2010 2003 2010
THAI Airways
LCCs
THAI Airways
Others
LCCs
Others

16 Investor Relations Department
Middle East HUBEtihadEmiratesQatar
New Strong Competitors from Middle East

17 Investor Relations Department
Pacific
Pacific
LCC Fleet Order
AirAsia 106 284
Cebu Pacific 33 55
Indigo 43 232
Jetstar 79 32
Lion Air 65 360
Silk Air 19 -
SpiceJet 34 44
Tiger Airways 17 -
Total 396 1,007
THAI surrounded by LCC THAI surrounded by LCC
Note:
• Fleets shown only effected to THAI
• Leased aircraft not included

18 Investor Relations Department
Competitors’ Fleet Expansion Plan
Existing/Awaiting delivery 15/75 -/5 -/10 11/8 - -/6 -/4 -/6
Competitors’ Fleet and Expansion Plan
0
50
100
150
200
250
300
350
400
EmiratesQatar
EtihadSingapore
CathayMalaysia
VietnamTHAI
Existing
Awaiting delivery
Number
A380

19 Investor Relations Department
2009
2010
2011
2012
2013-2017 Ensure strength
and stability
- Emphasize Customer Value
- Ensure Competitiveness
- Ensure DynamismStrengthen internal Strengthen internal organizationorganization
Build strategic Build strategic competitivenesscompetitiveness
Seek growth Seek growth opportunitiesopportunities
Build operational stabilityBuild operational stability
Overarching Strategic Plan

20 Investor Relations Department
Strategic Roadmap
Overall Strategic Roadmap
Ultimate Goal
“Restore THAI to be the pride of
Thailand around the world,
as a leading Asian carrier
that is consistently
among the top 3 carriers in Asia and top 5 in the
world
for overall customer
experience”
Competitive
Customer-oriented
Dynamic
Core Value
“Striving together towardsa strong and sustainable
THAI”Customer Value Strategy
Commercial Strategy
Corporate Portfolio Strategy
Corporate Social Responsibility Strategy
Strategic Transformation Areas
Route Network and Fleet Strategy
Human Capital & Organization Effectiveness Strategy
Efficiency, Flight Safety and Fuel Management Strategy
Financial Strategy
IT Strategy
1
2
3
4
5
6
7
8
9
21 Investor Relations Department
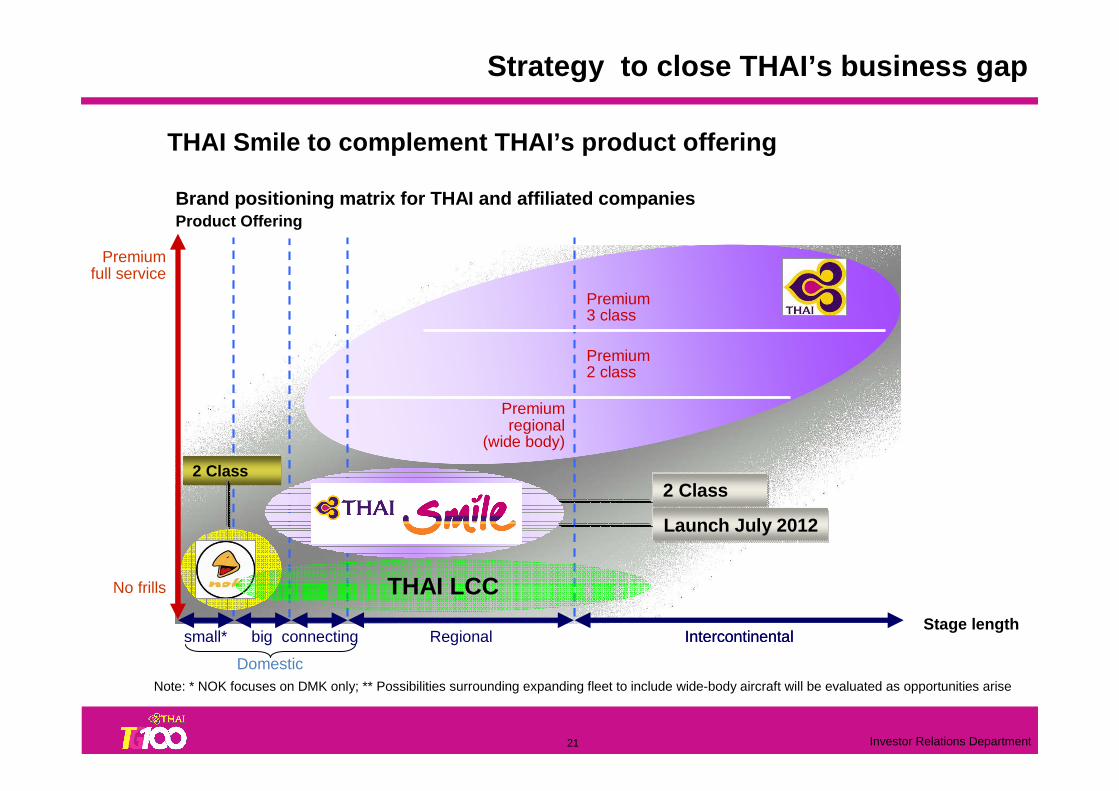
THAI Smile to complement THAI’s product offering
Brand positioning matrix for THAI and affiliated co mpanies
Note: * NOK focuses on DMK only; ** Possibilities surrounding expanding fleet to include wide-body aircraft will be evaluated as opportunities arise
Product Offering
Stage lengthsmall* Regional Intercontinentalconnecting
Premium 2 class
Premium 3 class
Premium regional
(wide body)
Domestic
No frills
Premiumfull service
big
Strategy to close THAI’s business gap
Intercontinental
THAI LCC
Launch July 2012
2 Class2 Class

22 Investor Relations Department
LOW to MEDIUM
• Domestic focus with some added value and maintaining very low cost
Domestic value-for-moneycarrier
LOW to MEDIUM
• Low cost base achieved through aspects of LCC model, such as single aircraft type, new fleet, etc.
MEDIUM to HIGH
• Minor improvements could be made in cost efficiency
Cost base
Regional carrier
Premium network carrier
Brand positioningBrand
Product by Cost Base
THAI’s Portfolio

23 Investor Relations Department
Reliable Reliable
EnjoyableEnjoyable
ValuableValuable
TrendyTrendy
FriendlyFriendly
WorthyWorthy
Good PriceGood Price
High ValueHigh Value
Affordable Affordable
Light Light
PremiumPremium
Positioning Differentiation Character Value
BRANDBRAND
THAI Smile’s first flight will commence on July 1st , 2012 after receiving first brand new aircraft in June 20 12
THAI Smile’s Strategies
Brand new narrow body aircraft
# of aircraft
Fleet Plan(2012F-18F)
4
6
8
11
11
11
11
2012
2013
2014
2015
2016
2017
2018

24 Investor Relations Department
Route Network and Fleet Strategy
Bangkok
Chiangmai
Phuket
Bangkok
Singapore
Mae Hong Son
Surat Thani
Mae Sot Nan
Phitsanulok
LoeiUdon Thani
Nakon Phanom
TrangHat Yai
Narathiwat
Nakon Si Thammarat
Sakon Nakhon
Ubon Ratchathani
Buri Ram
Roi Et
DMK
MacauHyderabad
Shenzhen
Kochi
Kullalumpur
Luang PrabangYangon
Phuket
Nok Air base at DMK,operates only domestic point-to-point.
THAI Smile base at BKK,operates in domestic and regional secondary routes and synchronize with TG network.
Nok Air & THAI Smile Routes Network
Hyderabad
Amedabad
Danang
Seoul
HongKong
Penang

25 Investor Relations Department
Competition for THAI Smile
Full-service carriersRegional FSCLow-cost carriers
26 Investor Relations Department
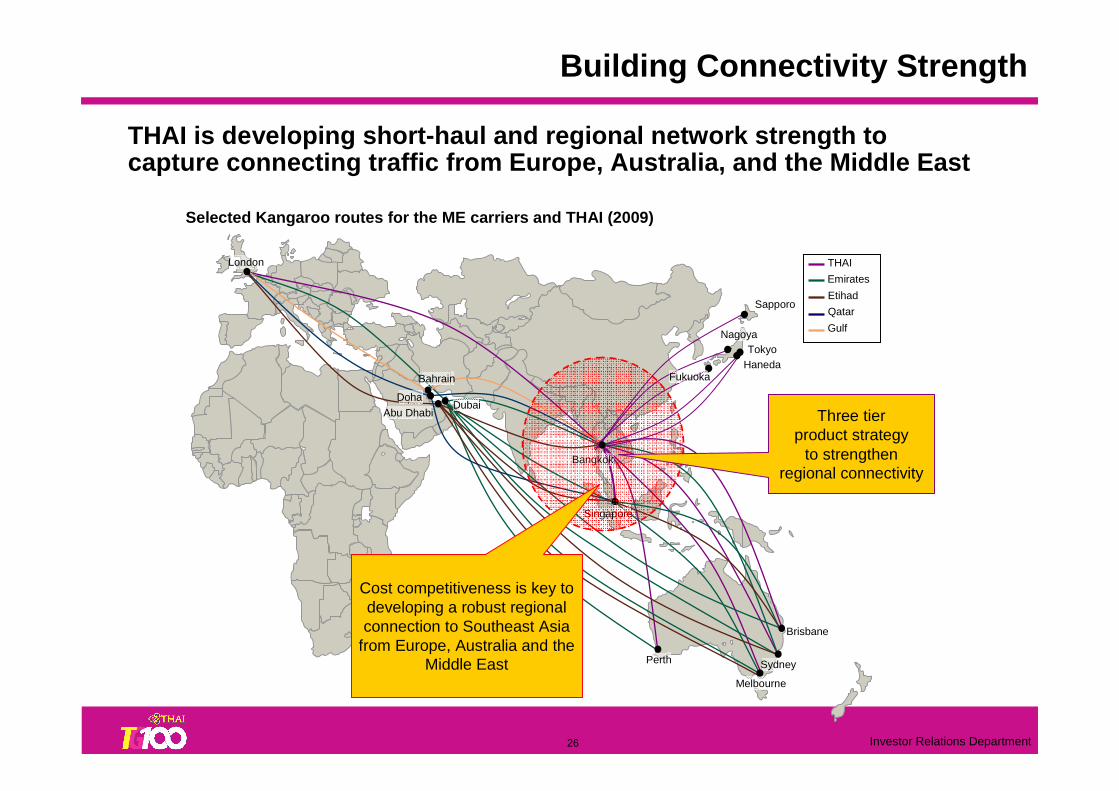
THAI is developing short-haul and regional network strength to capture connecting traffic from Europe, Australia, and the Middle East
Selected Kangaroo routes for the ME carriers and TH AI (2009)
THAI
Emirates
Etihad
Gulf
Qatar
Bangkok
Sydney
Melbourne
Perth
Singapore
Brisbane
London
Abu DhabiDubai
Doha
Bahrain
Cost competitiveness is key to developing a robust regional connection to Southeast Asia
from Europe, Australia and the Middle East
Building Connectivity Strength
Sapporo
TokyoHaneda
Nagoya
Fukuoka
Three tier product strategy
to strengthen regional connectivity

27 Investor Relations Department
Ongoing enhancement and improvement in products and services at all touch points and the use of KPIs to ensure consistent qual ity service
Building Customer Value
Call Center
Premium Lounges
Increase Selection of Entertainment
Food & Beverage Minimize Time for Baggage Claim
Royal Orchid PlusE-ServiceInternet check-in with
home print boarding pass

28 Investor Relations Department
0
1
2
3
4
5
6
7
8
9
10
Jan Feb Mar AprMay Jun JulAugSep OctNovDEC
%
0
1
2
3
4
5
6
7
8
JanFebMar AprMayJun Ju lAugSepOct NovDec
%
Year 2010
Year 2009
Year 2011
Statistic on Internet Check-in
Year 2011
Year 2010
Year 2009
Check-in via Internet Ticket Sales Via Internet

29 Investor Relations Department
57 201 373 294499 407
1,1361,300
1,813
2,3092,321 2,368
3,310 3,088
3,812 3,811
3,353
0
500
1,000
1,500
2,000
2,500
3,000
3,500
4,000
Jul-10
Aug-10
Sep-10
Oct-10
Nov-10
Dec-10
Jan-11
Feb-11
Mar-11
Apr-11
May-11
Jun-11
Jul-11
Aug-11
Sep-11
Oct-11
Nov-11
Check-in via Mobile (http://m.thaiairways.com )
# of PAX
Statistic on use of E-Services

30 Investor Relations Department
Current Fleet: 89 Aircraft51% of O 9% of OL 40% of F LO=Owned OL=Operating lease FL=Financial lease
Exc. 2 of ATR-724 of 737-400
leased to Nok
(Note: Approximately)
Current Fleet
(Note: N.A.. = Not available)
First Business Premium Economy Economy Total
36R1 6 N.A. 46 N.A. 201 247
3452 5 N.A. 28 N.A. 232 260
A340-500 3452 4 N.A. 60 42 113 215 1 O, 3 FL
A340-600 3461 6 8 60 N.A. 199 267 6 FL
3302 12 N.A. 42 N.A. 263 305
3303 10 N.A. 36 N.A. 263 299
B737-400 7341 5 N.A. 12 N.A. 137 149 2 FL, 3 OL
7442 6 14 50 N.A. 325 389
7443 10 10 40 N.A. 325 375
B777-200 7723 8 N.A. 30 N.A. 279 309 6 O, 2 OL
B777-200ER 77E1 6 N.A. 30 N.A. 262 292 6 FL
7732 5 N.A. 34 N.A. 330 364
7732 TKE 1 N.A. 34 N.A. 325 359
B777-300ER 7739 5 8 30 N.A. 274 312 5 OL
Total 89 40 532 42 3,528 4,142 39 O, 38 FL, 12 OL
6 FLB777-300
11 O
10 O, 10 FL ,2 OL
11 O, 5 FL
A300-600
A330-300
B747-400
Aircraft Type Version# of
AircraftFinancial Method
# of Seat

31 Investor Relations Department
Hours / Day / Aircraft
Aircraft Utilization
Aircraft Utilization
12.612.3 12.4
11.811.5
11.3 11.411.2 11.3 11.3 11.4
10.0
10.5
11.0
11.5
12.0
12.5
13.0
Jan Feb Mar Apr May Jun Jul Aug Sep Oct Nov Dec
2009 2010 2011
32 Investor Relations Department
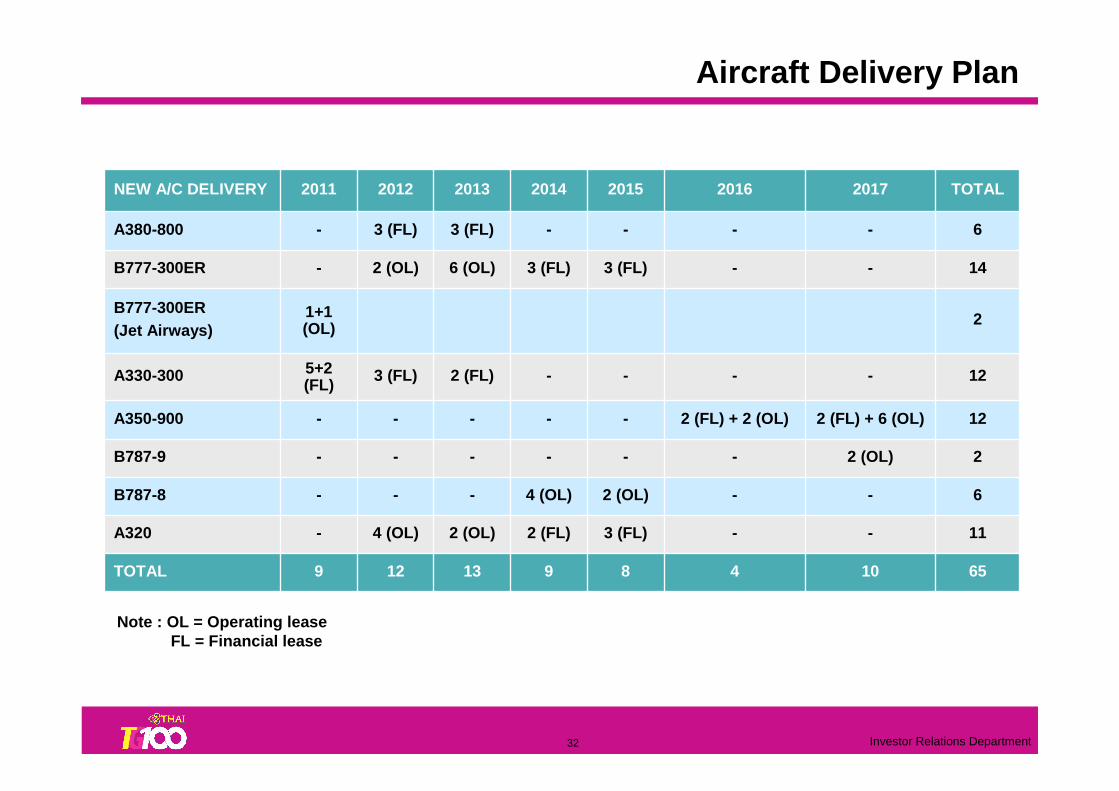
21+1 (OL)
B777-300ER (Jet Airways)
11--3 (FL)2 (FL)2 (OL)4 (OL)-A320
12----2 (FL)3 (FL)5+2 (FL)
A330-300
14--3 (FL)3 (FL)6 (OL)2 (OL)-B777-300ER
22 (OL)------B787-9
122 (FL) + 6 (OL)2 (FL) + 2 (OL)-----A350-900
4
-
-
2016
8
2 (OL)
-
2015
13
-
3 (FL)
2013
12
-
3 (FL)
2012
9
-
-
2011
65109TOTAL
6-4 (OL)B787-8
6--A380-800
TOTAL20172014NEW A/C DELIVERY
Aircraft Delivery Plan
Note : OL = Operating leaseFL = Financial lease
33 Investor Relations Department
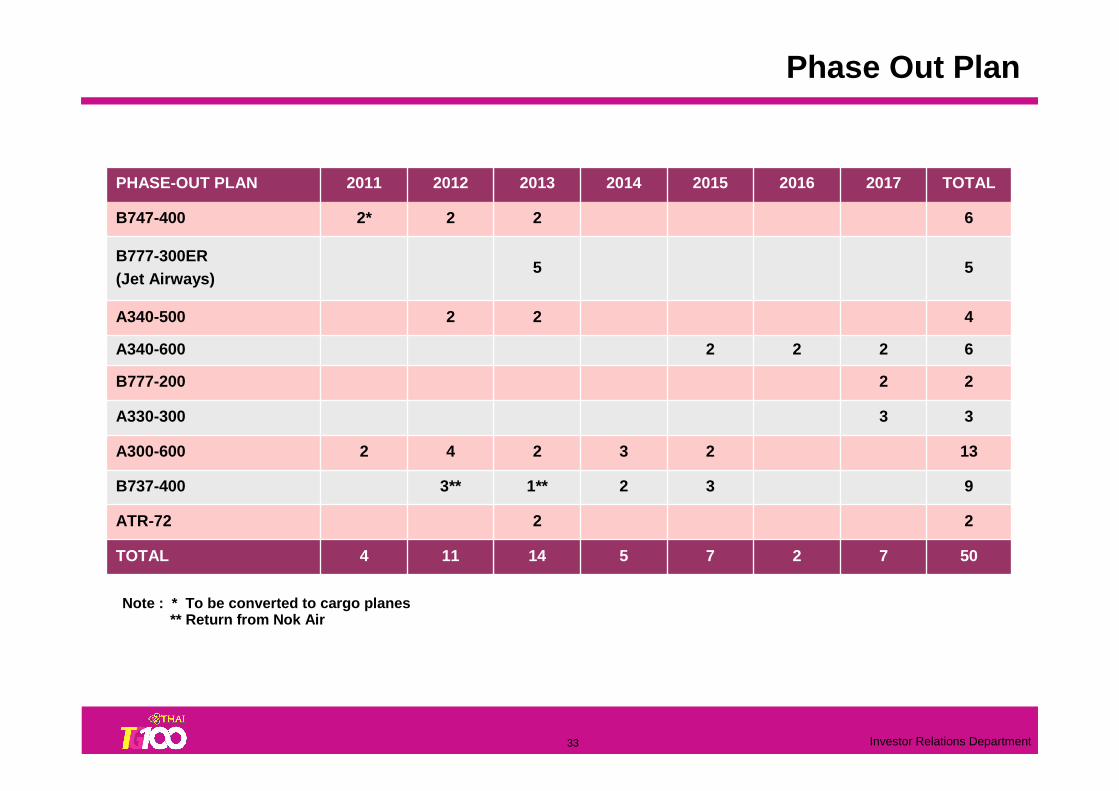
Phase Out Plan
22ATR-72
6222A340-600
9321**3**B737-400
422A340-500
55B777-300ER (Jet Airways)
33A330-300
22B777-200
2
2016
7
2
2015
14
2
2
2013
11
4
2
2012
4
2
2*
2011
5075TOTAL
133A300-600
6B747-400
TOTAL20172014PHASE-OUT PLAN
Note : * To be converted to cargo planes** Return from Nok Air

34 Investor Relations Department
TOTAL2017201620152014201320122011
# of Aircraft 89 93 95 99 100 102 105
Total Seats in operation 26,691 28,249 29,570 30,972 31,581 32,391 33,660
Seat Growth 5.8% 5.8% 3.8% 8.7% 2.0% 2.6% 3.9% 4.7%
Fleet Strategy Through 2017
Age Fleet Age 11.0
9.79.2
10.09.4 9.8 9.3
0.0
2.0
4.0
6.0
8.0
10.0
12.0
2011 2012 2013 2014 2015 2016 2017
*
* Approximately
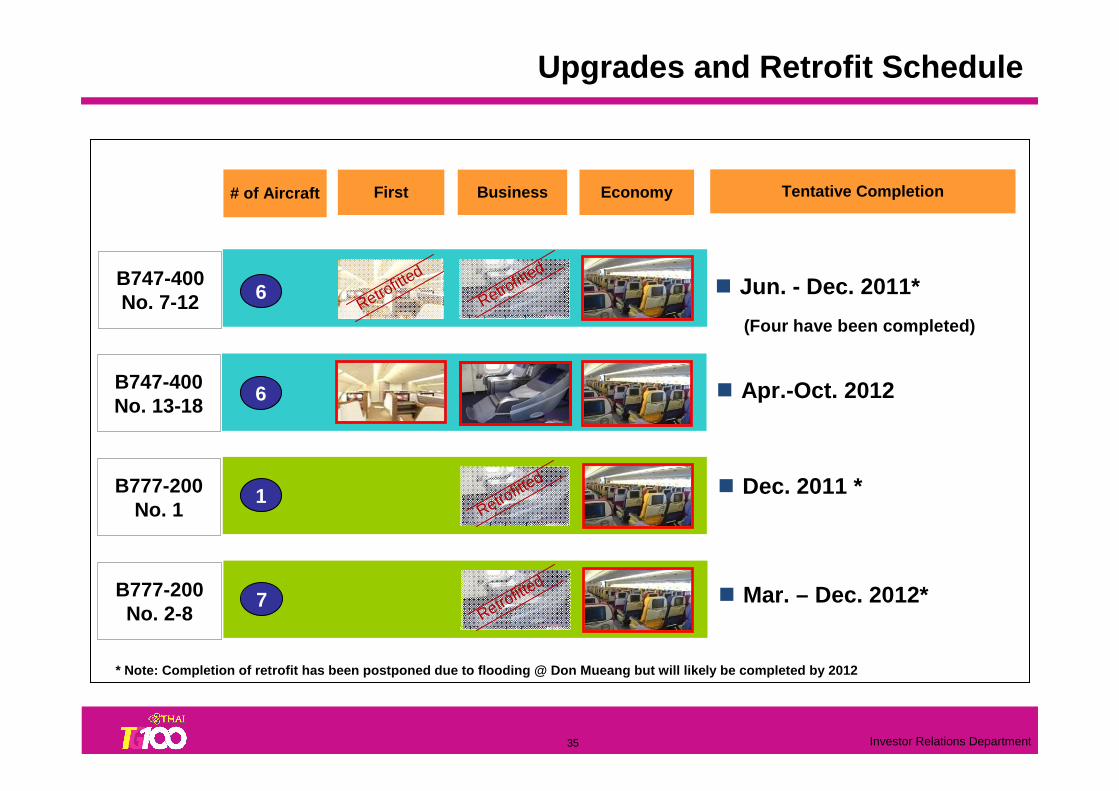
35 Investor Relations Department
� Mar. – Dec. 2012*
B747-400No. 7-12 6
7
B747-400No. 13-18
6
Retrofitte
d
Retrofitte
d
Retrofitte
d
First Business Economy# of Aircraft Tentative Completion
� Jun. - Dec. 2011*
(Four have been completed)
� Apr.-Oct. 2012
Upgrades and Retrofit Schedule
� Dec. 2011 *1Retro
fittedB777-200
No. 1
B777-200No. 2-8
* Note: Completion of retrofit has been postponed d ue to flooding @ Don Mueang but will likely be compl eted by 2012

36 Investor Relations Department
Business Class Seats
• Leased 3 B777-300ER aircraft from Jet Airways for 3 years
• Another 2 B777-300ER will be leased from Jet Airway s : August and November 2011
• Used on European flights and to replace routes wher e older A330-300 aircraft flies in the region
Economy Class SeatsHigh level of Privacy
First Class Seats
Aircraft lease to Supplement Capacity

37 Investor Relations Department
New Aircraft A330 & A380
New Airbus A330-300
Royal Silk Class
Economy Class
New Airbus A380-800Royal First class
Royal Silk Class
Economy Class

38 Investor Relations Department
New In-Flight Entertainment Interactive
Entertainment- Movies: 100 titles- Short program: 150 programs- CD Album: 500 albums- Games: 60 games- USB plug and play
Entertainment- Movies: 100 titles- Short program: 150 programs- CD Album: 500 albums- Games: 60 games- USB plug and play
Onboard Services- E-Meal Menu - E-Duty Free Shopping
- E-Magazine - Seat Chat
Onboard Services- E-Meal Menu - E-Duty Free Shopping
- E-Magazine - Seat Chat
E-Duty Free Shopping
E-Meal Menu
Full Audio Video on Demand (AVOD) in all classes* (* Except A330-300, A300-600 and B737-400)
Connectivity
- Voice Call - SMS Text Messaging- GPRS Email - Internet Access’
Connectivity
- Voice Call - SMS Text Messaging- GPRS Email - Internet Access’
Infotainment- About THAI
- Airport Information
- Window on Thailand
- Travel Destination Information
Infotainment- About THAI
- Airport Information
- Window on Thailand
- Travel Destination Information
E-Duty Free Shopping

39 Investor Relations Department
IT Development
InfrastructureRedesign and Migrate to Cloud
E-Payment GatewayMobile Capability
Revenue Enhancement
Data Management
Internal Cooperation
CRM / Cross Function Database
Enterprise Resource Planning (ERP)
E-Collaboration / Knowledge management

40 Investor Relations Department
• Develop Bangkok and Thailand as main hubs by implementing more direct flights into Thailand, focus on frequency increment and hub connectivity
• Enhance network strength in key markets to maintain leading market positioning and build network strength around homeland
• Expand network in secondary routes, operating by narrow body aircraft with light premium service
• Establish THAI LCC to compete in price sensitive market
• Leverage alliances and strategic partners to expand network and cover all market segments
• Increase flight schedule flexibility in respond demand dynamic, seasonality, and competitive environment
• Develop more direct flight to HKT as main destination
• Improve fleet efficiency to lower maintenance and fuel expenses, reduce environmental impact and increase asset utilization
• Secure long-term fleet delivery positions to ensure continuous supply to support sustainable growth
• Implement fleet simplification in long-term to reduce operating costs and improve operating efficiency
• Match aircraft size with demand and competition
• Design proper seat configuration to gain competitive advantage
Route Network StrategyRoute Network Strategy Fleet StrategyFleet Strategy
Route Network and Fleet Route Network and Fleet

41 Investor Relations Department
439148Freq./Week
1920Cities
4115Countries
RegionalInter-
continentalRoute
(as Dec. 11)
THAI Route NetworkTHAI Route Network
World Route NetworkWorld Route Network

42 Investor Relations Department
THAI Route NetworkTHAI Route Network
CHIANG RAI
MAE HONG SON
UDON THANI
KHON KAEN
PHUKET KRABIHAT YAI
PHITSANULOK
CHIANG MAI
UBON RATCHATHANI
SAMUI
SURAT THANI
Domestic Route NetworkDomestic Route Network
283Freq./Week
10Cities
DomesticRoute
(as Dec. 11)
NAKHON PHANOM
BURIRAM
BANGKOK
Nok Air (Code Share)
THAI

43 Investor Relations Department
Suspension routes
Increase direct flights from BKK to secondary marke t and increasing over all connectivity but will adjust capacity to reflect de mand
2011 Route Network Changes
Effective Oct. 30, 2011
Winter Program
3 Flights / WeekBKK-Brussel v.v.
BKK-Belgium v.v. (As from 17NOV11)
3 Flights / Week
BKK-Copenhagen-Phuket(As from 11NOV11)
3 Flights / Week
BKK-Osaka v.v. (As from 16NOV11)
3 Flights / Week
HKT-Seoul v.v. 3 Flights / Week
BKK-Singapore v.v. 7 Flights / Week
New Flights Opening
BKK-Beijing v.v. 4 Flights / Week
BKK-Kathmandu v.v. 3 Flights / Week
BKK-Hat Yai v.v. 7 Flights / Week
Flight Resumption
BKK-Phuket-Perth v.v. HKT-Perth v.v.
BKK-Tokyo-Phuket BKK-Narita v.v.
BKK-Chiang Mai-Phuket-BKKBKK-Chiang Mai-Phuket
v.v.
Route Adjustment
BKK-Oslo v.v. 5 to 7 Flights / Week
BKK-Perth v.v. 4 to 7 Flights / Week
BKK-Xiamen v.v. 3 to 4 Flights / Week
BKK-Chengdu v.v. 4 to 5 Flights / Week
BKK-Nagoya v.v.(As from 01JAN12)
10 to 11 Flights / Week
BKK-Mumbai v.v. 6 to 13 Flights / Week
BKK-Gaya-Varanasi v.v.(30OCT– 31DEC11)
4 to 7 Flights / Week
Additional Frequency
Effective Oct. 30, 2011 – Mar. 24, 2012

44 Investor Relations Department
THAI THAI PhuketPhuket Route NetworkRoute Network
3Phuket – Perth vv.
3Phuket – Seoul vv.
DAILYPhuket – Hong Kong vv.
67Phuket – Bangkok vv.
3Copenhagen – Phuket *
Freq./WeekSector (as 31 OCT 11)

45 Investor Relations Department
>20<30%
1m 2m 3m 4m 5m 6m 7m 8m 9m 10m 11m 12m 13m 14m 15m 16m 17m 18m >18 months
>80%
<=20%
>60<=80%
>30<=60% VP, Director and Department Level Decision
Board Authority
Board Authority
Fuel Price Risk Management Committee
(President, EVP Finance & Accounting, VP, Director and Department)
Hedging Volume
Contract Period
Minimum 20% fuel hedging requirement to mitigate ri sk of rapid fuel cost riseMinimum 20% fuel hedging requirement to mitigate ri sk of rapid fuel cost rise
Fuel Management

46 Investor Relations Department
Monthly fuel hedging 2008-2011 - % of consumption by month
Percentage of Fuel Surcharge & Hedging Coverage
57%
65%
62%
56%
51%
51% 61
%65
%
69%
72%
72%
63%
123%
131%
163%
199%
143%
116%
82% 10
2%
91% 11
8%
112%
102% 110%
104% 11
6%98
%
74% 94
% 106%
111%
103%
109%
101%
102%
78% 95
%
95%
97%
103%
96%
97%
96%
77%98
%
88%
87%
Jan-
08F
eb-0
8
Mar
-08
Apr
-08
May
-08
Jun-
08
Jul-0
8A
ug-0
8
Sep
-08
Oct
-08
Nov
-08
Dec
-08
Jan-
09F
eb-0
9
Mar
-09
Apr
-09
May
-09
Jun-
09
Jul-0
9A
ug-0
9
Sep
-09
Oct
-09
Nov
-09
Dec
-09
Jan-
10F
eb-1
0
Mar
-10
Apr
l10
May
10Ju
n10
Jul1
0A
ug10
Sep
10O
ct-1
0
Nov
-10
Dec
-10
Jan-
11F
eb-1
1
Mar
-11
Apr
-11
May
-11
Jun-
11
July
-11
Aug
-11
Sep
-11
Oct
-11
Nov
-11
Dec
-11
0% 0% 0% 0% 3%17
%38
%41
%44
%44
% 49%
35%
27%
20%
23%
3% 3% 7% 13%
13%
17%
20% 27
%30
% 44%
44%
44%
47%
47%
47%
69%
69%
69%
69%
69%
69% 80
%80
%80
%
73%
73%
73%
75%
75%
75%
78%
78%
78%
68%
68%
68%80
%80
%80
%
56%
50%
50%
51%
51%
51%
Jan-
08Fe
b-08
Mar
-08
Apr
-08
May
-08
Jun-
08Ju
l-08
Aug
-08
Sep
-08
Oct
-08
Nov
-08
Dec
-08
Jan-
09Fe
b-09
Mar
-09
Apr
-09
May
-09
Jun-
09Ju
l-09
Aug
-09
Sep
-09
Oct
-09
Nov
-09
Dec
-09
Jan-
10Fe
b-10
Mar
-10
Apr
-10
May
-10
Jun-
10Ju
l-10
Aug
-10
Sep
-10
Oct
-10
Nov
-10
Dec
-10
Jan-
11Fe
b-11
Mar
-11
Apr
-11
May
-11
Jun-
11Ju
l-11
Aug
-11
Sep
-11
Oct
-11
Nov
-11
Dec
-11
Jan-
12Fe
b-12
Mar
-12
Apr
-12
May
-12
Jun-
12Ju
l-12
Aug
-12
Sep
-12
Oct
-12
Nov
-12
Dec
-12
Fuel Management
Hedging combined with fuel surcharge greatly mitiga tes fuel price fluctuation risk

47 Investor Relations Department
THAI is the first Asian airline with IATA to find means to offset fuel burn
Carbon FootprintCarbon Footprint
1st
airline
Emissions TradingEmissions Trading
Amount of Shortfall Carbon Credit ~200 MTHB
• CERs 60%
• EUAs 40%
•Determined the carbon footprint of 2 meals and provided labeling declaring carbon quantity for customers as their choice
2012 Monetary Value
Emissions Control
IATA Carbon Offset Program

48 Investor Relations Department
� Geared for BUs to enhance efficiency in decision process & management
� Signed “Service Level Agreements”
Project Changes Made
Uphold the principles of Good Corporate Governance
Invest in IT
Expedite decision making
� IT capability improves not only efficiency, decisio n making but also enhances customer satisfaction
� Reduce steps to improve decision process
� Ensuring transparency in all areas of operations
� Whistle Blower Policy
Structural change to enhance flexibility but also responsibility
� Senior management having clear cut KPIs and compensation is measured accordingly
Performance-based Culture
Improvements in Dynamism
� Pushing KPI’s down the management rungs

49 Investor Relations Department
EC Rescinded all charges against THAIUS Cargo DOJ Stopped further proceedingsUS Cargo Class Action Settled by paying USD 3.5 mnKorea Pending charges is for KW 2.85 mn
Pending Legal Issues
In 2008 Put in reserve 4,290
MTHB
In 2010 Wrote back 1,783
Outstanding in reserve 2,507
50 Investor Relations Department
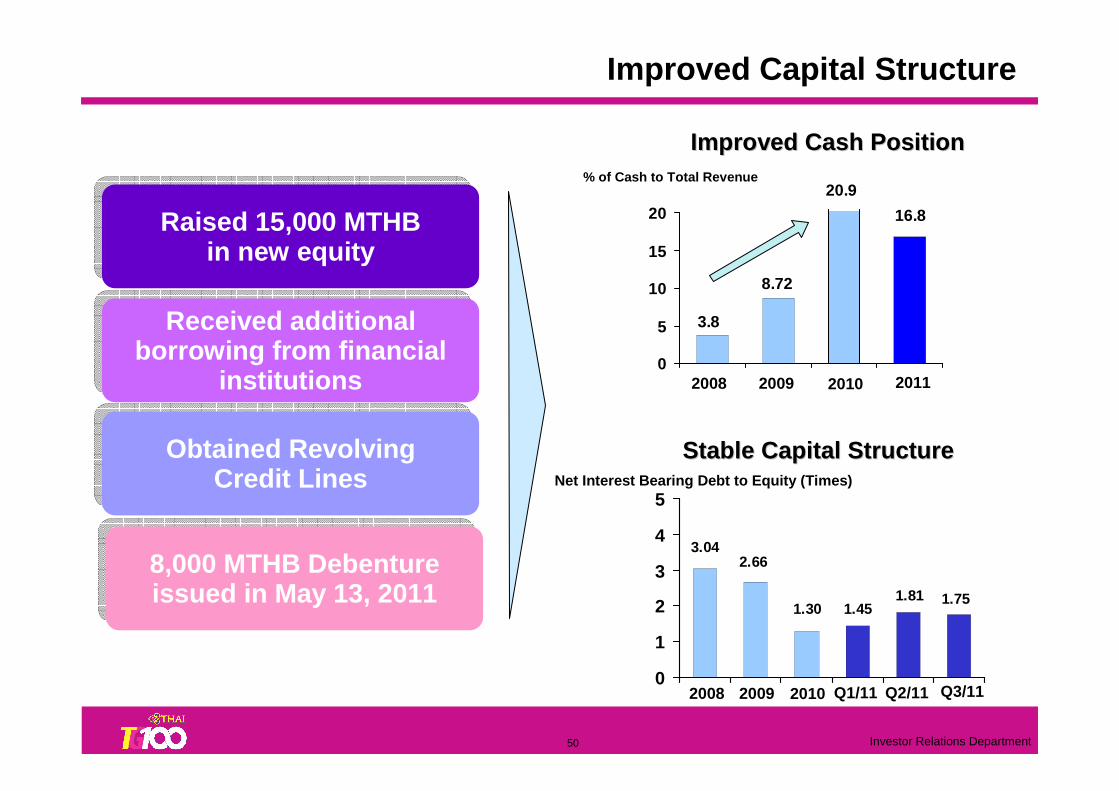
Raised 15,000 MTHB in new equity
Raised 15,000 MTHB in new equity
Received additional borrowing from financial
institutions
Received additional borrowing from financial
institutions
Obtained Revolving Credit Lines
Obtained Revolving Credit Lines
% of Cash to Total Revenue
3.8
8.72
20.9
16.8
0
5
10
15
20
2009 20102008
3.042.66
1.30 1.451.81 1.75
0
1
2
3
4
5
2009 20102008
Net Interest Bearing Debt to Equity (Times)
Improved Cash PositionImproved Cash Position
Stable Capital Structure Stable Capital Structure
Improved Capital Structure
Q1/11
8,000 MTHB Debentureissued in May 13, 20118,000 MTHB Debentureissued in May 13, 2011
Q2/11 Q3/11
2011

51 Investor Relations Department
Financial Performance

52 Investor Relations Department
Performance Summary (9M/2010 & 9M/2011)THAI and its subsidiaries
(Units : MTHB)
Total Revenue 147,371 134,854 Total Expense -144,871 -125,570
Foreign currency exchange (Gain) -3,325 7,317
Share of profit of investments by the equity method 142 226
Profit (Loss) before finance costs, income tax -683 16,827
Financial Cost -4,195 -3,922
Net tax expense (income) 99 -907
Net profits (loss) -4,779 11,998
2011
Jan-Sep
2010
Financial Performance
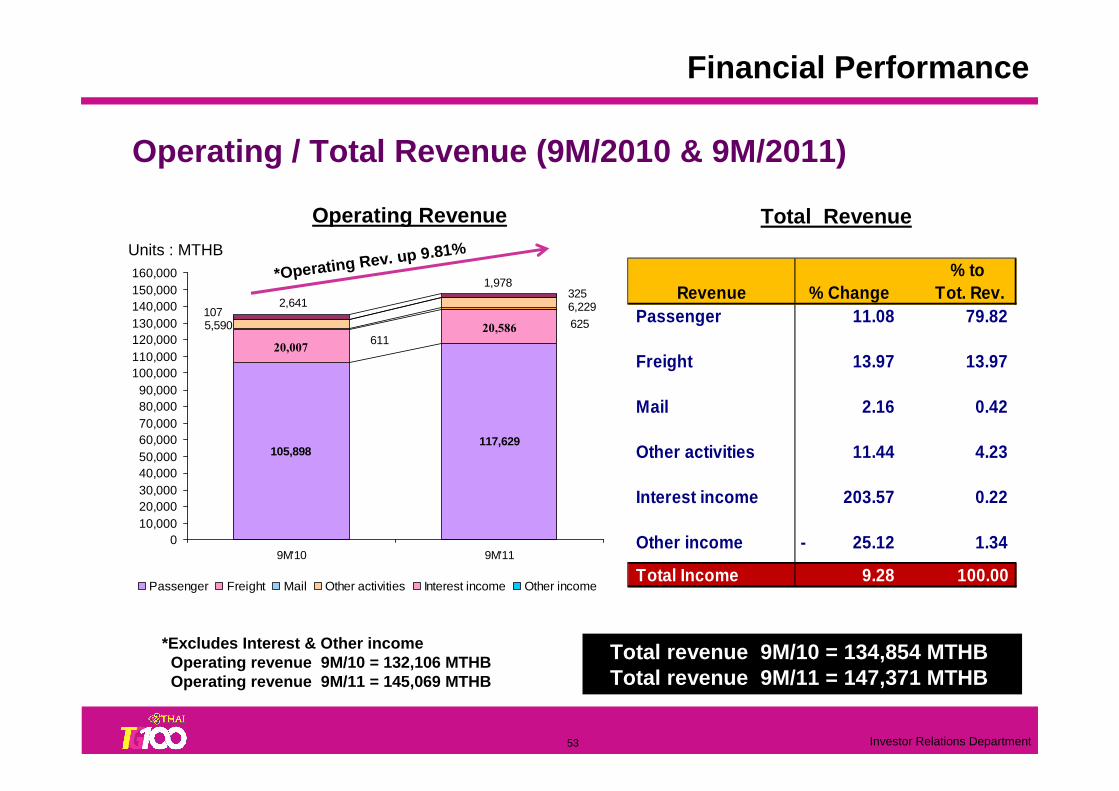
53 Investor Relations Department
Operating / Total Revenue (9M/2010 & 9M/2011)
105,898117,629
20,007
20,586611
625
6,229
5,590
325
1072,641
1,978
010,00020,00030,00040,00050,00060,00070,00080,00090,000
100,000110,000120,000130,000140,000150,000160,000
9M'10 9M'11
Passenger Freight Mail Other activities Interest income Other income
% to Revenue % Change Tot. Rev.
Passenger 11.08 79.82
Freight 13.97 13.97
Mail 2.16 0.42
Other activities 11.44 4.23
Interest income 203.57 0.22
Other income 25.12- 1.34
Total Income 9.28 100.00
*Operating Rev. up 9.81%
Operating Revenue Total Revenue
*Excludes Interest & Other incomeOperating revenue 9M/10 = 132,106 MTHBOperating revenue 9M/11 = 145,069 MTHB
Total revenue 9M/10 = 134,854 MTHBTotal revenue 9M/11 = 147,371 MTHB
Units : MTHB
Financial Performance

54 Investor Relations Department
22,459 22,898
42,033
56,894
14,013
15,333
7,119
6,772
4,083
3,7746,835
8,62315,326
14,916
4,148
2,748
010,00020,00030,00040,00050,00060,00070,00080,00090,000
100,000110,000120,000130,000140,000150,000160,000
9M'10 9M'11
Personnel Fuel and Oil Flight Service Expense
Inventory&Supply Crew Expense Aircraft Maintenance
Depreciation Lease of a/c
**Operating Exp. Up 15.04%
Total ExpenseOperating Expense
% Change % of
Expense YoY Tot. Exp.Personnel expense 1.95 15.45
Fuel and oil 35.35 38.39
Flight service expense 9.42 10.35
Inventories and supplies 5.13 4.80
Crew expense 8.18 2.75
Maintenance/overhual 26.16 5.82
Depreciation/amortisation 2.68- 10.06
Aircraft lease/spare parts 50.90 2.80
Other expense 230.50 9.58
Total Expense 25.32 100.00
Operating / Total Expense ( 9M/2010 & 9M/2011)
** Excludes FX & Impairment lossesOperating expense 9M/10 = 125,004 MTHBOperating expense 9M/11 = 143,812MTHB
Total expense 9M/10 = 118,253 MTHBTotal expense 9M/11 = 148,195 MTHB
Units : MTHB
Financial Performance

55 Investor Relations Department
Ratios – 9M/2010 & 9M/2011
31.4136.56(THB)Book Value per Share
0.641.15(Times)Price / Book Value
19,40425,406(MTHB)EBITDAR
2.01.9(Times)Interest Bearing Debt to Equity
Ratios units 9M/10 9M/11
Earnings Per Share (THB) 6.99 -2.20
EBIT (MTHB) 7,331 341
EBITDA (MTHB) 22,658 15,257
Operating Profit Margin (%) 5.5 0.2
Net Profit Margin (%) 9.1 -3.3
EBITDA Margin (%) 17.2 10.5
Net Interest Bearing Debt to Equity (Times) 1.4* 1.7*
Interest Coverage (Times) 5.8 3.6
Financial Performance
* (Interest Bearing Debt – Cash and Cash Equivalent) / Equity

56 Investor Relations Department
Foreign Currency Exposure (Year 2010)Surplus
or DeficitAmount % Amount % Amount Amount % Amount %
USD BASED 85,801 48 89,994 60 4,193- 1,977 1 1,212 1
USD 18,604 79,340
Others(1) 67,197 10,654
EUR BASED 35,210 20 8,030 5 27,180 49,796 34 50,584 35
EUR 16,809 5,623 Others(2) 18,401 2,407
JPY 13,509 7 3,980 3 9,529 13,766 9 13,766 9
THB 45,753 25 47,228 32 1,475- 80,741 55 80,741 55
TOTAL 180,273 100.00 149,232 100.00 31,041 146,280 100 146,303 100
Outstanding BorrowingsAfter Swap
Revenue ExpenseBefore Swap
Unit : MTHB
25%
20%
48%
7%
Revenue Expense Outstanding
60%
5%3%
32%
1%
35%
9%
55%
USD BASED EUR BASED JPY THB
Financial Performance

57 Investor Relations Department
-4,187
-37,647
24,524
37,117
-885
6,254
-50,000
-40,000
-30,000
-20,000
-10,000
0
10,000
20,000
30,000
40,000
50,000
2010 2011
USD EUR JPY THB
TG continues to be net long Euro & Yen(MTHB)
Jan – Nov 2010
Financial Performance
Jan – Nov 2011

58 Investor Relations Department
Proportion of Fixed and Float
Float71%
Fixed29%
Percentage of TOTAL (TOTAL = 142,350 MTHB)
Float53%
Fixed47%
Percentage of TOTAL (TOTAL = 142,444 MTHB)
Before Swap After Swap
(As of Dec. 2011)
Financial Performance
Cost of funding = 3.78% Cost of funding = 3.92%

59 Investor Relations Department
Proportion of Total Borrowing
Percentage of Total(Total of on Balance Sheet = 142,350 MTHB)
Percentage of Total(Total of on Balance Sheet = 142,444 MTHB)
Before Swap After Swap
(As of Dec. 2011)
Financial Performance
Medium Term Note0.9%
Term Loan38.9%
Financial Lease40.7%
Debenture19.6%
Medium Term Note0.9%
Debenture19.5%
Financial Lease40.6%
Term Loan38.9%
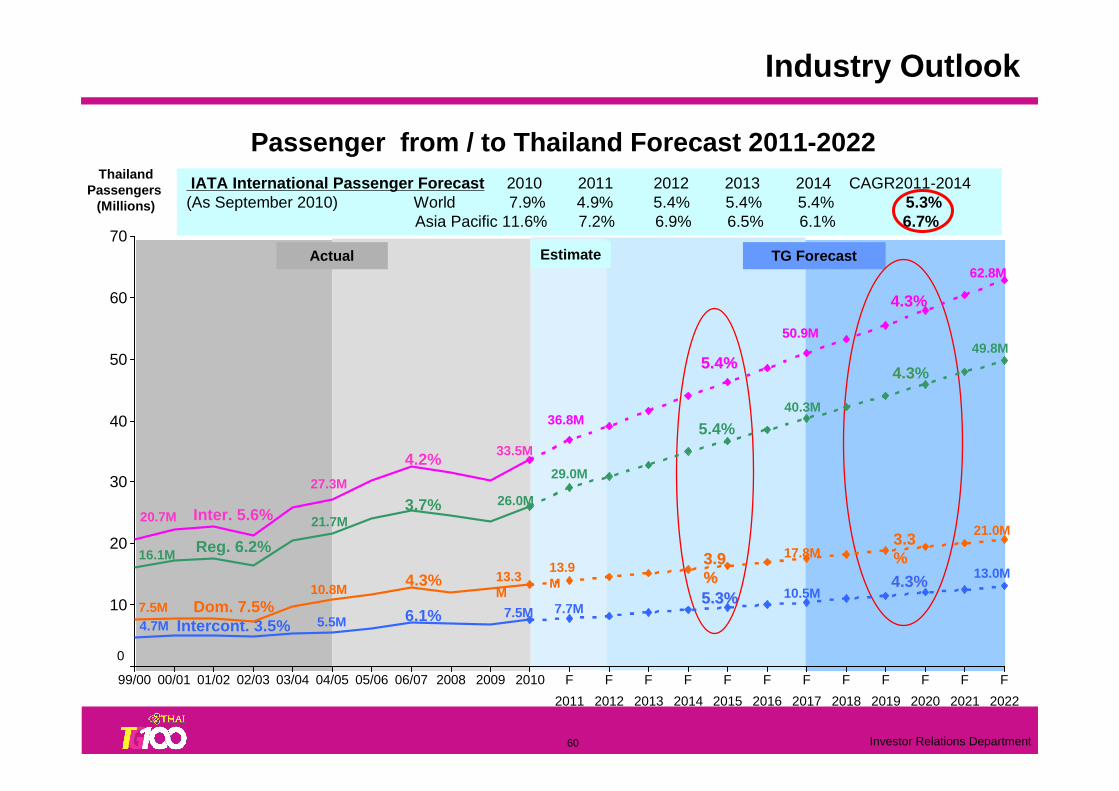
60 Investor Relations Department
TG ForecastActual
27.3M
21.7M
5.5M
10.8M
4.2%
3.7%
6.1%
4.3%
ThailandPassengers
(Millions)
50.9M50.9M
40.3M
17.8M
10.5M
3.93.9%%5.3%5.3%
5.4%
5.4%5.4%
Thailand Passengers Forecast
IATA International Passenger Forecast 2010 2011 2012 2013 2014 CAGR2011-2014(As September 2010) World 7.9% 4.9% 5.4% 5.4% 5.4% 5.3%
Asia Pacific 11.6% 7.2% 6.9% 6.5% 6.1% 6.7%
Estimate
36.8M
29.0M
13.9M
7.7M
62.8M62.8M
49.8M
21.0M
13.0M
3.33.3%%
4.3%4.3%
4.34.3%
4.3%4.3%
20.7M
16.1M
4.7M7.5M
Inter. 5.6%
Reg. 6.2%
Intercont. 3.5%Dom. 7.5%
33.5M
26.0M
13.3M
7.5M
0
10
20
30
40
50
60
70
99/00 00/01 01/02 02/03 03/04 04/05 05/06 06/07 2008 2009 2010 F
2011
F
2012
F
2013
F
2014
F
2015
F
2016
F
2017
F
2018
F
2019
F
2020
F
2021
F
2022
Passenger from / to Thailand Forecast 2011-2022
Industry Outlook

61 Investor Relations Department
Appendix

62 Investor Relations Department
Passengers Carried
4,6844,114 4,589 5,088 5,167
3,6624,414 4,833 4,923
4,2014,771 4,502
1,000
3,000
5,000
7,000
Q1'09 Q2'09 Q3'09 Q4'09 Q1'10 Q2'10 Q3'10 Q4'10 Q1'11 Q2'11 Q 3'11 Q4'11
(’000)
Freight Carried
113,735124,819
140,889
167,341 166,155179,329 180,341
168,199174,570188,109
172,749 175,708
100,000
130,000
160,000
190,000
Q1'09 Q2'09 Q3'09 Q4'09 Q1'10 Q2'10 Q3'10 Q4'10 Q1'11 Q2'11 Q 3'11 Q4'11
(Tons)
Year 2009 Year 2010
Year 2009 Year 2010
Operating Statistics
Year 2011
Q4/11 = 4.5 million (decreased 6.9% YoY)
Q4/11 = 175,708 tons (decreased 6.6% YoY)
Year 2011

63 Investor Relations Department
C/FRPKASK
Passenger
68
.1
61
.0
65
.76
9.9
74
.8
75
.2
77
.2
76
.87
1.1
62
.26
5.1
71
.3
76
.17
4.3
75
.17
4.0
77
.0
82
.0
82
.3
78
.8
72
.15
6.7
65
.3 76
.3
74
.6
73
.1
74
.37
1.8
75
.3
77
.8
77
.6
73
.0
71
.86
1.9
65
.7
77
.2
-
2,000
4,000
6,000
8,000
Jan-
09
Fe
b-0
9
Ma
r-0
9
Apr
-09
Ma
y-0
9
Jun-
09
Jul-0
9
Aug
-09
Se
p-0
9
Oct
-09
Nov
-09
De
c-0
9
Jan-
10
Fe
b-1
0M
ar-
10
Apr
-10
Ma
y-1
0
Jun-
10
Jul-1
0
Aug
-10
Se
p-1
0
Oct
-10
Nov
-10
De
c-1
0Ja
n-1
1
Fe
b-1
1
Ma
r-1
1
Apr
-11
Ma
y-1
1
Jun-
11
Jul-1
1
Aug
-11
Se
p-1
1
Oct
-11
Nov
-11
De
c-1
1
-
20.0
40.0
60.0
80.0
100.0
(%)Year 2009 Year 2010 Year 2011
(Million)
Dec'11 Dec'10 YoY% Q4'11 Q3'11 QoQ% Q4'11 Q4'10 YoY% 201 1 2010 YoY% MASK 6,806 6,756 0.7 19,953 19,837 0.6 19,953 19,734 1.1 78,533 75,598 3.9 MRPK 4,632 5,085 8.9- 12,968 14,681 11.7- 12,968 14,569 11.0- 55,267 55,678 0.7- Cabin factor% 68.1 75.3 9.6- 65.0 74.0 12.2- 65.0 73.8 12.0- 70.4 73.7 4.4-
YoY (Month) YoY (Year)YoY (Quarter)QoQ (Quarter)
Operating Statistics

64 Investor Relations Department
54.3
55.2
56.3
56.1
54.2
40.2
44.5
49.7
46.1
47.9
51.8
50.6
52.4 58
.859
.3
61.8
58.3
54.4
60.5
63.9
62.4
66.9
65.0
61.3
60.4
62.2
62.5
60.8
57.9
53.7
56.6
60.1
58.0
57.8
57.7
55.1
-
200
400
600
Jan-
09Fe
b-09
Mar
-09
Apr
-09
May
-09
Jun-
09Ju
l-09
Aug
-09
Sep
-09
Oct
-09
Nov
-09
Dec
-09
Jan-
10Fe
b-10
Mar
-10
Apr
-10
May
-10
Jun-
10
Jul-1
0A
ug-1
0S
ep-1
0O
ct-1
0N
ov-1
0D
ec-1
0Ja
n-11
Feb-
11M
ar-1
1A
pr-1
1M
ay-1
1Ju
n-11
Jul-1
1A
ug-1
1S
ep-1
1O
ct-1
1N
ov-1
1D
ec-1
1
-
20.0
40.0
60.0
80.0
(Million) (%)
Freight
F/FRFTKADTK
Operating Statistics
Year 2009 Year 2010 Year 2011
Dec'11 Dec'10 YoY% Q4'11 Q3'11 QoQ % Q4'11 Q4'10 YoY% 2011 2010 YoY% MADTK 411 428 4.0- 1,210 1,224 1.1- 1,210 1,288 6.1- 4,917 4,708 4.4 MRFTK 223 248 10.1- 669 675 0.9- 669 778 14.0- 2,765 2,895 -4.5Freight factor % 54.3 57.9 6.4- 55.3 55.1 0.3 55.3 60.4 8.5- 56.2 61.5 8.6-
YoY (Month) YoY (Year)YoY (Quarter)QoQ (Quarter)

65 Investor Relations Department
2.41
2.35
2.21
2.19 2.29
2.22 2.32
2.34
2.30
2.22
2.05
2.08
2.13
1.90
1.81 1.92 2.05
1.85 2.02 2.14 2.
35
2.26
2.16
2.07 2.23
2.03
1.99 2.01 2.11
1.97 2.
12
2.16 2.
292.42
2.42
2.36
1.00
2.00
3.00
Jan Feb Mar Apr May Jun Jul Aug Sep Oct Nov Dec
Year 2009 Year 2010 Year 2011
(THB/Km)
Passenger Yield (Excluding Fuel Surcharge)
Passenger Yield (Including Fuel Surcharge)
2.51 2.
642.
602.70 2.
82
2.75
2.70 2.
81
2.81
2.78
2.72
2.49
2.54 2.56
2.32
2.21 2.
30
2.44
2.27
2.84
2.73
2.63
2.54
2.68
2.44
2.42 2.45 2.
55
2.40
2.56
2.72
2.63
2.64
2.87
2.82
2.78
2.00
2.50
3.00
Jan Feb Mar Apr May Jun Jul Aug Sep Oct Nov Dec
Year 2009 Year 2010 Year 2011
(THB/Km)
Operating Statistics

66 Investor Relations Department
Freight Yield (Excluding Fuel Surcharge)
7.02
6.75 6.
96
6.85 6.94 7.02
6.98
7.72
7.01
6.62
7.13 7.
47
6.67
6.69 7.
01 7.08 7.
48
7.53
7.33
6.91
6.96
7.44 7.51
7.18 7.30
6.89
7.37
7.12 7.
42
7.01
6.847.
08
6.94
6.77 6.86
6.75
6.00
7.00
8.00
Jan Feb Mar Apr May Jun Jul Aug Sep Oct Nov Dec
Year 2009 Year 2010 Year 2011
(THB/Km)
Freight Yield (Including Fuel Surcharge)
9.659.
85 10.0
1
9.82 10
.00
9.80 10
.01
9.74
8.71
8.02 8.
50
9.17
8.19
8.90
8.61 8.
88 9.04 9.
35
9.439.66
9.08 9.10 9.30 9.
89
9.65
9.53
9.30 9.
84
9.37
9.449.
70
9.45 9.65
7.00
8.00
9.00
10.00
Jan Feb Mar Apr May Jun Jul Aug Sep Oct Nov Dec
Year 2009 Year 2010 Year 2011
(THB/Km)
Operating Statistics
10.0
9
10.1
5
67 Investor Relations Department
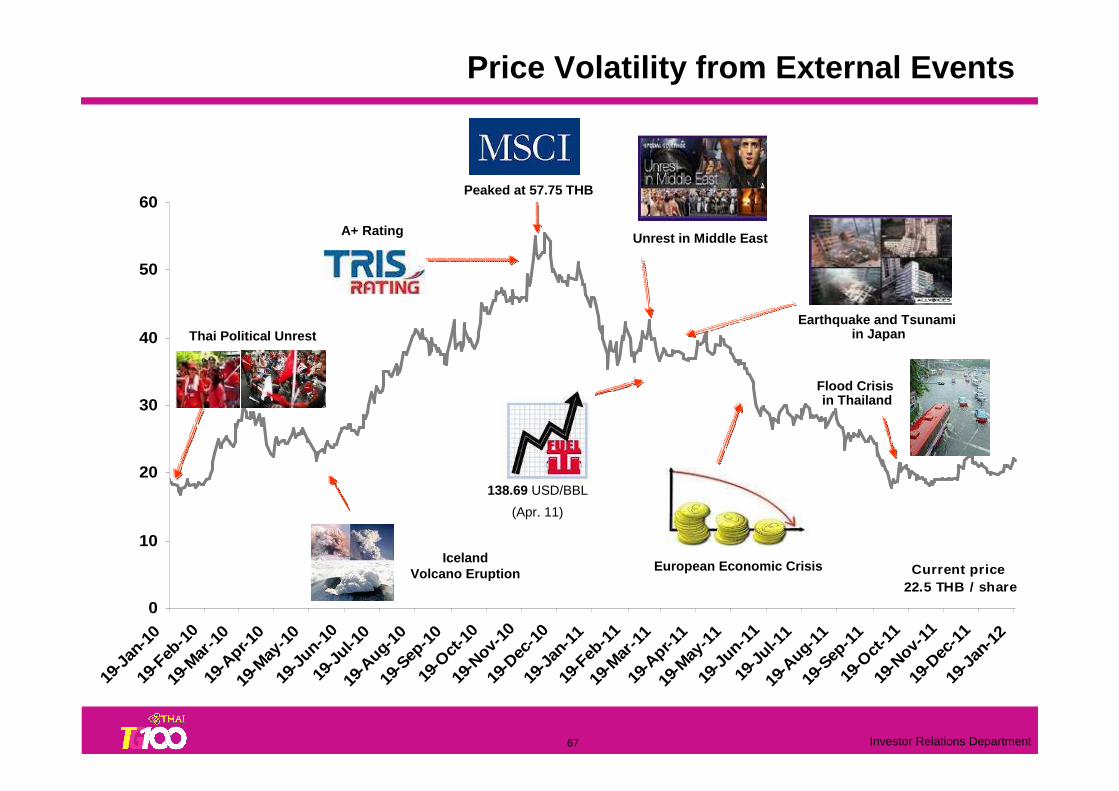
Current price 22.5 THB / share
0
10
20
30
40
50
60
19-J
an-1
019
-Feb
-10
19-M
ar-1
019
-Apr
-10
19-M
ay-1
019
-Jun
-10
19-J
ul-1
019
-Aug
-10
19-S
ep-1
019
-Oct -
1019
-Nov-1
019
-Dec
-10
19-J
an-1
119
-Feb
-11
19-M
ar-1
119
-Apr-1
119
-May
-11
19-J
un-1
119
-Jul
-11
19-A
ug-1
119
-Sep
-11
19-O
ct -11
19-N
ov-1
119
-Dec
-11
19-J
an-1
2
Price Volatility from External Events
Peaked at 57.75 THB
Unrest in Middle East
Earthquake and Tsunamiin Japan
Flood Crisis in Thailand
A+ Rating
Thai Political Unrest
Iceland Volcano Eruption
138.69 USD/BBL
(Apr. 11)
European Economic Crisis

68 Investor Relations Department
Achieved Top 5 in the World and Targeting Top 3 in A sia
Business Traveler’s Award 2011
2nd for Best Airline
2nd for Best Asia-Pacific Airline
3rd for Best Business Class
3rd for Best Economy Class
2nd for Best Frequent-Flyer Programme
3rd for Best Airline Lounge in Asia-Pacific
Norwegian Grand Travel Award 2011
Best Intercontinental Airline
TTG Award 2011
Best Business Class
Best Southeast Asian carrier
Awards and Accolades
The World’s Top Ten Airlines – Skytrax
2010
3
2
1
4
6
5
7
8
4
2
3
1
7
8
6
5
2009
Source: Skytrax Go Asia Award
Best Asian carrier
Skytrax 2011
Best Airline Seat - Economy ClassBest On Board Catering – Economy Class2011
1
2
3
4
6
7
8
10
9 10
-9 -
5
Skytrax 2010
Best Airline Lounge – First ClassBest Airport Services