journal of parenteral and enteral a.s.p.e.n. clinical ... · higher osmolarity limits, especially...
TRANSCRIPT
Journal of Parenteral and EnteralNutritionVolume 38 Number 3 March 2014 334 –377© 2014 American Societyfor Parenteral and Enteral NutritionDOI: 10.1177/0148607114521833jpen.sagepub.comhosted at online.sagepub.com
Clinical Guidelines
Background
Parenteral nutrition (PN) is a vital therapeutic modality for neonates, children, and adults for a number of indications used in a variety of settings. Appropriate use of this complex ther-apy maximizes clinical benefit while minimizing the potential risk for adverse events. Complications occur both because of the PN admixture itself and the processes within which it is used. Many disparities exist in knowledge, skills, and PN prac-tices, some of which can contribute to PN-related medication errors.1 The 2004 revision of the Safe Practices for Parenteral Nutrition addressed the standardization of practices surround-ing PN to improve care and to limit medication errors.2 That publication remains a source document for A.S.P.E.N.’s ongo-ing commitment to patient safety with PN. The fact that PN is a high-alert medication requires healthcare organizations to develop evidence-based policies, procedures, and practices.
521833 PENXXX10.1177/0148607114521833Journal of Parenteral and Enteral NutritionBoullata et alresearch-article2014
From 1University of Pennsylvania, Philadelphia, Pennsylvania; 2Thomas Jefferson University Hospital, Philadelphia, Pennsylvania; 3Auburn University, Auburn, Alabama; 4Carl Vinson VA Medical Center, Macon, Georgia; 5University of Tennessee Health Science Center, Memphis, Tennessee; 6Medical College of Wisconsin, Milwaukee, Wisconsin; 7Vanderbilt University Medical Center, Nashville, Tennessee; 8Moffitt Cancer Center, Tampa, Florida; 9Nationwide Children’s, Columbus, Ohio; and 10A.S.P.E.N., Silver Spring, Maryland.
Financial disclosure: None declared.
Received for publication January 9, 2014; accepted for publication January 9, 2014.
This article originally appeared online on February 14, 2014.
Corresponding Author:Charlene Compher, PhD, RD, CNSD, LDN, FADA, FASPEN, University of Pennsylvania School of Nursing, Claire M. Fagin Hall, 418 Curie Boulevard, Philadelphia, PA 19104-4217, USA. Email: [email protected]
A.S.P.E.N. Clinical Guidelines: Parenteral Nutrition Ordering, Order Review, Compounding, Labeling, and Dispensing
Joseph I. Boullata, PharmD, RPh, BCNSP, FASPEN1; Karen Gilbert, RN, MSN, CNSC, CRNP2; Gordon Sacks, PharmD, BCNSP, FCCP3; Reginald J. Labossiere, MD4; Cathy Crill, PharmD, BCNSP5; Praveen Goday, MD, MBBS, CNSC6; Vanessa J. Kumpf, PharmD, BCNSP7; Todd W. Mattox, PharmD, BCNSP8; Steve Plogsted, PharmD, BCNSP, CNSC9; Beverly Holcombe, PharmD, BCNSP, FASHP10; and the American Society for Parenteral and Enteral Nutrition
AbstractBackground: Parenteral nutrition (PN) is a high-alert medication available for patient care within a complex clinical process. Beyond application of best practice recommendations to guide safe use and optimize clinical outcome, several issues are better addressed through evidence-based policies, procedures, and practices. This document provides evidence-based guidance for clinical practices involving PN prescribing, order review, and preparation. Method: A systematic review of the best available evidence was used by an expert work group to answer a series of questions about PN prescribing, order review, compounding, labeling, and dispensing. Concepts from the Grading of Recommendations, Assessment, Development and Evaluation (GRADE) format were applied as appropriate. The specific clinical guideline recommendations were developed using consensus prior to review and approval by the American Society for Parenteral and Enteral Nutrition (A.S.P.E.N.) Board of Directors. The following questions were addressed: (1) Does education of prescribers improve PN ordering? (2) What is the maximum safe osmolarity of PN admixtures intended for peripheral vein administration? (3) What are the appropriate calcium intake and calcium-phosphate ratios in PN for optimal neonatal bone mineralization? (4) What are the clinical advantages or disadvantages of commercially available premade (“premixed”) multichambered PN formulations compared with traditional/customized PN formulations? (5) What are the clinical (infection, catheter occlusion) advantages or disadvantages of 2-in-1 compared with 3-in-1 PN admixtures? (6) What macronutrient dosing limits are expected to provide for the most stable 3-in-1 admixtures? (7) What are the most appropriate recommendations for optimizing calcium (gluconate) and (Na- or K-) phosphate compatibility in PN admixtures? (8) What micronutrient contamination is present in parenteral stock solutions currently used to compound PN admixtures? (9) Is it safe to use the PN admixture as a vehicle for non-nutrient medication delivery? (10) Should heparin be included in the PN admixture to reduce the risk of central vein thrombosis? (11) What methods of repackaging intravenous fat emulsion (IVFE) into smaller patient-specific volumes are safe? (12) What beyond-use date should be used for (a) IVFE dispensed for separate infusion in the original container and (b) repackaged IVFE? (JPEN J Parenter Enteral Nutr. 2014;38:334-377)
Keywordsparenteral formulas/compounding; nutrition; parenteral nutrition; nutrition; clinical guidelines; GRADE
at SAINT FRANCIS HOSPITAL on March 13, 2015pen.sagepub.comDownloaded from
Boullata et al 335
Toward that end, A.S.P.E.N. is providing more current guid-ance documents for each healthcare organization to incorpo-rate. The A.S.P.E.N. Clinical Guidelines work group, in partnership with the A.S.P.E.N. PN Safety Task Force, devel-oped a number of questions related to PN practice that require adequate answers. While the task force developed PN Safety Consensus Recommendations3 to address questions with lim-ited evidence, the Clinical Guidelines work group took on the charge of evaluating the evidence for the remaining questions. The questions covering PN orders, order review, compound-ing, labeling, and dispensing are addressed in the current guidelines document.
Methodology
A.S.P.E.N. is an organization comprised of healthcare profes-sionals representing the disciplines of medicine, nursing, phar-macy, dietetics, and nutrition science. The mission of A.S.P.E.N. is to improve patient care by advancing the science and practice of clinical nutrition and metabolism. A.S.P.E.N. vigorously works to support quality patient care, education, and research in the fields of nutrition and metabolic support in all healthcare settings. These Clinical Guidelines were devel-oped under the guidance of the A.S.P.E.N. Board of Directors. Promotion of safe and effective patient care by nutrition sup-port practitioners is a critical role of the A.S.P.E.N. organiza-tion. A.S.P.E.N. has been publishing Clinical Guidelines since 1986.4-17
These A.S.P.E.N. Clinical Guidelines are based upon gen-eral conclusions of health professionals who, in developing such Clinical Guidelines, have balanced potential benefits to be derived from a particular mode of medical therapy against certain risks inherent with such therapy. However, the profes-sional judgment of the attending health professional is the pri-mary component of quality medical care. Because guidelines cannot account for every variation in circumstances, the prac-titioner must always exercise professional judgment in the application of these guidelines. These Clinical Guidelines are intended to supplement, but not replace, professional training and judgment.
A.S.P.E.N. Clinical Guidelines have adopted concepts of the GRADE working group.18-21 A full description of the meth-odology has been published.22 Briefly, specific clinical ques-tions where nutrition support is a relevant mode of therapy are developed and key clinical outcomes are identified. A rigorous search of the published literature is conducted, each included study is assessed for research quality, tables of findings are developed, and the body of evidence for the question is evalu-ated and graded. Randomized controlled clinical trials are ini-tially graded as strong evidence but may be downgraded in quality based on study limitations. Controlled observational studies are initially graded as weak evidence but may be graded down further based on study limitations or upgraded based on study design strengths. In a consensus process, the authors
make recommendations for clinical practice that are based on the evidence review assessed against consideration of the risks and benefits to patients. Recommendations are graded as strong when the evidence is strong and/or the risk vs benefit analysis is strong. Weak recommendations may be based on weaker evidence and/or weaker trade-offs to the patient. When limited research is available to answer a question, the recom-mendation is for further research to be conducted. The ques-tions are summarized in Table 1.
Evaluating the safety of nutrition preparations and products often requires data derived from in vitro studies. Some of the vital safety-related questions with patient outcome implica-tions that made use of in vitro evidence were included in this document. For example, in vitro data are necessary to evaluate stability, compatibility, and sterility. Although these studies do not align with the GRADE process, they are just as critical to the integrity of safe PN use in clinical practice. In these cases, the work group still conducted literature searches, evaluated the study quality, and provided evidence tables. Manuscripts were uniformly evaluated against quality criteria and are pro-vided in the tables of evidence. The strength of recommenda-tions based on in vitro data follows author considerations for potential risks to patients as well as the available evidence.
The Clinical Guideline authors, who represent a range of academic and clinical expertise, are involved in prescribing, reviewing, compounding, or labeling and dispensing PN. The external and internal expert reviewers, including the A.S.P.E.N. Board of Directors, have a similar, but even broader breadth of professional expertise. This Clinical Guideline is planned for revision in 2018.
Practice Guidelines and Recommendations
Question 1. Does education of prescribers improve PN ordering?
Recommendation: We suggest providing education to healthcare professionals to improve PN ordering, thereby reducing errors.
GRADE: Weak (Tables 2 and 3)Rationale: PN is a complex prescription therapy associated
with significant adverse effects. Deaths have occurred when safe practice guidelines were not followed.2 Appropriate and safe prescribing/ordering of PN is a critical first step and an essential component of the PN-use process. The prescriber should be well versed in the appropriate indications for PN as well as vascular access devices (peripheral and central) and their associated complications. There are few known studies evaluating the impact of safe prescribing education programs on the outcomes of patients receiving PN. Interdisciplinary teams, applying education as part of an overall quality inter-vention, have been successful in reducing unnecessary PN use and decreasing errors.23 In general medication prescribing, participating in education programs has been associated with
at SAINT FRANCIS HOSPITAL on March 13, 2015pen.sagepub.comDownloaded from
336 Journal of Parenteral and Enteral Nutrition 38(3)
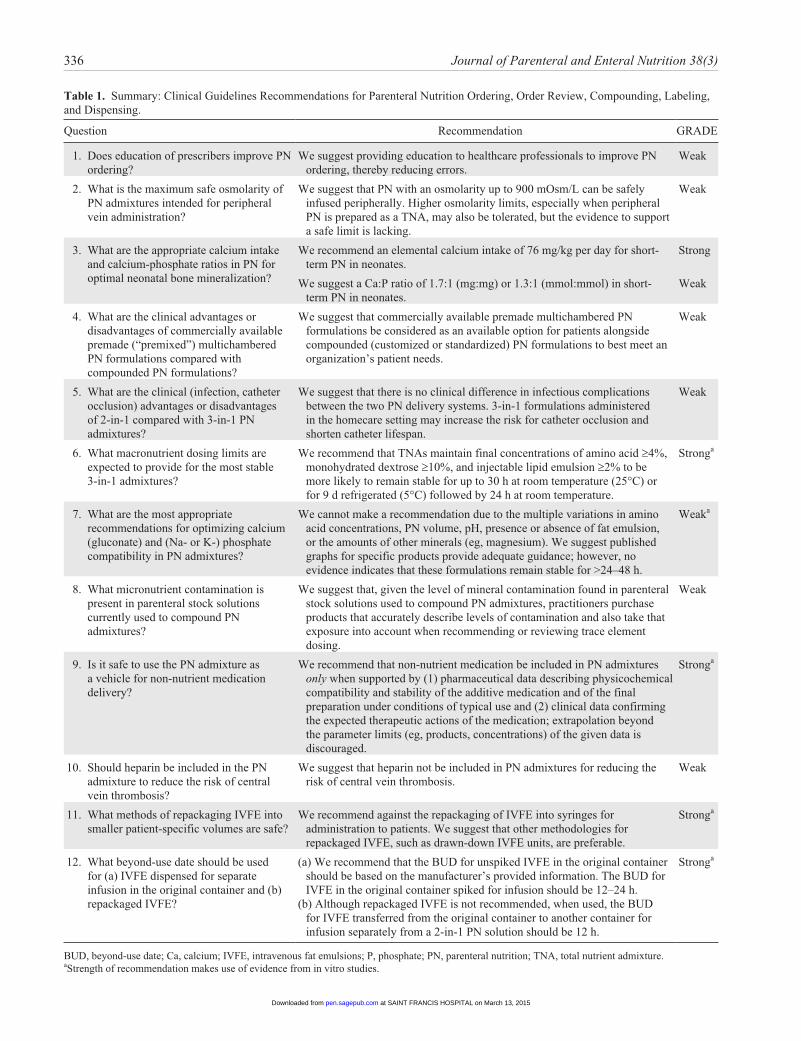
Table 1. Summary: Clinical Guidelines Recommendations for Parenteral Nutrition Ordering, Order Review, Compounding, Labeling, and Dispensing.
Question Recommendation GRADE
1. Does education of prescribers improve PN ordering?
We suggest providing education to healthcare professionals to improve PN ordering, thereby reducing errors.
Weak
2. What is the maximum safe osmolarity of PN admixtures intended for peripheral vein administration?
We suggest that PN with an osmolarity up to 900 mOsm/L can be safely infused peripherally. Higher osmolarity limits, especially when peripheral PN is prepared as a TNA, may also be tolerated, but the evidence to support a safe limit is lacking.
Weak
3. What are the appropriate calcium intake and calcium-phosphate ratios in PN for optimal neonatal bone mineralization?
We recommend an elemental calcium intake of 76 mg/kg per day for short-term PN in neonates.
Strong
We suggest a Ca:P ratio of 1.7:1 (mg:mg) or 1.3:1 (mmol:mmol) in short-term PN in neonates.
Weak
4. What are the clinical advantages or disadvantages of commercially available premade (“premixed”) multichambered PN formulations compared with compounded PN formulations?
We suggest that commercially available premade multichambered PN formulations be considered as an available option for patients alongside compounded (customized or standardized) PN formulations to best meet an organization’s patient needs.
Weak
5. What are the clinical (infection, catheter occlusion) advantages or disadvantages of 2-in-1 compared with 3-in-1 PN admixtures?
We suggest that there is no clinical difference in infectious complications between the two PN delivery systems. 3-in-1 formulations administered in the homecare setting may increase the risk for catheter occlusion and shorten catheter lifespan.
Weak
6. What macronutrient dosing limits are expected to provide for the most stable 3-in-1 admixtures?
We recommend that TNAs maintain final concentrations of amino acid ≥4%, monohydrated dextrose ≥10%, and injectable lipid emulsion ≥2% to be more likely to remain stable for up to 30 h at room temperature (25°C) or for 9 d refrigerated (5°C) followed by 24 h at room temperature.
Stronga
7. What are the most appropriate recommendations for optimizing calcium (gluconate) and (Na- or K-) phosphate compatibility in PN admixtures?
We cannot make a recommendation due to the multiple variations in amino acid concentrations, PN volume, pH, presence or absence of fat emulsion, or the amounts of other minerals (eg, magnesium). We suggest published graphs for specific products provide adequate guidance; however, no evidence indicates that these formulations remain stable for >24–48 h.
Weaka
8. What micronutrient contamination is present in parenteral stock solutions currently used to compound PN admixtures?
We suggest that, given the level of mineral contamination found in parenteral stock solutions used to compound PN admixtures, practitioners purchase products that accurately describe levels of contamination and also take that exposure into account when recommending or reviewing trace element dosing.
Weak
9. Is it safe to use the PN admixture as a vehicle for non-nutrient medication delivery?
We recommend that non-nutrient medication be included in PN admixtures only when supported by (1) pharmaceutical data describing physicochemical compatibility and stability of the additive medication and of the final preparation under conditions of typical use and (2) clinical data confirming the expected therapeutic actions of the medication; extrapolation beyond the parameter limits (eg, products, concentrations) of the given data is discouraged.
Stronga
10. Should heparin be included in the PN admixture to reduce the risk of central vein thrombosis?
We suggest that heparin not be included in PN admixtures for reducing the risk of central vein thrombosis.
Weak
11. What methods of repackaging IVFE into smaller patient-specific volumes are safe?
We recommend against the repackaging of IVFE into syringes for administration to patients. We suggest that other methodologies for repackaged IVFE, such as drawn-down IVFE units, are preferable.
Stronga
12. What beyond-use date should be used for (a) IVFE dispensed for separate infusion in the original container and (b) repackaged IVFE?
(a) We recommend that the BUD for unspiked IVFE in the original container should be based on the manufacturer’s provided information. The BUD for IVFE in the original container spiked for infusion should be 12–24 h.
(b) Although repackaged IVFE is not recommended, when used, the BUD for IVFE transferred from the original container to another container for infusion separately from a 2-in-1 PN solution should be 12 h.
Stronga
BUD, beyond-use date; Ca, calcium; IVFE, intravenous fat emulsions; P, phosphate; PN, parenteral nutrition; TNA, total nutrient admixture.aStrength of recommendation makes use of evidence from in vitro studies.
at SAINT FRANCIS HOSPITAL on March 13, 2015pen.sagepub.comDownloaded from
Boullata et al 337
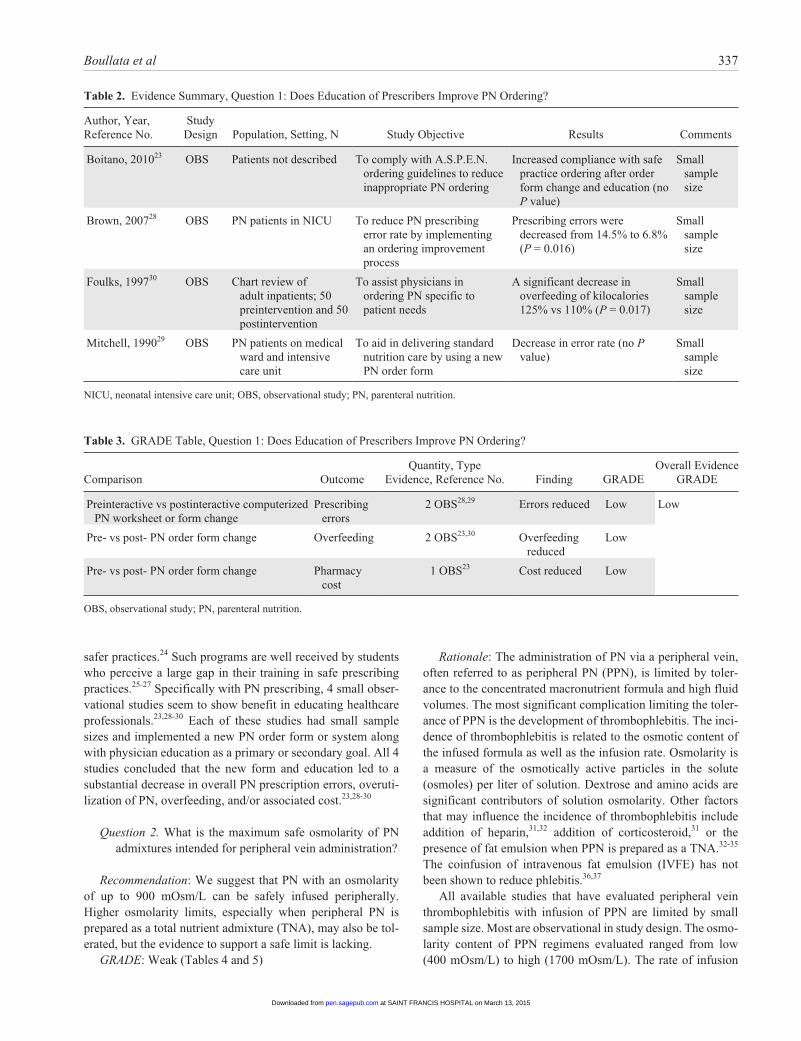
Table 2. Evidence Summary, Question 1: Does Education of Prescribers Improve PN Ordering?
Author, Year, Reference No.
Study Design Population, Setting, N Study Objective Results Comments
Boitano, 201023 OBS Patients not described To comply with A.S.P.E.N. ordering guidelines to reduce inappropriate PN ordering
Increased compliance with safe practice ordering after order form change and education (no P value)
Small sample size
Brown, 200728 OBS PN patients in NICU To reduce PN prescribing error rate by implementing an ordering improvement process
Prescribing errors were decreased from 14.5% to 6.8% (P = 0.016)
Small sample size
Foulks, 199730 OBS Chart review of adult inpatients; 50 preintervention and 50 postintervention
To assist physicians in ordering PN specific to patient needs
A significant decrease in overfeeding of kilocalories 125% vs 110% (P = 0.017)
Small sample size
Mitchell, 199029 OBS PN patients on medical ward and intensive care unit
To aid in delivering standard nutrition care by using a new PN order form
Decrease in error rate (no P value)
Small sample size
NICU, neonatal intensive care unit; OBS, observational study; PN, parenteral nutrition.
Table 3. GRADE Table, Question 1: Does Education of Prescribers Improve PN Ordering?
Comparison OutcomeQuantity, Type
Evidence, Reference No. Finding GRADEOverall Evidence
GRADE
Preinteractive vs postinteractive computerized PN worksheet or form change
Prescribing errors
2 OBS28,29 Errors reduced Low Low
Pre- vs post- PN order form change Overfeeding 2 OBS23,30 Overfeeding reduced
Low
Pre- vs post- PN order form change Pharmacy cost
1 OBS23 Cost reduced Low
OBS, observational study; PN, parenteral nutrition.
safer practices.24 Such programs are well received by students who perceive a large gap in their training in safe prescribing practices.25-27 Specifically with PN prescribing, 4 small obser-vational studies seem to show benefit in educating healthcare professionals.23,28-30 Each of these studies had small sample sizes and implemented a new PN order form or system along with physician education as a primary or secondary goal. All 4 studies concluded that the new form and education led to a substantial decrease in overall PN prescription errors, overuti-lization of PN, overfeeding, and/or associated cost.23,28-30
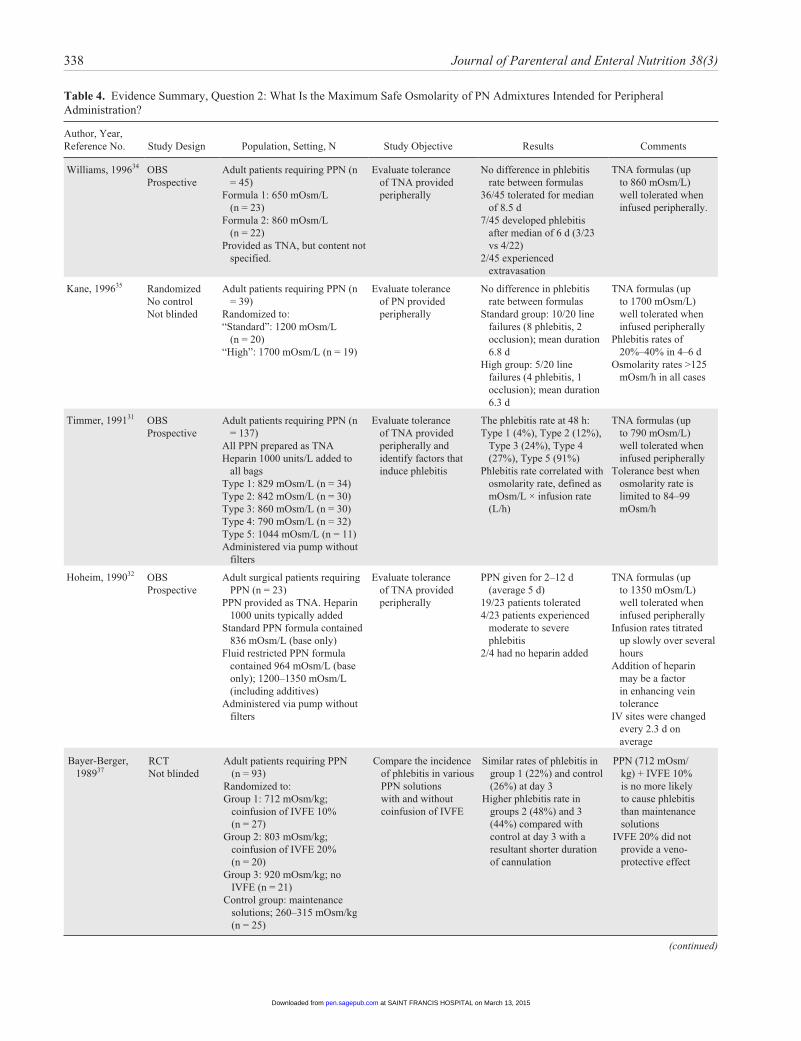
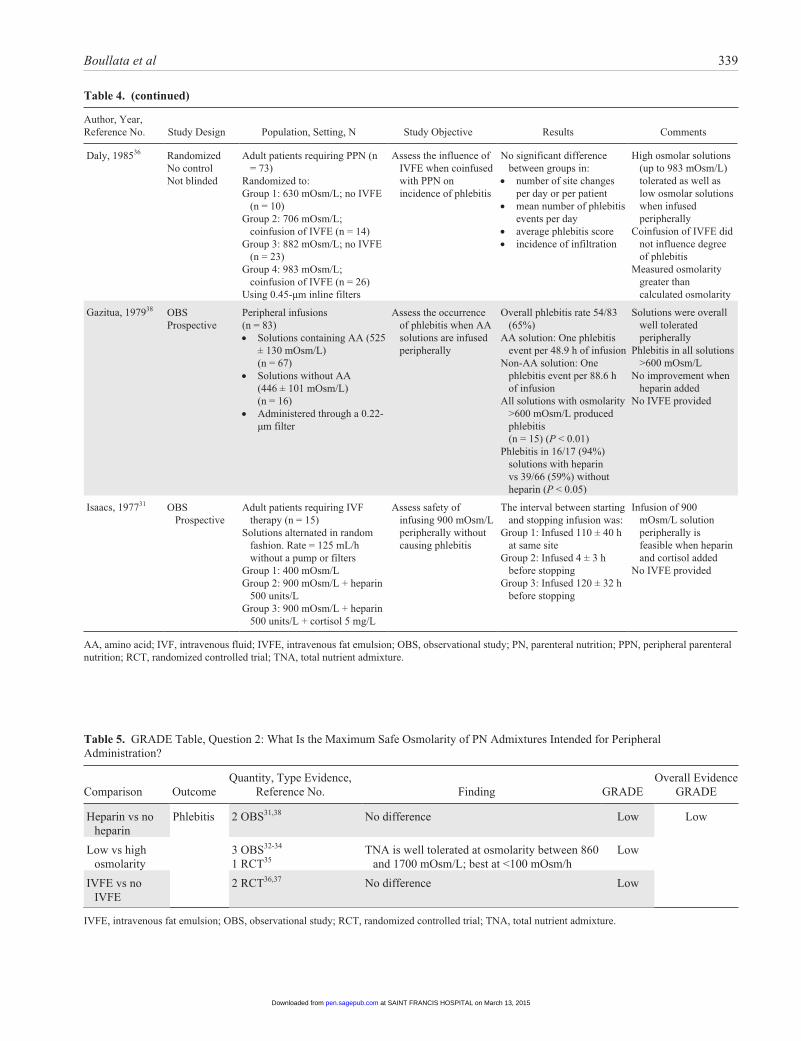
Question 2. What is the maximum safe osmolarity of PN admixtures intended for peripheral vein administration?
Recommendation: We suggest that PN with an osmolarity of up to 900 mOsm/L can be safely infused peripherally. Higher osmolarity limits, especially when peripheral PN is prepared as a total nutrient admixture (TNA), may also be tol-erated, but the evidence to support a safe limit is lacking.
GRADE: Weak (Tables 4 and 5)
Rationale: The administration of PN via a peripheral vein, often referred to as peripheral PN (PPN), is limited by toler-ance to the concentrated macronutrient formula and high fluid volumes. The most significant complication limiting the toler-ance of PPN is the development of thrombophlebitis. The inci-dence of thrombophlebitis is related to the osmotic content of the infused formula as well as the infusion rate. Osmolarity is a measure of the osmotically active particles in the solute (osmoles) per liter of solution. Dextrose and amino acids are significant contributors of solution osmolarity. Other factors that may influence the incidence of thrombophlebitis include addition of heparin,31,32 addition of corticosteroid,31 or the presence of fat emulsion when PPN is prepared as a TNA.32-35 The coinfusion of intravenous fat emulsion (IVFE) has not been shown to reduce phlebitis.36,37
All available studies that have evaluated peripheral vein thrombophlebitis with infusion of PPN are limited by small sample size. Most are observational in study design. The osmo-larity content of PPN regimens evaluated ranged from low (400 mOsm/L) to high (1700 mOsm/L). The rate of infusion
at SAINT FRANCIS HOSPITAL on March 13, 2015pen.sagepub.comDownloaded from
338 Journal of Parenteral and Enteral Nutrition 38(3)
Table 4. Evidence Summary, Question 2: What Is the Maximum Safe Osmolarity of PN Admixtures Intended for Peripheral Administration?
Author, Year, Reference No. Study Design Population, Setting, N Study Objective Results Comments
Williams, 199634 OBSProspective
Adult patients requiring PPN (n = 45)
Formula 1: 650 mOsm/L (n = 23)
Formula 2: 860 mOsm/L (n = 22)
Provided as TNA, but content not specified.
Evaluate tolerance of TNA provided peripherally
No difference in phlebitis rate between formulas
36/45 tolerated for median of 8.5 d
7/45 developed phlebitis after median of 6 d (3/23 vs 4/22)
2/45 experienced extravasation
TNA formulas (up to 860 mOsm/L) well tolerated when infused peripherally.
Kane, 199635 RandomizedNo controlNot blinded
Adult patients requiring PPN (n = 39)
Randomized to:“Standard”: 1200 mOsm/L
(n = 20)“High”: 1700 mOsm/L (n = 19)
Evaluate tolerance of PN provided peripherally
No difference in phlebitis rate between formulas
Standard group: 10/20 line failures (8 phlebitis, 2 occlusion); mean duration 6.8 d
High group: 5/20 line failures (4 phlebitis, 1 occlusion); mean duration 6.3 d
TNA formulas (up to 1700 mOsm/L) well tolerated when infused peripherally
Phlebitis rates of 20%–40% in 4–6 d
Osmolarity rates >125 mOsm/h in all cases
Timmer, 199131 OBSProspective
Adult patients requiring PPN (n = 137)
All PPN prepared as TNAHeparin 1000 units/L added to
all bagsType 1: 829 mOsm/L (n = 34)Type 2: 842 mOsm/L (n = 30)Type 3: 860 mOsm/L (n = 30)Type 4: 790 mOsm/L (n = 32)Type 5: 1044 mOsm/L (n = 11)Administered via pump without
filters
Evaluate tolerance of TNA provided peripherally and identify factors that induce phlebitis
The phlebitis rate at 48 h:Type 1 (4%), Type 2 (12%),
Type 3 (24%), Type 4 (27%), Type 5 (91%)
Phlebitis rate correlated with osmolarity rate, defined as mOsm/L × infusion rate (L/h)
TNA formulas (up to 790 mOsm/L) well tolerated when infused peripherally
Tolerance best when osmolarity rate is limited to 84–99 mOsm/h
Hoheim, 199032 OBSProspective
Adult surgical patients requiring PPN (n = 23)
PPN provided as TNA. Heparin 1000 units typically added
Standard PPN formula contained 836 mOsm/L (base only)
Fluid restricted PPN formula contained 964 mOsm/L (base only); 1200–1350 mOsm/L (including additives)
Administered via pump without filters
Evaluate tolerance of TNA provided peripherally
PPN given for 2–12 d (average 5 d)
19/23 patients tolerated4/23 patients experienced
moderate to severe phlebitis
2/4 had no heparin added
TNA formulas (up to 1350 mOsm/L) well tolerated when infused peripherally
Infusion rates titrated up slowly over several hours
Addition of heparin may be a factor in enhancing vein tolerance
IV sites were changed every 2.3 d on average
Bayer-Berger, 198937
RCTNot blinded
Adult patients requiring PPN (n = 93)
Randomized to:Group 1: 712 mOsm/kg;
coinfusion of IVFE 10% (n = 27)
Group 2: 803 mOsm/kg; coinfusion of IVFE 20% (n = 20)
Group 3: 920 mOsm/kg; no IVFE (n = 21)
Control group: maintenance solutions; 260–315 mOsm/kg (n = 25)
Compare the incidence of phlebitis in various PPN solutions with and without coinfusion of IVFE
Similar rates of phlebitis in group 1 (22%) and control (26%) at day 3
Higher phlebitis rate in groups 2 (48%) and 3 (44%) compared with control at day 3 with a resultant shorter duration of cannulation
PPN (712 mOsm/kg) + IVFE 10% is no more likely to cause phlebitis than maintenance solutions
IVFE 20% did not provide a veno-protective effect
(continued)
at SAINT FRANCIS HOSPITAL on March 13, 2015pen.sagepub.comDownloaded from
Boullata et al 339
Author, Year, Reference No. Study Design Population, Setting, N Study Objective Results Comments
Daly, 198536 RandomizedNo controlNot blinded
Adult patients requiring PPN (n = 73)
Randomized to:Group 1: 630 mOsm/L; no IVFE
(n = 10)Group 2: 706 mOsm/L;
coinfusion of IVFE (n = 14)Group 3: 882 mOsm/L; no IVFE
(n = 23)Group 4: 983 mOsm/L;
coinfusion of IVFE (n = 26)Using 0.45-µm inline filters
Assess the influence of IVFE when coinfused with PPN on incidence of phlebitis
No significant difference between groups in:
• number of site changes per day or per patient
• mean number of phlebitis events per day
• average phlebitis score• incidence of infiltration
High osmolar solutions (up to 983 mOsm/L) tolerated as well as low osmolar solutions when infused peripherally
Coinfusion of IVFE did not influence degree of phlebitis
Measured osmolarity greater than calculated osmolarity
Gazitua, 197938 OBSProspective
Peripheral infusions(n = 83)• Solutions containing AA (525
± 130 mOsm/L) (n = 67)
• Solutions without AA (446 ± 101 mOsm/L) (n = 16)
• Administered through a 0.22-µm filter
Assess the occurrence of phlebitis when AA solutions are infused peripherally
Overall phlebitis rate 54/83 (65%)
AA solution: One phlebitis event per 48.9 h of infusion
Non-AA solution: One phlebitis event per 88.6 h of infusion
All solutions with osmolarity >600 mOsm/L produced phlebitis (n = 15) (P < 0.01)
Phlebitis in 16/17 (94%) solutions with heparin vs 39/66 (59%) without heparin (P < 0.05)
Solutions were overall well tolerated peripherally
Phlebitis in all solutions >600 mOsm/L
No improvement when heparin added
No IVFE provided
Isaacs, 197731 OBS Prospective
Adult patients requiring IVF therapy (n = 15)
Solutions alternated in random fashion. Rate = 125 mL/h without a pump or filters
Group 1: 400 mOsm/L Group 2: 900 mOsm/L + heparin
500 units/L Group 3: 900 mOsm/L + heparin
500 units/L + cortisol 5 mg/L
Assess safety of infusing 900 mOsm/L peripherally without causing phlebitis
The interval between starting and stopping infusion was:
Group 1: Infused 110 ± 40 h at same site
Group 2: Infused 4 ± 3 h before stopping
Group 3: Infused 120 ± 32 h before stopping
Infusion of 900 mOsm/L solution peripherally is feasible when heparin and cortisol added
No IVFE provided
AA, amino acid; IVF, intravenous fluid; IVFE, intravenous fat emulsion; OBS, observational study; PN, parenteral nutrition; PPN, peripheral parenteral nutrition; RCT, randomized controlled trial; TNA, total nutrient admixture.
Table 4. (continued)
Table 5. GRADE Table, Question 2: What Is the Maximum Safe Osmolarity of PN Admixtures Intended for Peripheral Administration?
Comparison OutcomeQuantity, Type Evidence,
Reference No. Finding GRADEOverall Evidence
GRADE
Heparin vs no heparin
Phlebitis 2 OBS31,38 No difference Low Low
Low vs high osmolarity
3 OBS32-34
1 RCT35TNA is well tolerated at osmolarity between 860
and 1700 mOsm/L; best at <100 mOsm/hLow
IVFE vs no IVFE
2 RCT36,37 No difference Low
IVFE, intravenous fat emulsion; OBS, observational study; RCT, randomized controlled trial; TNA, total nutrient admixture.
at SAINT FRANCIS HOSPITAL on March 13, 2015pen.sagepub.comDownloaded from
340 Journal of Parenteral and Enteral Nutrition 38(3)
was often not controlled or described in the methods or in the results. Osmolarity rates <100 mOsm/h improve patient toler-ance.33 There is no consensus on what is considered a “tolera-ble” rate of thrombophlebitis or an acceptable duration of infusion before phlebitis occurs. Kane et al35 accepted a throm-bophlebitis rate of 30% and found that peripheral intravenous (IV) cannulas remained patent for an average of 6.3 days in patients receiving a high osmolarity (1700 mOsm/L) PPN. The high osmolarity PPN formula evaluated in this study contained IVFE prepared as a TNA. Older studies that did not incorpo-rate IVFE with the PPN regimen or included the coinfusion of IVFE found that peripheral infusion was generally well tolerated with osmolarity limited to approximately 900 mOsm/L.31,36-38
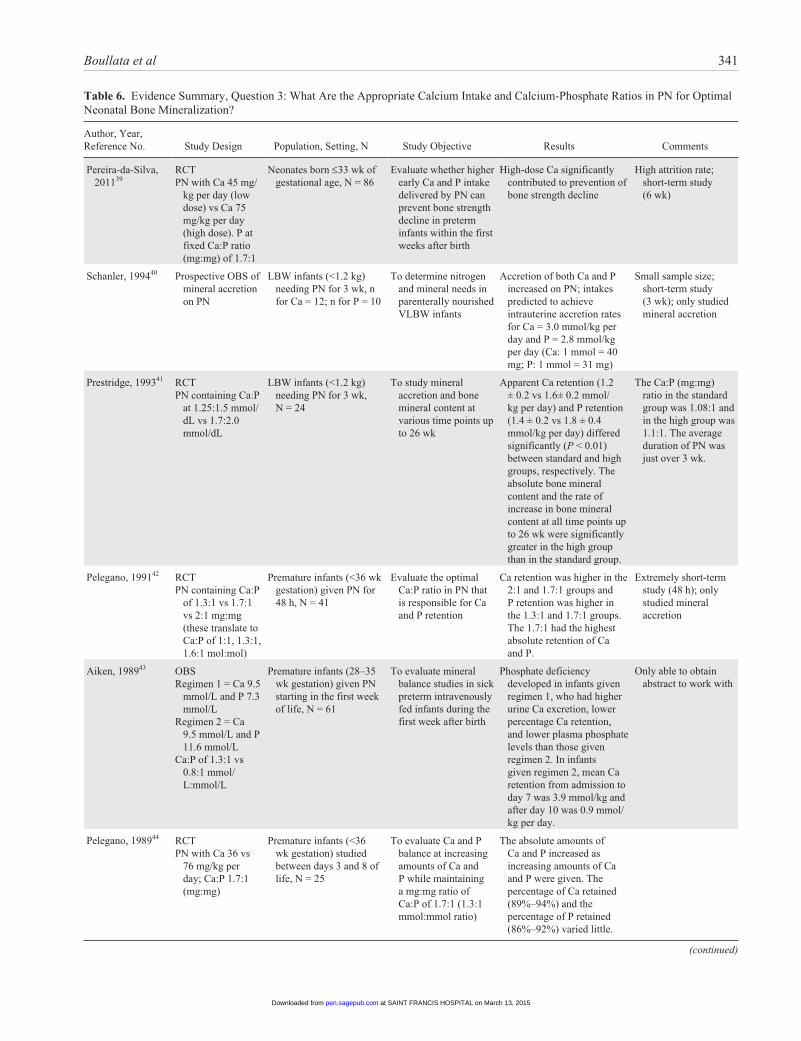
Question 3. What are the appropriate calcium intake and calcium-phosphate ratios in PN for optimal neonatal bone mineralization?
Recommendation: We recommend an elemental calcium intake of 76 mg/kg per day for short-term PN in neonates.
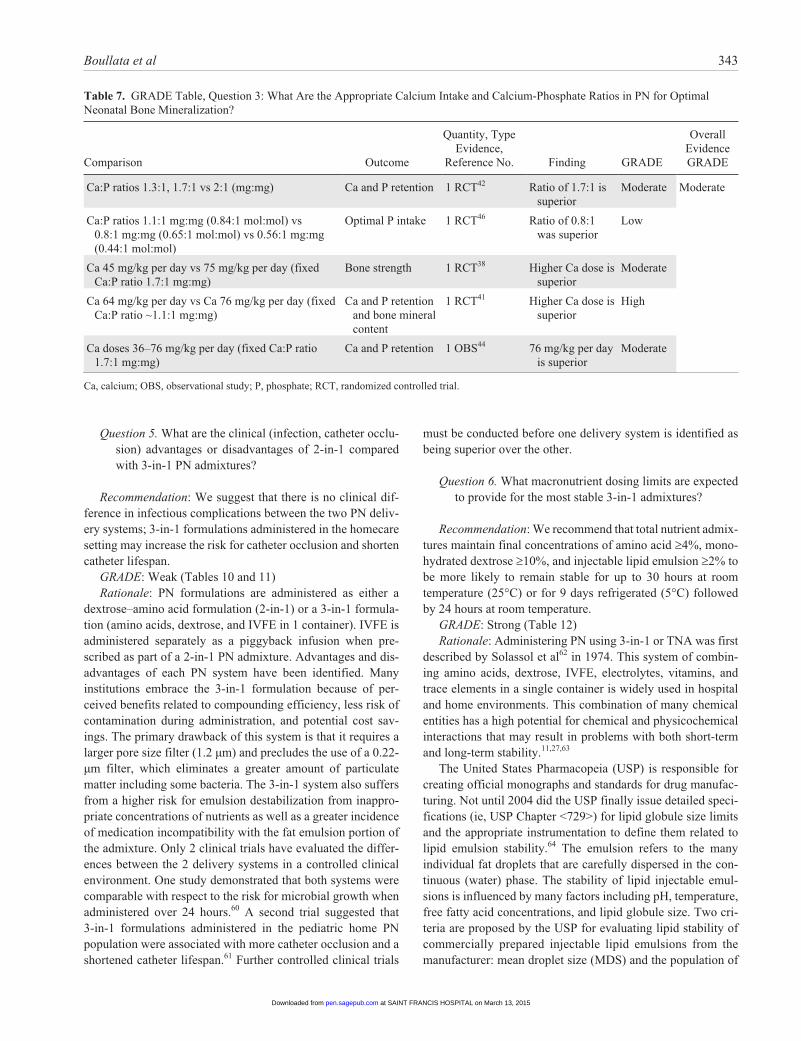
GRADE: Strong (Tables 6 and 7)Recommendation: We suggest a Ca:P ratio of 1.7:1 (mg:mg)
or 1.3:1 (mmol:mmol) in short-term PN in neonates.GRADE: WeakRationale: Although the body’s pools of phosphorus and
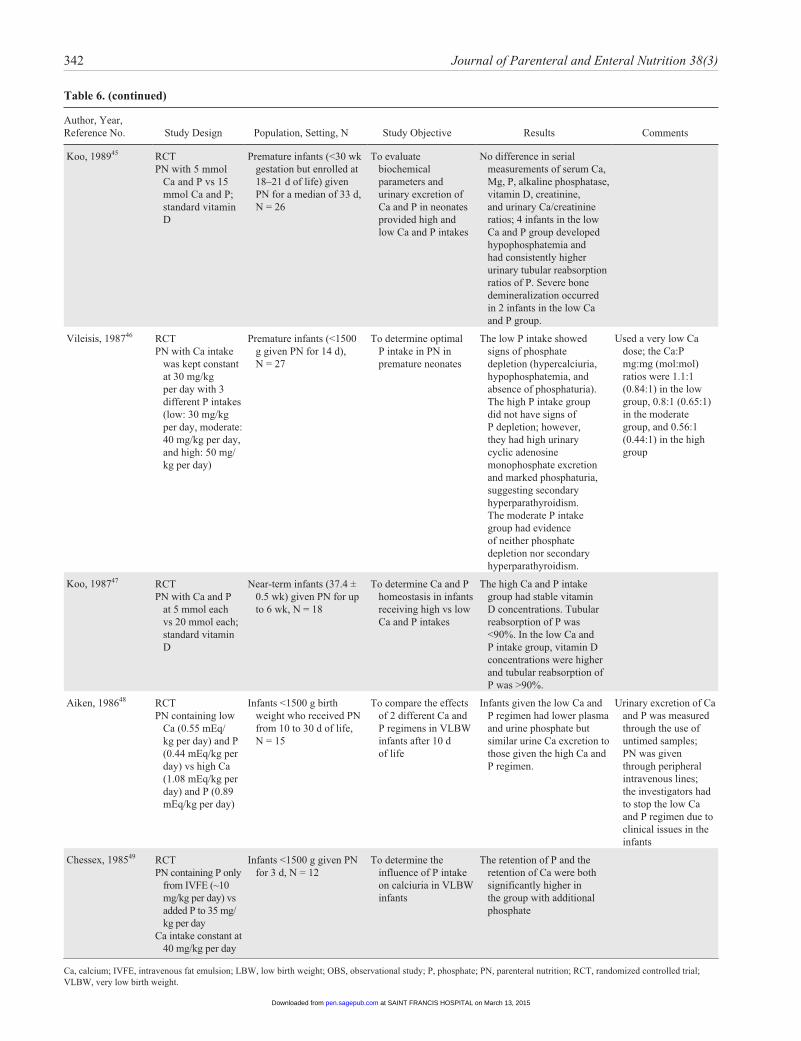
phosphate are in equilibrium, it is as phosphate that the mineral participates in biological processes and the form it takes in PN. This review initially attempted to study the ideal calcium-phos-phate ratio (Ca:P) for the premature neonate on long-term PN therapy. Only studies of standard solutions using inorganic salts were included in the analysis. The longest study lasted 6 weeks, so true recommendations regarding long-term PN therapy can-not be made. In short-term PN, a Ca:P of 1.7:1 mg:mg (1.3:1 mmol:mmol) is associated with the best calcium and phosphate retention based on quantitative ultrasonography.39 In short-term PN, a parenteral calcium intake of 75 mg/kg per day with a parenteral phosphate intake of 45 mg/kg per day may be associ-ated with better bone strength.39 The optimal methods to ana-lyze calcium and phosphorus nutrition would be an analysis of bone mineral content and/or density. In short-term studies, cal-cium and phosphate retention rates serve as surrogates. In the face of recent product shortages, it is important to note that in a single study, provision of calcium and phosphate on alternate days in PN was associated with significant urinary losses of both calcium and phosphate on each day.1
Question 4. What are the clinical advantages or disadvan-tages of commercially available premade (“premixed”) multichambered PN formulations compared with com-pounded PN formulations?
Recommendation: We suggest that commercially available premade multichambered PN products be considered as an available option for patients alongside compounded (custom-ized or standardized) PN formulations to best meet an organi-zation’s patient needs.
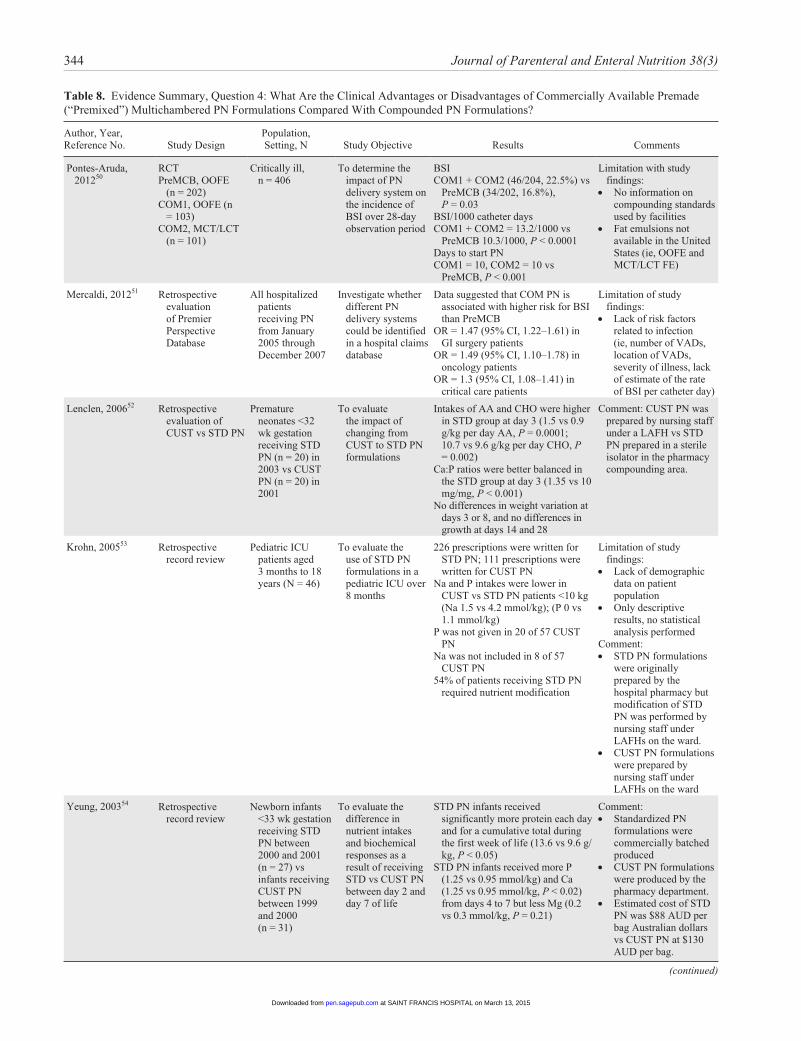
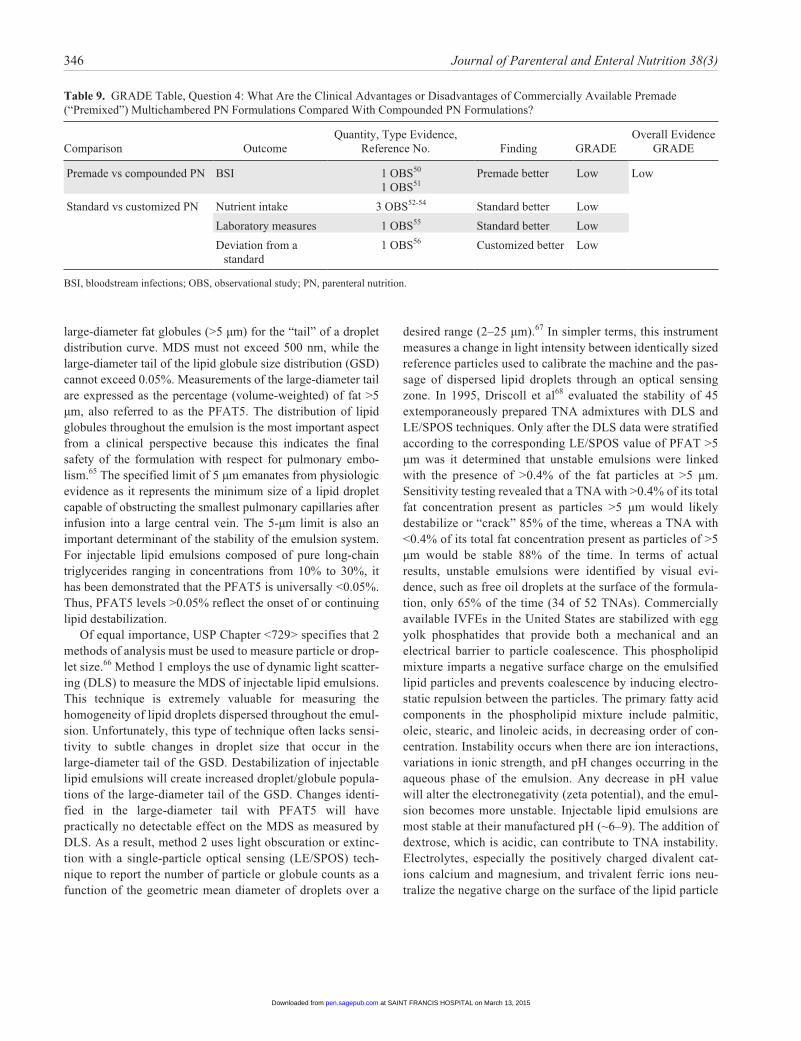
GRADE: Weak (Tables 8 and 9)Rationale: Commercially available PN formulations pre-
made in single container or multichamber bags, often referred to as “premixed” although they require mixing in the pharmacy as part of their preparation, have been promoted as safer and more efficient delivery systems for macronutrients and micro-nutrients compared with traditional formulations prepared using manual or automated compounding techniques. Compounded PN formulations are often customized to a patient’s needs (ie, custom) or may instead be prepared as insti-tutionally defined specific standard formulations (ie, standard). However, the literature must be critically examined in order to determine the advantages and disadvantages of each delivery method. Most of the controlled clinical trials do not directly compare the use of “premixed” standard with compounded cus-tomized PN systems for patient outcomes, efficacy, or safety.50-56 Rather, the available literature focuses on sequential evaluations of institutions after converting from one delivery approach to another system (ie, customized to standardized PN formulations). A majority of the literature is derived from European experiences, including some within the neonatal pop-ulation. Primary outcome parameters have included labor and inventory costs, preparation time, nursing effort, and adminis-tration/delivery procedures. An A.S.P.E.N. Consensus Recommendation determined that the basis for identifying the best delivery system should be predicated upon the number and type of patients requiring PN within a specific healthcare orga-nization.57 The British Pharmaceutical Nutrition Group con-cluded that the appropriateness of the patient and the decision to use “premixed” PN formulations must be determined by appro-priately trained nutrition support clinicians.58 Three factors to be considered in making the final determination are the evalua-tion of clinical outcomes, safety, and cost.59 Because of the lim-ited availability of commercial products, many clinicians find that “premixed” PN formulations often will not meet the caloric, amino acid, and electrolyte needs of critically ill patients, who are often obese, require fluid restriction, and display hepatic/renal dysfunction. These products have particularly been criti-cized for their high dextrose concentrations, which could increase the risk of hyperglycemia and infection. Patient safety data are lacking for a reduction of errors associated with “pre-mixed” PN products in relation to prescribing, compounding, and administration. Some studies do suggest cost and efficiency advantages in favor of commercially available “premixed” PN formulations over traditional modes of PN delivery. As a result, “premixed” PN formulations can be useful in appropriate patient populations when screened and assessed by suitably trained clinicians with expertise in nutrition support therapy.
at SAINT FRANCIS HOSPITAL on March 13, 2015pen.sagepub.comDownloaded from
Boullata et al 341
Table 6. Evidence Summary, Question 3: What Are the Appropriate Calcium Intake and Calcium-Phosphate Ratios in PN for Optimal Neonatal Bone Mineralization?
Author, Year, Reference No. Study Design Population, Setting, N Study Objective Results Comments
Pereira-da-Silva, 201139
RCTPN with Ca 45 mg/
kg per day (low dose) vs Ca 75 mg/kg per day (high dose). P at fixed Ca:P ratio (mg:mg) of 1.7:1
Neonates born ≤33 wk of gestational age, N = 86
Evaluate whether higher early Ca and P intake delivered by PN can prevent bone strength decline in preterm infants within the first weeks after birth
High-dose Ca significantly contributed to prevention of bone strength decline
High attrition rate; short-term study (6 wk)
Schanler, 199440 Prospective OBS of mineral accretion on PN
LBW infants (<1.2 kg) needing PN for 3 wk, n for Ca = 12; n for P = 10
To determine nitrogen and mineral needs in parenterally nourished VLBW infants
Accretion of both Ca and P increased on PN; intakes predicted to achieve intrauterine accretion rates for Ca = 3.0 mmol/kg per day and P = 2.8 mmol/kg per day (Ca: 1 mmol = 40 mg; P: 1 mmol = 31 mg)
Small sample size; short-term study (3 wk); only studied mineral accretion
Prestridge, 199341 RCTPN containing Ca:P
at 1.25:1.5 mmol/dL vs 1.7:2.0 mmol/dL
LBW infants (<1.2 kg) needing PN for 3 wk, N = 24
To study mineral accretion and bone mineral content at various time points up to 26 wk
Apparent Ca retention (1.2 ± 0.2 vs 1.6± 0.2 mmol/kg per day) and P retention (1.4 ± 0.2 vs 1.8 ± 0.4 mmol/kg per day) differed significantly (P < 0.01) between standard and high groups, respectively. The absolute bone mineral content and the rate of increase in bone mineral content at all time points up to 26 wk were significantly greater in the high group than in the standard group.
The Ca:P (mg:mg) ratio in the standard group was 1.08:1 and in the high group was 1.1:1. The average duration of PN was just over 3 wk.
Pelegano, 199142 RCTPN containing Ca:P
of 1.3:1 vs 1.7:1 vs 2:1 mg:mg (these translate to Ca:P of 1:1, 1.3:1, 1.6:1 mol:mol)
Premature infants (<36 wk gestation) given PN for 48 h, N = 41
Evaluate the optimal Ca:P ratio in PN that is responsible for Ca and P retention
Ca retention was higher in the 2:1 and 1.7:1 groups and P retention was higher in the 1.3:1 and 1.7:1 groups. The 1.7:1 had the highest absolute retention of Ca and P.
Extremely short-term study (48 h); only studied mineral accretion
Aiken, 198943 OBSRegimen 1 = Ca 9.5
mmol/L and P 7.3 mmol/L
Regimen 2 = Ca 9.5 mmol/L and P 11.6 mmol/L
Ca:P of 1.3:1 vs 0.8:1 mmol/L:mmol/L
Premature infants (28–35 wk gestation) given PN starting in the first week of life, N = 61
To evaluate mineral balance studies in sick preterm intravenously fed infants during the first week after birth
Phosphate deficiency developed in infants given regimen 1, who had higher urine Ca excretion, lower percentage Ca retention, and lower plasma phosphate levels than those given regimen 2. In infants given regimen 2, mean Ca retention from admission to day 7 was 3.9 mmol/kg and after day 10 was 0.9 mmol/kg per day.
Only able to obtain abstract to work with
Pelegano, 198944 RCTPN with Ca 36 vs
76 mg/kg per day; Ca:P 1.7:1 (mg:mg)
Premature infants (<36 wk gestation) studied between days 3 and 8 of life, N = 25
To evaluate Ca and P balance at increasing amounts of Ca and P while maintaining a mg:mg ratio of Ca:P of 1.7:1 (1.3:1 mmol:mmol ratio)
The absolute amounts of Ca and P increased as increasing amounts of Ca and P were given. The percentage of Ca retained (89%–94%) and the percentage of P retained (86%–92%) varied little.
(continued)
at SAINT FRANCIS HOSPITAL on March 13, 2015pen.sagepub.comDownloaded from
342 Journal of Parenteral and Enteral Nutrition 38(3)
Author, Year, Reference No. Study Design Population, Setting, N Study Objective Results Comments
Koo, 198945 RCTPN with 5 mmol
Ca and P vs 15 mmol Ca and P; standard vitamin D
Premature infants (<30 wk gestation but enrolled at 18–21 d of life) given PN for a median of 33 d, N = 26
To evaluate biochemical parameters and urinary excretion of Ca and P in neonates provided high and low Ca and P intakes
No difference in serial measurements of serum Ca, Mg, P, alkaline phosphatase, vitamin D, creatinine, and urinary Ca/creatinine ratios; 4 infants in the low Ca and P group developed hypophosphatemia and had consistently higher urinary tubular reabsorption ratios of P. Severe bone demineralization occurred in 2 infants in the low Ca and P group.
Vileisis, 198746 RCTPN with Ca intake
was kept constant at 30 mg/kg per day with 3 different P intakes (low: 30 mg/kg per day, moderate: 40 mg/kg per day, and high: 50 mg/kg per day)
Premature infants (<1500 g given PN for 14 d), N = 27
To determine optimal P intake in PN in premature neonates
The low P intake showed signs of phosphate depletion (hypercalciuria, hypophosphatemia, and absence of phosphaturia). The high P intake group did not have signs of P depletion; however, they had high urinary cyclic adenosine monophosphate excretion and marked phosphaturia, suggesting secondary hyperparathyroidism. The moderate P intake group had evidence of neither phosphate depletion nor secondary hyperparathyroidism.
Used a very low Ca dose; the Ca:P mg:mg (mol:mol) ratios were 1.1:1 (0.84:1) in the low group, 0.8:1 (0.65:1) in the moderate group, and 0.56:1 (0.44:1) in the high group
Koo, 198747 RCTPN with Ca and P
at 5 mmol each vs 20 mmol each; standard vitamin D
Near-term infants (37.4 ± 0.5 wk) given PN for up to 6 wk, N = 18
To determine Ca and P homeostasis in infants receiving high vs low Ca and P intakes
The high Ca and P intake group had stable vitamin D concentrations. Tubular reabsorption of P was <90%. In the low Ca and P intake group, vitamin D concentrations were higher and tubular reabsorption of P was >90%.
Aiken, 198648 RCTPN containing low
Ca (0.55 mEq/kg per day) and P (0.44 mEq/kg per day) vs high Ca (1.08 mEq/kg per day) and P (0.89 mEq/kg per day)
Infants <1500 g birth weight who received PN from 10 to 30 d of life, N = 15
To compare the effects of 2 different Ca and P regimens in VLBW infants after 10 d of life
Infants given the low Ca and P regimen had lower plasma and urine phosphate but similar urine Ca excretion to those given the high Ca and P regimen.
Urinary excretion of Ca and P was measured through the use of untimed samples; PN was given through peripheral intravenous lines; the investigators had to stop the low Ca and P regimen due to clinical issues in the infants
Chessex, 198549 RCTPN containing P only
from IVFE (~10 mg/kg per day) vs added P to 35 mg/kg per day
Ca intake constant at 40 mg/kg per day
Infants <1500 g given PN for 3 d, N = 12
To determine the influence of P intake on calciuria in VLBW infants
The retention of P and the retention of Ca were both significantly higher in the group with additional phosphate
Ca, calcium; IVFE, intravenous fat emulsion; LBW, low birth weight; OBS, observational study; P, phosphate; PN, parenteral nutrition; RCT, randomized controlled trial; VLBW, very low birth weight.
Table 6. (continued)
at SAINT FRANCIS HOSPITAL on March 13, 2015pen.sagepub.comDownloaded from
Boullata et al 343
Table 7. GRADE Table, Question 3: What Are the Appropriate Calcium Intake and Calcium-Phosphate Ratios in PN for Optimal Neonatal Bone Mineralization?
Comparison Outcome
Quantity, Type Evidence,
Reference No. Finding GRADE
Overall Evidence GRADE
Ca:P ratios 1.3:1, 1.7:1 vs 2:1 (mg:mg) Ca and P retention 1 RCT42 Ratio of 1.7:1 is superior
Moderate Moderate
Ca:P ratios 1.1:1 mg:mg (0.84:1 mol:mol) vs 0.8:1 mg:mg (0.65:1 mol:mol) vs 0.56:1 mg:mg (0.44:1 mol:mol)
Optimal P intake 1 RCT46 Ratio of 0.8:1 was superior
Low
Ca 45 mg/kg per day vs 75 mg/kg per day (fixed Ca:P ratio 1.7:1 mg:mg)
Bone strength 1 RCT38 Higher Ca dose is superior
Moderate
Ca 64 mg/kg per day vs Ca 76 mg/kg per day (fixed Ca:P ratio ~1.1:1 mg:mg)
Ca and P retention and bone mineral content
1 RCT41 Higher Ca dose is superior
High
Ca doses 36–76 mg/kg per day (fixed Ca:P ratio 1.7:1 mg:mg)
Ca and P retention 1 OBS44 76 mg/kg per day is superior
Moderate
Ca, calcium; OBS, observational study; P, phosphate; RCT, randomized controlled trial.
Question 5. What are the clinical (infection, catheter occlu-sion) advantages or disadvantages of 2-in-1 compared with 3-in-1 PN admixtures?
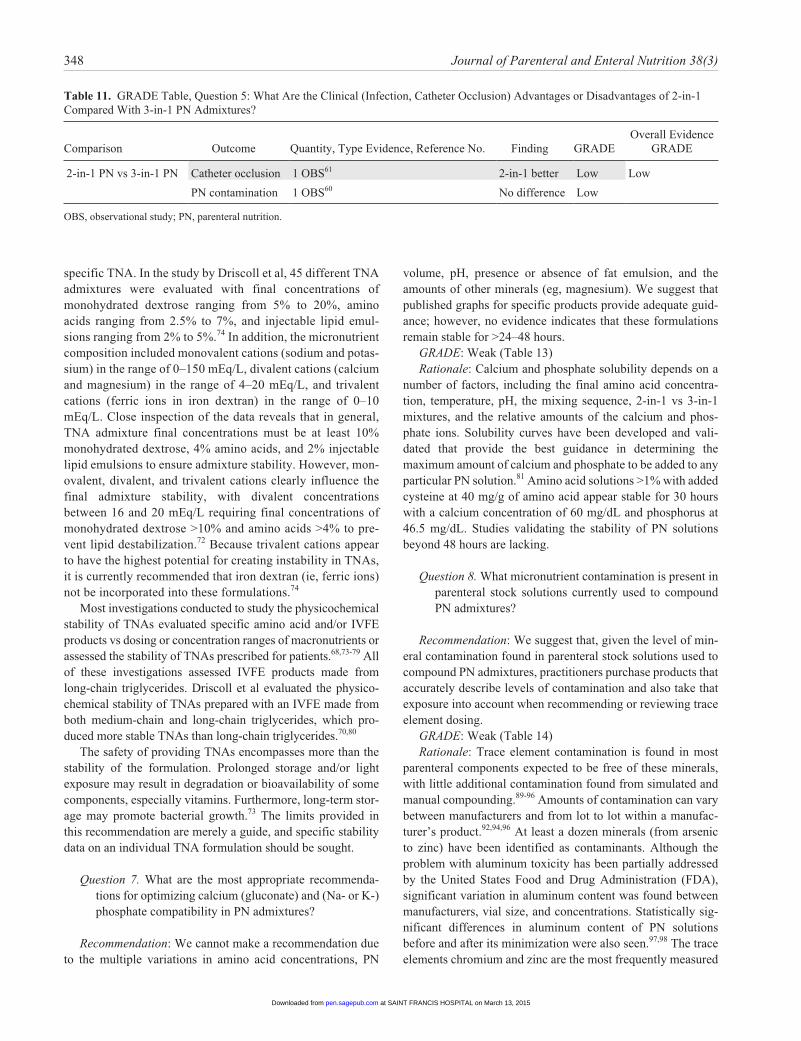
Recommendation: We suggest that there is no clinical dif-ference in infectious complications between the two PN deliv-ery systems; 3-in-1 formulations administered in the homecare setting may increase the risk for catheter occlusion and shorten catheter lifespan.
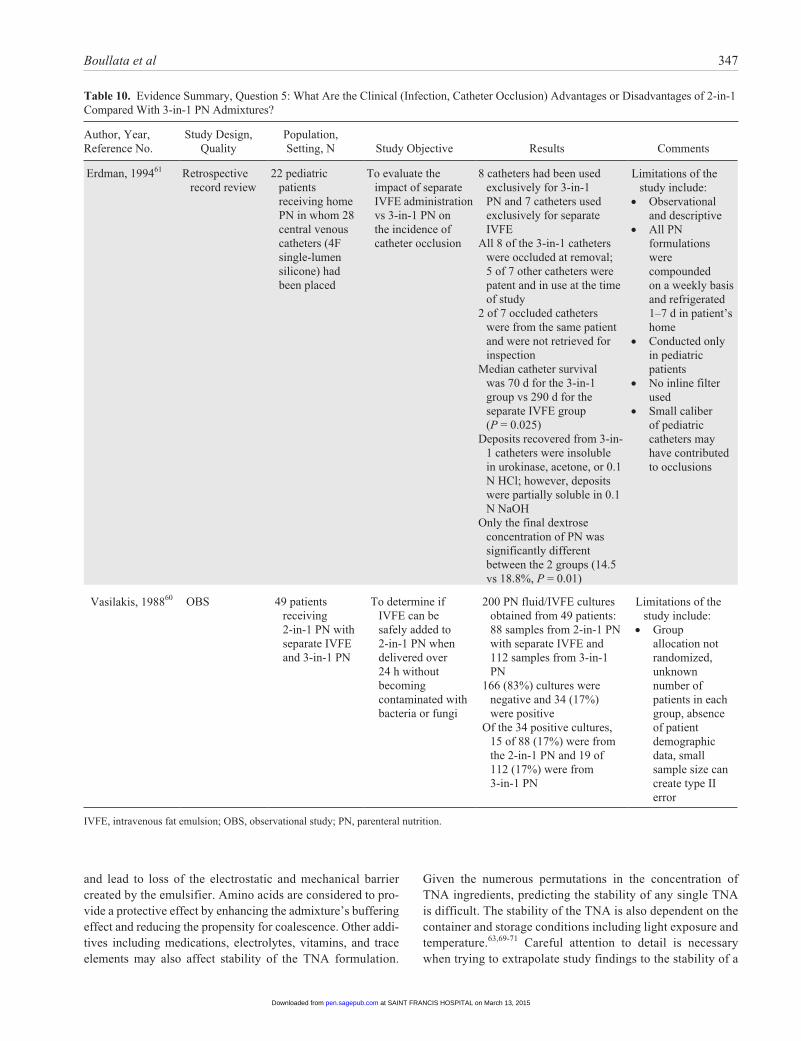
GRADE: Weak (Tables 10 and 11)Rationale: PN formulations are administered as either a
dextrose–amino acid formulation (2-in-1) or a 3-in-1 formula-tion (amino acids, dextrose, and IVFE in 1 container). IVFE is administered separately as a piggyback infusion when pre-scribed as part of a 2-in-1 PN admixture. Advantages and dis-advantages of each PN system have been identified. Many institutions embrace the 3-in-1 formulation because of per-ceived benefits related to compounding efficiency, less risk of contamination during administration, and potential cost sav-ings. The primary drawback of this system is that it requires a larger pore size filter (1.2 µm) and precludes the use of a 0.22-µm filter, which eliminates a greater amount of particulate matter including some bacteria. The 3-in-1 system also suffers from a higher risk for emulsion destabilization from inappro-priate concentrations of nutrients as well as a greater incidence of medication incompatibility with the fat emulsion portion of the admixture. Only 2 clinical trials have evaluated the differ-ences between the 2 delivery systems in a controlled clinical environment. One study demonstrated that both systems were comparable with respect to the risk for microbial growth when administered over 24 hours.60 A second trial suggested that 3-in-1 formulations administered in the pediatric home PN population were associated with more catheter occlusion and a shortened catheter lifespan.61 Further controlled clinical trials
must be conducted before one delivery system is identified as being superior over the other.
Question 6. What macronutrient dosing limits are expected to provide for the most stable 3-in-1 admixtures?
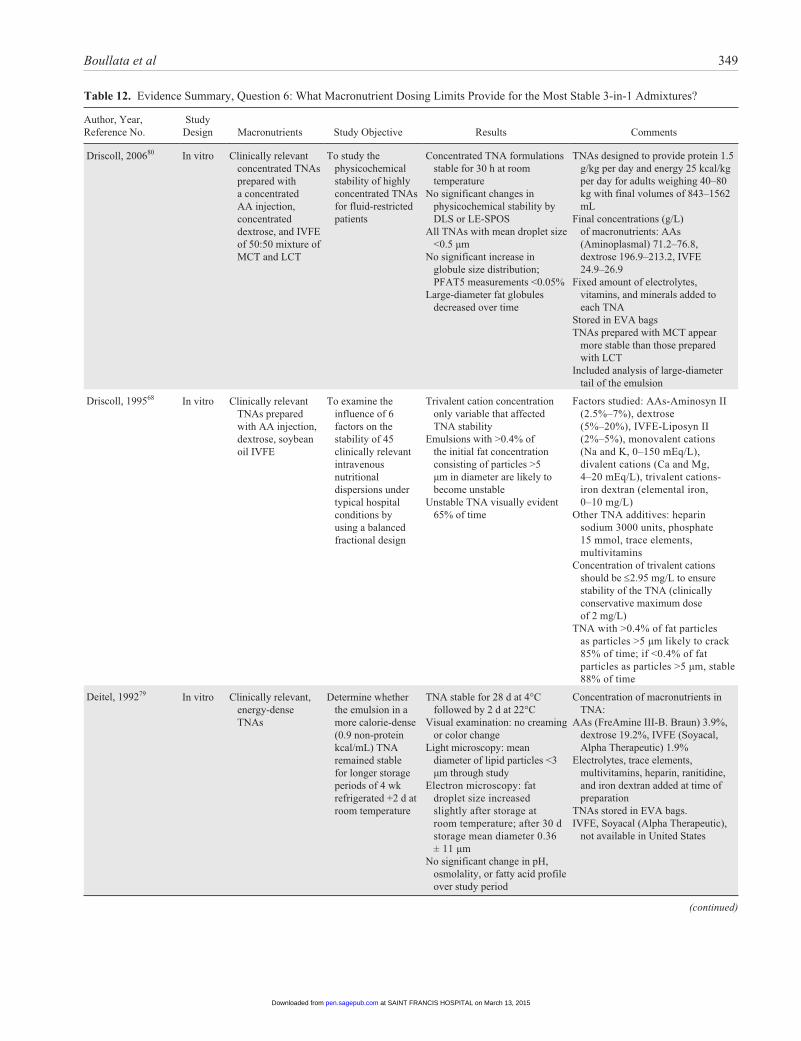
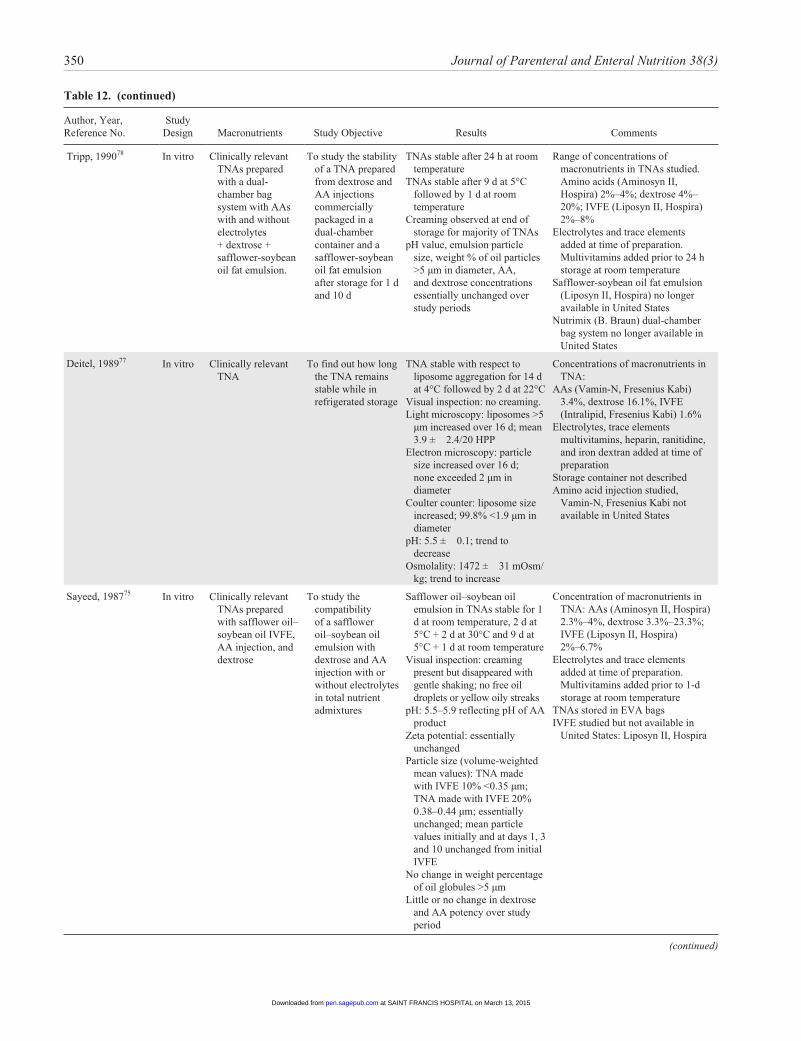
Recommendation: We recommend that total nutrient admix-tures maintain final concentrations of amino acid ≥4%, mono-hydrated dextrose ≥10%, and injectable lipid emulsion ≥2% to be more likely to remain stable for up to 30 hours at room temperature (25°C) or for 9 days refrigerated (5°C) followed by 24 hours at room temperature.
GRADE: Strong (Table 12)Rationale: Administering PN using 3-in-1 or TNA was first
described by Solassol et al62 in 1974. This system of combin-ing amino acids, dextrose, IVFE, electrolytes, vitamins, and trace elements in a single container is widely used in hospital and home environments. This combination of many chemical entities has a high potential for chemical and physicochemical interactions that may result in problems with both short-term and long-term stability.11,27,63
The United States Pharmacopeia (USP) is responsible for creating official monographs and standards for drug manufac-turing. Not until 2004 did the USP finally issue detailed speci-fications (ie, USP Chapter <729>) for lipid globule size limits and the appropriate instrumentation to define them related to lipid emulsion stability.64 The emulsion refers to the many individual fat droplets that are carefully dispersed in the con-tinuous (water) phase. The stability of lipid injectable emul-sions is influenced by many factors including pH, temperature, free fatty acid concentrations, and lipid globule size. Two cri-teria are proposed by the USP for evaluating lipid stability of commercially prepared injectable lipid emulsions from the manufacturer: mean droplet size (MDS) and the population of
at SAINT FRANCIS HOSPITAL on March 13, 2015pen.sagepub.comDownloaded from
344 Journal of Parenteral and Enteral Nutrition 38(3)
Table 8. Evidence Summary, Question 4: What Are the Clinical Advantages or Disadvantages of Commercially Available Premade (“Premixed”) Multichambered PN Formulations Compared With Compounded PN Formulations?
Author, Year, Reference No. Study Design
Population, Setting, N Study Objective Results Comments
Pontes-Aruda, 201250
RCT PreMCB, OOFE
(n = 202) COM1, OOFE (n
= 103) COM2, MCT/LCT
(n = 101)
Critically ill, n = 406
To determine the impact of PN delivery system on the incidence of BSI over 28-day observation period
BSI COM1 + COM2 (46/204, 22.5%) vs
PreMCB (34/202, 16.8%), P = 0.03
BSI/1000 catheter days COM1 + COM2 = 13.2/1000 vs
PreMCB 10.3/1000, P < 0.0001Days to start PN COM1 = 10, COM2 = 10 vs
PreMCB, P < 0.001
Limitation with study findings:
• No information on compounding standards used by facilities
• Fat emulsions not available in the United States (ie, OOFE and MCT/LCT FE)
Mercaldi, 201251 Retrospective evaluation of Premier Perspective Database
All hospitalized patients receiving PN from January 2005 through December 2007
Investigate whether different PN delivery systems could be identified in a hospital claims database
Data suggested that COM PN is associated with higher risk for BSI than PreMCB
OR = 1.47 (95% CI, 1.22–1.61) in GI surgery patients
OR = 1.49 (95% CI, 1.10–1.78) in oncology patients
OR = 1.3 (95% CI, 1.08–1.41) in critical care patients
Limitation of study findings:
• Lack of risk factors related to infection (ie, number of VADs, location of VADs, severity of illness, lack of estimate of the rate of BSI per catheter day)
Lenclen, 200652 Retrospective evaluation of CUST vs STD PN
Premature neonates <32 wk gestation receiving STD PN (n = 20) in 2003 vs CUST PN (n = 20) in 2001
To evaluate the impact of changing from CUST to STD PN formulations
Intakes of AA and CHO were higher in STD group at day 3 (1.5 vs 0.9 g/kg per day AA, P = 0.0001; 10.7 vs 9.6 g/kg per day CHO, P = 0.002)
Ca:P ratios were better balanced in the STD group at day 3 (1.35 vs 10 mg/mg, P < 0.001)
No differences in weight variation at days 3 or 8, and no differences in growth at days 14 and 28
Comment: CUST PN was prepared by nursing staff under a LAFH vs STD PN prepared in a sterile isolator in the pharmacy compounding area.
Krohn, 200553 Retrospective record review
Pediatric ICU patients aged 3 months to 18 years (N = 46)
To evaluate the use of STD PN formulations in a pediatric ICU over 8 months
226 prescriptions were written for STD PN; 111 prescriptions were written for CUST PN
Na and P intakes were lower in CUST vs STD PN patients <10 kg (Na 1.5 vs 4.2 mmol/kg); (P 0 vs 1.1 mmol/kg)
P was not given in 20 of 57 CUST PN
Na was not included in 8 of 57 CUST PN
54% of patients receiving STD PN required nutrient modification
Limitation of study findings:
• Lack of demographic data on patient population
• Only descriptive results, no statistical analysis performed
Comment:• STD PN formulations
were originally prepared by the hospital pharmacy but modification of STD PN was performed by nursing staff under LAFHs on the ward.
• CUST PN formulations were prepared by nursing staff under LAFHs on the ward
Yeung, 200354 Retrospective record review
Newborn infants <33 wk gestation receiving STD PN between 2000 and 2001 (n = 27) vs infants receiving CUST PN between 1999 and 2000 (n = 31)
To evaluate the difference in nutrient intakes and biochemical responses as a result of receiving STD vs CUST PN between day 2 and day 7 of life
STD PN infants received significantly more protein each day and for a cumulative total during the first week of life (13.6 vs 9.6 g/kg, P < 0.05)
STD PN infants received more P (1.25 vs 0.95 mmol/kg) and Ca (1.25 vs 0.95 mmol/kg, P < 0.02) from days 4 to 7 but less Mg (0.2 vs 0.3 mmol/kg, P = 0.21)
Comment:• Standardized PN
formulations were commercially batched produced
• CUST PN formulations were produced by the pharmacy department.
• Estimated cost of STD PN was $88 AUD per bag Australian dollars vs CUST PN at $130 AUD per bag.
(continued)
at SAINT FRANCIS HOSPITAL on March 13, 2015pen.sagepub.comDownloaded from
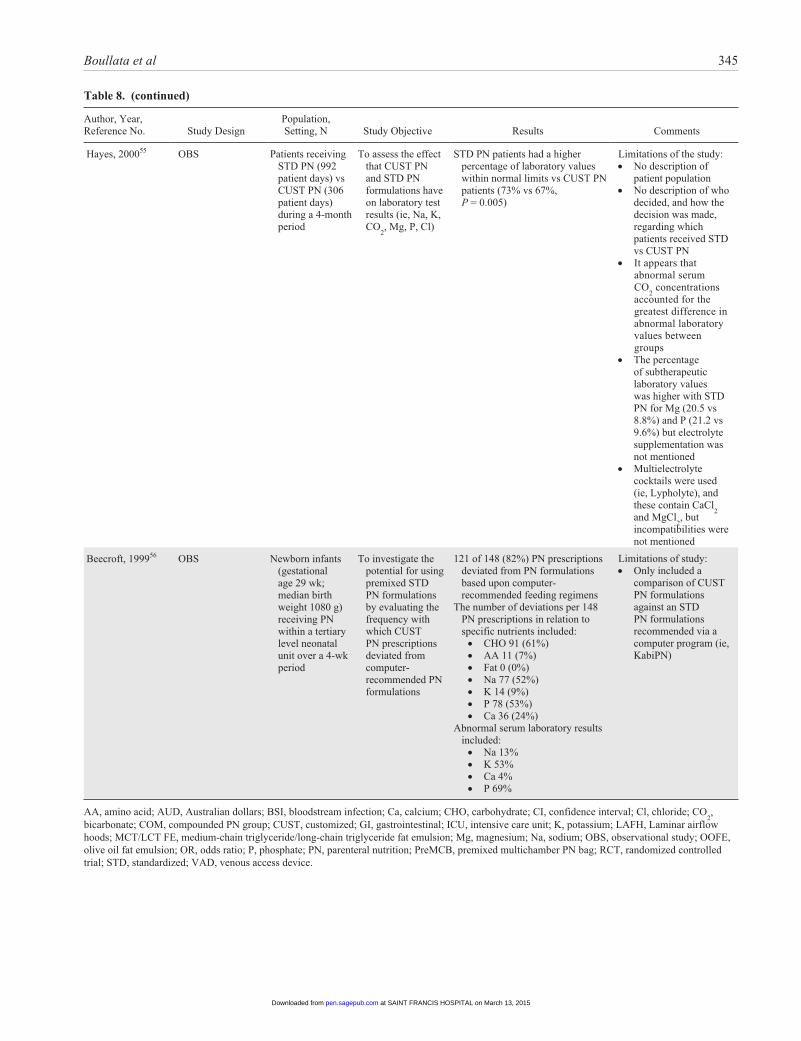
Boullata et al 345
Author, Year, Reference No. Study Design
Population, Setting, N Study Objective Results Comments
Hayes, 200055 OBS Patients receiving STD PN (992 patient days) vs CUST PN (306 patient days) during a 4-month period
To assess the effect that CUST PN and STD PN formulations have on laboratory test results (ie, Na, K, CO
2, Mg, P, Cl)
STD PN patients had a higher percentage of laboratory values within normal limits vs CUST PN patients (73% vs 67%, P = 0.005)
Limitations of the study:• No description of
patient population• No description of who
decided, and how the decision was made, regarding which patients received STD vs CUST PN
• It appears that abnormal serum CO
2 concentrations
accounted for the greatest difference in abnormal laboratory values between groups
• The percentage of subtherapeutic laboratory values was higher with STD PN for Mg (20.5 vs 8.8%) and P (21.2 vs 9.6%) but electrolyte supplementation was not mentioned
• Multielectrolyte cocktails were used (ie, Lypholyte), and these contain CaCl
2
and MgCl2, but
incompatibilities were not mentioned
Beecroft, 199956 OBS Newborn infants (gestational age 29 wk; median birth weight 1080 g) receiving PN within a tertiary level neonatal unit over a 4-wk period
To investigate the potential for using premixed STD PN formulations by evaluating the frequency with which CUST PN prescriptions deviated from computer-recommended PN formulations
121 of 148 (82%) PN prescriptions deviated from PN formulations based upon computer-recommended feeding regimens
The number of deviations per 148 PN prescriptions in relation to specific nutrients included:• CHO 91 (61%)• AA 11 (7%)• Fat 0 (0%)• Na 77 (52%)• K 14 (9%)• P 78 (53%)• Ca 36 (24%)
Abnormal serum laboratory results included:• Na 13%• K 53%• Ca 4%• P 69%
Limitations of study:• Only included a
comparison of CUST PN formulations against an STD PN formulations recommended via a computer program (ie, KabiPN)
AA, amino acid; AUD, Australian dollars; BSI, bloodstream infection; Ca, calcium; CHO, carbohydrate; CI, confidence interval; Cl, chloride; CO2,
bicarbonate; COM, compounded PN group; CUST, customized; GI, gastrointestinal; ICU, intensive care unit; K, potassium; LAFH, Laminar airflow hoods; MCT/LCT FE, medium-chain triglyceride/long-chain triglyceride fat emulsion; Mg, magnesium; Na, sodium; OBS, observational study; OOFE, olive oil fat emulsion; OR, odds ratio; P, phosphate; PN, parenteral nutrition; PreMCB, premixed multichamber PN bag; RCT, randomized controlled trial; STD, standardized; VAD, venous access device.
Table 8. (continued)
at SAINT FRANCIS HOSPITAL on March 13, 2015pen.sagepub.comDownloaded from
346 Journal of Parenteral and Enteral Nutrition 38(3)
Table 9. GRADE Table, Question 4: What Are the Clinical Advantages or Disadvantages of Commercially Available Premade (“Premixed”) Multichambered PN Formulations Compared With Compounded PN Formulations?
Comparison OutcomeQuantity, Type Evidence,
Reference No. Finding GRADEOverall Evidence
GRADE
Premade vs compounded PN BSI 1 OBS50
1 OBS51Premade better Low Low
Standard vs customized PN Nutrient intake 3 OBS52-54 Standard better Low
Laboratory measures 1 OBS55 Standard better Low
Deviation from a standard
1 OBS56 Customized better Low
BSI, bloodstream infections; OBS, observational study; PN, parenteral nutrition.
large-diameter fat globules (>5 µm) for the “tail” of a droplet distribution curve. MDS must not exceed 500 nm, while the large-diameter tail of the lipid globule size distribution (GSD) cannot exceed 0.05%. Measurements of the large-diameter tail are expressed as the percentage (volume-weighted) of fat >5 µm, also referred to as the PFAT5. The distribution of lipid globules throughout the emulsion is the most important aspect from a clinical perspective because this indicates the final safety of the formulation with respect for pulmonary embo-lism.65 The specified limit of 5 µm emanates from physiologic evidence as it represents the minimum size of a lipid droplet capable of obstructing the smallest pulmonary capillaries after infusion into a large central vein. The 5-µm limit is also an important determinant of the stability of the emulsion system. For injectable lipid emulsions composed of pure long-chain triglycerides ranging in concentrations from 10% to 30%, it has been demonstrated that the PFAT5 is universally <0.05%. Thus, PFAT5 levels >0.05% reflect the onset of or continuing lipid destabilization.
Of equal importance, USP Chapter <729> specifies that 2 methods of analysis must be used to measure particle or drop-let size.66 Method 1 employs the use of dynamic light scatter-ing (DLS) to measure the MDS of injectable lipid emulsions. This technique is extremely valuable for measuring the homogeneity of lipid droplets dispersed throughout the emul-sion. Unfortunately, this type of technique often lacks sensi-tivity to subtle changes in droplet size that occur in the large-diameter tail of the GSD. Destabilization of injectable lipid emulsions will create increased droplet/globule popula-tions of the large-diameter tail of the GSD. Changes identi-fied in the large-diameter tail with PFAT5 will have practically no detectable effect on the MDS as measured by DLS. As a result, method 2 uses light obscuration or extinc-tion with a single-particle optical sensing (LE/SPOS) tech-nique to report the number of particle or globule counts as a function of the geometric mean diameter of droplets over a
desired range (2–25 µm).67 In simpler terms, this instrument measures a change in light intensity between identically sized reference particles used to calibrate the machine and the pas-sage of dispersed lipid droplets through an optical sensing zone. In 1995, Driscoll et al68 evaluated the stability of 45 extemporaneously prepared TNA admixtures with DLS and LE/SPOS techniques. Only after the DLS data were stratified according to the corresponding LE/SPOS value of PFAT >5 µm was it determined that unstable emulsions were linked with the presence of >0.4% of the fat particles at >5 µm. Sensitivity testing revealed that a TNA with >0.4% of its total fat concentration present as particles >5 µm would likely destabilize or “crack” 85% of the time, whereas a TNA with <0.4% of its total fat concentration present as particles of >5 µm would be stable 88% of the time. In terms of actual results, unstable emulsions were identified by visual evi-dence, such as free oil droplets at the surface of the formula-tion, only 65% of the time (34 of 52 TNAs). Commercially available IVFEs in the United States are stabilized with egg yolk phosphatides that provide both a mechanical and an electrical barrier to particle coalescence. This phospholipid mixture imparts a negative surface charge on the emulsified lipid particles and prevents coalescence by inducing electro-static repulsion between the particles. The primary fatty acid components in the phospholipid mixture include palmitic, oleic, stearic, and linoleic acids, in decreasing order of con-centration. Instability occurs when there are ion interactions, variations in ionic strength, and pH changes occurring in the aqueous phase of the emulsion. Any decrease in pH value will alter the electronegativity (zeta potential), and the emul-sion becomes more unstable. Injectable lipid emulsions are most stable at their manufactured pH (~6–9). The addition of dextrose, which is acidic, can contribute to TNA instability. Electrolytes, especially the positively charged divalent cat-ions calcium and magnesium, and trivalent ferric ions neu-tralize the negative charge on the surface of the lipid particle
at SAINT FRANCIS HOSPITAL on March 13, 2015pen.sagepub.comDownloaded from
Boullata et al 347
Table 10. Evidence Summary, Question 5: What Are the Clinical (Infection, Catheter Occlusion) Advantages or Disadvantages of 2-in-1 Compared With 3-in-1 PN Admixtures?
Author, Year, Reference No.
Study Design, Quality
Population, Setting, N Study Objective Results Comments
Erdman, 199461 Retrospective record review
22 pediatric patients receiving home PN in whom 28 central venous catheters (4F single-lumen silicone) had been placed
To evaluate the impact of separate IVFE administration vs 3-in-1 PN on the incidence of catheter occlusion
8 catheters had been used exclusively for 3-in-1 PN and 7 catheters used exclusively for separate IVFE
All 8 of the 3-in-1 catheters were occluded at removal; 5 of 7 other catheters were patent and in use at the time of study
2 of 7 occluded catheters were from the same patient and were not retrieved for inspection
Median catheter survival was 70 d for the 3-in-1 group vs 290 d for the separate IVFE group (P = 0.025)
Deposits recovered from 3-in-1 catheters were insoluble in urokinase, acetone, or 0.1 N HCl; however, deposits were partially soluble in 0.1 N NaOH
Only the final dextrose concentration of PN was significantly different between the 2 groups (14.5 vs 18.8%, P = 0.01)
Limitations of the study include:
• Observational and descriptive
• All PN formulations were compounded on a weekly basis and refrigerated 1–7 d in patient’s home
• Conducted only in pediatric patients
• No inline filter used
• Small caliber of pediatric catheters may have contributed to occlusions
Vasilakis, 198860 OBS 49 patients receiving 2-in-1 PN with separate IVFE and 3-in-1 PN
To determine if IVFE can be safely added to 2-in-1 PN when delivered over 24 h without becoming contaminated with bacteria or fungi
200 PN fluid/IVFE cultures obtained from 49 patients: 88 samples from 2-in-1 PN with separate IVFE and 112 samples from 3-in-1 PN
166 (83%) cultures were negative and 34 (17%) were positive
Of the 34 positive cultures, 15 of 88 (17%) were from the 2-in-1 PN and 19 of 112 (17%) were from 3-in-1 PN
Limitations of the study include:
• Group allocation not randomized, unknown number of patients in each group, absence of patient demographic data, small sample size can create type II error
IVFE, intravenous fat emulsion; OBS, observational study; PN, parenteral nutrition.
and lead to loss of the electrostatic and mechanical barrier created by the emulsifier. Amino acids are considered to pro-vide a protective effect by enhancing the admixture’s buffering effect and reducing the propensity for coalescence. Other addi-tives including medications, electrolytes, vitamins, and trace elements may also affect stability of the TNA formulation.
Given the numerous permutations in the concentration of TNA ingredients, predicting the stability of any single TNA is difficult. The stability of the TNA is also dependent on the container and storage conditions including light exposure and temperature.63,69-71 Careful attention to detail is necessary when trying to extrapolate study findings to the stability of a
at SAINT FRANCIS HOSPITAL on March 13, 2015pen.sagepub.comDownloaded from
348 Journal of Parenteral and Enteral Nutrition 38(3)
Table 11. GRADE Table, Question 5: What Are the Clinical (Infection, Catheter Occlusion) Advantages or Disadvantages of 2-in-1 Compared With 3-in-1 PN Admixtures?
Comparison Outcome Quantity, Type Evidence, Reference No. Finding GRADEOverall Evidence
GRADE
2-in-1 PN vs 3-in-1 PN Catheter occlusion 1 OBS61 2-in-1 better Low Low
PN contamination 1 OBS60 No difference Low
OBS, observational study; PN, parenteral nutrition.
specific TNA. In the study by Driscoll et al, 45 different TNA admixtures were evaluated with final concentrations of monohydrated dextrose ranging from 5% to 20%, amino acids ranging from 2.5% to 7%, and injectable lipid emul-sions ranging from 2% to 5%.74 In addition, the micronutrient composition included monovalent cations (sodium and potas-sium) in the range of 0–150 mEq/L, divalent cations (calcium and magnesium) in the range of 4–20 mEq/L, and trivalent cations (ferric ions in iron dextran) in the range of 0–10 mEq/L. Close inspection of the data reveals that in general, TNA admixture final concentrations must be at least 10% monohydrated dextrose, 4% amino acids, and 2% injectable lipid emulsions to ensure admixture stability. However, mon-ovalent, divalent, and trivalent cations clearly influence the final admixture stability, with divalent concentrations between 16 and 20 mEq/L requiring final concentrations of monohydrated dextrose >10% and amino acids >4% to pre-vent lipid destabilization.72 Because trivalent cations appear to have the highest potential for creating instability in TNAs, it is currently recommended that iron dextran (ie, ferric ions) not be incorporated into these formulations.74
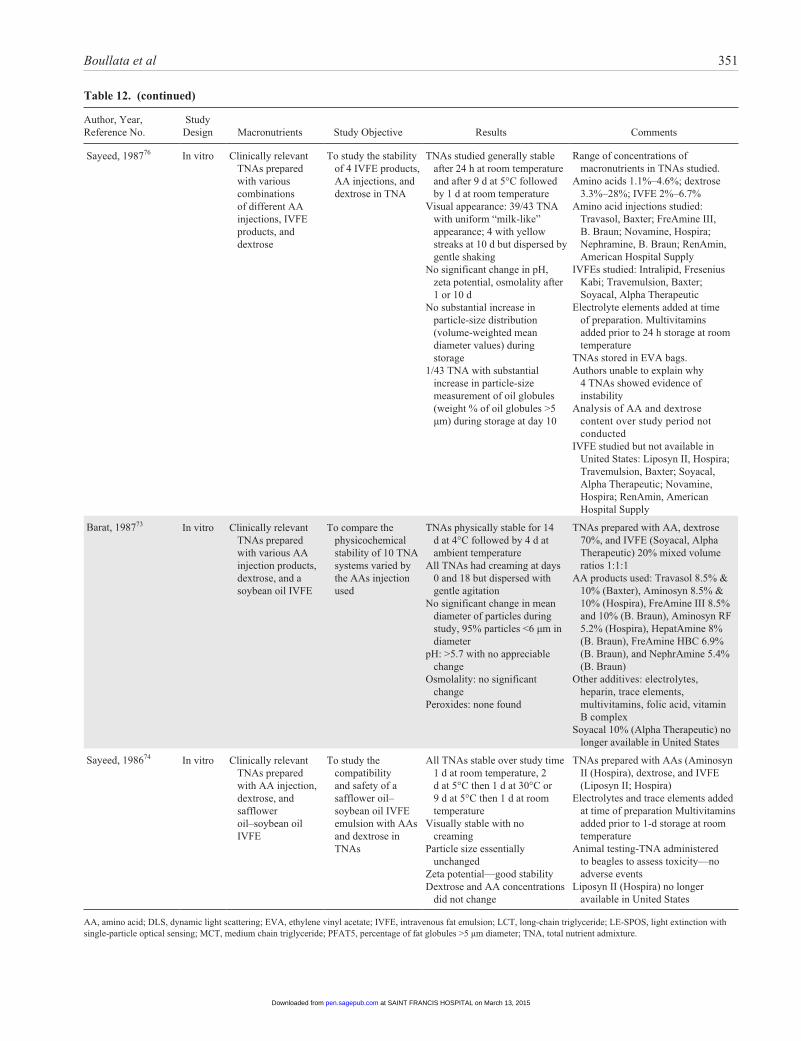
Most investigations conducted to study the physicochemical stability of TNAs evaluated specific amino acid and/or IVFE products vs dosing or concentration ranges of macronutrients or assessed the stability of TNAs prescribed for patients.68,73-79 All of these investigations assessed IVFE products made from long-chain triglycerides. Driscoll et al evaluated the physico-chemical stability of TNAs prepared with an IVFE made from both medium-chain and long-chain triglycerides, which pro-duced more stable TNAs than long-chain triglycerides.70,80
The safety of providing TNAs encompasses more than the stability of the formulation. Prolonged storage and/or light exposure may result in degradation or bioavailability of some components, especially vitamins. Furthermore, long-term stor-age may promote bacterial growth.73 The limits provided in this recommendation are merely a guide, and specific stability data on an individual TNA formulation should be sought.
Question 7. What are the most appropriate recommenda-tions for optimizing calcium (gluconate) and (Na- or K-) phosphate compatibility in PN admixtures?
Recommendation: We cannot make a recommendation due to the multiple variations in amino acid concentrations, PN
volume, pH, presence or absence of fat emulsion, and the amounts of other minerals (eg, magnesium). We suggest that published graphs for specific products provide adequate guid-ance; however, no evidence indicates that these formulations remain stable for >24–48 hours.
GRADE: Weak (Table 13)Rationale: Calcium and phosphate solubility depends on a
number of factors, including the final amino acid concentra-tion, temperature, pH, the mixing sequence, 2-in-1 vs 3-in-1 mixtures, and the relative amounts of the calcium and phos-phate ions. Solubility curves have been developed and vali-dated that provide the best guidance in determining the maximum amount of calcium and phosphate to be added to any particular PN solution.81 Amino acid solutions >1% with added cysteine at 40 mg/g of amino acid appear stable for 30 hours with a calcium concentration of 60 mg/dL and phosphorus at 46.5 mg/dL. Studies validating the stability of PN solutions beyond 48 hours are lacking.
Question 8. What micronutrient contamination is present in parenteral stock solutions currently used to compound PN admixtures?
Recommendation: We suggest that, given the level of min-eral contamination found in parenteral stock solutions used to compound PN admixtures, practitioners purchase products that accurately describe levels of contamination and also take that exposure into account when recommending or reviewing trace element dosing.
GRADE: Weak (Table 14)Rationale: Trace element contamination is found in most
parenteral components expected to be free of these minerals, with little additional contamination found from simulated and manual compounding.89-96 Amounts of contamination can vary between manufacturers and from lot to lot within a manufac-turer’s product.92,94,96 At least a dozen minerals (from arsenic to zinc) have been identified as contaminants. Although the problem with aluminum toxicity has been partially addressed by the United States Food and Drug Administration (FDA), significant variation in aluminum content was found between manufacturers, vial size, and concentrations. Statistically sig-nificant differences in aluminum content of PN solutions before and after its minimization were also seen.97,98 The trace elements chromium and zinc are the most frequently measured
at SAINT FRANCIS HOSPITAL on March 13, 2015pen.sagepub.comDownloaded from
Boullata et al 349
Table 12. Evidence Summary, Question 6: What Macronutrient Dosing Limits Provide for the Most Stable 3-in-1 Admixtures?
Author, Year, Reference No.
Study Design Macronutrients Study Objective Results Comments
Driscoll, 200680 In vitro Clinically relevant concentrated TNAs prepared with a concentrated AA injection, concentrated dextrose, and IVFE of 50:50 mixture of MCT and LCT
To study the physicochemical stability of highly concentrated TNAs for fluid-restricted patients
Concentrated TNA formulations stable for 30 h at room temperature
No significant changes in physicochemical stability by DLS or LE-SPOS
All TNAs with mean droplet size <0.5 µm
No significant increase in globule size distribution; PFAT5 measurements <0.05%
Large-diameter fat globules decreased over time
TNAs designed to provide protein 1.5 g/kg per day and energy 25 kcal/kg per day for adults weighing 40–80 kg with final volumes of 843–1562 mL
Final concentrations (g/L) of macronutrients: AAs (Aminoplasmal) 71.2–76.8, dextrose 196.9–213.2, IVFE 24.9–26.9
Fixed amount of electrolytes, vitamins, and minerals added to each TNA
Stored in EVA bagsTNAs prepared with MCT appear
more stable than those prepared with LCT
Included analysis of large-diameter tail of the emulsion
Driscoll, 199568 In vitro Clinically relevant TNAs prepared with AA injection, dextrose, soybean oil IVFE
To examine the influence of 6 factors on the stability of 45 clinically relevant intravenous nutritional dispersions under typical hospital conditions by using a balanced fractional design
Trivalent cation concentration only variable that affected TNA stability
Emulsions with >0.4% of the initial fat concentration consisting of particles >5 µm in diameter are likely to become unstable
Unstable TNA visually evident 65% of time
Factors studied: AAs-Aminosyn II (2.5%–7%), dextrose (5%–20%), IVFE-Liposyn II (2%–5%), monovalent cations (Na and K, 0–150 mEq/L), divalent cations (Ca and Mg, 4–20 mEq/L), trivalent cations-iron dextran (elemental iron, 0–10 mg/L)
Other TNA additives: heparin sodium 3000 units, phosphate 15 mmol, trace elements, multivitamins
Concentration of trivalent cations should be ≤2.95 mg/L to ensure stability of the TNA (clinically conservative maximum dose of 2 mg/L)
TNA with >0.4% of fat particles as particles >5 µm likely to crack 85% of time; if <0.4% of fat particles as particles >5 µm, stable 88% of time
Deitel, 199279 In vitro Clinically relevant, energy-dense TNAs
Determine whether the emulsion in a more calorie-dense (0.9 non-protein kcal/mL) TNA remained stable for longer storage periods of 4 wk refrigerated +2 d at room temperature
TNA stable for 28 d at 4°C followed by 2 d at 22°C
Visual examination: no creaming or color change
Light microscopy: mean diameter of lipid particles <3 µm through study
Electron microscopy: fat droplet size increased slightly after storage at room temperature; after 30 d storage mean diameter 0.36 ± 11 µm
No significant change in pH, osmolality, or fatty acid profile over study period
Concentration of macronutrients in TNA:
AAs (FreAmine III-B. Braun) 3.9%, dextrose 19.2%, IVFE (Soyacal, Alpha Therapeutic) 1.9%
Electrolytes, trace elements, multivitamins, heparin, ranitidine, and iron dextran added at time of preparation
TNAs stored in EVA bags.IVFE, Soyacal (Alpha Therapeutic),
not available in United States
(continued)
at SAINT FRANCIS HOSPITAL on March 13, 2015pen.sagepub.comDownloaded from
350 Journal of Parenteral and Enteral Nutrition 38(3)
Author, Year, Reference No.
Study Design Macronutrients Study Objective Results Comments
Tripp, 199078 In vitro Clinically relevant TNAs prepared with a dual-chamber bag system with AAs with and without electrolytes + dextrose + safflower-soybean oil fat emulsion.
To study the stability of a TNA prepared from dextrose and AA injections commercially packaged in a dual-chamber container and a safflower-soybean oil fat emulsion after storage for 1 d and 10 d
TNAs stable after 24 h at room temperature
TNAs stable after 9 d at 5°C followed by 1 d at room temperature
Creaming observed at end of storage for majority of TNAs
pH value, emulsion particle size, weight % of oil particles >5 µm in diameter, AA, and dextrose concentrations essentially unchanged over study periods
Range of concentrations of macronutrients in TNAs studied. Amino acids (Aminosyn II, Hospira) 2%–4%; dextrose 4%–20%; IVFE (Liposyn II, Hospira) 2%–8%
Electrolytes and trace elements added at time of preparation. Multivitamins added prior to 24 h storage at room temperature
Safflower-soybean oil fat emulsion (Liposyn II, Hospira) no longer available in United States
Nutrimix (B. Braun) dual-chamber bag system no longer available in United States
Deitel, 198977 In vitro Clinically relevant TNA
To find out how long the TNA remains stable while in refrigerated storage
TNA stable with respect to liposome aggregation for 14 d at 4°C followed by 2 d at 22°C
Visual inspection: no creaming.Light microscopy: liposomes >5
µm increased over 16 d; mean 3.9 ± 2.4/20 HPP
Electron microscopy: particle size increased over 16 d; none exceeded 2 µm in diameter
Coulter counter: liposome size increased; 99.8% <1.9 µm in diameter
pH: 5.5 ± 0.1; trend to decrease
Osmolality: 1472 ± 31 mOsm/kg; trend to increase
Concentrations of macronutrients in TNA:
AAs (Vamin-N, Fresenius Kabi) 3.4%, dextrose 16.1%, IVFE (Intralipid, Fresenius Kabi) 1.6%
Electrolytes, trace elements multivitamins, heparin, ranitidine, and iron dextran added at time of preparation
Storage container not describedAmino acid injection studied,
Vamin-N, Fresenius Kabi not available in United States
Sayeed, 198775 In vitro Clinically relevant TNAs prepared with safflower oil–soybean oil IVFE, AA injection, and dextrose
To study the compatibility of a safflower oil–soybean oil emulsion with dextrose and AA injection with or without electrolytes in total nutrient admixtures
Safflower oil–soybean oil emulsion in TNAs stable for 1 d at room temperature, 2 d at 5°C + 2 d at 30°C and 9 d at 5°C + 1 d at room temperature
Visual inspection: creaming present but disappeared with gentle shaking; no free oil droplets or yellow oily streaks
pH: 5.5–5.9 reflecting pH of AA product
Zeta potential: essentially unchanged
Particle size (volume-weighted mean values): TNA made with IVFE 10% <0.35 µm; TNA made with IVFE 20% 0.38–0.44 µm; essentially unchanged; mean particle values initially and at days 1, 3 and 10 unchanged from initial IVFE
No change in weight percentage of oil globules >5 µm
Little or no change in dextrose and AA potency over study period
Concentration of macronutrients in TNA: AAs (Aminosyn II, Hospira) 2.3%–4%, dextrose 3.3%–23.3%; IVFE (Liposyn II, Hospira) 2%–6.7%
Electrolytes and trace elements added at time of preparation. Multivitamins added prior to 1-d storage at room temperature
TNAs stored in EVA bagsIVFE studied but not available in
United States: Liposyn II, Hospira
(continued)
Table 12. (continued)
at SAINT FRANCIS HOSPITAL on March 13, 2015pen.sagepub.comDownloaded from
Boullata et al 351
Author, Year, Reference No.
Study Design Macronutrients Study Objective Results Comments
Sayeed, 198776 In vitro Clinically relevant TNAs prepared with various combinations of different AA injections, IVFE products, and dextrose
To study the stability of 4 IVFE products, AA injections, and dextrose in TNA
TNAs studied generally stable after 24 h at room temperature and after 9 d at 5°C followed by 1 d at room temperature
Visual appearance: 39/43 TNA with uniform “milk-like” appearance; 4 with yellow streaks at 10 d but dispersed by gentle shaking
No significant change in pH, zeta potential, osmolality after 1 or 10 d
No substantial increase in particle-size distribution (volume-weighted mean diameter values) during storage
1/43 TNA with substantial increase in particle-size measurement of oil globules (weight % of oil globules >5 µm) during storage at day 10
Range of concentrations of macronutrients in TNAs studied.
Amino acids 1.1%–4.6%; dextrose 3.3%–28%; IVFE 2%–6.7%
Amino acid injections studied: Travasol, Baxter; FreAmine III, B. Braun; Novamine, Hospira; Nephramine, B. Braun; RenAmin, American Hospital Supply
IVFEs studied: Intralipid, Fresenius Kabi; Travemulsion, Baxter; Soyacal, Alpha Therapeutic
Electrolyte elements added at time of preparation. Multivitamins added prior to 24 h storage at room temperature
TNAs stored in EVA bags.Authors unable to explain why
4 TNAs showed evidence of instability
Analysis of AA and dextrose content over study period not conducted
IVFE studied but not available in United States: Liposyn II, Hospira; Travemulsion, Baxter; Soyacal, Alpha Therapeutic; Novamine, Hospira; RenAmin, American Hospital Supply
Barat, 198773 In vitro Clinically relevant TNAs prepared with various AA injection products, dextrose, and a soybean oil IVFE
To compare the physicochemical stability of 10 TNA systems varied by the AAs injection used
TNAs physically stable for 14 d at 4°C followed by 4 d at ambient temperature
All TNAs had creaming at days 0 and 18 but dispersed with gentle agitation
No significant change in mean diameter of particles during study, 95% particles <6 µm in diameter
pH: >5.7 with no appreciable change
Osmolality: no significant change
Peroxides: none found
TNAs prepared with AA, dextrose 70%, and IVFE (Soyacal, Alpha Therapeutic) 20% mixed volume ratios 1:1:1
AA products used: Travasol 8.5% & 10% (Baxter), Aminosyn 8.5% & 10% (Hospira), FreAmine III 8.5% and 10% (B. Braun), Aminosyn RF 5.2% (Hospira), HepatAmine 8% (B. Braun), FreAmine HBC 6.9% (B. Braun), and NephrAmine 5.4% (B. Braun)
Other additives: electrolytes, heparin, trace elements, multivitamins, folic acid, vitamin B complex
Soyacal 10% (Alpha Therapeutic) no longer available in United States
Sayeed, 198674 In vitro Clinically relevant TNAs prepared with AA injection, dextrose, and safflower oil–soybean oil IVFE
To study the compatibility and safety of a safflower oil–soybean oil IVFE emulsion with AAs and dextrose in TNAs
All TNAs stable over study time 1 d at room temperature, 2 d at 5°C then 1 d at 30°C or 9 d at 5°C then 1 d at room temperature
Visually stable with no creaming
Particle size essentially unchanged
Zeta potential—good stabilityDextrose and AA concentrations
did not change
TNAs prepared with AAs (Aminosyn II (Hospira), dextrose, and IVFE (Liposyn II; Hospira)
Electrolytes and trace elements added at time of preparation Multivitamins added prior to 1-d storage at room temperature
Animal testing-TNA administered to beagles to assess toxicity—no adverse events
Liposyn II (Hospira) no longer available in United States
AA, amino acid; DLS, dynamic light scattering; EVA, ethylene vinyl acetate; IVFE, intravenous fat emulsion; LCT, long-chain triglyceride; LE-SPOS, light extinction with single-particle optical sensing; MCT, medium chain triglyceride; PFAT5, percentage of fat globules >5 µm diameter; TNA, total nutrient admixture.
Table 12. (continued)
at SAINT FRANCIS HOSPITAL on March 13, 2015pen.sagepub.comDownloaded from
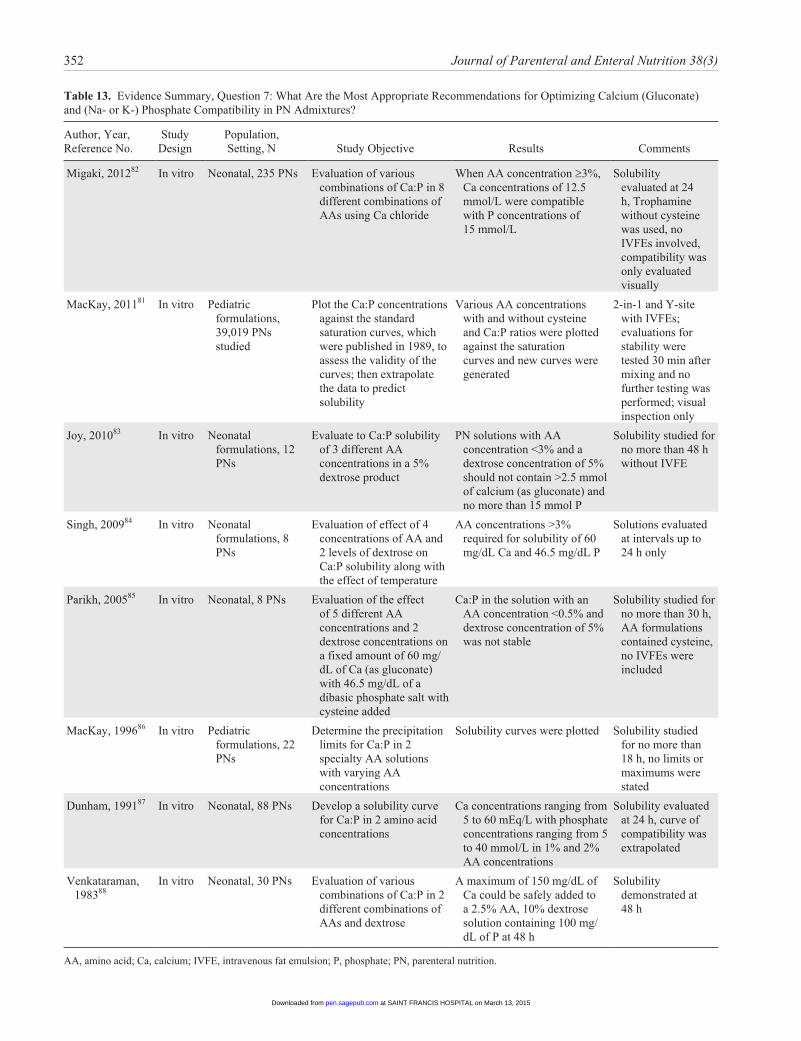
352 Journal of Parenteral and Enteral Nutrition 38(3)
Table 13. Evidence Summary, Question 7: What Are the Most Appropriate Recommendations for Optimizing Calcium (Gluconate) and (Na- or K-) Phosphate Compatibility in PN Admixtures?
Author, Year, Reference No.
Study Design
Population, Setting, N Study Objective Results Comments
Migaki, 201282 In vitro Neonatal, 235 PNs Evaluation of various combinations of Ca:P in 8 different combinations of AAs using Ca chloride
When AA concentration ≥3%, Ca concentrations of 12.5 mmol/L were compatible with P concentrations of 15 mmol/L
Solubility evaluated at 24 h, Trophamine without cysteine was used, no IVFEs involved, compatibility was only evaluated visually
MacKay, 201181 In vitro Pediatric formulations, 39,019 PNs studied
Plot the Ca:P concentrations against the standard saturation curves, which were published in 1989, to assess the validity of the curves; then extrapolate the data to predict solubility
Various AA concentrations with and without cysteine and Ca:P ratios were plotted against the saturation curves and new curves were generated
2-in-1 and Y-site with IVFEs; evaluations for stability were tested 30 min after mixing and no further testing was performed; visual inspection only
Joy, 201083 In vitro Neonatal formulations, 12 PNs
Evaluate to Ca:P solubility of 3 different AA concentrations in a 5% dextrose product
PN solutions with AA concentration <3% and a dextrose concentration of 5% should not contain >2.5 mmol of calcium (as gluconate) and no more than 15 mmol P
Solubility studied for no more than 48 h without IVFE
Singh, 200984 In vitro Neonatal formulations, 8 PNs
Evaluation of effect of 4 concentrations of AA and 2 levels of dextrose on Ca:P solubility along with the effect of temperature
AA concentrations >3% required for solubility of 60 mg/dL Ca and 46.5 mg/dL P
Solutions evaluated at intervals up to 24 h only
Parikh, 200585 In vitro Neonatal, 8 PNs Evaluation of the effect of 5 different AA concentrations and 2 dextrose concentrations on a fixed amount of 60 mg/dL of Ca (as gluconate) with 46.5 mg/dL of a dibasic phosphate salt with cysteine added
Ca:P in the solution with an AA concentration <0.5% and dextrose concentration of 5% was not stable
Solubility studied for no more than 30 h, AA formulations contained cysteine, no IVFEs were included
MacKay, 199686 In vitro Pediatric formulations, 22 PNs
Determine the precipitation limits for Ca:P in 2 specialty AA solutions with varying AA concentrations
Solubility curves were plotted Solubility studied for no more than 18 h, no limits or maximums were stated
Dunham, 199187 In vitro Neonatal, 88 PNs Develop a solubility curve for Ca:P in 2 amino acid concentrations
Ca concentrations ranging from 5 to 60 mEq/L with phosphate concentrations ranging from 5 to 40 mmol/L in 1% and 2% AA concentrations
Solubility evaluated at 24 h, curve of compatibility was extrapolated
Venkataraman, 198388
In vitro Neonatal, 30 PNs Evaluation of various combinations of Ca:P in 2 different combinations of AAs and dextrose
A maximum of 150 mg/dL of Ca could be safely added to a 2.5% AA, 10% dextrose solution containing 100 mg/dL of P at 48 h
Solubility demonstrated at 48 h
AA, amino acid; Ca, calcium; IVFE, intravenous fat emulsion; P, phosphate; PN, parenteral nutrition.
at SAINT FRANCIS HOSPITAL on March 13, 2015pen.sagepub.comDownloaded from
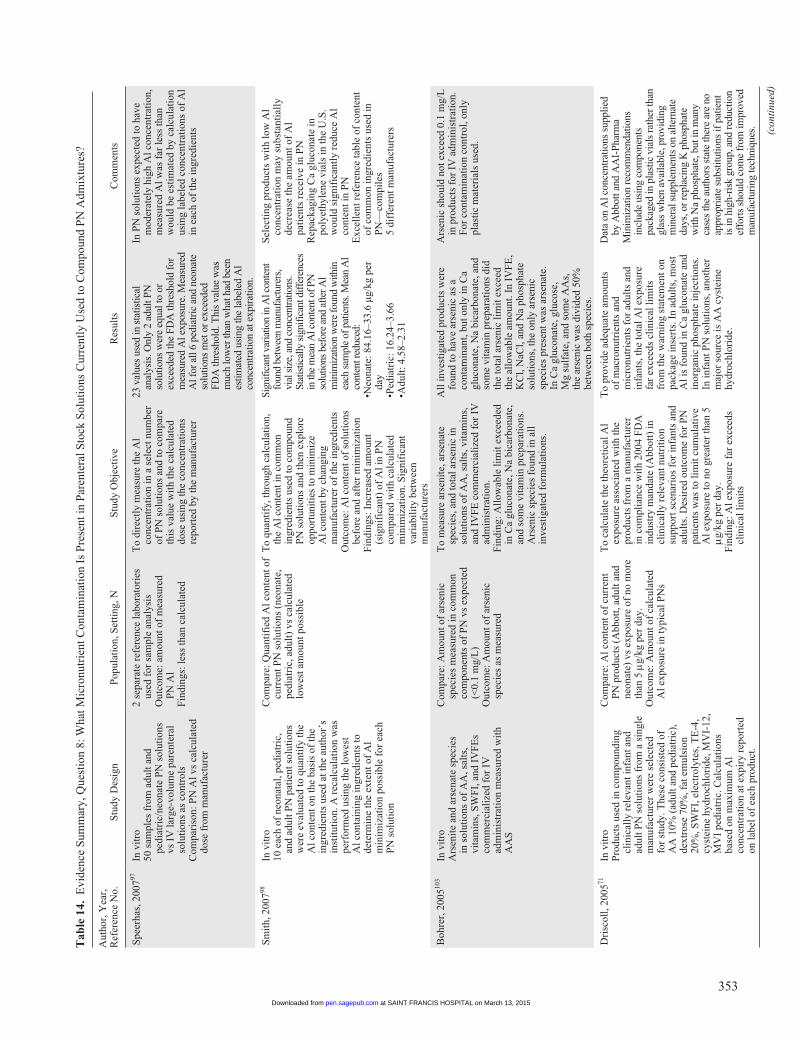
353
Tab
le 1
4. E
vide
nce
Sum
mar
y, Q
uest
ion
8: W
hat M
icro
nutr
ient
Con
tam
inat
ion
Is P
rese
nt in
Par
ente
ral S
tock
Sol
utio
ns C
urre
ntly
Use
d to
Com
poun
d P
N A
dmix
ture
s?
Aut
hor,
Yea
r,
Ref
eren
ce N
o.S
tudy
Des
ign
Pop
ulat
ion,
Set
ting
, NS
tudy
Obj
ecti
veR
esul
tsC
omm
ents
Spe
erha
s, 2
00797
In v
itro
50 s
ampl
es f
rom
adu
lt a
nd
pedi
atri
c/ne
onat
e P
N s
olut
ions
vs
IV
larg
e-vo
lum
e pa
rent
eral
so
luti
ons
as c
ontr
ols
Com
pari
son:
PN
Al v
s ca
lcul
ated
do
se f
rom
man
ufac
ture
r
2 se
para
te r
efer
ence
labo
rato
ries
us
ed f
or s
ampl
e an
alys
isO
utco
me:
am
ount
of
mea
sure
d P
N A
lF
indi
ngs:
less
than
cal
cula
ted
To
dire
ctly
mea
sure
the
Al
conc
entr
atio
n in
a s
elec
t num
ber
of P
N s
olut
ions
and
to c
ompa
re
this
val
ue w
ith
the
calc
ulat
ed
dose
usi
ng th
e co
ncen
trat
ions
re
port
ed b
y th
e m
anuf
actu
rer
23 v
alue
s us
ed in
sta
tistic
al
anal
ysis
. Onl
y 2
adul
t PN
so
lutio
ns w
ere
equa
l to
or
exce
eded
the
FDA
thre
shol
d fo
r m
easu
red
Al e
xpos
ure.
Mea
sure
d A
l for
all
6 pe
diat
ric
and
neon
ate
solu
tions
met
or e
xcee
ded
FDA
thre
shol
d. T
his
valu
e w
as
muc
h lo
wer
than
wha
t had
bee
n es
timat
ed u
sing
the
labe
led
Al
conc
entr
atio
n at
exp
irat
ion.
In P
N s
olut
ions
exp
ecte
d to
hav
e m
oder
atel
y hi
gh A
l con
cent
rati
on,
mea
sure
d A
l was
far
less
than
w
ould
be
esti
mat
ed b
y ca
lcul
atio
n us
ing
labe
led
conc
entr
atio
ns o
f A
l in
eac
h of
the
ingr
edie
nts
Sm
ith,
200
798In
vit
ro10
eac
h of
neo
nata
l, pe
diat
ric,
an
d ad
ult P
N p
atie
nt s
olut
ions
w
ere
eval
uate
d to
qua
ntif
y th
e A
l con
tent
on
the
basi
s of
the
ingr
edie
nts
used
at t
he a
utho
r’s
inst
itut
ion.
A r
ecal
cula
tion
was
pe
rfor
med
usi
ng th
e lo
wes
t A
l con
tain
ing
ingr
edie
nts
to
dete
rmin
e th
e ex
tent
of
Al
min
imiz
atio
n po
ssib
le f
or e
ach
PN
sol
utio
n
Com
pare
: Qua
ntif
ied
Al c
onte
nt o
f cu
rren
t PN
sol
utio
ns (
neon
ate,
pe
diat
ric,
adu
lt)
vs c
alcu
late
d lo
wes
t am
ount
pos
sibl
e
To
quan
tify,
thro
ugh
calc
ulat
ion,
th
e A
l con
tent
in c
omm
on
ingr
edie
nts
used
to c
ompo
und
PN s
olut
ions
and
then
exp
lore
op
port
uniti
es to
min
imiz
e A
l con
tent
by
chan
ging
m
anuf
actu
rer
of th
e in
gred
ient
sO
utco
me:
Al c
onte
nt o
f so
luti
ons
befo
re a
nd a
fter
min
imiz
atio
nF
indi
ngs:
Inc
reas
ed a
mou
nt
(sig
nifi
cant
) of
Al i
n P
N
com
pare
d w
ith
calc
ulat
ed
min
imiz
atio
n. S
igni
fica
nt
vari
abil
ity
betw
een
man
ufac
ture
rs
Sign
ifica
nt v
aria
tion
in A
l con
tent
fo
und
betw
een
man
ufac
ture
rs,
vial
siz
e, a
nd c
once
ntra
tions
. St
atis
tical
ly s
igni
fican
t diff
eren
ces
in th
e m
ean
Al c
onte
nt o
f PN
so
lutio
ns b
efor
e an
d af
ter A
l m
inim
izat
ion
wer
e fo
und
with
in
each
sam
ple
of p
atie
nts.
Mea
n A
l co
nten
t red
uced
:•N
eona
te: 8
4.16
–33.
6 µg
/kg
per
day
•Ped
iatr
ic: 1
6.24
–3.6
6•A
dult
: 4.5
8–2.
31
Sel
ecti
ng p
rodu
cts
wit
h lo
w A
l co
ncen
trat
ion
may
sub
stan
tial
ly
decr
ease
the
amou
nt o
f A
l pa
tien
ts r
ecei
ve in
PN
Rep
acka
ging
Ca
gluc
onat
e in
po
lyet
hyle
ne v
ials
in th
e U
.S.
wou
ld s
igni
fica
ntly
red
uce
Al
cont
ent i
n P
NE
xcel
lent
ref
eren
ce ta
ble
of c
onte
nt
of c
omm
on in
gred
ient
s us
ed in
P
N—
com
pile
s 5
diff
eren
t man
ufac
ture
rs
Boh
rer,
200
5103
In v
itro
Ars
enit
e an
d ar
sena
te s
peci
es
in s
olut
ions
of
AA
, sal
ts,
vita
min
s, S
WF
I, a
nd I
VF
Es
com
mer
cial
ized
for
IV
ad
min
istr
atio
n m
easu
red
wit
h A
AS
Com
pare
: Am
ount
of
arse
nic
spec
ies
mea
sure
d in
com
mon
co
mpo
nent
s of
PN
vs
expe
cted
(<
0.1
mg/
L)
Out
com
e: A
mou
nt o
f ar
seni
c sp
ecie
s as
mea
sure
d
To
mea
sure
ars
enit
e, a
rsen
ate
spec
ies,
and
tota
l ars
enic
in
solu
tion
s of
AA
, sal
ts, v
itam
ins,
an
d IV
FE
com
mer
cial
ized
for
IV
ad
min
istr
atio
n.F
indi
ng: A
llow
able
lim
it e
xcee
ded
in C
a gl
ucon
ate,
Na
bica
rbon
ate,
an
d so
me
vita
min
pre
para
tion
s.
Ars
enic
spe
cies
fou
nd in
all
in
vest
igat
ed f
orm
ulat
ions
.
All
inve
stig
ated
pro
duct
s w
ere
foun
d to
hav
e ar
seni
c as
a
cont
amin
ant,
but o
nly
in C
a gl
ucon
ate,
Na
bica
rbon
ate,
and
so
me
vita
min
pre
para
tion
s di
d th
e to
tal a
rsen
ic li
mit
exc
eed
the
allo
wab
le a
mou
nt. I
n IV
FE
, K
Cl,
NaC
l, an
d N
a ph
osph
ate
solu
tion
s, th
e on
ly a
rsen
ic
spec
ies
pres
ent w
as a
rsen
ate.
In
Ca
gluc
onat
e, g
luco
se,
Mg
sulf
ate,
and
som
e A
As,
th
e ar
seni
c w
as d
ivid
ed 5
0%
betw
een
both
spe
cies
.
Ars
enic
sho
uld
not e
xcee
d 0.
1 m
g/L
in
pro
duct
s fo
r IV
adm
inis
trat
ion.
F
or c
onta
min
atio
n co
ntro
l, on
ly
plas
tic
mat
eria
ls u
sed.
Dri
scol
l, 20
0571
In v
itro
Pro
duct
s us
ed in
com
poun
ding
cl
inic
ally
rel
evan
t inf
ant a
nd
adul
t PN
sol
utio
ns f
rom
a s
ingl
e m
anuf
actu
rer
wer
e se
lect
ed
for
stud
y. T
hese
con
sist
ed o
f A
A 1
0% (
adul
t and
ped
iatr
ic),
de
xtro
se 7
0%, f
at e
mul
sion
20
%, S
WF
I, e
lect
roly
tes,
TE
-4,
cyst
eine
hyd
roch
lori
de, M
VI-
12,
MV
I pe
diat
ric.
Cal
cula
tion
s ba
sed
on m
axim
um A
l co
ncen
trat
ion
at e
xpir
y re
port
ed
on la
bel o
f ea
ch p
rodu
ct.
Com
pare
: Al c
onte
nt o
f cu
rren
t P
N p
rodu
cts
(Abb
ott,
adul
t and
ne
onat
e) v
s ex
posu
re o
f no
mor
e th
an 5
mg/
kg p
er d
ay.
Out
com
e: A
mou
nt o
f ca
lcul
ated
A
l exp
osur
e in
typi
cal P
Ns
To
calc
ulat
e th
e th
eore
tica
l Al
expo
sure
ass
ocia
ted
wit
h th
e pr
oduc
ts f
rom
a m
anuf
actu
rer
in c
ompl
ianc
e w
ith
2004
FD
A
indu
stry
man
date
(A
bbot
t) in
cl
inic
ally
rel
evan
t nut
riti
on
supp
ort s
cena
rios
for
infa
nts
and
adul
ts. D
esir
ed o
utco
me
for
PN
pa
tien
ts w
as to
lim
it c
umul
ativ
e A
l exp
osur
e to
no
grea
ter
than
5
mg/k
g pe
r da
y.F
indi
ng: A
l exp
osur
e fa
r ex
ceed
s cl
inic
al li
mit
s
To
prov
ide
adeq
uate
am
ount
s of
mac
ronu
trie
nts
and
mic
ronu
trie
nts
for
adul
ts a
nd
infa
nts,
the
tota
l Al e
xpos
ure
far
exce
eds
clin
ical
lim
its
from
the
war
ning
sta
tem
ent o
n pa
ckag
e in
sert
s. I
n ad
ults
, mos
t A
l is
foun
d in
Ca
gluc
onat
e an
d in
orga
nic
phos
phat
e in
ject
ions
. In
infa
nt P
N s
olut
ions
, ano
ther
m
ajor
sou
rce
is A
A c
yste
ine
hydr
ochl
orid
e.
Dat
a on
Al c
once
ntra
tions
sup
plie
d by
Abb
ott a
nd A
AI-
Phar
ma
Min
imiz
atio
n re
com
men
datio
ns
incl
ude
usin
g co
mpo
nent
s pa
ckag
ed in
pla
stic
via
ls ra
ther
than
gl
ass
whe
n av
aila
ble,
pro
vidi
ng
min
eral
sup
plem
ents
on
alte
rnat
e da
ys, o
r rep
laci
ng K
pho
spha
te
with
Na
phos
phat
e, b
ut in
man
y ca
ses
the
auth
ors
stat
e th
ere
are
no
appr
opri
ate
subs
titut
ions
if p
atie
nt
is in
hig
h-ri
sk g
roup
, and
redu
ctio
n ef
fort
s sh
ould
com
e fr
om im
prov
ed
man
ufac
turi
ng te
chni
ques
.
(con
tinu
ed)
at SAINT FRANCIS HOSPITAL on March 13, 2015pen.sagepub.comDownloaded from
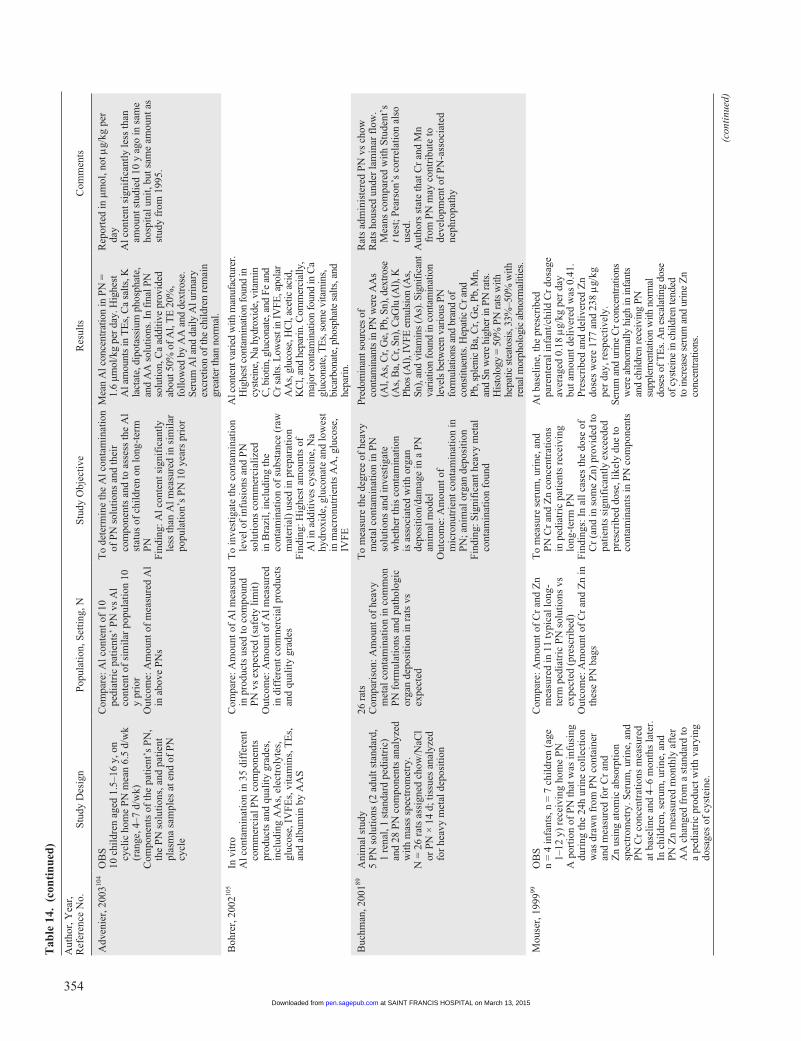
354
Aut
hor,
Yea
r,
Ref
eren
ce N
o.S
tudy
Des
ign
Pop
ulat
ion,
Set
ting
, NS
tudy
Obj
ecti
veR
esul
tsC
omm
ents
Adv
enie
r, 2
00310
4O
BS
10 c
hild
ren
aged
1.5
–16
y, o
n cy
clic
hom
e P
N m
ean
6.5
d/w
k (r
ange
, 4–7
d/w
k)C
ompo
nent
s of
the
pati
ent’
s P
N,
the
PN
sol
utio
ns, a
nd p
atie
nt
plas
ma
sam
ples
at e
nd o
f P
N
cycl
e
Com
pare
: Al c
onte
nt o
f 10
pe
diat
ric
pati
ents
’ P
N v
s A
l co
nten
t of
sim
ilar
pop
ulat
ion
10
y pr
ior
Out
com
e: A
mou
nt o
f m
easu
red
Al
in a
bove
PN
s
To
dete
rmin
e th
e A
l con
tam
inat
ion
of P
N s
olut
ions
and
thei
r co
mpo
nent
s an
d to
ass
ess
the
Al
stat
us o
f ch
ildr
en o
n lo
ng-t
erm
P
NF
indi
ng: A
l con
tent
sig
nifi
cant
ly
less
than
Al m
easu
red
in s
imil
ar
popu
lati
on’s
PN
10
year
s pr
ior
Mea
n A
l con
cent
ratio
n in
PN
=
1.6
µmol
/kg
per
day.
Hig
hest
A
l am
ount
s in
TE
s, C
a sa
lts, K
la
ctat
e, d
ipot
assi
um p
hosp
hate
, an
d A
A s
olut
ions
. In
fina
l PN
so
lutio
n, C
a ad
ditiv
e pr
ovid
ed
abou
t 50%
of
Al,
TE
20%
, fo
llow
ed b
y A
A a
nd d
extr
ose.
Se
rum
Al a
nd d
aily
Al u
rina
ry
excr
etio
n of
the
child
ren
rem
ain
grea
ter
than
nor
mal
.
Rep
orte
d in
µm
ol, n
ot m
g/kg
per
da
yA
l con
tent
sig
nifi
cant
ly le
ss th
an
amou
nt s
tudi
ed 1
0 y
ago
in s
ame
hosp
ital
uni
t, bu
t sam
e am
ount
as
stud
y fr
om 1
995.
Boh
rer,
200
2105
In v
itro
Al c
onta
min
atio
n in
35
diff
eren
t co
mm
erci
al P
N c
ompo
nent
s pr
oduc
ts a
nd q
uali
ty g
rade
s,
incl
udin
g A
As,
ele
ctro
lyte
s,
gluc
ose,
IV
FE
s, v
itam
ins,
TE
s,
and
albu
min
by
AA
S
Com
pare
: Am
ount
of
Al m
easu
red
in p
rodu
cts
used
to c
ompo
und
PN
vs
expe
cted
(sa
fety
lim
it)
Out
com
e: A
mou
nt o
f A
l mea
sure
d in
dif
fere
nt c
omm
erci
al p
rodu
cts
and
qual
ity
grad
es
To
inve
stig
ate
the
cont
amin
atio
n le
vel o
f in
fusi
ons
and
PN
so
luti
ons
com
mer
cial
ized
in
Bra
zil,
incl
udin
g th
e co
ntam
inat
ion
of s
ubst
ance
(ra
w
mat
eria
l) u
sed
in p
repa
rati
onF
indi
ng: H
ighe
st a
mou
nts
of
Al i
n ad
diti
ves
cyst
eine
, Na
hydr
oxid
e, g
luco
nate
and
low
est
in m
acro
nutr
ient
s A
A, g
luco
se,
IVF
E
Al c
onte
nt v
arie
d w
ith m
anuf
actu
rer.
H
ighe
st c
onta
min
atio
n fo
und
in
cyst
eine
, Na
hydr
oxid
e, v
itam
in
C, b
iotin
, glu
cona
te, a
nd F
e an
d C
r sal
ts. L
owes
t in
IVFE
, apo
lar
AA
s, g
luco
se, H
Cl,
acet
ic a
cid,
K
Cl,
and
hepa
rin.
Com
mer
cial
ly,
maj
or c
onta
min
atio
n fo
und
in C
a gl
ucon
ate,
TE
s, s
ome
vita
min
s,
bica
rbon
ate,
pho
spha
te s
alts
, and
he
pari
n.
Buc
hman
, 200
189A
nim
al s
tudy
5 P
N s
olut
ions
(2
adul
t sta
ndar
d,
1 re
nal,
1 st
anda
rd p
edia
tric
) an
d 28
PN
com
pone
nts
anal
yzed
w
ith
mas
s sp
ectr
omet
ry.
N =
26
rats
ass
igne
d ch
ow/N
aCl
or P
N ×
14
d; ti
ssue
s an
alyz
ed
for
heav
y m
etal
dep
osit
ion
26 r
ats
Com
pari
son:
Am
ount
of
heav
y m
etal
con
tam
inat
ion
in c
omm
on
PN
for
mul
atio
ns a
nd p
atho
logi
c or
gan
depo
siti
on in
rat
s vs
ex
pect
ed
To
mea
sure
the
degr
ee o
f he
avy
met
al c
onta
min
atio
n in
PN
so
luti
ons
and
inve
stig
ate
whe
ther
this
con
tam
inat
ion
is a
ssoc
iate
d w
ith
orga
n de
posi
tion
/dam
age
in a
PN
an
imal
mod
elO
utco
me:
Am
ount
of
mic
ronu
trie
nt c
onta
min
atio
n in
P
N; a
nim
al o
rgan
dep
osit
ion
Fin
ding
: Sig
nifi
cant
hea
vy m
etal
co
ntam
inat
ion
foun
d
Pred
omin
ant s
ourc
es o
f co
ntam
inan
ts in
PN
wer
e A
As
(Al,
As,
Cr,
Ge,
Pb,
Sn)
, dex
tros
e (A
s, B
a, C
r, Sn
), C
aGlu
(Al)
, K
Phos
(Al)
, IV
FE e
mul
sion
(As,
Sn
), an
d vi
tam
ins
(As)
. Sig
nifi
cant
va
riat
ion
foun
d in
con
tam
inat
ion
leve
ls b
etw
een
vari
ous
PN
form
ulat
ions
and
bra
nd o
f co
nstit
uent
s. H
epat
ic C
r and
Pb
, spl
enic
Ba,
Cr,
Ge,
Pb,
Mn,
an
d Sn
wer
e hi
gher
in P
N ra
ts.
His
tolo
gy =
50%
PN
rats
with
he
patic
ste
atos
is, 3
3%–5
0% w
ith
rena
l mor
phol
ogic
abn
orm
aliti
es.
Rat
s ad
min
iste
red
PN
vs
chow
Rat
s ho
used
und
er la
min
ar f
low
. M
eans
com
pare
d w
ith
Stu
dent
’s
t tes
t; P
ears
on’s
cor
rela
tion
als
o us
ed.
Aut
hors
sta
te th
at C
r an
d M
n fr
om P
N m
ay c
ontr
ibut
e to
de
velo
pmen
t of
PN
-ass
ocia
ted
neph
ropa
thy
Mou
ser,
199
999O
BS
n =
4 in
fant
s, n
= 7
chi
ldre
n (a
ge
1–12
y)
rece
ivin
g ho
me
PN
A p
orti
on o
f P
N th
at w
as in
fusi
ng
duri
ng th
e 24
h ur
ine
coll
ecti
on
was
dra
wn
from
PN
con
tain
er
and
mea
sure
d fo
r C
r an
d Z
n us
ing
atom
ic a
bsor
ptio
n sp
ectr
omet
ry. S
erum
, uri
ne, a
nd
PN
Cr
conc
entr
atio
ns m
easu
red
at b
asel
ine
and
4–6
mon
ths
late
r.
In c
hild
ren,
ser
um, u
rine
, and
P
N Z
n m
easu
red
mon
thly
aft
er
AA
cha
nged
fro
m a
sta
ndar
d to
a
pedi
atri
c pr
oduc
t wit
h va
ryin
g do
sage
s of
cys
tein
e.
Com
pare
: Am
ount
of
Cr
and
Zn
mea
sure
d in
11
typi
cal l
ong-
term
ped
iatr
ic P
N s
olut
ions
vs
expe
cted
(pr
escr
ibed
)O
utco
me:
Am
ount
of
Cr
and
Zn
in
thes
e P
N b
ags
To
mea
sure
ser
um, u
rine
, and
P
N C
r an
d Z
n co
ncen
trat
ions
in
ped
iatr
ic p
atie
nts
rece
ivin
g lo
ng-t
erm
PN
Fin
ding
s: I
n al
l cas
es th
e do
se o
f C
r (a
nd in
som
e Z
n) p
rovi
ded
to
pati
ents
sig
nifi
cant
ly e
xcee
ded
pres
crib
ed d
ose,
like
ly d
ue to
co
ntam
inan
ts in
PN
com
pone
nts
At b
asel
ine,
the
pres
crib
ed
pare
nter
al in
fant
/chi
ld C
r do
sage
av
erag
ed 0
.18 mg
/kg
per
day
but a
mou
nt d
eliv
ered
was
0.4
1.
Pre
scri
bed
and
deli
vere
d Z
n do
ses
wer
e 17
7 an
d 23
8 mg
/kg
per
day,
res
pect
ivel
y.Se
rum
and
uri
ne C
r con
cent
ratio
ns
wer
e ab
norm
ally
hig
h in
infa
nts
and
child
ren
rece
ivin
g PN
su
pple
men
tatio
n w
ith n
orm
al
dose
s of
TE
s. A
n es
cala
ting
dose
of
cys
tein
e in
chi
ldre
n te
nded
to
incr
ease
ser
um a
nd u
rine
Zn
conc
entr
atio
ns.
(con
tinu
ed)
Tab
le 1
4. (
con
tin
ued
)
at SAINT FRANCIS HOSPITAL on March 13, 2015pen.sagepub.comDownloaded from
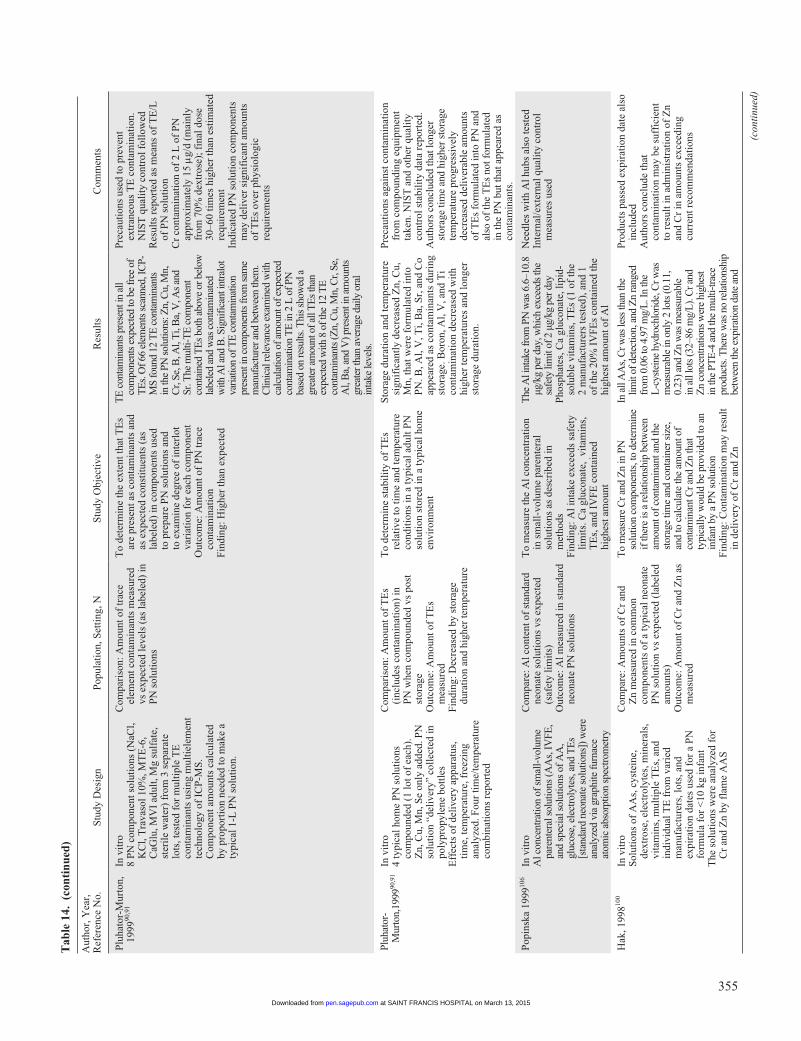
355
Aut
hor,
Yea
r,
Ref
eren
ce N
o.S
tudy
Des
ign
Pop
ulat
ion,
Set
ting
, NS
tudy
Obj
ecti
veR
esul
tsC
omm
ents
Plu
hato
r-M
urto
n,
1999
90,9
1In
vit
ro8
PN
com
pone
nt s
olut
ions
(N
aCl,
KC
l, T
rava
sol 1
0%, M
TE
-6,
CaG
lu, M
VI
adul
t, M
g su
lfat
e,
ster
ile
wat
er)
from
3 s
epar
ate
lots
, tes
ted
for
mul
tipl
e T
E
cont
amin
ants
usi
ng m
ulti
elem
ent
tech
nolo
gy o
f IC
P-M
S.
Com
pone
nt a
mou
nts
calc
ulat
ed
by p
ropo
rtio
n ne
eded
to m
ake
a ty
pica
l 1-L
PN
sol
utio
n.
Com
pari
son:
Am
ount
of
trac
e el
emen
t con
tam
inan
ts m
easu
red
vs e
xpec
ted
leve
ls (
as la
bele
d) in
P
N s
olut
ions
To
dete
rmin
e th
e ex
tent
that
TE
s ar
e pr
esen
t as
cont
amin
ants
and
as
exp
ecte
d co
nsti
tuen
ts (
as
labe
led)
in c
ompo
nent
s us
ed
to p
repa
re P
N s
olut
ions
and
to
exa
min
e de
gree
of
inte
rlot
va
riat
ion
for
each
com
pone
ntO
utco
me:
Am
ount
of
PN
trac
e co
ntam
inat
ion
Fin
ding
: Hig
her
than
exp
ecte
d
TE
con
tam
inan
ts p
rese
nt in
all
com
pone
nts
expe
cted
to b
e fr
ee o
f T
Es.
Of 6
6 el
emen
ts s
cann
ed, I
CP-
MS
foun
d 12
TE
con
tam
inan
ts
in th
e PN
sol
utio
ns: Z
n, C
u, M
n,
Cr,
Se, B
, Al,
Ti,
Ba,
V, A
s an
d Sr
. The
mul
ti-T
E c
ompo
nent
co
ntai
ned
TE
s bo
th a
bove
or b
elow
la
bele
d an
d w
as c
onta
min
ated
w
ith A
l and
B. S
igni
fican
t int
ralo
t va
riatio
n of
TE
con
tam
inat
ion
pres
ent i
n co
mpo
nent
s fr
om s
ame
man
ufac
ture
r and
bet
wee
n th
em.
Clin
ical
rele
vanc
e ex
amin
ed w
ith
calc
ulat
ion
of a
mou
nt o
f exp
ecte
d co
ntam
inat
ion
TE
in 2
L o
f PN
ba
sed
on re
sults
. Thi
s sh
owed
a
grea
ter a
mou
nt o
f all
TE
s th
an
expe
cted
with
8 o
f the
12
TE
co
ntam
inan
ts (Z
n, C
u, M
n, C
r, Se
, A
l, B
a, a
nd V
) pre
sent
in a
mou
nts
grea
ter t
han
aver
age
daily
ora
l in
take
leve
ls.
Pre
caut
ions
use
d to
pre
vent
ex
tran
eous
TE
con
tam
inat
ion.
N
IST
qua
lity
con
trol
fol
low
edR
esul
ts r
epor
ted
as m
eans
of
TE
/L
of P
N s
olut
ion
Cr
cont
amin
atio
n of
2 L
of
PN
ap
prox
imat
ely
15 m
g/d
(mai
nly
from
70%
dex
tros
e); f
inal
dos
e 30
–60
tim
es h
ighe
r th
an e
stim
ated
re
quir
emen
tIn
dica
ted
PN
sol
utio
n co
mpo
nent
s m
ay d
eliv
er s
igni
fica
nt a
mou
nts
of T
Es
over
phy
siol
ogic
re
quir
emen
ts
Pluh
ator
-M
urto
n,19
9990
,91
In v
itro
4 ty
pica
l hom
e P
N s
olut
ions
co
mpo
unde
d (1
lot o
f ea
ch).
Z
n, C
u, M
n, S
e on
ly a
dded
. PN
so
luti
on “
deli
very
” co
llec
ted
in
poly
prop
ylen
e bo
ttle
sE
ffec
ts o
f de
live
ry a
ppar
atus
, ti
me,
tem
pera
ture
, fre
ezin
g an
alyz
ed. F
our
tim
e/te
mpe
ratu
re
com
bina
tion
s re
port
ed
Com
pari
son:
Am
ount
of
TE
s (i
nclu
des
cont
amin
atio
n) in
P
N w
hen
com
poun
ded
vs p
ost
stor
age
Out
com
e: A
mou
nt o
f T
Es
mea
sure
dF
indi
ng: D
ecre
ased
by
stor
age
dura
tion
and
hig
her
tem
pera
ture
To
dete
rmin
e st
abil
ity
of T
Es
rela
tive
to ti
me
and
tem
pera
ture
co
ndit
ions
in a
typi
cal a
dult
PN
so
luti
on s
tore
d in
a ty
pica
l hom
e en
viro
nmen
t
Sto
rage
dur
atio
n an
d te
mpe
ratu
re
sign
ific
antl
y de
crea
sed
Zn,
Cu,
M
n, th
at w
ere
form
ulat
ed in
to
PN
. B, A
l, V
, Ti,
Ba,
Sr,
and
Co
appe
ared
as
cont
amin
ants
dur
ing
stor
age.
Bor
on, A
l, V
, and
Ti
cont
amin
atio
n de
crea
sed
wit
h hi
gher
tem
pera
ture
s an
d lo
nger
st
orag
e du
rati
on.
Pre
caut
ions
aga
inst
con
tam
inat
ion
from
com
poun
ding
equ
ipm
ent
take
n. N
IST
and
oth
er q
uali
ty
cont
rol s
tabi
lity
dat
a re
port
ed.
Aut
hors
con
clud
ed th
at lo
nger
st
orag
e tim
e an
d hi
gher
sto
rage
te
mpe
ratu
re p
rogr
essi
vely
de
crea
sed
deliv
erab
le a
mou
nts
of T
Es
form
ulat
ed in
to P
N a
nd
also
of
the
TE
s no
t for
mul
ated
in
the
PN b
ut th
at a
ppea
red
as
cont
amin
ants
.
Pop
insk
a 19
9910
6In
vit
roA
l con
cent
ratio
n of
sm
all-
volu
me
pare
nter
al s
olut
ions
(AA
s, IV
FE,
and
spec
ial s
olut
ions
of A
A,
gluc
ose,
ele
ctro
lyte
s, a
nd T
Es
[sta
ndar
d ne
onat
e so
lutio
ns])
wer
e an
alyz
ed v
ia g
raph
ite fu
rnac
e at
omic
abs
orpt
ion
spec
trom
etry
Com
pare
: Al c
onte
nt o
f st
anda
rd
neon
ate
solu
tion
s vs
exp
ecte
d (s
afet
y li
mit
s)O
utco
me:
Al m
easu
red
in s
tand
ard
neon
ate
PN
sol
utio
ns
To
mea
sure
the
Al c
once
ntra
tion
in
sm
all-
volu
me
pare
nter
al
solu
tion
s as
des
crib
ed in
m
etho
dsF
indi
ng: A
l int
ake
exce
eds
safe
ty
lim
its.
Ca
gluc
onat
e, v
itam
ins,
T
Es,
and
IV
FE
con
tain
ed
high
est a
mou
nt
The
Al i
ntak
e fr
om P
N w
as 6
.6–1
0.8
µg/k
g pe
r day
, whi
ch e
xcee
ds th
e sa
fety
lim
it of
2 µ
g/kg
per
day
Pho
spha
tes,
Ca
gluc
onat
e, li
pid-
solu
ble
vita
min
s, T
Es
(1 o
f th
e 2
man
ufac
ture
rs te
sted
), a
nd 1
of
the
20%
IV
FE
s co
ntai
ned
the
high
est a
mou
nt o
f A
l
Nee
dles
wit
h A
l hub
s al
so te
sted
Inte
rnal
/ext
erna
l qua
lity
con
trol
m
easu
res
used
Hak
, 199
8100
In v
itro
Sol
utio
ns o
f A
As,
cys
tein
e,
dext
rose
, ele
ctro
lyte
s, m
iner
als,
vi
tam
ins,
mul
tipl
e T
Es,
and
in
divi
dual
TE
fro
m v
arie
d m
anuf
actu
rers
, lot
s, a
nd
expi
rati
on d
ates
use
d fo
r a
PN
fo
rmul
a fo
r <
10 k
g in
fant
The
sol
utio
ns w
ere
anal
yzed
for
C
r an
d Z
n by
fla
me
AA
S
Com
pare
: Am
ount
s of
Cr
and
Zn
mea
sure
d in
com
mon
co
mpo
nent
s of
a ty
pica
l neo
nate
P
N s
olut
ion
vs e
xpec
ted
(lab
eled
am
ount
s)O
utco
me:
Am
ount
of
Cr
and
Zn
as
mea
sure
d
To
mea
sure
Cr a
nd Z
n in
PN
so
lutio
n co
mpo
nent
s, to
det
erm
ine
if th
ere
is a
rela
tions
hip
betw
een
amou
nt o
f con
tam
inan
t and
the
stor
age
time
and
cont
aine
r siz
e,
and
to c
alcu
late
the
amou
nt o
f co
ntam
inan
t Cr a
nd Z
n th
at
typi
cally
wou
ld b
e pr
ovid
ed to
an
infa
nt b
y a
PN s
olut
ion
Fin
ding
: Con
tam
inat
ion
may
res
ult
in d
eliv
ery
of C
r an
d Z
n
In a
ll A
As,
Cr w
as le
ss th
an th
e lim
it of
det
ectio
n, a
nd Z
n ra
nged
fr
om 0
.06
to 4
.97
mg/
L. I
n th
e L
-cys
tein
e hy
droc
hlor
ide,
Cr w
as
mea
sura
ble
in o
nly
2 lo
ts (0
.11,
0.
23) a
nd Z
n w
as m
easu
rabl
e in
all
lots
(32–
86 m
g/L
). C
r and
Z
n co
ncen
tratio
ns w
ere
high
est
in th
e PT
E-4
and
the
mul
ti-tra
ce
prod
ucts
. The
re w
as n
o re
latio
nshi
p be
twee
n th
e ex
pira
tion
date
and
Pro
duct
s pa
ssed
exp
irat
ion
date
als
o in
clud
edA
utho
rs c
oncl
ude
that
co
ntam
inat
ion
may
be
suff
icie
nt
to r
esul
t in
adm
inis
trat
ion
of Z
n an
d C
r in
am
ount
s ex
ceed
ing
curr
ent r
ecom
men
dati
ons (con
tinu
ed)
Tab
le 1
4. (
con
tin
ued
)
at SAINT FRANCIS HOSPITAL on March 13, 2015pen.sagepub.comDownloaded from
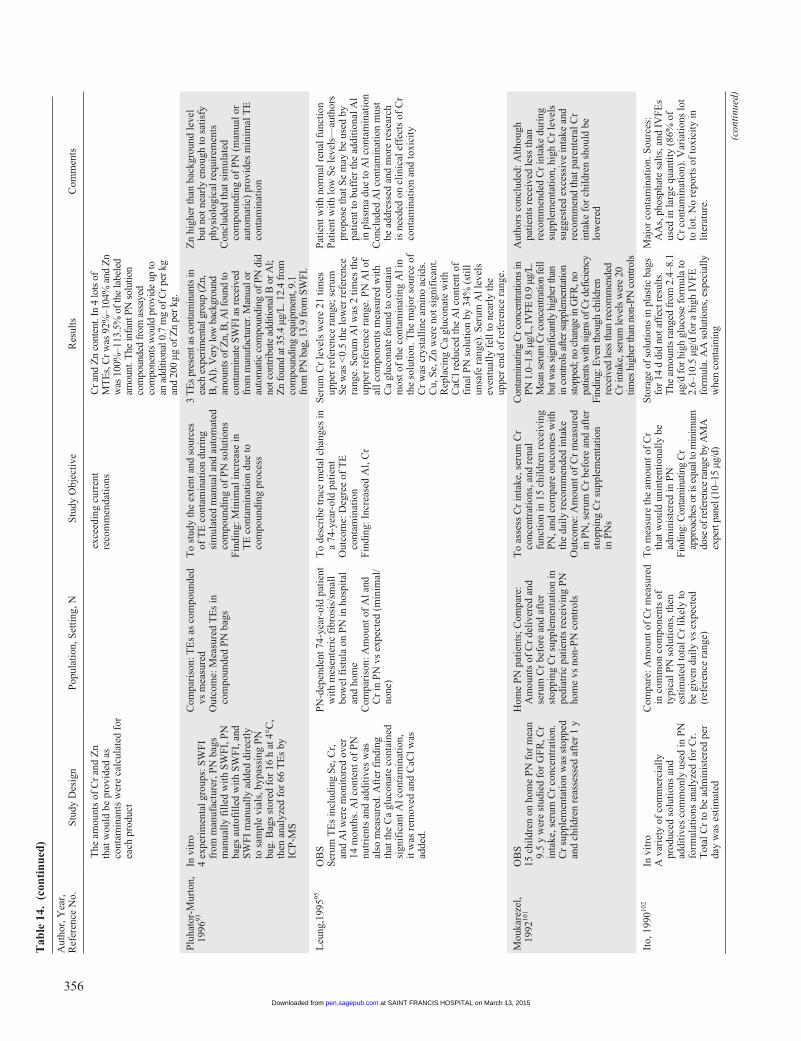
356
Aut
hor,
Yea
r,
Ref
eren
ce N
o.S
tudy
Des
ign
Pop
ulat
ion,
Set
ting
, NS
tudy
Obj
ecti
veR
esul
tsC
omm
ents
T
he a
mou
nts
of C
r an
d Z
n th
at w
ould
be
prov
ided
as
cont
amin
ants
wer
e ca
lcul
ated
for
ea
ch p
rodu
ct
e
xcee
ding
cur
rent
re
com
men
dati
ons
C
r and
Zn
cont
ent.
In 4
lots
of
MT
Es,
Cr w
as 9
2%–1
04%
and
Zn
was
100
%–1
13.5
% o
f the
labe
led
amou
nt. T
he in
fant
PN
sol
utio
n co
mpo
unde
d fr
om a
ssay
ed
com
pone
nts
wou
ld p
rovi
de u
p to
an
add
ition
al 0
.7 m
g of
Cr p
er k
g an
d 20
0 µg
of Z
n pe
r kg.
Plu
hato
r-M
urto
n,
1996
93In
vit
ro4
expe
rim
enta
l gro
ups:
SW
FI
from
man
ufac
ture
r, P
N b
ags
man
uall
y fi
lled
wit
h S
WF
I, P
N
bags
aut
ofil
led
wit
h S
WF
I, a
nd
SW
FI
man
uall
y ad
ded
dire
ctly
to
sam
ple
vial
s, b
ypas
sing
PN
ba
g. B
ags
stor
ed f
or 1
6 h
at 4
°C,
then
ana
lyze
d fo
r 66
TE
s by
IC
P-M
S
Com
pari
son:
TE
s as
com
poun
ded
vs m
easu
red
Out
com
e: M
easu
red
TE
s in
co
mpo
unde
d P
N b
ags
To
stud
y th
e ex
tent
and
sou
rces
of
TE
con
tam
inat
ion
duri
ng
sim
ulat
ed m
anua
l and
aut
omat
ed
com
poun
ding
of
PN
sol
utio
nsF
indi
ng: M
inim
al in
crea
se in
T
E c
onta
min
atio
n du
e to
co
mpo
undi
ng p
roce
ss
3 T
Es
pres
ent a
s co
ntam
inan
ts in
ea
ch e
xper
imen
tal g
roup
(Zn,
B
, Al)
. Ver
y lo
w b
ackg
roun
d am
ount
s of
Zn,
B, A
l fou
nd to
co
ntam
inat
e SW
FI a
s re
ceiv
ed
from
man
ufac
ture
r. M
anua
l or
auto
mat
ic c
ompo
undi
ng o
f PN
did
no
t con
trib
ute
addi
tiona
l B o
r Al;
Zn
foun
d at
35.
4 µg
/L. 1
2.4
from
co
mpo
undi
ng e
quip
men
t, 9.
1 fr
om P
N b
ag, 1
3.9
from
SW
FI.
Zn
high
er th
an b
ackg
roun
d le
vel
but n
ot n
earl
y en
ough
to s
atis
fy
phys
iolo
gica
l req
uire
men
tsC
oncl
uded
that
sim
ulat
ed
com
poun
ding
of
PN
(m
anua
l or
auto
mat
ic)
prov
ides
min
imal
TE
co
ntam
inat
ion
Leu
ng,1
99595
OB
SS
erum
TE
s in
clud
ing
Se,
Cr,
an
d A
l wer
e m
onit
ored
ove
r 14
mon
ths.
Al c
onte
nt o
f P
N
nutr
ient
s an
d ad
diti
ves
was
al
so m
easu
red.
Aft
er f
indi
ng
that
the
Ca
gluc
onat
e co
ntai
ned
sign
ific
ant A
l con
tam
inat
ion,
it
was
rem
oved
and
CaC
l was
ad
ded.
PN
-dep
ende
nt 7
4-ye
ar-o
ld p
atie
nt
wit
h m
esen
teri
c fi
bros
is/s
mal
l bo
wel
fis
tula
on
PN
in h
ospi
tal
and
hom
eC
ompa
riso
n: A
mou
nt o
f A
l and
C
r in
PN
vs
expe
cted
(m
inim
al/
none
)
To
desc
ribe
trac
e m
etal
cha
nges
in
a 74
-yea
r-ol
d pa
tien
tO
utco
me:
Deg
ree
of T
E
cont
amin
atio
nF
indi
ng: I
ncre
ased
Al,
Cr
Ser
um C
r le
vels
wer
e 21
tim
es
uppe
r re
fere
nce
rang
e; s
erum
S
e w
as <
0.5
the
low
er r
efer
ence
ra
nge.
Ser
um A
l was
2 ti
mes
the
uppe
r re
fere
nce
rang
e. P
N A
l of
all c
ompo
nent
s m
easu
red
wit
h C
a gl
ucon
ate
foun
d to
con
tain
m
ost o
f th
e co
ntam
inat
ing
Al i
n th
e so
luti
on. T
he m
ajor
sou
rce
of
Cr
was
cry
stal
line
am
ino
acid
s.
Cu,
Se,
Zn
wer
e no
t sig
nifi
cant
. R
epla
cing
Ca
gluc
onat
e w
ith
CaC
l red
uced
the
Al c
onte
nt o
f fi
nal P
N s
olut
ion
by 3
4% (
stil
l un
safe
ran
ge).
Ser
um A
l lev
els
even
tual
ly f
ell t
o ne
arly
the
uppe
r en
d of
ref
eren
ce r
ange
.
Pat
ient
wit
h no
rmal
ren
al f
unct
ion
Pat
ient
wit
h lo
w S
e le
vels
—au
thor
s pr
opos
e th
at S
e m
ay b
e us
ed b
y pa
tien
t to
buff
er th
e ad
diti
onal
Al
in p
lasm
a du
e to
Al c
onta
min
atio
nC
oncl
uded
Al c
onta
min
atio
n m
ust
be a
ddre
ssed
and
mor
e re
sear
ch
is n
eede
d on
cli
nica
l eff
ects
of
Cr
cont
amin
atio
n an
d to
xici
ty
Mou
kare
zel,
1992
101
OB
S15
chi
ldre
n on
hom
e P
N f
or m
ean
9.5
y w
ere
stud
ied
for
GF
R, C
r in
take
, ser
um C
r co
ncen
trat
ion.
C
r su
pple
men
tati
on w
as s
topp
ed
and
chil
dren
rea
sses
sed
afte
r 1
y
Hom
e P
N p
atie
nts;
Com
pare
: A
mou
nts
of C
r de
live
red
and
seru
m C
r be
fore
and
aft
er
stop
ping
Cr
supp
lem
enta
tion
in
pedi
atri
c pa
tien
ts r
ecei
ving
PN
ho
me
vs n
on-P
N c
ontr
ols
To
asse
ss C
r in
take
, ser
um C
r co
ncen
trat
ions
, and
ren
al
func
tion
in 1
5 ch
ildr
en r
ecei
ving
P
N, a
nd c
ompa
re o
utco
mes
wit
h th
e da
ily
reco
mm
ende
d in
take
Out
com
e: A
mou
nt o
f C
r m
easu
red
in P
N, s
erum
Cr
befo
re a
nd a
fter
st
oppi
ng C
r su
pple
men
tati
on
in P
Ns
Con
tam
inat
ing
Cr c
once
ntra
tions
in
PN 1
.0–1
.8 µ
g/L
, IV
FE 0
.9 µ
g/L
. M
ean
seru
m C
r con
cent
ratio
n fe
ll bu
t was
sig
nific
antly
hig
her t
han
in c
ontro
ls a
fter s
uppl
emen
tatio
n st
oppe
d; n
o ch
ange
in G
FR, n
o pa
tient
s w
ith s
igns
of C
r def
icie
ncy
Find
ing:
Eve
n th
ough
chi
ldre
n re
ceiv
ed le
ss th
an re
com
men
ded
Cr i
ntak
e, s
erum
leve
ls w
ere
20
times
hig
her t
han
non-
PN c
ontr
ols
Aut
hors
con
clud
ed: A
ltho
ugh
pati
ents
rec
eive
d le
ss th
an
reco
mm
ende
d C
r in
take
dur
ing
supp
lem
enta
tion
, hig
h C
r le
vels
su
gges
ted
exce
ssiv
e in
take
and
re
com
men
d th
at p
aren
tera
l Cr
inta
ke f
or c
hild
ren
shou
ld b
e lo
wer
ed
Ito,
199
0102
In v
itro
A v
arie
ty o
f co
mm
erci
ally
pr
oduc
ed s
olut
ions
and
ad
diti
ves
com
mon
ly u
sed
in P
N
form
ulat
ions
ana
lyze
d fo
r C
r.
Tot
al C
r to
be
adm
inis
tere
d pe
r da
y w
as e
stim
ated
Com
pare
: Am
ount
of
Cr
mea
sure
d in
com
mon
com
pone
nts
of
typi
cal P
N s
olut
ions
, the
n es
tim
ated
tota
l Cr
like
ly to
be
giv
en d
aily
vs
expe
cted
(r
efer
ence
ran
ge)
To
mea
sure
the
amou
nt o
f C
r th
at w
ould
uni
nten
tion
ally
be
adm
inis
tere
d in
PN
Find
ing:
Con
tam
inat
ing
Cr
appr
oach
es o
r is
equa
l to
min
imum
do
se o
f ref
eren
ce ra
nge
by A
MA
ex
pert
pane
l (10
–15
µg/d
)
Stor
age
of s
olut
ions
in p
last
ic b
ags
for
14 d
did
not
aff
ect r
esul
ts.
The
am
ount
s ra
nged
fro
m 2
.4–8
.1
µg/d
for
hig
h gl
ucos
e fo
rmul
a to
2.
6–10
.5 µ
g/d
for
a hi
gh I
VFE
fo
rmul
a. A
A s
olut
ions
, esp
ecia
lly
whe
n co
ntai
ning
Maj
or c
onta
min
atio
n. S
ourc
es:
AA
s, p
hosp
hate
sal
ts, a
nd I
VF
Es
used
in la
rge
quan
tity
(86
% o
f C
r co
ntam
inat
ion)
. Var
iati
ons
lot
to lo
t. N
o re
port
s of
toxi
city
in
lite
ratu
re.
(con
tinu
ed)
Tab
le 1
4. (
con
tin
ued
)
at SAINT FRANCIS HOSPITAL on March 13, 2015pen.sagepub.comDownloaded from
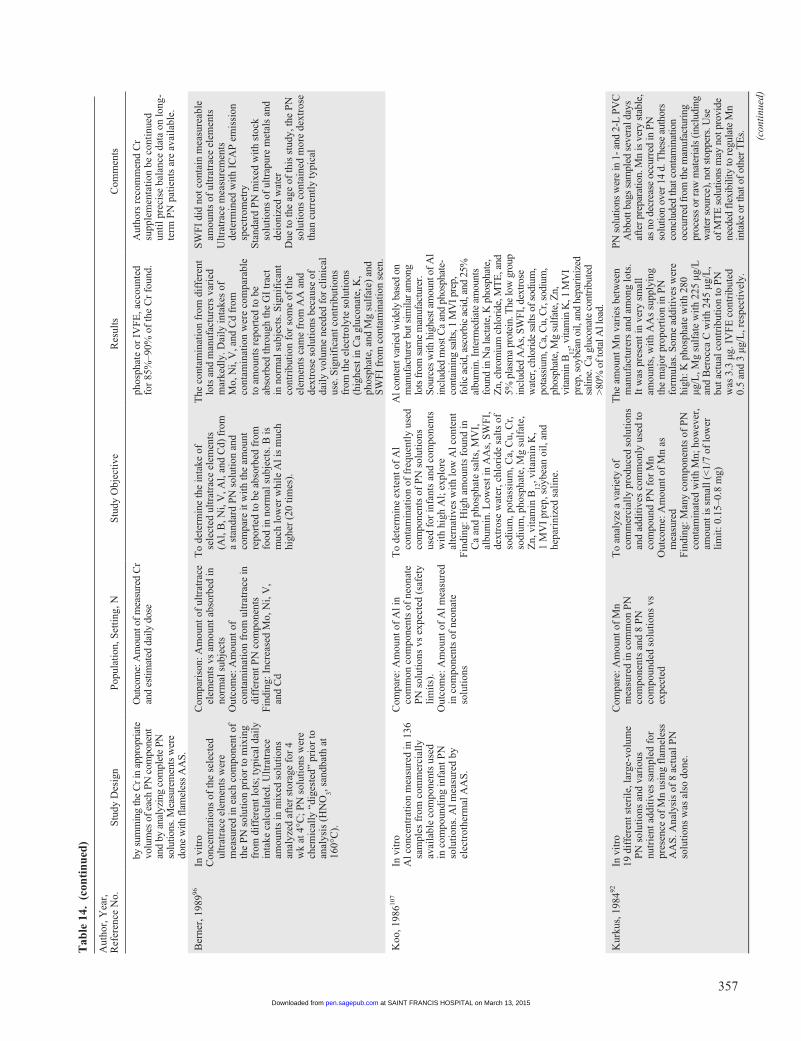
357
Aut
hor,
Yea
r,
Ref
eren
ce N
o.S
tudy
Des
ign
Pop
ulat
ion,
Set
ting
, NS
tudy
Obj
ecti
veR
esul
tsC
omm
ents
by
sum
min
g th
e C
r in
appr
opri
ate
volu
mes
of e
ach
PN c
ompo
nent
an
d by
ana
lyzi
ng c
ompl
ete
PN
solu
tions
. Mea
sure
men
ts w
ere
done
with
flam
eles
s A
AS.
O
utco
me:
Am
ount
of m
easu
red
Cr
and
estim
ated
dai
ly d
ose
ph
osph
ate
or I
VF
E, a
ccou
nted
fo
r 85
%–9
0% o
f th
e C
r fo
und.
A
utho
rs r
ecom
men
d C
r su
pple
men
tati
on b
e co
ntin
ued
unti
l pre
cise
bal
ance
dat
a on
long
-te
rm P
N p
atie
nts
are
avai
labl
e.
Ber
ner,
198
996In
vit
roC
once
ntra
tion
s of
the
sele
cted
ul
trat
race
ele
men
ts w
ere
mea
sure
d in
eac
h co
mpo
nent
of
the
PN
sol
utio
n pr
ior
to m
ixin
g fr
om d
iffe
rent
lots
; typ
ical
dai
ly
inta
ke c
alcu
late
d. U
ltra
trac
e am
ount
s in
mix
ed s
olut
ions
an
alyz
ed a
fter
sto
rage
for
4
wk
at 4
°C; P
N s
olut
ions
wer
e ch
emic
ally
“di
gest
ed”
prio
r to
an
alys
is (
HN
O3, s
andb
ath
at
160°
C).
Com
pari
son:
Am
ount
of
ultr
atra
ce
elem
ents
vs
amou
nt a
bsor
bed
in
norm
al s
ubje
cts
Out
com
e: A
mou
nt o
f co
ntam
inat
ion
from
ult
ratr
ace
in
diff
eren
t PN
com
pone
nts
Fin
ding
: Inc
reas
ed M
o, N
i, V
, an
d C
d
To
dete
rmin
e th
e in
take
of
sele
cted
ult
ratr
ace
elem
ents
(A
l, B
, Ni,
V, A
l, an
d C
d) f
rom
a
stan
dard
PN
sol
utio
n an
d co
mpa
re it
wit
h th
e am
ount
re
port
ed to
be
abso
rbed
fro
m
food
in n
orm
al s
ubje
cts.
B is
m
uch
low
er w
hile
Al i
s m
uch
high
er (
20 ti
mes
).
The
con
tam
inat
ion
from
dif
fere
nt
lots
and
man
ufac
ture
rs v
arie
d m
arke
dly.
Dai
ly in
take
s of
M
o, N
i, V
, and
Cd
from
co
ntam
inat
ion
wer
e co
mpa
rabl
e to
am
ount
s re
port
ed to
be
abso
rbed
thro
ugh
the
GI
trac
t in
nor
mal
sub
ject
s. S
igni
fica
nt
cont
ribu
tion
for
som
e of
the
elem
ents
cam
e fr
om A
A a
nd
dext
rose
sol
utio
ns b
ecau
se o
f da
ily
volu
me
need
ed f
or c
lini
cal
use.
Sig
nifi
cant
con
trib
utio
ns
from
the
elec
trol
yte
solu
tion
s (h
ighe
st in
Ca
gluc
onat
e, K
, ph
osph
ate,
and
Mg
sulf
ate)
and
S
WF
I fr
om c
onta
min
atio
n se
en.
SW
FI
did
not c
onta
in m
easu
reab
le
amou
nts
of u
ltra
trac
e el
emen
tsU
ltra
trac
e m
easu
rem
ents
de
term
ined
wit
h IC
AP
em
issi
on
spec
trom
etry
Sta
ndar
d P
N m
ixed
wit
h st
ock
solu
tion
s of
ult
rapu
re m
etal
s an
d de
ioni
zed
wat
erD
ue to
the
age
of th
is s
tudy
, the
PN
so
luti
ons
cont
aine
d m
ore
dext
rose
th
an c
urre
ntly
typi
cal
Koo
, 198
6107
In v
itro
Al c
once
ntra
tion
mea
sure
d in
136
sa
mpl
es f
rom
com
mer
cial
ly
avai
labl
e co
mpo
nent
s us
ed
in c
ompo
undi
ng in
fant
PN
so
luti
ons.
Al m
easu
red
by
elec
trot
herm
al A
AS
.
Com
pare
: Am
ount
of
Al i
n co
mm
on c
ompo
nent
s of
neo
nate
P
N s
olut
ions
vs
expe
cted
(sa
fety
li
mit
s).
Out
com
e: A
mou
nt o
f A
l mea
sure
d in
com
pone
nts
of n
eona
te
solu
tion
s
To
dete
rmin
e ex
tent
of
Al
cont
amin
atio
n of
fre
quen
tly
used
co
mpo
nent
s of
PN
sol
utio
ns
used
for
infa
nts
and
com
pone
nts
wit
h hi
gh A
l; e
xplo
re
alte
rnat
ives
wit
h lo
w A
l con
tent
Fin
ding
: Hig
h am
ount
s fo
und
in
Ca
and
phos
phat
e sa
lts,
MV
I,
albu
min
. Low
est i
n A
As,
SW
FI,
de
xtro
se w
ater
, chl
orid
e sa
lts
of
sodi
um, p
otas
sium
, Ca,
Cu,
Cr,
so
dium
, pho
spha
te, M
g su
lfat
e,
Zn,
vit
amin
B12
, vit
amin
K,
1 M
VI
prep
, soy
bean
oil
, and
he
pari
nize
d sa
line
.
Al c
onte
nt v
arie
d w
idel
y ba
sed
on
man
ufac
ture
r but
sim
ilar a
mon
g lo
ts fr
om s
ame
man
ufac
ture
r.
Sour
ces
with
hig
hest
am
ount
of A
l in
clud
ed m
ost C
a an
d ph
osph
ate-
cont
aini
ng s
alts
, 1 M
VI p
rep,
fo
lic a
cid,
asc
orbi
c ac
id, a
nd 2
5%
albu
min
. Int
erm
edia
te a
mou
nts
foun
d in
Na
lact
ate,
K p
hosp
hate
, Z
n, c
hrom
ium
chl
orid
e, M
TE
, and
5%
pla
sma
prot
ein.
The
low
gro
up
incl
uded
AA
s, S
WFI
, dex
tros
e w
ater
, chl
orid
e sa
lts o
f sod
ium
, po
tass
ium
, Ca,
Cu,
Cr,
sodi
um,
phos
phat
e, M
g su
lfat
e, Z
n,
vita
min
B12
, vita
min
K, 1
MV
I pr
ep, s
oybe
an o
il, a
nd h
epar
iniz
ed
salin
e. C
a gl
ucon
ate
cont
ribu
ted
>80%
of t
otal
Al l
oad.
Kur
kus,
198
492In
vit
ro19
dif
fere
nt s
teri
le, l
arge
-vol
ume
PN
sol
utio
ns a
nd v
ario
us
nutr
ient
add
itiv
es s
ampl
ed f
or
pres
ence
of
Mn
usin
g fl
amel
ess
AA
S. A
naly
sis
of 8
act
ual P
N
solu
tion
s w
as a
lso
done
.
Com
pare
: Am
ount
of
Mn
mea
sure
d in
com
mon
PN
co
mpo
nent
s an
d 8
PN
co
mpo
unde
d so
luti
ons
vs
expe
cted
To
anal
yze
a va
riet
y of
co
mm
erci
ally
pro
duce
d so
luti
ons
and
addi
tive
s co
mm
only
use
d to
co
mpo
und
PN
for
Mn
Out
com
e: A
mou
nt o
f M
n as
m
easu
red
Fin
ding
: Man
y co
mpo
nent
s of
PN
co
ntam
inat
ed w
ith
Mn;
how
ever
, am
ount
is s
mal
l (<
1/7
of lo
wer
li
mit
: 0.1
5–0.
8 m
g)
The
am
ount
Mn
vari
es b
etw
een
man
ufac
ture
rs a
nd a
mon
g lo
ts.
It w
as p
rese
nt in
ver
y sm
all
amou
nts,
wit
h A
As
supp
lyin
g th
e m
ajor
pro
port
ion
in P
N
form
ulas
. Som
e ad
diti
ves
wer
e hi
gh: K
pho
spha
te w
ith
280
µg/L
, Mg
sulf
ate
wit
h 22
5 µg
/L
and
Ber
occa
C w
ith
245
µg/L
, bu
t act
ual c
ontr
ibut
ion
to P
N
was
3.3
µg.
IV
FE
con
trib
uted
0.
5 an
d 3
µg/L
, res
pect
ivel
y.
PN s
olut
ions
wer
e in
1- a
nd 2
-L P
VC
A
bbot
t bag
s sa
mpl
ed s
ever
al d
ays
afte
r pre
para
tion.
Mn
is v
ery
stab
le,
as n
o de
crea
se o
ccur
red
in P
N
solu
tion
over
14
d. T
hese
aut
hors
co
nclu
ded
that
con
tam
inat
ion
occu
rred
from
the
man
ufac
turi
ng
proc
ess
or ra
w m
ater
ials
(inc
ludi
ng
wat
er s
ourc
e), n
ot s
topp
ers.
Use
of
MT
E s
olut
ions
may
not
pro
vide
ne
eded
flex
ibili
ty to
regu
late
Mn
inta
ke o
r tha
t of o
ther
TE
s. (con
tinu
ed)
Tab
le 1
4. (
con
tin
ued
)
at SAINT FRANCIS HOSPITAL on March 13, 2015pen.sagepub.comDownloaded from
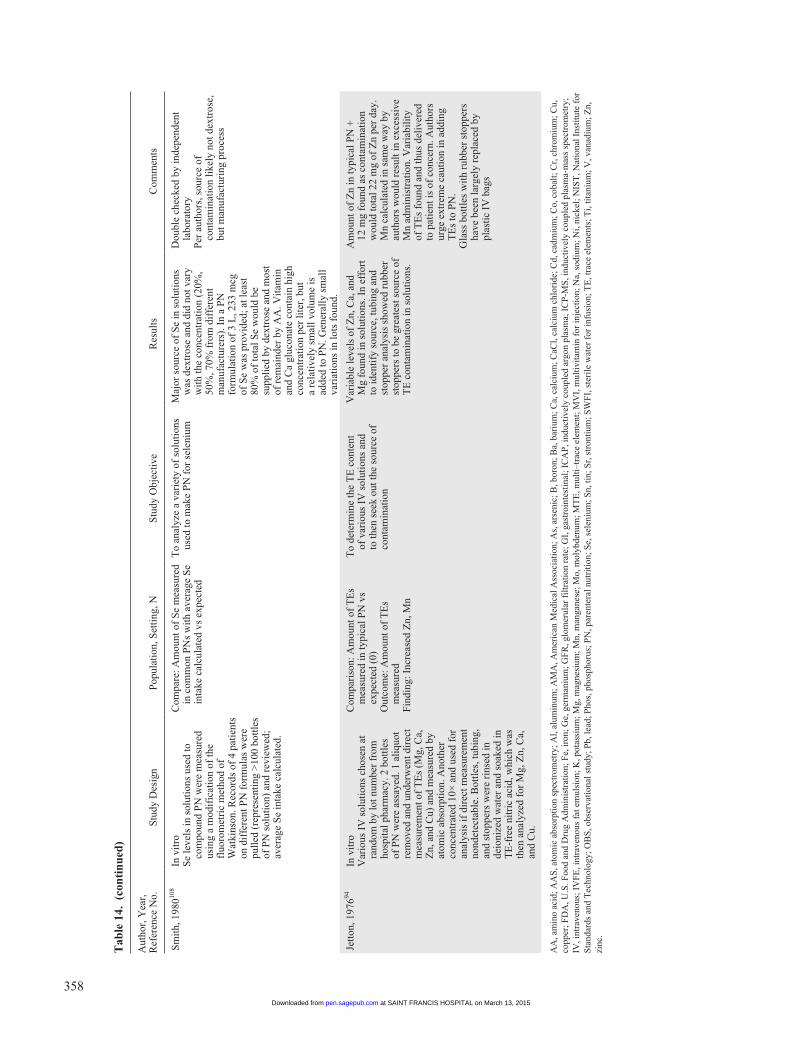
358
Aut
hor,
Yea
r,
Ref
eren
ce N
o.S
tudy
Des
ign
Pop
ulat
ion,
Set
ting
, NS
tudy
Obj
ecti
veR
esul
tsC
omm
ents
Sm
ith,
198
0108
In v
itro
Se
leve
ls in
sol
utio
ns u
sed
to
com
poun
d P
N w
ere
mea
sure
d us
ing
a m
odif
icat
ion
of th
e fl
uoro
met
ric
met
hod
of
Wat
kins
on. R
ecor
ds o
f 4
pati
ents
on
dif
fere
nt P
N f
orm
ulas
wer
e pu
lled
(re
pres
enti
ng >
100
bott
les
of P
N s
olut
ion)
and
rev
iew
ed;
aver
age
Se
inta
ke c
alcu
late
d.
Com
pare
: Am
ount
of
Se
mea
sure
d in
com
mon
PN
s w
ith
aver
age
Se
inta
ke c
alcu
late
d vs
exp
ecte
d
To
anal
yze
a va
riet
y of
sol
utio
ns
used
to m
ake
PN
for
sel
eniu
mM
ajor
sou
rce
of S
e in
sol
utio
ns
was
dex
tros
e an
d di
d no
t var
y w
ith
the
conc
entr
atio
n (2
0%,
50%
, 70%
fro
m d
iffe
rent
m
anuf
actu
rers
). I
n a
PN
fo
rmul
atio
n of
3 L
, 233
mcg
of
Se
was
pro
vide
d; a
t lea
st
80%
of
tota
l Se
wou
ld b
e su
ppli
ed b
y de
xtro
se a
nd m
ost
of r
emai
nder
by
AA
. Vit
amin
an
d C
a gl
ucon
ate
cont
ain
high
co
ncen
trat
ion
per
lite
r, b
ut
a re
lati
vely
sm
all v
olum
e is
ad
ded
to P
N. G
ener
ally
sm
all
vari
atio
ns in
lots
fou
nd.
Dou
ble
chec
ked
by in
depe
nden
t la
bora
tory
Per
aut
hors
, sou
rce
of
cont
amin
atio
n li
kely
not
dex
tros
e,
but m
anuf
actu
ring
pro
cess
Jett
on, 1
97694
In v
itro
Var
ious
IV
sol
utio
ns c
hose
n at
ra
ndom
by
lot n
umbe
r fr
om
hosp
ital
pha
rmac
y. 2
bot
tles
of
PN
wer
e as
saye
d. 1
ali
quot
re
mov
ed a
nd u
nder
wen
t dir
ect
mea
sure
men
t of
TE
s (M
g, C
a,
Zn,
and
Cu)
and
mea
sure
d by
at
omic
abs
orpt
ion.
Ano
ther
co
ncen
trat
ed 1
0× a
nd u
sed
for
anal
ysis
if d
irec
t mea
sure
men
t no
ndet
ecta
ble.
Bot
tles
, tub
ing,
an
d st
oppe
rs w
ere
rins
ed in
de
ioni
zed
wat
er a
nd s
oake
d in
T
E-f
ree
nitr
ic a
cid,
whi
ch w
as
then
ana
lyze
d fo
r M
g, Z
n, C
a,
and
Cu.
Com
pari
son:
Am
ount
of
TE
s m
easu
red
in ty
pica
l PN
vs
expe
cted
(0)
Out
com
e: A
mou
nt o
f T
Es
mea
sure
dF
indi
ng: I
ncre
ased
Zn,
Mn
To
dete
rmin
e th
e T
E c
onte
nt
of v
ario
us I
V s
olut
ions
and
to
then
see
k ou
t the
sou
rce
of
cont
amin
atio
n
Var
iabl
e le
vels
of
Zn,
Ca,
and
M
g fo
und
in s
olut
ions
. In
effo
rt
to id
enti
fy s
ourc
e, tu
bing
and
st
oppe
r an
alys
is s
how
ed r
ubbe
r st
oppe
rs to
be
grea
test
sou
rce
of
TE
con
tam
inat
ion
in s
olut
ions
.
Am
ount
of
Zn
in ty
pica
l PN
+
12 m
g fo
und
as c
onta
min
atio
n w
ould
tota
l 22
mg
of Z
n pe
r da
y.
Mn
calc
ulat
ed in
sam
e w
ay b
y au
thor
s w
ould
res
ult i
n ex
cess
ive
Mn
adm
inis
trat
ion.
Var
iabi
lity
of
TE
s fo
und
and
thus
del
iver
ed
to p
atie
nt is
of
conc
ern.
Aut
hors
ur
ge e
xtre
me
caut
ion
in a
ddin
g T
Es
to P
N.
Gla
ss b
ottl
es w
ith
rubb
er s
topp
ers
have
bee
n la
rgel
y re
plac
ed b
y pl
asti
c IV
bag
s
AA
, am
ino
acid
; AA
S, a
tom
ic a
bsor
ptio
n sp
ectr
omet
ry; A
l, al
umin
um; A
MA
, Am
eric
an M
edic
al A
ssoc
iati
on; A
s, a
rsen
ic; B
, bor
on; B
a, b
ariu
m; C
a, c
alci
um; C
aCl,
calc
ium
chl
orid
e; C
d, c
adm
ium
; Co,
cob
alt;
Cr,
chr
omiu
m; C
u,
copp
er; F
DA
, U.S
. Foo
d an
d D
rug
Adm
inis
trat
ion;
Fe,
iron
; Ge,
ger
man
ium
; GF
R, g
lom
erul
ar f
iltr
atio
n ra
te; G
I, g
astr
oint
esti
nal;
IC
AP
, ind
ucti
vely
cou
pled
arg
on p
lasm
a; I
CP
-MS
, ind
ucti
vely
cou
pled
pla
sma-
mas
s sp
ectr
omet
ry;
IV, i
ntra
veno
us; I
VF
E, i
ntra
veno
us f
at e
mul
sion
; K, p
otas
sium
; Mg,
mag
nesi
um; M
n, m
anga
nese
; Mo,
mol
ybde
num
; MT
E, m
ulti
–tra
ce e
lem
ent;
MV
I, m
ulti
vita
min
for
inje
ctio
n; N
a, s
odiu
m; N
i, ni
ckel
; NIS
T, N
atio
nal I
nsti
tute
for
S
tand
ards
and
Tec
hnol
ogy;
OB
S, o
bser
vati
onal
stu
dy; P
b, le
ad; P
hos,
pho
spho
rus;
PN
, par
ente
ral n
utri
tion
; Se,
sel
eniu
m; S
n, ti
n; S
r, s
tron
tium
; SW
FI,
ste
rile
wat
er f
or in
fusi
on; T
E, t
race
ele
men
ts; T
i, ti
tani
um; V
, van
adiu
m; Z
n,
zinc
.
Tab
le 1
4. (
con
tin
ued
)
at SAINT FRANCIS HOSPITAL on March 13, 2015pen.sagepub.comDownloaded from
Boullata et al 359
as contaminants in a number of PN components.90,91,95,99-102 This may necessitate the use of individual rather than fixed-dose multi–trace element products to allow dosing flexibility for patient PN regimens when contaminants are of concern. Further research is recommended on micronutrient contamina-tion of PN.
Question 9. Is it safe to use the PN admixture as a vehicle for non-nutrient medication delivery?
Recommendation: We recommend that non-nutrient medi-cation be included in PN admixtures only when supported by (1) pharmaceutical data describing physicochemical compati-bility and stability of (a) the additive medication and (b) the final preparation under conditions of typical use, and (2) clini-cal data confirming the expected therapeutic actions of the medication. Extrapolation beyond the parameter limits (eg, products, concentrations) of the given data is discouraged.
GRADE: Strong (Table 15)Rationale: Taking into account all of the contents, the sta-
bility and compatibility of PN admixtures are pharmaceuti-cally complex in the absence of drug additives.109,110 Given this complexity, caution is required before introducing sub-stances (including medication) not known to be compatible and stable with PN and without knowing the consequence to the integrity of the PN preparation. The inclusion of non-nutrient medication with PN admixtures has not generally been.2 However, there are potential advantages to including medication in the PN admixture (eg, consolidating drug dos-ing and volume, reducing violations of the vascular access device). Any medications considered should be limited to IV drugs with stable regimens, which are therapeutically effec-tive by continuous infusion and do not require dose titration.111
Nearly 75% of respondents in a national survey allow non-nutrient medication to be added to PN admixtures.112 Most fre-quently included are insulin, heparin, and the histamine type-2 receptor antagonists. Much less commonly included are albu-min, digoxin, dopamine, erythropoietin, furosemide, hydrocor-tisone, methylprednisolone, metoclopramide, octreotide, and ondansetron. While many of these medications have been evaluated, the study conditions and data reported may not always support their inclusion. Some medication (eg, albumin) is not recommended for inclusion in PN.113 Other drugs (eg, heparin) are not recommended for 3-in-1 PN admixtures because of influences on the integrity of the emulsion.114-116 Therefore, including non-nutrient medication in PN admix-tures is risky in the absence of appropriate evidence indicating compatibility and stability.111
Specific criteria for evaluating compatibility and stability studies of medication in PN are well recognized and should be met.111,117 Any potential for incompatibility or instability as a result of physical-chemical interaction poses a safety concern. Studies should provide a complete description of the PN and
the medication, use drug stability-indicating assays, obtain multiple sample points over at least 12–24 hours in replicate, describe physicochemical properties, and simulate conditions of actual use.111,117 Physical compatibility is not necessarily indicative of chemical compatibility.118 Furthermore, physical compatibility and chemical stability alone are not sufficient to include a medication in a PN admixture. Pharmacologic or therapeutic efficacy must be maintained or improved, without any increase in adverse reactions, when administered as part of the PN regimen and requires a clinical study. The continuous IV administration of drug via PN admixtures may be more effective at maintaining therapeutic drug concentrations com-pared with intermittent dosing. This was demonstrated in a clinical study for the histamine type-2 receptor antagonist cimetidine.119 Only 29% of serum values were subtherapeutic when administered continuously via PN compared with 70% when the drug was administered every 6 or 8 hours.119 In this case a clinical study was possible because of a previous com-patibility/stability study.119,120 In contrast, few studies are of adequate quality to support PN inclusion of non-nutrient medi-cations in practice.
Most of the earlier studies contained serious flaws in both study design and results reporting. Primary among these was using visual rather than quantitative documentation of compat-ibility and stability.111 Visual compatibility is not sufficient and eliminates many of the available publications.118,120-123 The remaining studies suggest that only a few medications (eg, his-tamine type-2 receptor antagonists) may be included in PN admixtures with specifically defined contents. The PN formula composition will in part determine the availability of drug to the patient’s circulation.124 A number of studies using 3-in-1 PN admixtures were published prior to the USP criteria on emulsion stability.125 Closer examination of the reported results may prove less acceptable if the percentage of fat par-ticles >5 µm exceeds the 0.05% limit. A drug with in vitro compatibility and stability in a PN admixture would still need to be shown to be clinically effective in humans before it can be recommended.
Beyond compatibility and stability in the PN admixture is the compatibility of the medication with the administration system (PN container, administration set, and inline filter), which is seldom evaluated. In the patient with limited access, an alternative to including medication in the PN container is to consider administering via Y-site into the same line. The com-patibility of coinfusion of medication via Y-site has also been studied in vitro for commonly used medication in adult, pedi-atric, and neonate patients.126-129 The number of formulations tested and study conditions are usually limited. A systematic evaluation of 102 drugs revealed that 82 (80%) were physi-cally compatible with four 2-in-1 PN admixtures.126 A similar evaluation of 106 drugs revealed that 83 (78%) were physi-cally compatible with nine 3-in-1 PN admixtures.127 An evalu-ation of 25 medications revealed that 20 (80%) were considered compatible with a 3-in-1 PN admixture.128 Only 5 drugs out of
at SAINT FRANCIS HOSPITAL on March 13, 2015pen.sagepub.comDownloaded from
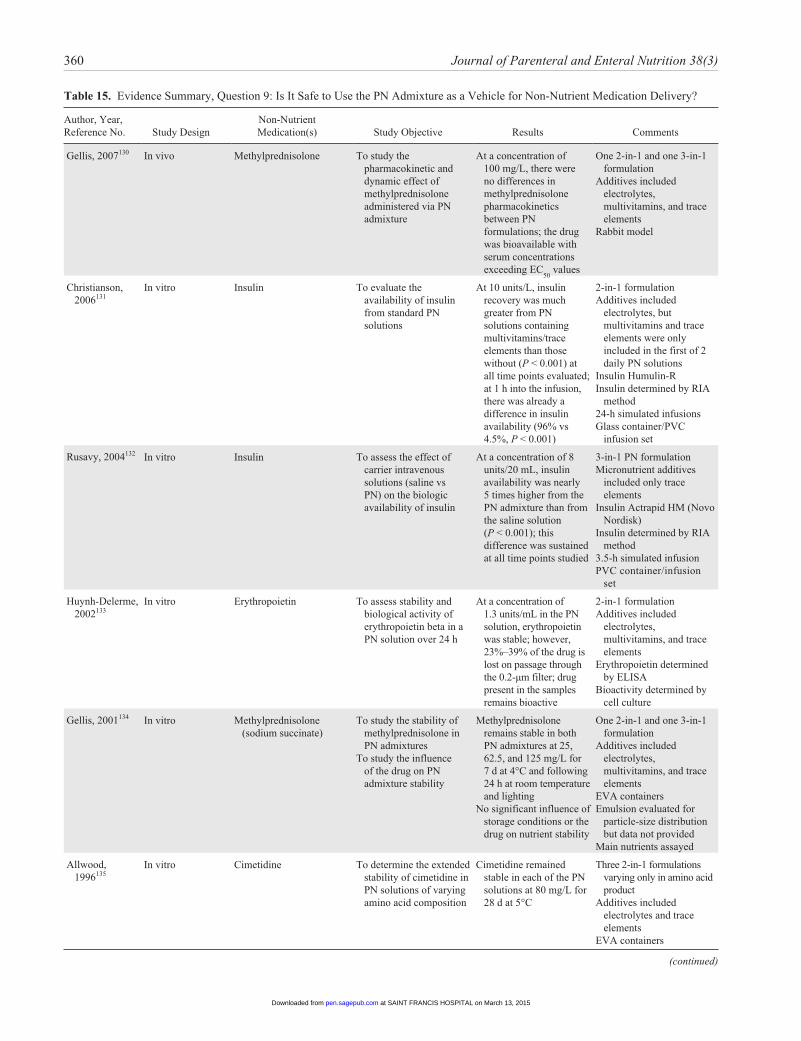
360 Journal of Parenteral and Enteral Nutrition 38(3)
Table 15. Evidence Summary, Question 9: Is It Safe to Use the PN Admixture as a Vehicle for Non-Nutrient Medication Delivery?
Author, Year, Reference No. Study Design
Non-Nutrient Medication(s) Study Objective Results Comments
Gellis, 2007130 In vivo Methylprednisolone To study the pharmacokinetic and dynamic effect of methylprednisolone administered via PN admixture
At a concentration of 100 mg/L, there were no differences in methylprednisolone pharmacokinetics between PN formulations; the drug was bioavailable with serum concentrations exceeding EC
50 values
One 2-in-1 and one 3-in-1 formulation
Additives included electrolytes, multivitamins, and trace elements
Rabbit model
Christianson, 2006131
In vitro Insulin To evaluate the availability of insulin from standard PN solutions
At 10 units/L, insulin recovery was much greater from PN solutions containing multivitamins/trace elements than those without (P < 0.001) at all time points evaluated; at 1 h into the infusion, there was already a difference in insulin availability (96% vs 4.5%, P < 0.001)
2-in-1 formulation Additives included
electrolytes, but multivitamins and trace elements were only included in the first of 2 daily PN solutions
Insulin Humulin-R Insulin determined by RIA
method 24-h simulated infusions Glass container/PVC
infusion set
Rusavy, 2004132 In vitro Insulin To assess the effect of carrier intravenous solutions (saline vs PN) on the biologic availability of insulin
At a concentration of 8 units/20 mL, insulin availability was nearly 5 times higher from the PN admixture than from the saline solution (P < 0.001); this difference was sustained at all time points studied
3-in-1 PN formulation Micronutrient additives
included only trace elements
Insulin Actrapid HM (Novo Nordisk)
Insulin determined by RIA method
3.5-h simulated infusion PVC container/infusion
set
Huynh-Delerme, 2002133
In vitro Erythropoietin To assess stability and biological activity of erythropoietin beta in a PN solution over 24 h
At a concentration of 1.3 units/mL in the PN solution, erythropoietin was stable; however, 23%–39% of the drug is lost on passage through the 0.2-µm filter; drug present in the samples remains bioactive
2-in-1 formulation Additives included
electrolytes, multivitamins, and trace elements
Erythropoietin determined by ELISA
Bioactivity determined by cell culture
Gellis, 2001134 In vitro Methylprednisolone (sodium succinate)
To study the stability of methylprednisolone in PN admixtures
To study the influence of the drug on PN admixture stability
Methylprednisolone remains stable in both PN admixtures at 25, 62.5, and 125 mg/L for 7 d at 4°C and following 24 h at room temperature and lighting
No significant influence of storage conditions or the drug on nutrient stability
One 2-in-1 and one 3-in-1 formulation
Additives included electrolytes, multivitamins, and trace elements
EVA containers Emulsion evaluated for
particle-size distribution but data not provided
Main nutrients assayed
Allwood, 1996135
In vitro Cimetidine To determine the extended stability of cimetidine in PN solutions of varying amino acid composition
Cimetidine remained stable in each of the PN solutions at 80 mg/L for 28 d at 5°C
Three 2-in-1 formulations varying only in amino acid product
Additives included electrolytes and trace elements
EVA containers
(continued)
at SAINT FRANCIS HOSPITAL on March 13, 2015pen.sagepub.comDownloaded from
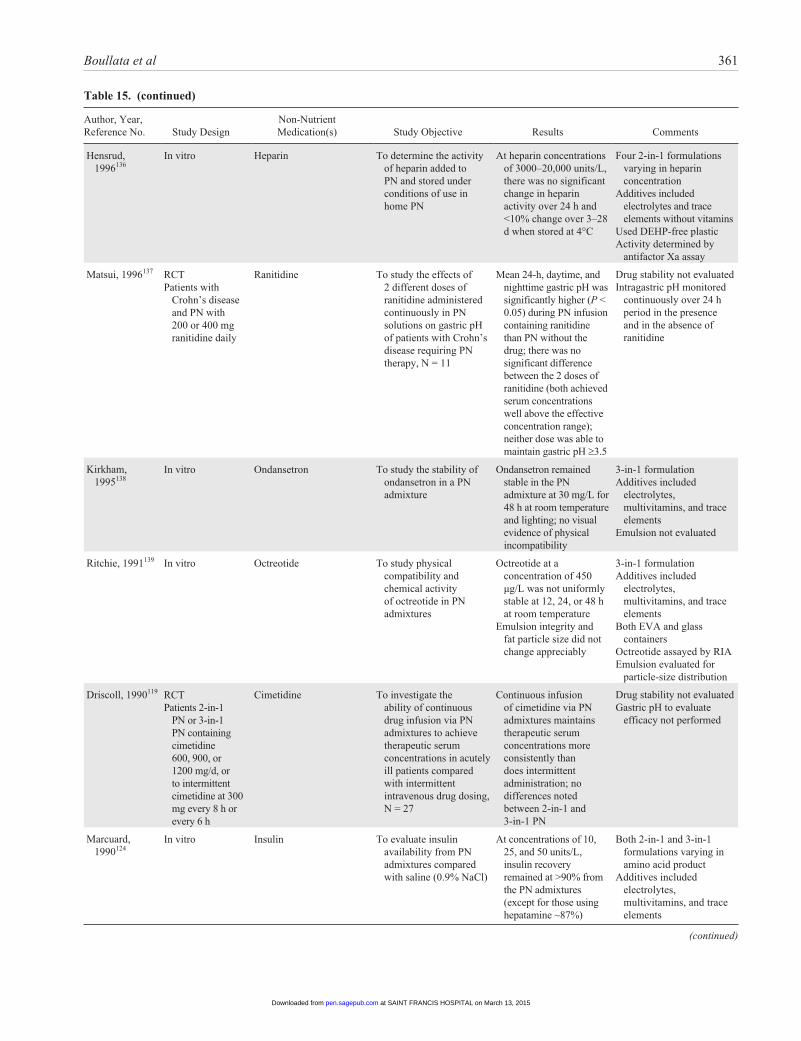
Boullata et al 361
Author, Year, Reference No. Study Design
Non-Nutrient Medication(s) Study Objective Results Comments
Hensrud, 1996136
In vitro Heparin To determine the activity of heparin added to PN and stored under conditions of use in home PN
At heparin concentrations of 3000–20,000 units/L, there was no significant change in heparin activity over 24 h and <10% change over 3–28 d when stored at 4°C
Four 2-in-1 formulations varying in heparin concentration
Additives included electrolytes and trace elements without vitamins
Used DEHP-free plastic Activity determined by
antifactor Xa assay
Matsui, 1996137 RCTPatients with
Crohn’s disease and PN with 200 or 400 mg ranitidine daily
Ranitidine To study the effects of 2 different doses of ranitidine administered continuously in PN solutions on gastric pH of patients with Crohn’s disease requiring PN therapy, N = 11
Mean 24-h, daytime, and nighttime gastric pH was significantly higher (P < 0.05) during PN infusion containing ranitidine than PN without the drug; there was no significant difference between the 2 doses of ranitidine (both achieved serum concentrations well above the effective concentration range); neither dose was able to maintain gastric pH ≥3.5
Drug stability not evaluated Intragastric pH monitored
continuously over 24 h period in the presence and in the absence of ranitidine
Kirkham, 1995138
In vitro Ondansetron To study the stability of ondansetron in a PN admixture
Ondansetron remained stable in the PN admixture at 30 mg/L for 48 h at room temperature and lighting; no visual evidence of physical incompatibility
3-in-1 formulation Additives included
electrolytes, multivitamins, and trace elements
Emulsion not evaluated
Ritchie, 1991139 In vitro Octreotide To study physical compatibility and chemical activity of octreotide in PN admixtures
Octreotide at a concentration of 450 µg/L was not uniformly stable at 12, 24, or 48 h at room temperature
Emulsion integrity and fat particle size did not change appreciably
3-in-1 formulation Additives included
electrolytes, multivitamins, and trace elements
Both EVA and glass containers
Octreotide assayed by RIA Emulsion evaluated for
particle-size distribution
Driscoll, 1990119 RCTPatients 2-in-1
PN or 3-in-1 PN containing cimetidine 600, 900, or 1200 mg/d, or to intermittent cimetidine at 300 mg every 8 h or every 6 h
Cimetidine To investigate the ability of continuous drug infusion via PN admixtures to achieve therapeutic serum concentrations in acutely ill patients compared with intermittent intravenous drug dosing, N = 27
Continuous infusion of cimetidine via PN admixtures maintains therapeutic serum concentrations more consistently than does intermittent administration; no differences noted between 2-in-1 and 3-in-1 PN
Drug stability not evaluated Gastric pH to evaluate
efficacy not performed
Marcuard, 1990124
In vitro Insulin To evaluate insulin availability from PN admixtures compared with saline (0.9% NaCl)
At concentrations of 10, 25, and 50 units/L, insulin recovery remained at >90% from the PN admixtures (except for those using hepatamine ~87%)
Both 2-in-1 and 3-in-1 formulations varying in amino acid product
Additives included electrolytes, multivitamins, and trace elements
(continued)
Table 15. (continued)
at SAINT FRANCIS HOSPITAL on March 13, 2015pen.sagepub.comDownloaded from
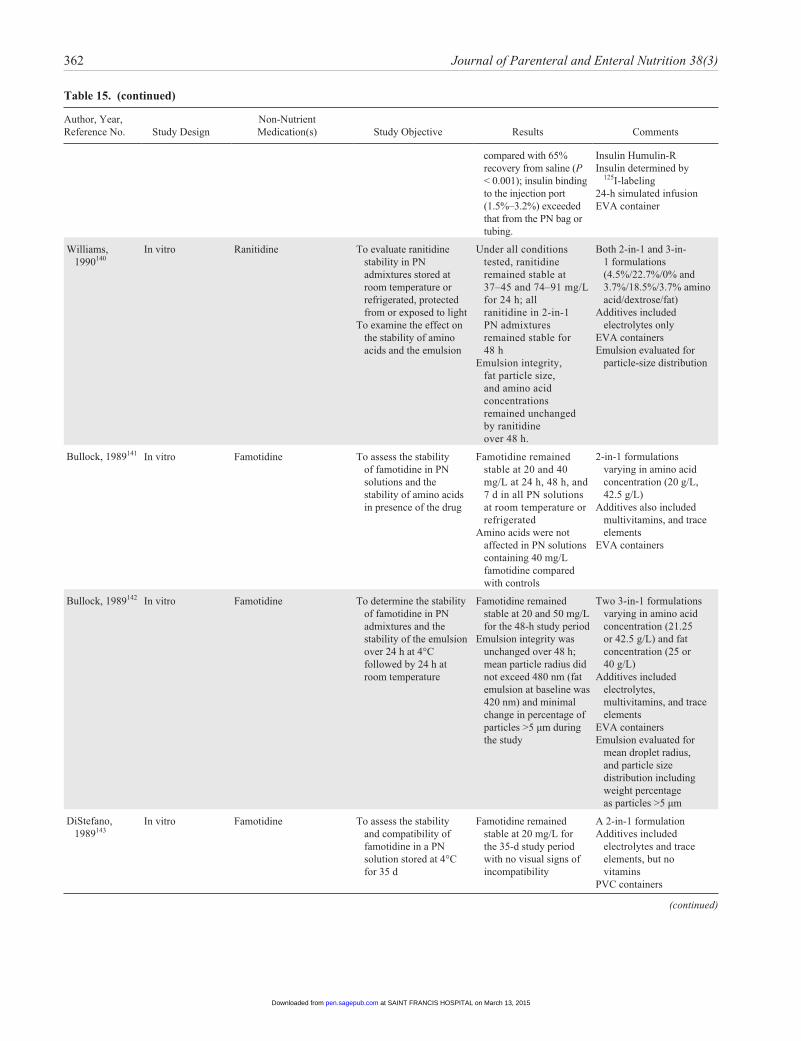
362 Journal of Parenteral and Enteral Nutrition 38(3)
Author, Year, Reference No. Study Design
Non-Nutrient Medication(s) Study Objective Results Comments
compared with 65% recovery from saline (P < 0.001); insulin binding to the injection port (1.5%–3.2%) exceeded that from the PN bag or tubing.
Insulin Humulin-R Insulin determined by
125I-labeling24-h simulated infusionEVA container
Williams, 1990140
In vitro Ranitidine To evaluate ranitidine stability in PN admixtures stored at room temperature or refrigerated, protected from or exposed to light
To examine the effect on the stability of amino acids and the emulsion
Under all conditions tested, ranitidine remained stable at 37–45 and 74–91 mg/L for 24 h; all ranitidine in 2-in-1 PN admixtures remained stable for 48 h
Emulsion integrity, fat particle size, and amino acid concentrations remained unchanged by ranitidine over 48 h.
Both 2-in-1 and 3-in-1 formulations (4.5%/22.7%/0% and 3.7%/18.5%/3.7% amino acid/dextrose/fat)
Additives included electrolytes only
EVA containers Emulsion evaluated for
particle-size distribution
Bullock, 1989141 In vitro Famotidine To assess the stability of famotidine in PN solutions and the stability of amino acids in presence of the drug
Famotidine remained stable at 20 and 40 mg/L at 24 h, 48 h, and 7 d in all PN solutions at room temperature or refrigerated
Amino acids were not affected in PN solutions containing 40 mg/L famotidine compared with controls
2-in-1 formulations varying in amino acid concentration (20 g/L, 42.5 g/L)
Additives also included multivitamins, and trace elements
EVA containers
Bullock, 1989142 In vitro Famotidine To determine the stability of famotidine in PN admixtures and the stability of the emulsion over 24 h at 4°C followed by 24 h at room temperature
Famotidine remained stable at 20 and 50 mg/L for the 48-h study period
Emulsion integrity was unchanged over 48 h; mean particle radius did not exceed 480 nm (fat emulsion at baseline was 420 nm) and minimal change in percentage of particles >5 µm during the study
Two 3-in-1 formulations varying in amino acid concentration (21.25 or 42.5 g/L) and fat concentration (25 or 40 g/L)
Additives included electrolytes, multivitamins, and trace elements
EVA containers Emulsion evaluated for
mean droplet radius, and particle size distribution including weight percentage as particles >5 µm
DiStefano, 1989143
In vitro Famotidine To assess the stability and compatibility of famotidine in a PN solution stored at 4°C for 35 d
Famotidine remained stable at 20 mg/L for the 35-d study period with no visual signs of incompatibility
A 2-in-1 formulation Additives included
electrolytes and trace elements, but no vitamins
PVC containers
(continued)
Table 15. (continued)
at SAINT FRANCIS HOSPITAL on March 13, 2015pen.sagepub.comDownloaded from
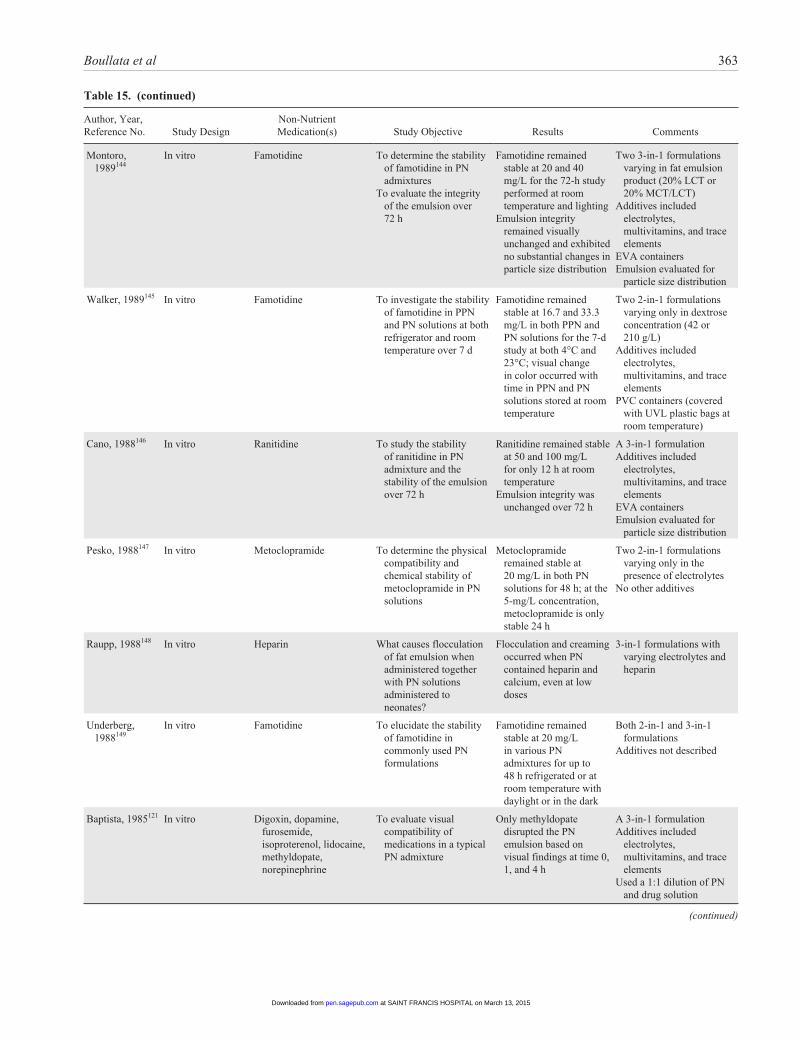
Boullata et al 363
Author, Year, Reference No. Study Design
Non-Nutrient Medication(s) Study Objective Results Comments
Montoro, 1989144
In vitro Famotidine To determine the stability of famotidine in PN admixtures
To evaluate the integrity of the emulsion over 72 h
Famotidine remained stable at 20 and 40 mg/L for the 72-h study performed at room temperature and lighting
Emulsion integrity remained visually unchanged and exhibited no substantial changes in particle size distribution
Two 3-in-1 formulations varying in fat emulsion product (20% LCT or 20% MCT/LCT)
Additives included electrolytes, multivitamins, and trace elements
EVA containers Emulsion evaluated for
particle size distribution
Walker, 1989145 In vitro Famotidine To investigate the stability of famotidine in PPN and PN solutions at both refrigerator and room temperature over 7 d
Famotidine remained stable at 16.7 and 33.3 mg/L in both PPN and PN solutions for the 7-d study at both 4°C and 23°C; visual change in color occurred with time in PPN and PN solutions stored at room temperature
Two 2-in-1 formulations varying only in dextrose concentration (42 or 210 g/L)
Additives included electrolytes, multivitamins, and trace elements
PVC containers (covered with UVL plastic bags at room temperature)
Cano, 1988146 In vitro Ranitidine To study the stability of ranitidine in PN admixture and the stability of the emulsion over 72 h
Ranitidine remained stable at 50 and 100 mg/L for only 12 h at room temperature
Emulsion integrity was unchanged over 72 h
A 3-in-1 formulation Additives included
electrolytes, multivitamins, and trace elements
EVA containers Emulsion evaluated for
particle size distribution
Pesko, 1988147 In vitro Metoclopramide To determine the physical compatibility and chemical stability of metoclopramide in PN solutions
Metoclopramide remained stable at 20 mg/L in both PN solutions for 48 h; at the 5-mg/L concentration, metoclopramide is only stable 24 h
Two 2-in-1 formulations varying only in the presence of electrolytes
No other additives
Raupp, 1988148 In vitro Heparin What causes flocculation of fat emulsion when administered together with PN solutions administered to neonates?
Flocculation and creaming occurred when PN contained heparin and calcium, even at low doses
3-in-1 formulations with varying electrolytes and heparin
Underberg, 1988149
In vitro Famotidine To elucidate the stability of famotidine in commonly used PN formulations
Famotidine remained stable at 20 mg/L in various PN admixtures for up to 48 h refrigerated or at room temperature with daylight or in the dark
Both 2-in-1 and 3-in-1 formulations
Additives not described
Baptista, 1985121 In vitro Digoxin, dopamine, furosemide, isoproterenol, lidocaine, methyldopate, norepinephrine
To evaluate visual compatibility of medications in a typical PN admixture
Only methyldopate disrupted the PN emulsion based on visual findings at time 0, 1, and 4 h
A 3-in-1 formulation Additives included
electrolytes, multivitamins, and trace elements
Used a 1:1 dilution of PN and drug solution
(continued)
Table 15. (continued)
at SAINT FRANCIS HOSPITAL on March 13, 2015pen.sagepub.comDownloaded from
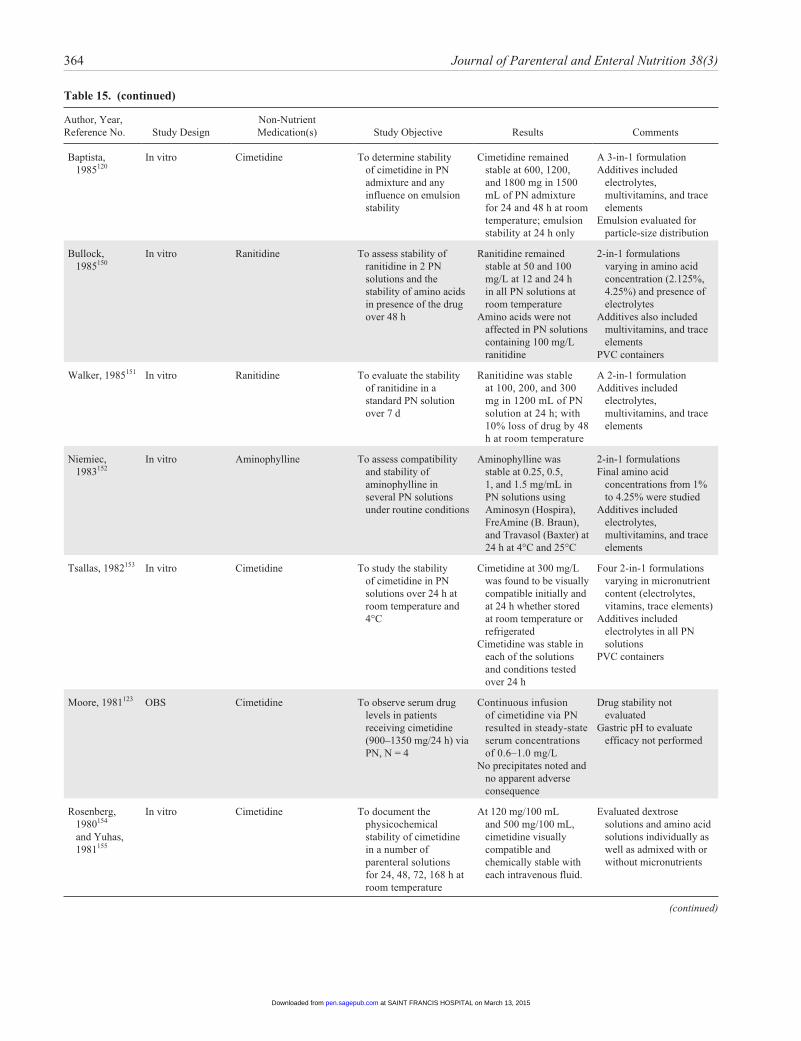
364 Journal of Parenteral and Enteral Nutrition 38(3)
Author, Year, Reference No. Study Design
Non-Nutrient Medication(s) Study Objective Results Comments
Baptista, 1985120
In vitro Cimetidine To determine stability of cimetidine in PN admixture and any influence on emulsion stability
Cimetidine remained stable at 600, 1200, and 1800 mg in 1500 mL of PN admixture for 24 and 48 h at room temperature; emulsion stability at 24 h only
A 3-in-1 formulation Additives included
electrolytes, multivitamins, and trace elements
Emulsion evaluated for particle-size distribution
Bullock, 1985150
In vitro Ranitidine To assess stability of ranitidine in 2 PN solutions and the stability of amino acids in presence of the drug over 48 h
Ranitidine remained stable at 50 and 100 mg/L at 12 and 24 h in all PN solutions at room temperature
Amino acids were not affected in PN solutions containing 100 mg/L ranitidine
2-in-1 formulations varying in amino acid concentration (2.125%, 4.25%) and presence of electrolytes
Additives also included multivitamins, and trace elements
PVC containers
Walker, 1985151 In vitro Ranitidine To evaluate the stability of ranitidine in a standard PN solution over 7 d
Ranitidine was stable at 100, 200, and 300 mg in 1200 mL of PN solution at 24 h; with 10% loss of drug by 48 h at room temperature
A 2-in-1 formulation Additives included
electrolytes, multivitamins, and trace elements
Niemiec, 1983152
In vitro Aminophylline To assess compatibility and stability of aminophylline in several PN solutions under routine conditions
Aminophylline was stable at 0.25, 0.5, 1, and 1.5 mg/mL in PN solutions using Aminosyn (Hospira), FreAmine (B. Braun), and Travasol (Baxter) at 24 h at 4°C and 25°C
2-in-1 formulations Final amino acid
concentrations from 1% to 4.25% were studied
Additives included electrolytes, multivitamins, and trace elements
Tsallas, 1982153 In vitro Cimetidine To study the stability of cimetidine in PN solutions over 24 h at room temperature and 4°C
Cimetidine at 300 mg/L was found to be visually compatible initially and at 24 h whether stored at room temperature or refrigerated
Cimetidine was stable in each of the solutions and conditions tested over 24 h
Four 2-in-1 formulations varying in micronutrient content (electrolytes, vitamins, trace elements)
Additives included electrolytes in all PN solutions
PVC containers
Moore, 1981123 OBS Cimetidine To observe serum drug levels in patients receiving cimetidine (900–1350 mg/24 h) via PN, N = 4
Continuous infusion of cimetidine via PN resulted in steady-state serum concentrations of 0.6–1.0 mg/L
No precipitates noted and no apparent adverse consequence
Drug stability not evaluated
Gastric pH to evaluate efficacy not performed
Rosenberg, 1980154 and Yuhas, 1981155
In vitro Cimetidine To document the physicochemical stability of cimetidine in a number of parenteral solutions for 24, 48, 72, 168 h at room temperature
At 120 mg/100 mL and 500 mg/100 mL, cimetidine visually compatible and chemically stable with each intravenous fluid.
Evaluated dextrose solutions and amino acid solutions individually as well as admixed with or without micronutrients
(continued)
Table 15. (continued)
at SAINT FRANCIS HOSPITAL on March 13, 2015pen.sagepub.comDownloaded from
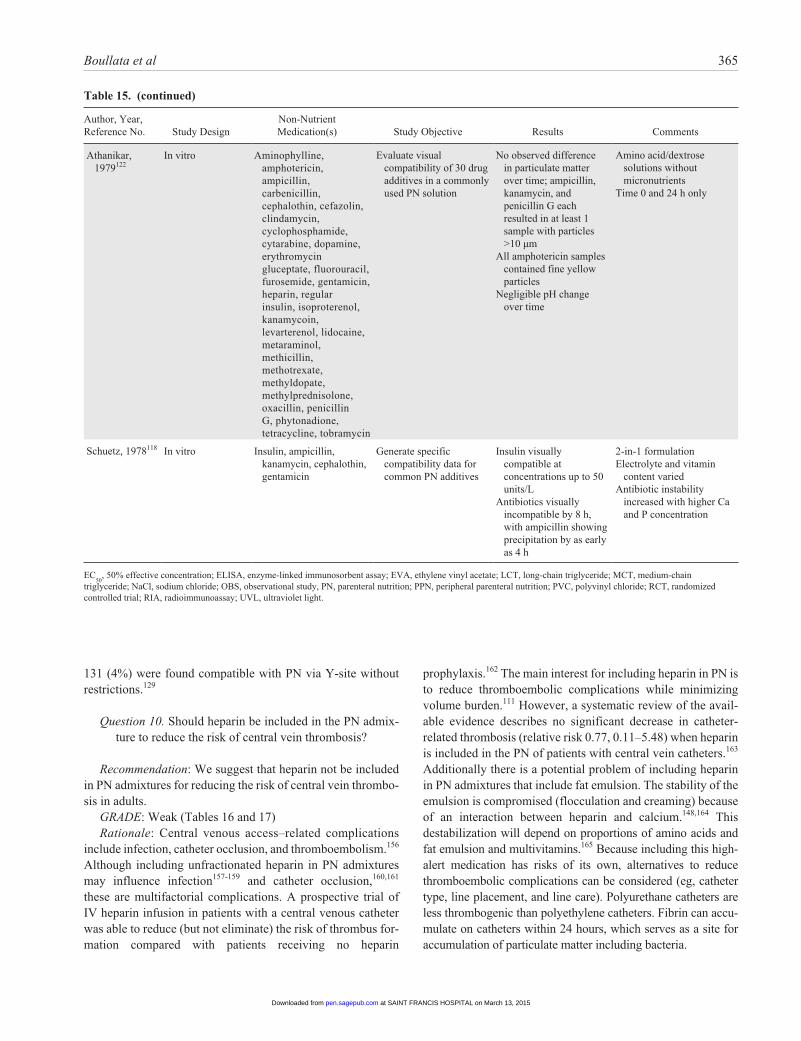
Boullata et al 365
Author, Year, Reference No. Study Design
Non-Nutrient Medication(s) Study Objective Results Comments
Athanikar, 1979122
In vitro Aminophylline, amphotericin, ampicillin, carbenicillin, cephalothin, cefazolin, clindamycin, cyclophosphamide, cytarabine, dopamine, erythromycin gluceptate, fluorouracil, furosemide, gentamicin, heparin, regular insulin, isoproterenol, kanamycoin, levarterenol, lidocaine, metaraminol, methicillin, methotrexate, methyldopate, methylprednisolone, oxacillin, penicillin G, phytonadione, tetracycline, tobramycin
Evaluate visual compatibility of 30 drug additives in a commonly used PN solution
No observed difference in particulate matter over time; ampicillin, kanamycin, and penicillin G each resulted in at least 1 sample with particles >10 µm
All amphotericin samples contained fine yellow particles
Negligible pH change over time
Amino acid/dextrose solutions without micronutrients
Time 0 and 24 h only
Schuetz, 1978118 In vitro Insulin, ampicillin, kanamycin, cephalothin, gentamicin
Generate specific compatibility data for common PN additives
Insulin visually compatible at concentrations up to 50 units/L
Antibiotics visually incompatible by 8 h, with ampicillin showing precipitation by as early as 4 h
2-in-1 formulationElectrolyte and vitamin
content variedAntibiotic instability
increased with higher Ca and P concentration
EC50
, 50% effective concentration; ELISA, enzyme-linked immunosorbent assay; EVA, ethylene vinyl acetate; LCT, long-chain triglyceride; MCT, medium-chain triglyceride; NaCl, sodium chloride; OBS, observational study, PN, parenteral nutrition; PPN, peripheral parenteral nutrition; PVC, polyvinyl chloride; RCT, randomized controlled trial; RIA, radioimmunoassay; UVL, ultraviolet light.
Table 15. (continued)
131 (4%) were found compatible with PN via Y-site without restrictions.129
Question 10. Should heparin be included in the PN admix-ture to reduce the risk of central vein thrombosis?
Recommendation: We suggest that heparin not be included in PN admixtures for reducing the risk of central vein thrombo-sis in adults.
GRADE: Weak (Tables 16 and 17)Rationale: Central venous access–related complications
include infection, catheter occlusion, and thromboembolism.156 Although including unfractionated heparin in PN admixtures may influence infection157-159 and catheter occlusion,160,161 these are multifactorial complications. A prospective trial of IV heparin infusion in patients with a central venous catheter was able to reduce (but not eliminate) the risk of thrombus for-mation compared with patients receiving no heparin
prophylaxis.162 The main interest for including heparin in PN is to reduce thromboembolic complications while minimizing volume burden.111 However, a systematic review of the avail-able evidence describes no significant decrease in catheter-related thrombosis (relative risk 0.77, 0.11–5.48) when heparin is included in the PN of patients with central vein catheters.163 Additionally there is a potential problem of including heparin in PN admixtures that include fat emulsion. The stability of the emulsion is compromised (flocculation and creaming) because of an interaction between heparin and calcium.148,164 This destabilization will depend on proportions of amino acids and fat emulsion and multivitamins.165 Because including this high-alert medication has risks of its own, alternatives to reduce thromboembolic complications can be considered (eg, catheter type, line placement, and line care). Polyurethane catheters are less thrombogenic than polyethylene catheters. Fibrin can accu-mulate on catheters within 24 hours, which serves as a site for accumulation of particulate matter including bacteria.
at SAINT FRANCIS HOSPITAL on March 13, 2015pen.sagepub.comDownloaded from
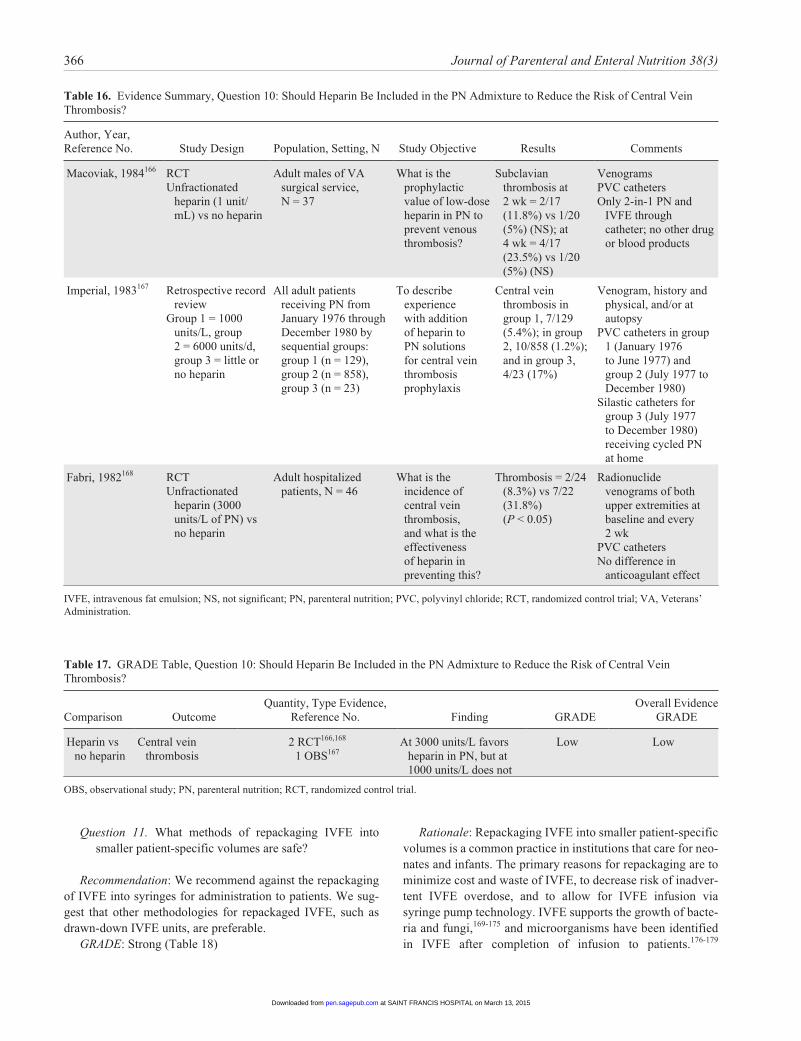
366 Journal of Parenteral and Enteral Nutrition 38(3)
Question 11. What methods of repackaging IVFE into smaller patient-specific volumes are safe?
Recommendation: We recommend against the repackaging of IVFE into syringes for administration to patients. We sug-gest that other methodologies for repackaged IVFE, such as drawn-down IVFE units, are preferable.
GRADE: Strong (Table 18)
Rationale: Repackaging IVFE into smaller patient-specific volumes is a common practice in institutions that care for neo-nates and infants. The primary reasons for repackaging are to minimize cost and waste of IVFE, to decrease risk of inadver-tent IVFE overdose, and to allow for IVFE infusion via syringe pump technology. IVFE supports the growth of bacte-ria and fungi,169-175 and microorganisms have been identified in IVFE after completion of infusion to patients.176-179
Table 16. Evidence Summary, Question 10: Should Heparin Be Included in the PN Admixture to Reduce the Risk of Central Vein Thrombosis?
Author, Year, Reference No. Study Design Population, Setting, N Study Objective Results Comments
Macoviak, 1984166 RCTUnfractionated
heparin (1 unit/mL) vs no heparin
Adult males of VA surgical service, N = 37
What is the prophylactic value of low-dose heparin in PN to prevent venous thrombosis?
Subclavian thrombosis at 2 wk = 2/17 (11.8%) vs 1/20 (5%) (NS); at 4 wk = 4/17 (23.5%) vs 1/20 (5%) (NS)
VenogramsPVC catheters Only 2-in-1 PN and
IVFE through catheter; no other drug or blood products
Imperial, 1983167 Retrospective record review
Group 1 = 1000 units/L, group 2 = 6000 units/d, group 3 = little or no heparin
All adult patients receiving PN from January 1976 through December 1980 by sequential groups: group 1 (n = 129), group 2 (n = 858), group 3 (n = 23)
To describe experience with addition of heparin to PN solutions for central vein thrombosis prophylaxis
Central vein thrombosis in group 1, 7/129 (5.4%); in group 2, 10/858 (1.2%); and in group 3, 4/23 (17%)
Venogram, history and physical, and/or at autopsy
PVC catheters in group 1 (January 1976 to June 1977) and group 2 (July 1977 to December 1980)
Silastic catheters for group 3 (July 1977 to December 1980) receiving cycled PN at home
Fabri, 1982168 RCTUnfractionated
heparin (3000 units/L of PN) vs no heparin
Adult hospitalized patients, N = 46
What is the incidence of central vein thrombosis, and what is the effectiveness of heparin in preventing this?
Thrombosis = 2/24 (8.3%) vs 7/22 (31.8%) (P < 0.05)
Radionuclide venograms of both upper extremities at baseline and every 2 wk
PVC catheters No difference in
anticoagulant effect
IVFE, intravenous fat emulsion; NS, not significant; PN, parenteral nutrition; PVC, polyvinyl chloride; RCT, randomized control trial; VA, Veterans’ Administration.
Table 17. GRADE Table, Question 10: Should Heparin Be Included in the PN Admixture to Reduce the Risk of Central Vein Thrombosis?
Comparison OutcomeQuantity, Type Evidence,
Reference No. Finding GRADEOverall Evidence
GRADE
Heparin vs no heparin
Central vein thrombosis
2 RCT166,168
1 OBS167At 3000 units/L favors
heparin in PN, but at 1000 units/L does not
Low Low
OBS, observational study; PN, parenteral nutrition; RCT, randomized control trial.
at SAINT FRANCIS HOSPITAL on March 13, 2015pen.sagepub.comDownloaded from
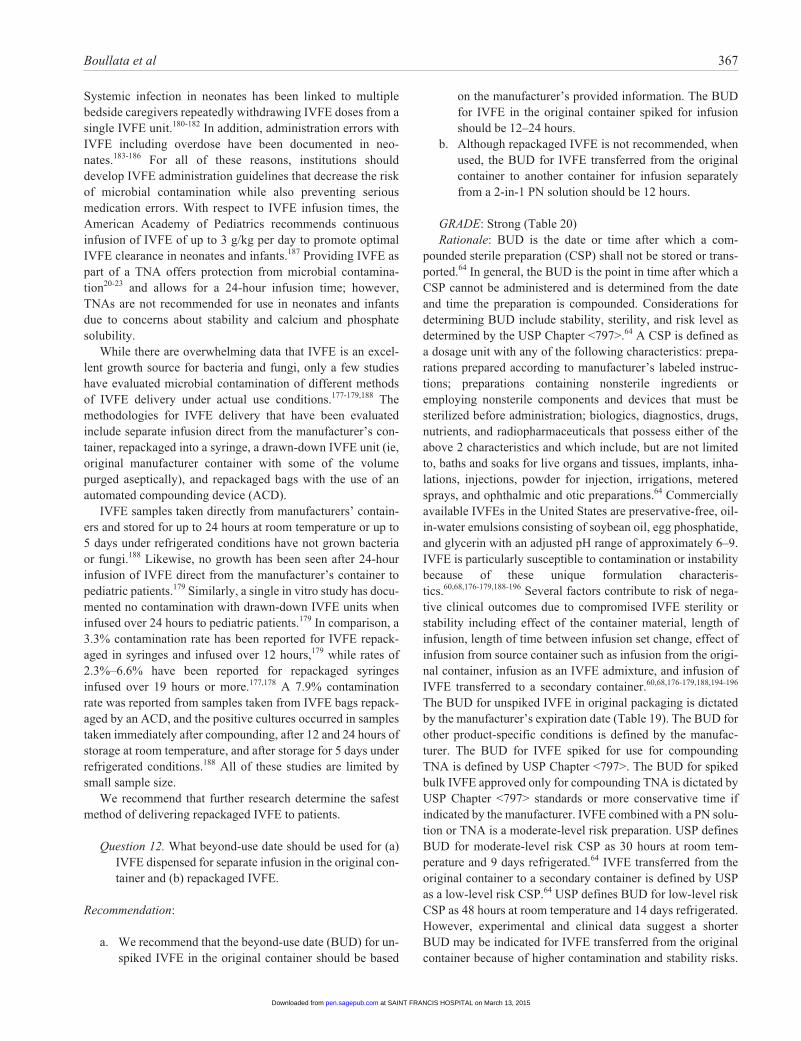
Boullata et al 367
Systemic infection in neonates has been linked to multiple bedside caregivers repeatedly withdrawing IVFE doses from a single IVFE unit.180-182 In addition, administration errors with IVFE including overdose have been documented in neo-nates.183-186 For all of these reasons, institutions should develop IVFE administration guidelines that decrease the risk of microbial contamination while also preventing serious medication errors. With respect to IVFE infusion times, the American Academy of Pediatrics recommends continuous infusion of IVFE of up to 3 g/kg per day to promote optimal IVFE clearance in neonates and infants.187 Providing IVFE as part of a TNA offers protection from microbial contamina-tion20-23 and allows for a 24-hour infusion time; however, TNAs are not recommended for use in neonates and infants due to concerns about stability and calcium and phosphate solubility.
While there are overwhelming data that IVFE is an excel-lent growth source for bacteria and fungi, only a few studies have evaluated microbial contamination of different methods of IVFE delivery under actual use conditions.177-179,188 The methodologies for IVFE delivery that have been evaluated include separate infusion direct from the manufacturer’s con-tainer, repackaged into a syringe, a drawn-down IVFE unit (ie, original manufacturer container with some of the volume purged aseptically), and repackaged bags with the use of an automated compounding device (ACD).
IVFE samples taken directly from manufacturers’ contain-ers and stored for up to 24 hours at room temperature or up to 5 days under refrigerated conditions have not grown bacteria or fungi.188 Likewise, no growth has been seen after 24-hour infusion of IVFE direct from the manufacturer’s container to pediatric patients.179 Similarly, a single in vitro study has docu-mented no contamination with drawn-down IVFE units when infused over 24 hours to pediatric patients.179 In comparison, a 3.3% contamination rate has been reported for IVFE repack-aged in syringes and infused over 12 hours,179 while rates of 2.3%–6.6% have been reported for repackaged syringes infused over 19 hours or more.177,178 A 7.9% contamination rate was reported from samples taken from IVFE bags repack-aged by an ACD, and the positive cultures occurred in samples taken immediately after compounding, after 12 and 24 hours of storage at room temperature, and after storage for 5 days under refrigerated conditions.188 All of these studies are limited by small sample size.
We recommend that further research determine the safest method of delivering repackaged IVFE to patients.
Question 12. What beyond-use date should be used for (a) IVFE dispensed for separate infusion in the original con-tainer and (b) repackaged IVFE.
Recommendation:
a. We recommend that the beyond-use date (BUD) for un-spiked IVFE in the original container should be based
on the manufacturer’s provided information. The BUD for IVFE in the original container spiked for infusion should be 12–24 hours.
b. Although repackaged IVFE is not recommended, when used, the BUD for IVFE transferred from the original container to another container for infusion separately from a 2-in-1 PN solution should be 12 hours.
GRADE: Strong (Table 20)Rationale: BUD is the date or time after which a com-
pounded sterile preparation (CSP) shall not be stored or trans-ported.64 In general, the BUD is the point in time after which a CSP cannot be administered and is determined from the date and time the preparation is compounded. Considerations for determining BUD include stability, sterility, and risk level as determined by the USP Chapter <797>.64 A CSP is defined as a dosage unit with any of the following characteristics: prepa-rations prepared according to manufacturer’s labeled instruc-tions; preparations containing nonsterile ingredients or employing nonsterile components and devices that must be sterilized before administration; biologics, diagnostics, drugs, nutrients, and radiopharmaceuticals that possess either of the above 2 characteristics and which include, but are not limited to, baths and soaks for live organs and tissues, implants, inha-lations, injections, powder for injection, irrigations, metered sprays, and ophthalmic and otic preparations.64 Commercially available IVFEs in the United States are preservative-free, oil-in-water emulsions consisting of soybean oil, egg phosphatide, and glycerin with an adjusted pH range of approximately 6–9. IVFE is particularly susceptible to contamination or instability because of these unique formulation characteris-tics.60,68,176-179,188-196 Several factors contribute to risk of nega-tive clinical outcomes due to compromised IVFE sterility or stability including effect of the container material, length of infusion, length of time between infusion set change, effect of infusion from source container such as infusion from the origi-nal container, infusion as an IVFE admixture, and infusion of IVFE transferred to a secondary container.60,68,176-179,188,194-196 The BUD for unspiked IVFE in original packaging is dictated by the manufacturer’s expiration date (Table 19). The BUD for other product-specific conditions is defined by the manufac-turer. The BUD for IVFE spiked for use for compounding TNA is defined by USP Chapter <797>. The BUD for spiked bulk IVFE approved only for compounding TNA is dictated by USP Chapter <797> standards or more conservative time if indicated by the manufacturer. IVFE combined with a PN solu-tion or TNA is a moderate-level risk preparation. USP defines BUD for moderate-level risk CSP as 30 hours at room tem-perature and 9 days refrigerated.64 IVFE transferred from the original container to a secondary container is defined by USP as a low-level risk CSP.64 USP defines BUD for low-level risk CSP as 48 hours at room temperature and 14 days refrigerated. However, experimental and clinical data suggest a shorter BUD may be indicated for IVFE transferred from the original container because of higher contamination and stability risks.
at SAINT FRANCIS HOSPITAL on March 13, 2015pen.sagepub.comDownloaded from
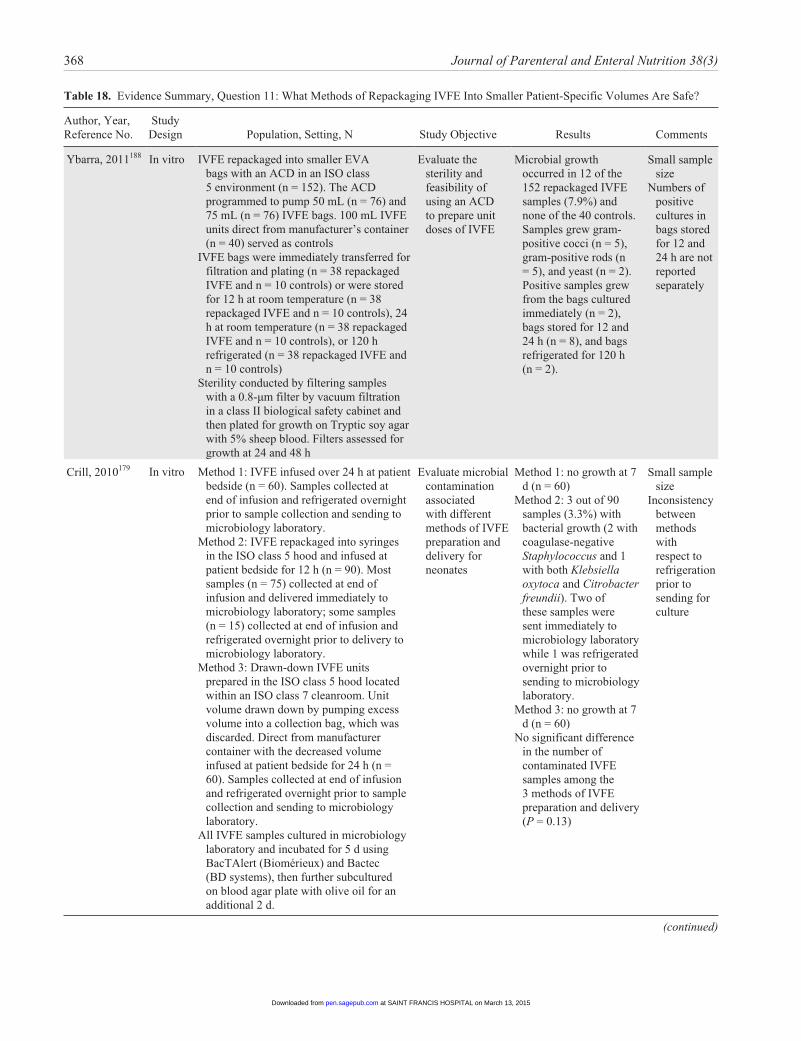
368 Journal of Parenteral and Enteral Nutrition 38(3)
Table 18. Evidence Summary, Question 11: What Methods of Repackaging IVFE Into Smaller Patient-Specific Volumes Are Safe?
Author, Year, Reference No.
Study Design Population, Setting, N Study Objective Results Comments
Ybarra, 2011188 In vitro IVFE repackaged into smaller EVA bags with an ACD in an ISO class 5 environment (n = 152). The ACD programmed to pump 50 mL (n = 76) and 75 mL (n = 76) IVFE bags. 100 mL IVFE units direct from manufacturer’s container (n = 40) served as controls
IVFE bags were immediately transferred for filtration and plating (n = 38 repackaged IVFE and n = 10 controls) or were stored for 12 h at room temperature (n = 38 repackaged IVFE and n = 10 controls), 24 h at room temperature (n = 38 repackaged IVFE and n = 10 controls), or 120 h refrigerated (n = 38 repackaged IVFE and n = 10 controls)
Sterility conducted by filtering samples with a 0.8-µm filter by vacuum filtration in a class II biological safety cabinet and then plated for growth on Tryptic soy agar with 5% sheep blood. Filters assessed for growth at 24 and 48 h
Evaluate the sterility and feasibility of using an ACD to prepare unit doses of IVFE
Microbial growth occurred in 12 of the 152 repackaged IVFE samples (7.9%) and none of the 40 controls. Samples grew gram-positive cocci (n = 5), gram-positive rods (n = 5), and yeast (n = 2). Positive samples grew from the bags cultured immediately (n = 2), bags stored for 12 and 24 h (n = 8), and bags refrigerated for 120 h (n = 2).
Small sample size
Numbers of positive cultures in bags stored for 12 and 24 h are not reported separately
Crill, 2010179 In vitro Method 1: IVFE infused over 24 h at patient bedside (n = 60). Samples collected at end of infusion and refrigerated overnight prior to sample collection and sending to microbiology laboratory.
Method 2: IVFE repackaged into syringes in the ISO class 5 hood and infused at patient bedside for 12 h (n = 90). Most samples (n = 75) collected at end of infusion and delivered immediately to microbiology laboratory; some samples (n = 15) collected at end of infusion and refrigerated overnight prior to delivery to microbiology laboratory.
Method 3: Drawn-down IVFE units prepared in the ISO class 5 hood located within an ISO class 7 cleanroom. Unit volume drawn down by pumping excess volume into a collection bag, which was discarded. Direct from manufacturer container with the decreased volume infused at patient bedside for 24 h (n = 60). Samples collected at end of infusion and refrigerated overnight prior to sample collection and sending to microbiology laboratory.
All IVFE samples cultured in microbiology laboratory and incubated for 5 d using BacTAlert (Biomérieux) and Bactec (BD systems), then further subcultured on blood agar plate with olive oil for an additional 2 d.
Evaluate microbial contamination associated with different methods of IVFE preparation and delivery for neonates
Method 1: no growth at 7 d (n = 60)
Method 2: 3 out of 90 samples (3.3%) with bacterial growth (2 with coagulase-negative Staphylococcus and 1 with both Klebsiella oxytoca and Citrobacter freundii). Two of these samples were sent immediately to microbiology laboratory while 1 was refrigerated overnight prior to sending to microbiology laboratory.
Method 3: no growth at 7 d (n = 60)
No significant difference in the number of contaminated IVFE samples among the 3 methods of IVFE preparation and delivery (P = 0.13)
Small sample size
Inconsistency between methods with respect to refrigeration prior to sending for culture
(continued)
at SAINT FRANCIS HOSPITAL on March 13, 2015pen.sagepub.comDownloaded from
Boullata et al 369
Table 18. (continued)
Author, Year, Reference No.
Study Design Population, Setting, N Study Objective Results Comments
Reiter, 2004178 In vitro IVFE repackaged into syringes and infused at patient (newborn infants) bedside over 19–23 h with 24 h IV administration set replacement (n = 90). Samples (1–3 mL) were aspirated prior to the IV tubing change from the syringe and IV tubing via the catheter connection site proximal to the patient.
All IVFE samples cultured using Bactec (BD System). Culture bottles were inoculated at bedside and delivered to the microbiology laboratory.
Evaluate the effect of a 24-h tubing set replacement policy on the contamination rate of repackaged IVFE
Two samples excluded as they were from a single patient with untreated Staphylococcus aureus conjunctivitis that had disseminated to blood and urine
2 out of 88 samples (2.27%) grew coagulase-negative Staphylococcus. Both of these samples were taken from the same patient on consecutive days.
Small sample size
Samples withdrawn from catheter connection site, so samples contained a mix of IVFE from tubing and from syringe
Reiter, 2002177 In vitro Group 1: syringes (n = 30) containing 5 mL of IVFE sent to microbiology laboratory immediately after repackaging under sterile conditions in the pharmacy. Samples cultured at 0 h (n = 30) and 24 h (n = 30).
Group 2: 3–5 mL IVFE remaining in syringes after 20 h infusion via syringe pump at patient (NICU) bedside (n = 30). Samples cultured at end of 20 h infusion (generally 30–35 h after syringe preparation in the pharmacy).
All IVFE samples cultured for aerobic and anaerobic bacteria in microbiology laboratory using direct inoculation into broth as well as cultured on agar plates. Samples cultured by using 3 media (MacConkey agar, blood agar, thioglycolate broth).
Determine the sterility of 20% IVFE after transfer to plastic syringes for use with a syringe pump
All 90 samples (60 from group 1 and 30 from group 2) were negative for bacterial growth at 24 and 48 h
3 out of 90 samples (3.3%) grew gram-positive rods at 7 d. The positive samples were as follows:
Group 1: 1/60 samples (1.7%)
Group 2: 2/30 samples (6.6%)
Small sample size
ACD, automated compounding device; EVA, ethylene vinyl acetate; ISO, International Organization for Standardization; IV, intravenous; IVFE, intravenous fat emulsion; NICU, neonatal intensive care unit.
Table 19. BUD Considerations for IVFE in the Original Container.2-7
IVFE Product BUD
Intralipid 20% and 30% bulk (Fresenius Kabi; bag)
Once the closure is penetrated, the contents should be dispensed as soon as possible; the transfer of contents to suitable PN admixture containers must be completed within 4 h of closure penetration. The bag should be stored below 25°C (77°F) after the closure has been entered.
Liposyn III 30% bulk (Hospira; glass container)
Maximum time of 4 h from transfer set pin or implement insertion is permitted to complete transfer operations (ie, discard container no later than 4 h after initial closure puncture)
Intralipid 20% single dose (Fresenius Kabi; bag)
TNA should be used promptly with storage under refrigeration (2°C–8°C) not to exceed 24 h and must be completely used within 24 h after removal from refrigeration
Liposyn III 20% single dose (Hospira; glass container)
Once the outlet site has been entered, the withdrawal of container contents should be completed promptly in one continuous operation. Should this be not possible, a maximum time of 4 h from transfer set pin or implement insertion is permitted to complete fluid transfer operations (ie, discard container no later than 4 h after initial closure puncture).
Intralipid 20%, 30% after removal from the overpouch (Fresenius Kabi)
Storage for up to 72 h for unspiked and unopened Intralipid solution in the Excel container with respect to no significant peroxide formation
BUD, beyond-use date; IVFE, intravenous fat emulsion; PN, parenteral nutrition; TNA, total nutrient admixture.
at SAINT FRANCIS HOSPITAL on March 13, 2015pen.sagepub.comDownloaded from
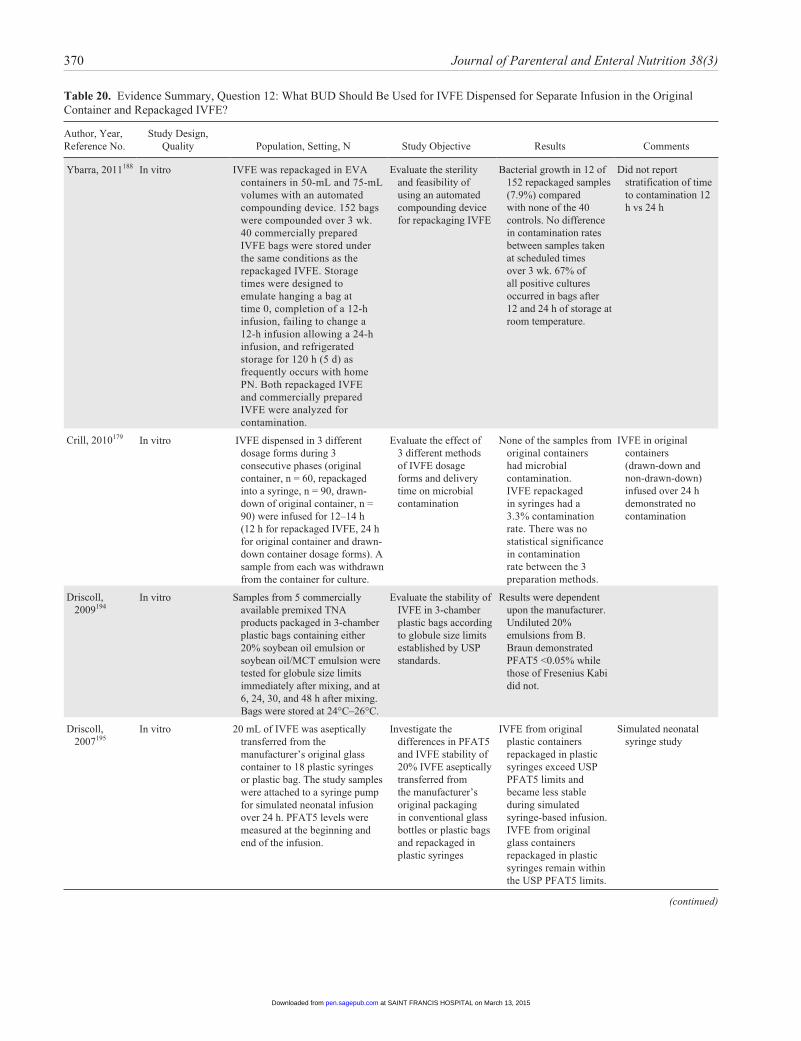
370 Journal of Parenteral and Enteral Nutrition 38(3)
Table 20. Evidence Summary, Question 12: What BUD Should Be Used for IVFE Dispensed for Separate Infusion in the Original Container and Repackaged IVFE?
Author, Year, Reference No.
Study Design, Quality Population, Setting, N Study Objective Results Comments
Ybarra, 2011188 In vitro IVFE was repackaged in EVA containers in 50-mL and 75-mL volumes with an automated compounding device. 152 bags were compounded over 3 wk. 40 commercially prepared IVFE bags were stored under the same conditions as the repackaged IVFE. Storage times were designed to emulate hanging a bag at time 0, completion of a 12-h infusion, failing to change a 12-h infusion allowing a 24-h infusion, and refrigerated storage for 120 h (5 d) as frequently occurs with home PN. Both repackaged IVFE and commercially prepared IVFE were analyzed for contamination.
Evaluate the sterility and feasibility of using an automated compounding device for repackaging IVFE
Bacterial growth in 12 of 152 repackaged samples (7.9%) compared with none of the 40 controls. No difference in contamination rates between samples taken at scheduled times over 3 wk. 67% of all positive cultures occurred in bags after 12 and 24 h of storage at room temperature.
Did not report stratification of time to contamination 12 h vs 24 h
Crill, 2010179 In vitro IVFE dispensed in 3 different dosage forms during 3 consecutive phases (original container, n = 60, repackaged into a syringe, n = 90, drawn-down of original container, n = 90) were infused for 12–14 h (12 h for repackaged IVFE, 24 h for original container and drawn-down container dosage forms). A sample from each was withdrawn from the container for culture.
Evaluate the effect of 3 different methods of IVFE dosage forms and delivery time on microbial contamination
None of the samples from original containers had microbial contamination. IVFE repackaged in syringes had a 3.3% contamination rate. There was no statistical significance in contamination rate between the 3 preparation methods.
IVFE in original containers (drawn-down and non-drawn-down) infused over 24 h demonstrated no contamination
Driscoll, 2009194
In vitro Samples from 5 commercially available premixed TNA products packaged in 3-chamber plastic bags containing either 20% soybean oil emulsion or soybean oil/MCT emulsion were tested for globule size limits immediately after mixing, and at 6, 24, 30, and 48 h after mixing. Bags were stored at 24°C–26°C.
Evaluate the stability of IVFE in 3-chamber plastic bags according to globule size limits established by USP standards.
Results were dependent upon the manufacturer. Undiluted 20% emulsions from B. Braun demonstrated PFAT5 <0.05% while those of Fresenius Kabi did not.
Driscoll, 2007195
In vitro 20 mL of IVFE was aseptically transferred from the manufacturer’s original glass container to 18 plastic syringes or plastic bag. The study samples were attached to a syringe pump for simulated neonatal infusion over 24 h. PFAT5 levels were measured at the beginning and end of the infusion.
Investigate the differences in PFAT5 and IVFE stability of 20% IVFE aseptically transferred from the manufacturer’s original packaging in conventional glass bottles or plastic bags and repackaged in plastic syringes
IVFE from original plastic containers repackaged in plastic syringes exceed USP PFAT5 limits and became less stable during simulated syringe-based infusion. IVFE from original glass containers repackaged in plastic syringes remain within the USP PFAT5 limits.
Simulated neonatal syringe study
(continued)
at SAINT FRANCIS HOSPITAL on March 13, 2015pen.sagepub.comDownloaded from
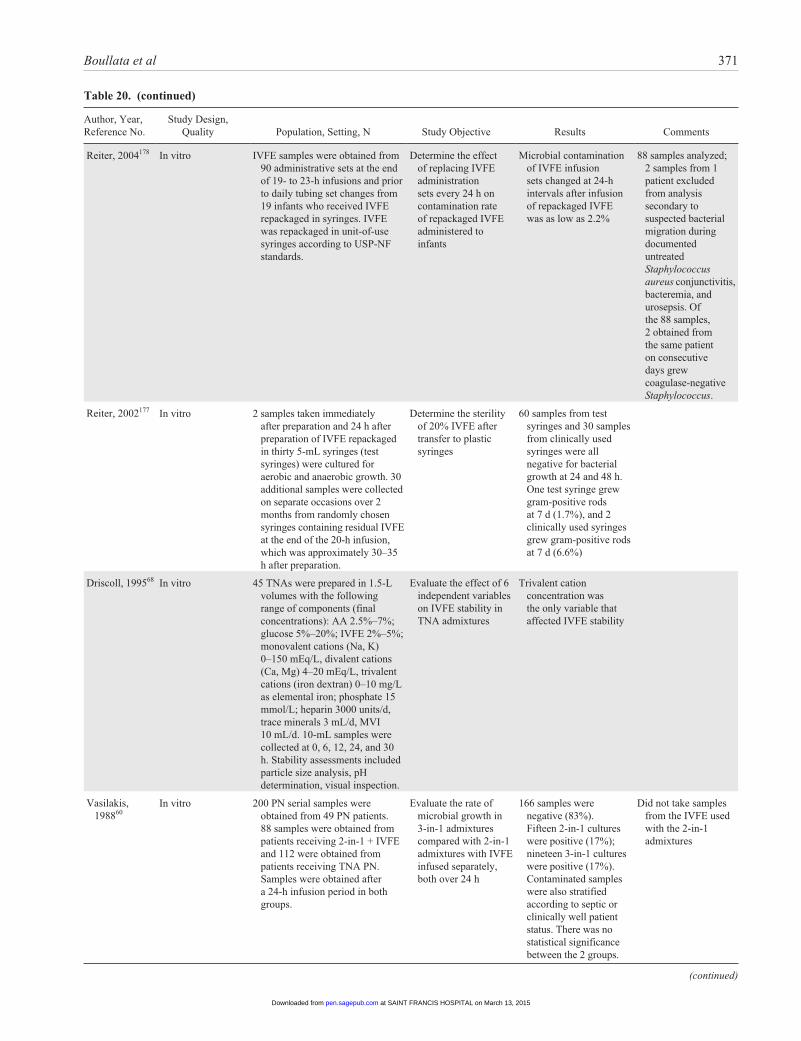
Boullata et al 371
Author, Year, Reference No.
Study Design, Quality Population, Setting, N Study Objective Results Comments
Reiter, 2004178 In vitro IVFE samples were obtained from 90 administrative sets at the end of 19- to 23-h infusions and prior to daily tubing set changes from 19 infants who received IVFE repackaged in syringes. IVFE was repackaged in unit-of-use syringes according to USP-NF standards.
Determine the effect of replacing IVFE administration sets every 24 h on contamination rate of repackaged IVFE administered to infants
Microbial contamination of IVFE infusion sets changed at 24-h intervals after infusion of repackaged IVFE was as low as 2.2%
88 samples analyzed; 2 samples from 1 patient excluded from analysis secondary to suspected bacterial migration during documented untreated Staphylococcus aureus conjunctivitis, bacteremia, and urosepsis. Of the 88 samples, 2 obtained from the same patient on consecutive days grew coagulase-negative Staphylococcus.
Reiter, 2002177 In vitro 2 samples taken immediately after preparation and 24 h after preparation of IVFE repackaged in thirty 5-mL syringes (test syringes) were cultured for aerobic and anaerobic growth. 30 additional samples were collected on separate occasions over 2 months from randomly chosen syringes containing residual IVFE at the end of the 20-h infusion, which was approximately 30–35 h after preparation.
Determine the sterility of 20% IVFE after transfer to plastic syringes
60 samples from test syringes and 30 samples from clinically used syringes were all negative for bacterial growth at 24 and 48 h. One test syringe grew gram-positive rods at 7 d (1.7%), and 2 clinically used syringes grew gram-positive rods at 7 d (6.6%)
Driscoll, 199568 In vitro 45 TNAs were prepared in 1.5-L volumes with the following range of components (final concentrations): AA 2.5%–7%; glucose 5%–20%; IVFE 2%–5%; monovalent cations (Na, K) 0–150 mEq/L, divalent cations (Ca, Mg) 4–20 mEq/L, trivalent cations (iron dextran) 0–10 mg/L as elemental iron; phosphate 15 mmol/L; heparin 3000 units/d, trace minerals 3 mL/d, MVI 10 mL/d. 10-mL samples were collected at 0, 6, 12, 24, and 30 h. Stability assessments included particle size analysis, pH determination, visual inspection.
Evaluate the effect of 6 independent variables on IVFE stability in TNA admixtures
Trivalent cation concentration was the only variable that affected IVFE stability
Vasilakis, 198860
In vitro 200 PN serial samples were obtained from 49 PN patients. 88 samples were obtained from patients receiving 2-in-1 + IVFE and 112 were obtained from patients receiving TNA PN. Samples were obtained after a 24-h infusion period in both groups.
Evaluate the rate of microbial growth in 3-in-1 admixtures compared with 2-in-1 admixtures with IVFE infused separately, both over 24 h
166 samples were negative (83%). Fifteen 2-in-1 cultures were positive (17%); nineteen 3-in-1 cultures were positive (17%). Contaminated samples were also stratified according to septic or clinically well patient status. There was no statistical significance between the 2 groups.
Did not take samples from the IVFE used with the 2-in-1 admixtures
(continued)
Table 20. (continued)
at SAINT FRANCIS HOSPITAL on March 13, 2015pen.sagepub.comDownloaded from
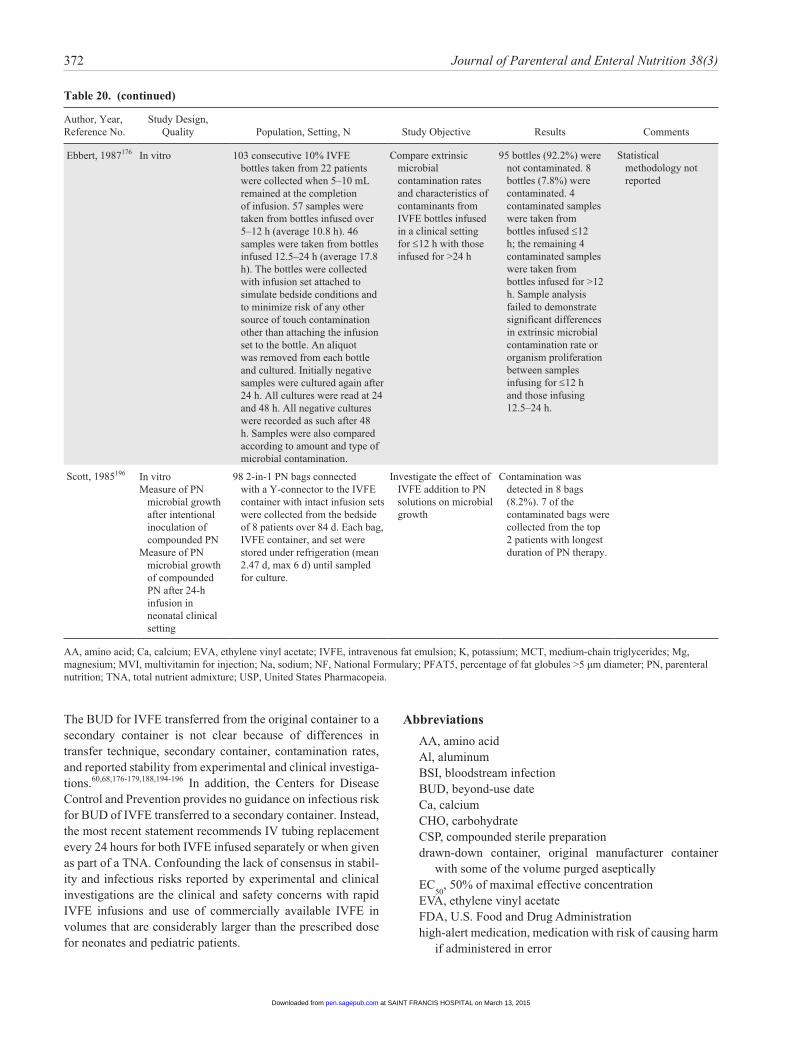
372 Journal of Parenteral and Enteral Nutrition 38(3)
Author, Year, Reference No.
Study Design, Quality Population, Setting, N Study Objective Results Comments
Ebbert, 1987176 In vitro 103 consecutive 10% IVFE bottles taken from 22 patients were collected when 5–10 mL remained at the completion of infusion. 57 samples were taken from bottles infused over 5–12 h (average 10.8 h). 46 samples were taken from bottles infused 12.5–24 h (average 17.8 h). The bottles were collected with infusion set attached to simulate bedside conditions and to minimize risk of any other source of touch contamination other than attaching the infusion set to the bottle. An aliquot was removed from each bottle and cultured. Initially negative samples were cultured again after 24 h. All cultures were read at 24 and 48 h. All negative cultures were recorded as such after 48 h. Samples were also compared according to amount and type of microbial contamination.
Compare extrinsic microbial contamination rates and characteristics of contaminants from IVFE bottles infused in a clinical setting for ≤12 h with those infused for >24 h
95 bottles (92.2%) were not contaminated. 8 bottles (7.8%) were contaminated. 4 contaminated samples were taken from bottles infused ≤12 h; the remaining 4 contaminated samples were taken from bottles infused for >12 h. Sample analysis failed to demonstrate significant differences in extrinsic microbial contamination rate or organism proliferation between samples infusing for ≤12 h and those infusing 12.5–24 h.
Statistical methodology not reported
Scott, 1985196 In vitroMeasure of PN
microbial growth after intentional inoculation of compounded PN
Measure of PN microbial growth of compounded PN after 24-h infusion in neonatal clinical setting
98 2-in-1 PN bags connected with a Y-connector to the IVFE container with intact infusion sets were collected from the bedside of 8 patients over 84 d. Each bag, IVFE container, and set were stored under refrigeration (mean 2.47 d, max 6 d) until sampled for culture.
Investigate the effect of IVFE addition to PN solutions on microbial growth
Contamination was detected in 8 bags (8.2%). 7 of the contaminated bags were collected from the top 2 patients with longest duration of PN therapy.
AA, amino acid; Ca, calcium; EVA, ethylene vinyl acetate; IVFE, intravenous fat emulsion; K, potassium; MCT, medium-chain triglycerides; Mg, magnesium; MVI, multivitamin for injection; Na, sodium; NF, National Formulary; PFAT5, percentage of fat globules >5 µm diameter; PN, parenteral nutrition; TNA, total nutrient admixture; USP, United States Pharmacopeia.
Table 20. (continued)
The BUD for IVFE transferred from the original container to a secondary container is not clear because of differences in transfer technique, secondary container, contamination rates, and reported stability from experimental and clinical investiga-tions.60,68,176-179,188,194-196 In addition, the Centers for Disease Control and Prevention provides no guidance on infectious risk for BUD of IVFE transferred to a secondary container. Instead, the most recent statement recommends IV tubing replacement every 24 hours for both IVFE infused separately or when given as part of a TNA. Confounding the lack of consensus in stabil-ity and infectious risks reported by experimental and clinical investigations are the clinical and safety concerns with rapid IVFE infusions and use of commercially available IVFE in volumes that are considerably larger than the prescribed dose for neonates and pediatric patients.
Abbreviations
AA, amino acidAl, aluminumBSI, bloodstream infectionBUD, beyond-use dateCa, calciumCHO, carbohydrateCSP, compounded sterile preparationdrawn-down container, original manufacturer container
with some of the volume purged asepticallyEC
50, 50% of maximal effective concentration
EVA, ethylene vinyl acetateFDA, U.S. Food and Drug Administrationhigh-alert medication, medication with risk of causing harm
if administered in error
at SAINT FRANCIS HOSPITAL on March 13, 2015pen.sagepub.comDownloaded from
Boullata et al 373
ISO, International Organization for StandardizationIVFE, intravenous fat emulsionK, potassiumLCT, long-chain triglycerideMCT, medium-chain triglycerideMg, magnesiumNa, sodiumOBS, observational studyOR, odds ratioP, phosphatePFAT5, percentage of fat globules >5 µm diameterPN, parenteral nutritionPPN, peripheral parenteral nutritionPVC, polyvinyl chlorideRCT, randomized control trialRR, risk ratioTE, trace elementTNA, total nutrient admixtureUSP, United States Pharmacopeia
Acknowledgments
This unfunded project was completed by authors and reviewers using their time as volunteers. The A.S.P.E.N. Board of Directors provided final approval.
A.S.P.E.N. Board of Directors
Ainsley Malone, MS, RD, CNSC; Daniel Teitelbaum, MD; Deborah A. Andris, MSN, APNP; Phil Ayers, PharmD, BCNSP, FASHP; Albert Baroccas, MD, FACS, FASPEN; Charlene Compher, PhD, RD, CNSC, LDN, FADA, FASPEN; Carol Ireton-Jones, PhD, RD, LD, CNSC; Tom Jaksic, MD, PhD; Lawrence A. Robinson, BS, MS, PharmD; Charles W. Van Way III, MD, FASPEN.
A.S.P.E.N. Clinical Guidelines Editorial Board
Charlene Compher, PhD, RD, CNSC, LDN, FADA, FASPEN; Nancy Allen, MS, MLS, RD; Joseph I. Boullata, PharmD, RPh, BCNSP; Carol L. Braunschweig, PhD, RD; Donald E. George, MD, Edwin Simpser, MD; Patricia A. Worthington, MSN, RN, CNSN.
References
1. Mirtallo JM. Consensus of parenteral nutrition safety issues and recom-mendations. JPEN J Parenter Enteral Nutr. 2012;36(2 suppl):62S.
2. Mirtallo J, Canada T, Johnson D, et al. Safe practices for parenteral nutri-tion. JPEN J Parenter Enteral Nutr. 2004;28(6):S39-S70.
3. Ayers P, Adams S, Boullata J, et al. A.S.P.E.N. parenteral nutrition safety consensus recommendations. JPEN J Parenter Enteral Nutr. 2014;38:doi:10.1177/0148607113511992.
4. Guidelines for use of total parenteral nutrition in the hospitalized adult patient. A.S.P.E.N. Board of Directors. JPEN J Parenter Enteral Nutr. 1986;10(5):441-445.
5. Guidelines for the use of parenteral and enteral nutrition in adult and pediatric patients. JPEN J Parenter Enteral Nutr. 2002; 26(1 suppl):1SA-138SA.
6. Mehta NM, Compher C. A.S.P.E.N. clinical guidelines: nutrition support of the critically ill child. JPEN J Parenter Enteral Nutr. 2009;33(3):260-276.
7. McClave SA, Martindale RG, Vanek VW, et al. Guidelines for the provi-sion and assessment of nutrition support therapy in the adult critically ill patient: Society of Critical Care Medicine (SCCM) and American Society for Parenteral and Enteral Nutrition (A.S.P.E.N.). JPEN J Parenter Enteral Nutr. 2009;33(3):277-316.
8. August DA, Huhmann MB. A.S.P.E.N. clinical guidelines: nutrition sup-port therapy during adult anticancer treatment and in hematopoietic cell transplantation. JPEN J Parenter Enteral Nutr. 2009;33(5):472-500.
9. Sabery N, Duggan C. A.S.P.E.N. clinical guidelines: nutrition support of children with human immunodeficiency virus infection. JPEN J Parenter Enteral Nutr. 2009;33(6):588-606.
10. Jesuit C, Dillon C, Compher C, Lenders CM. A.S.P.E.N. clinical guide-lines: nutrition support of hospitalized pediatric patients with obesity. JPEN J Parenter Enteral Nutr. 2010;34(1):13-20.
11. Jaksic T, Hull MA, Modi BP, Ching YA, George D, Compher C. A.S.P.E.N. clinical guidelines: nutrition support of neonates supported with extracorporeal membrane oxygenation. JPEN J Parenter Enteral Nutr. 2010;34(3):247-253.
12. Brown RO, Compher C. A.S.P.E.N. clinical guidelines: nutrition support in adult acute and chronic renal failure. JPEN J Parenter Enteral Nutr. 2010;34(4):366-377.
13. Mueller C, Compher C, Ellen DM. A.S.P.E.N. clinical guidelines: nutri-tion screening, assessment, and intervention in adults. JPEN J Parenter Enteral Nutr. 2011;35(1):16-24.
14. Arsenault D, Brenn M, Kim S, et al. A.S.P.E.N. Clinical guidelines: hyper-glycemia and hypoglycemia in the neonate receiving parenteral nutrition. JPEN J Parenter Enteral Nutr. 2012;36(1):81-95.
15. Fallon EM, Nehra D, Potemkin AK, et al. A.S.P.E.N. Clinical guidelines: nutrition support of neonatal patients at risk for necrotizing enterocolitis. JPEN J Parenter Enteral Nutr. 2012;36(5):506-523.
16. McMahon MM, Nystrom E, Braunschweig C, et al. A.S.P.E.N. clinical guidelines: nutrition support of adult patients with hyperglycemia. JPEN J Parenter Enteral Nutr. 2013;37(1):23-36.
17. Choban P, Dickerson R, Malone A, Worthington P, Compher C. A.S.P.E.N. clinical guidelines: nutrition support of hospitalized adult patients with obesity. JPEN J Parenter Enteral Nutr. 2013;37(6):714-744.
18. Balshem H, Helfand M, Schunemann HJ, et al. GRADE guidelines, 3: rating the quality of evidence. J Clin Epidemiol. 2011;64(4):401-406.
19. Guyatt GH, Oxman AD, Kunz R, et al. GRADE guidelines, 2: framing the question and deciding on important outcomes. J Clin Epidemiol. 2011;64(4):395-400.
20. Guyatt GH, Oxman AD, Vist G, et al. GRADE guidelines, 4: rating the quality of evidence—study limitations (risk of bias). J Clin Epidemiol. 2011;64(4):407-415.
21. Guyatt G, Oxman AD, Akl EA, et al. GRADE guidelines, 1: introduction—GRADE evidence profiles and summary of findings tables. J Clin Epidemiol. 2011;64(4):383-394.
22. Druyan ME, Compher C, Boullata JI, et al. Clinical guidelines for the use of parenteral and enteral nutrition in adult and pediatric patients: apply-ing the GRADE system to development of A.S.P.E.N. clinical guidelines. JPEN J Parenter Enteral Nutr. 2012;36(1):77-80.
23. Boitano M, Bojak S, McCloskey S, McCaul DS, McDonough M. Improving the safety and effectiveness of parenteral nutrition: results of a quality improvement collaboration. Nutr Clin Pract. 2010;25(6):663-671.
24. Scobie SD, Lawson M, Cavell G, Taylor K, Jackson SH, Roberts TE. Meeting the challenge of prescribing and administering medicines safely: structured teaching and assessment for final year medical students. Med Educ. 2003;37(5):434-437.
25. Naritoku DK, Faingold CL. Development of a therapeutics curriculum to enhance knowledge of fourth-year medical students about clinical uses and adverse effects of drugs. Teach Learn Med. 2009;21(2):148-152.
26. Tobaiqy M, McLay J, Ross S. Foundation year 1 doctors and clinical pharmacology and therapeutics teaching: a retrospective view in light of experience. Br J Clin Pharmacol. 2007;64(3):363-372.
27. Garbutt JM, Highstein G, Jeffe DB, Dunagan WC, Fraser VJ. Safe medi-cation prescribing: training and experience of medical students and hous-estaff at a large teaching hospital. Acad Med. 2005;80(6):594-599.
at SAINT FRANCIS HOSPITAL on March 13, 2015pen.sagepub.comDownloaded from
374 Journal of Parenteral and Enteral Nutrition 38(3)
28. Brown CL, Garrison NA, Hutchison AA. Error reduction when prescrib-ing neonatal parenteral nutrition. Am J Perinatol. 2007;24(7):417-427.
29. Mitchell KA, Jones EA, Meguid MM, Curtas S. Standardized TPN order form reduces staff time and potential for error. Nutrition. 1990;6(6):457-460.
30. Foulks CJ, Krenek G, Maxwell K. The effect of changing the total paren-teral nutrition order form on resident physician ordering behavior. Nutr Clin Pract. 1997;12(1):30-34.
31. Isaacs JW, Millikan WJ, Stackhouse J, Hersh T, Rudman D. Parenteral nutrition of adults with a 900 milliosmolar solution via peripheral veins. Am J Clin Nutr. 1977;30(4):552-559.
32. Hoheim DF, O’Callaghan TA, Joswiak BJ, Boysen DA, Bommarito AA. Clinical experience with three-in-one admixtures administered peripher-ally. Nutr Clin Pract. 1990;5(3):118-122.
33. Timmer JG, Schipper HG. Peripheral venous nutrition: the equal rel-evance of volume load and osmolarity in relation to phlebitis. Clin Nutr. 1991;10(2):71-75.
34. Williams N, Wales S, Irving MH. Prolonged peripheral parenteral nutrition with an ultrafine cannula and low-osmolality feed. Br J Surg. 1996;83(1):114-116.
35. Kane KF, Cologiovanni L, McKiernan J, et al. High osmolality feedings do not increase the incidence of thrombophlebitis during peripheral i.v. nutrition. JPEN J Parenter Enteral Nutr. 1996;20(3):194-197.
36. Daly JM, Masser E, Hansen L, Canham JE. Peripheral vein infusion of dextrose/amino acid solutions +/- 20% fat emulsion. JPEN J Parenter Enteral Nutr. 1985;9(3):296-299.
37. Bayer-Berger M, Chiolero R, Freeman J, Hirschi B. Incidence of phlebitis in peripheral parenteral nutrition: effect of the different nutrient solutions. Clin Nutr. 1989;8(4):181-186.
38. Gazitua R, Wilson K, Bistrian BR, Blackburn GL. Factors determin-ing peripheral vein tolerance to amino acid infusions. Arch Surg. 1979;114(8):897-900.
39. Pereira-da-Silva L, Costa A, Pereira L, et al. Early high calcium and phospho-rus intake by parenteral nutrition prevents short-term bone strength decline in preterm infants. J Pediatr Gastroenterol Nutr. 2011;52(2):203-209.
40. Schanler RJ, Shulman RJ, Prestridge LL. Parenteral nutrient needs of very low birth weight infants. J Pediatr. 1994;125(6 pt 1):961-968.
41. Prestridge LL, Schanler RJ, Shulman RJ, Burns PA, Laine LL. Effect of parenteral calcium and phosphorus therapy on mineral retention and bone mineral content in very low birth weight infants. J Pediatr. 1993;122(5 pt 1): 761-768.
42. Pelegano JF, Rowe JC, Carey DE, et al. Effect of calcium/phosphorus ratio on mineral retention in parenterally fed premature infants. J Pediatr Gastroenterol Nutr. 1991;12(3):351-355.
43. Aiken CG, Sherwood RA, Kenney IJ, Furnell M, Lenney W. Mineral balance studies in sick preterm intravenously fed infants during the first week after birth: a guide to fluid therapy. Acta Paediatr Scand Suppl. 1989;355:1-59.
44. Pelegano JF, Rowe JC, Carey DE, et al. Simultaneous infusion of calcium and phosphorus in parenteral nutrition for premature infants: use of physi-ologic calcium/phosphorus ratio. J Pediatr. 1989;114(1):115-119.
45. Koo WW, Tsang RC, Succop P, Krug-Wispe SK, Babcock D, Oestreich AE. Minimal vitamin D and high calcium and phosphorus needs of pre-term infants receiving parenteral nutrition. J Pediatr Gastroenterol Nutr. 1989;8(2):225-233.
46. Vileisis RA. Effect of phosphorus intake in total parenteral nutrition infusates in premature neonates. J Pediatr. 1987;110(4):586-590.
47. Koo WW, Tsang RC, Steichen JJ, et al. Parenteral nutrition for infants: effect of high versus low calcium and phosphorus content. J Pediatr Gastroenterol Nutr. 1987;6(1):96-104.
48. Aiken G, Lenney W. Calcium and phosphate content of intravenous feeding regimens for very low birthweight infants. Arch Dis Child. 1986;61(5):495-501.
49. Chessex P, Pineault M, Zebiche H, Ayotte RA. Calciuria in par-enterally fed preterm infants: role of phosphorus intake. J Pediatr. 1985;107(5):794-796.
50. Pontes-Arruda A, Dos Santos MC, Martins LF, et al. Influence of paren-teral nutrition delivery system on the development of bloodstream infec-tions in critically ill patients: an international, multicenter, prospective, open-label, controlled study—EPICOS study. JPEN J Parenter Enteral Nutr. 2012;36(5):574-586.
51. Mercaldi CJ, Reynolds MW, Turpin RS. Methods to identify and com-pare parenteral nutrition administered from hospital-compounded and premixed multichamber bags in a retrospective hospital claims database. JPEN J Parenter Enteral Nutr. 2012;36(3):330-336.
52. Lenclen R, Crauste-Manciet S, Narcy P, et al. Assessment of implementa-tion of a standardized parenteral formulation for early nutritional support of very preterm infants. Eur J Pediatr. 2006;165(8):512-518.
53. Krohn K, Babl J, Reiter K, Koletzko B. Parenteral nutrition with standard solutions in paediatric intensive care patients. Clin Nutr. 2005;24(2):274-280.
54. Yeung MY, Smyth JP, Maheshwari R, Shah S. Evaluation of standardized versus individualized total parenteral nutrition regime for neonates less than 33 weeks gestation. J Paediatr Child Health. 2003;39(8):613-617.
55. Hayes EM, Cohen KR, Pinard BE, Lauletta J, Ruggiero R. Standardized versus individually customized parenteral nutrition solutions: a compari-son of serum electrolyte values. P T. 2000;25(2):78-87.
56. Beecroft C, Martin H, Puntis JW. How often do parenteral nutrition prescriptions for the newborn need to be individualized? Clin Nutr. 1999;18(2):83-85.
57. Kochevar M, Guenter P, Holcombe B, et al. ASPEN statement on parenteral nutrition standardization. JPEN J Parenter Enteral Nutr. 2007;31(5):441-448.
58. British Pharmaceutical Nutrition Group. Position statement on the use of multi-chamber parenteral nutrition bags for use in adult patients. http://www .bpng.co.uk/pdf/BPNG_MCB-Bags_Position_Statement.pdf. Accessed 13 Dec 2013.
59. Miller SJ. Commercial premixed parenteral nutrition: is it right for your institution? Nutr Clin Pract. 2009;24(4):459-469.
60. Vasilakis A, Apelgren KN. Answering the fat emulsion contamination question: three in one admixture vs conventional total parenteral nutrition in a clinical setting. JPEN J Parenter Enteral Nutr. 1988;12(4):356-359.
61. Erdman SH, McElwee CL, Kramer JM, Zuppan CW, White JJ, Grill BB. Central line occlusion with three-in-one nutrition admixtures administered at home. JPEN J Parenter Enteral Nutr. 1994;18(2):177-181.
62. Solassol C, Joyeux H, Etco L, Pujol H, Romieu C. New techniques for long-term intravenous feeding: an artificial gut in 75 patients. Ann Surg. 1974;179(4):519-522.
63. Barnett MI, Cosslett AG, Duffield JR, Evans DA, Hall SB, Williams DR. Parenteral nutrition: pharmaceutical problems of compatibility and stabil-ity. Drug Saf. 1990;5(suppl 1):101-106.
64. USP <797> Guidebook to Pharmaceutical Compounding—Sterile Preparations. Rockville, MD: United States Pharmacopeia Convention; 2008.
65. Driscoll DF. Lipid injectable emulsions: pharmacopeial and safety issues. Pharm Res. 2006;23(9):1959-1969.
66. Driscoll DF. Examination of selection of light-scattering and light-obscu-ration acceptance criteria for lipid injectable emulsions. Pharm Forum. 2004;30(6):2244-2253.
67. Driscoll DF. Physicochemical assessment of total nutrient admixture sta-bility and safety: quantifying the risk. Nutrition. 1997;13(2):166-167.
68. Driscoll DF, Bhargava HN, Li L, Zaim RH, Babayan VK, Bistrian BR. Physicochemical stability of total nutrient admixtures. Am J Health Syst Pharm. 1995;52(6):623-634.
69. Brown R, Quercia RA, Sigman R. Total nutrient admixture: a review. JPEN J Parenter Enteral Nutr. 1986;10(6):650-658.
70. Hardy G, Puzovic M. Formulation, stability, and administration of parenteral nutrition with new lipid emulsions. Nutr Clin Pract. 2009;24(5):616-625.
71. Driscoll DF. Stability and compatibility assessment techniques for total parenteral nutrition admixtures: setting the bar according to pharmaco-peial standards. Curr Opin Clin Nutr Metab Care. 2005;8(3):297-303.
at SAINT FRANCIS HOSPITAL on March 13, 2015pen.sagepub.comDownloaded from
Boullata et al 375
72. Driscoll DF. Lipid injectable emulsions: 2006. Nutr Clin Pract. 2006;21(4):381-386.
73. Barat AC, Harrie K, Jacob M, Diamantidis TG, McIntosh NL. Effect of amino acid solutions on total nutrient admixture stability. JPEN J Parenter Enteral Nutr. 1987;11(4):384-388.
74. Sayeed FA, Johnson HW, Sukumaran KB, et al. Stability of Liposyn II fat emulsion in total nutrient admixtures. Am J Hosp Pharm. 1986;43(5):1230-1235.
75. Sayeed FA, Tripp MG, Sukumaran KB, Mikrut BA, Stelmach HA, Raihle JA. Stability of various total nutrient admixture for-mulations using Liposyn II and Aminosyn II. Am J Hosp Pharm. 1987;44(10):2280-2286.
76. Sayeed FA, Tripp MG, Sukumaran KB, Mikrut BA, Stelmach HA, Raihle JA. Stability of total nutrient admixtures using various intravenous fat emulsions. Am J Hosp Pharm. 1987;44(10):2271-2280.
77. Deitel M, Smith LC, Friedman KL, et al. Physical stability of a total nutrient admixture for total parenteral nutrition. Can J Surg. 1989;32(4):240-243.
78. Tripp MG, Menon SK, Mikrut BA. Stability of total nutrient admix-tures in a dual-chamber flexible container. Am J Hosp Pharm. 1990;47(11):2496-2503.
79. Deitel M, Friedman KL, Cunnane S, et al. Emulsion stability in a total nutrient admixture for total parenteral nutrition. J Am Coll Nutr. 1992;11(1):5-10.
80. Driscoll DF, Silvestri AP, Nehne J, Klutsch K, Bistrian BR, Niemann W. Physicochemical stability of highly concentrated total nutrient admixtures for fluid-restricted patients. Am J Health Syst Pharm. 2006;63(1):79-85.
81. MacKay M, Jackson D, Eggert L, Fitzgerald K, Cash J. Practice-based validation of calcium and phosphorus solubility limits for pediatric paren-teral nutrition solutions. Nutr Clin Pract. 2011;26(6):708-713.
82. Migaki EA, Melhart BJ, Dewar CJ, Huston RK. Calcium chloride and sodium phosphate in neonatal parenteral nutrition containing TrophAmine: precipitation studies and aluminum content. JPEN J Parenter Enteral Nutr. 2012;36(4):470-475.
83. Joy J, Silvestri AP, Franke R, et al. Calcium and phosphate compatibility in low-osmolarity parenteral nutrition admixtures intended for peripheral vein administration. JPEN J Parenter Enteral Nutr. 2010;34(1):46-54.
84. Singh H, Dumas GJ, Silvestri AP, et al. Physical compatibility of neonatal total parenteral nutrition admixtures containing organic calcium and inor-ganic phosphate salts in a simulated infusion at 37 degrees C. Pediatr Crit Care Med. 2009;10(2):213-216.
85. Parikh MJ, Dumas G, Silvestri A, Bistrian BR, Driscoll DF. Physical compatibility of neonatal total parenteral nutrient admixtures containing organic calcium and inorganic phosphate salts. Am J Health Syst Pharm. 2005;62(11):1177-1183.
86. MacKay MW, Fitzgerald KA, Jackson D. The solubility of calcium and phosphate in two specialty amino acid solutions. JPEN J Parenter Enteral Nutr. 1996;20(1):63-66.
87. Dunham B, Marcuard S, Khazanie PG, Meade G, Craft T, Nichols K. The solubility of calcium and phosphorus in neonatal total parenteral nutrition solutions. JPEN J Parenter Enteral Nutr. 1991;15(6):608-611.
88. Venkataraman PS, Brissie EO Jr, Tsang RC. Stability of calcium and phos-phorus in neonatal parenteral nutrition solutions. J Pediatr Gastroenterol Nutr. 1983;2(4):640-643.
89. Buchman AL, Neely M, Grossie VB Jr, Truong L, Lykissa E, Ahn C. Organ heavy-metal accumulation during parenteral nutrition is associated with pathologic abnormalities in rats. Nutrition. 2001;17(7-8):600-606.
90. Pluhator-Murton MM, Fedorak RN, Audette RJ, Marriage BJ, Yatscoff RW, Gramlich LM. Trace element contamination of total parenteral nutri-tion, 1: contribution of component solutions. JPEN J Parenter Enteral Nutr. 1999;23(4):222-227.
91. Pluhator-Murton MM, Fedorak RN, Audette RJ, Marriage BJ, Yatscoff RW, Gramlich LM. Trace element contamination of total parenteral nutrition, 2: effect of storage duration and temperature. JPEN J Parenter Enteral Nutr. 1999;23(4):228-232.
92. Kurkus J, Alcock NW, Shils ME. Manganese content of large-volume parenteral solutions and of nutrient additives. JPEN J Parenter Enteral Nutr. 1984;8(3):254-257.
93. Pluhator-Murton MM, Fedorak RN, Audette RJ, Marriage BJ, Yatscoff RW. Extent of trace-element contamination from simulated compound-ing of total parenteral nutrient solutions. Am J Health Syst Pharm. 1996;53(19):2299-2303.
94. Jetton MM, Sullivan JF, Burch RE. Trace element contamination of intravenous solutions. Arch Intern Med. 1976;136(7):782-784.
95. Leung FY, Grace DM, Alfieri MA, Bradley C. Abnormal trace elements in a patient on total parenteral nutrition with normal renal function. Clin Biochem. 1995;28(3):297-302.
96. Berner YN, Shuler TR, Nielsen FH, Flombaum C, Farkouh SA, Shike M. Selected ultratrace elements in total parenteral nutrition solutions. Am J Clin Nutr. 1989;50(5):1079-1083.
97. Speerhas RA, Seidner DL. Measured versus estimated aluminum content of parenteral nutrient solutions. Am J Health Syst Pharm. 2007;64(7):740-746.
98. Smith BS, Kothari H, Hayes BD, et al. Effect of additive selection on calculated aluminum content of parenteral nutrient solutions. Am J Health Syst Pharm. 2007;64(7):730-739.
99. Mouser JF, Hak EB, Helms RA, Christensen ML, Storm MC. Chromium and zinc concentrations in pediatric patients receiving long-term paren-teral nutrition. Am J Health Syst Pharm. 1999;56(19):1950-1956.
100. Hak EB, Storm MC, Helms RA. Chromium and zinc contamination of parenteral nutrient solution components commonly used in infants and children. Am J Health Syst Pharm. 1998;55(2):150-154.
101. Moukarzel AA, Song MK, Buchman AL, et al. Excessive chro-mium intake in children receiving total parenteral nutrition. Lancet. 1992;339(8790):385-388.
102. Ito Y, Alcock NW, Shils ME. Chromium content of total parenteral nutrition solutions. JPEN J Parenter Enteral Nutr. 1990;14(6):610-614.
103. Bohrer D, do Nascimento PC, Becker E, de Carvalho LM, Dessuy M. Arsenic species in solutions for parenteral nutrition. JPEN J Parenter Enteral Nutr. 2005;29(1):1-7.
104. Advenier E, Landry C, Colomb V, et al. Aluminum contamination of parenteral nutrition and aluminum loading in children on long-term parenteral nutrition. J Pediatr Gastroenterol Nutr. 2003;36(4): 448-453.
105. Bohrer D, do Nascimento PC, Binotto R, Becker E, Pomblum S. Contribution of the raw material to the aluminum contamination in par-enterals. JPEN J Parenter Enteral Nutr. 2002;26(6):382-388.
106. Popinska K, Kierkus J, Lyszkowska M, et al. Aluminum contamination of parenteral nutrition additives, amino acid solutions, and lipid emul-sions. Nutrition. 1999;15(9):683-686.
107. Koo WW, Kaplan LA, Horn J, Tsang RC, Steichen JJ. Aluminum in parenteral nutrition solution—sources and possible alternatives. JPEN J Parenter Enteral Nutr. 1986;10(6):591-595.
108. Smith JL, Goos SM. Selenium nutriture in total parenteral nutrition: intake levels. JPEN J Parenter Enteral Nutr. 1980;4(1):23-26.
109. Washington C. The stability of intravenous fat emulsions in total paren-teral nutrition mixtures. Int J Pharm. 1990;66(1-3):1-21.
110. Manning RJ, Washington C. Chemical stability of total parenteral nutri-tion mixtures. Int J Pharm. 1992;81(1):1-20.
111. Driscoll DF, Baptista RJ, Mitrano FP, Mascioli EA, Blackburn GL, Bistrian BR. Parenteral nutrient admixtures as drug vehicles: theory and practice in the critical care setting. DICP. 1991;25(3):276-283.
112. Boullata JI, Guenter P, Mirtallo JM. A parenteral nutrition use survey with gap analysis. JPEN J Parenter Enteral Nutr. 2013;37(2):212-222.
113. Lester LR, Crill CM, Hak EB. Should adding albumin to parenteral nutrient solutions be considered an unsafe practice? Am J Health Syst Pharm. 2006;63(17):1656-1661.
114. Driscoll DF, Baptista RJ, Bistrian BR, Blackburn GL. Practical con-siderations regarding the use of total nutrient admixtures. Am J Hosp Pharm. 1986;43(2):416-419.
at SAINT FRANCIS HOSPITAL on March 13, 2015pen.sagepub.comDownloaded from
376 Journal of Parenteral and Enteral Nutrition 38(3)
115. Johnson OL, Washington C, Davis SS, Schaupp K. The destabi-lization of parenteral feeding emulsions by heparin. Int J Pharm. 1989;53(3):237-240.
116. Silvers KM, Darlow BA, Winterbourn CC. Pharmacologic levels of heparin do not destabilize neonatal parenteral nutrition. JPEN J Parenter Enteral Nutr. 1998;22(5):311-314.
117. Niemiec PW Jr, Vanderveen TW. Compatibility considerations in par-enteral nutrient solutions. Am J Hosp Pharm. 1984;41(5):893-911.
118. Schuetz DH, King JC. Compatibility and stability of electrolytes, vita-mins and antibiotics in combination with 8% amino acids solution. Am J Hosp Pharm. 1978;35(1):33-44.
119. Driscoll DF, Lowell JA, Nompleggi D, Manji N, Lewis D, Bistrian BR. Continuous vs intermittent cimetidine infusion in critically ill hospitalized patients: role of TPN admixture as drug vehicle. Nutrition. 1990;6(5):383-388.
120. Baptista RJ, Palombo JD, Tahan SR, et al. Stability of cimetidine hydrochloride in a total nutrient admixture. Am J Hosp Pharm. 1985;42(10):2208-2210.
121. Baptista RJ, Dumas DJ, Bistrian BR, Condella F, Blackburn GL. Compatibility of total nutrient admixtures and secondary cardiovascular medications. Am J Hosp Pharm. 1985;42(4):777-778.
122. Athanikar N, Boyer B, Deamer R, et al. Visual compatibility of 30 additives with a parenteral nutrient solution. Am J Hosp Pharm. 1979;36(4):511-513.
123. Moore RA, Feldman S, Treuting J, Bloss R, Dudrick SJ. Cimetidine and parenteral nutrition. JPEN J Parenter Enteral Nutr. 1981;5(1):61-63.
124. Marcuard SP, Dunham B, Hobbs A, Caro JF. Availability of insulin from total parenteral nutrition solutions. JPEN J Parenter Enteral Nutr. 1990;14(3):262-264.
125. United States Pharmacopeia. USP general information chapter <729>: globule size distribution in lipid injectable emulsions. U.S. Pharmacopeia/National Formulary, edition 35/30. Rockville, MD: United States Pharmacopeial Convention, Inc; 2012.
126. Trissel LA, Gilbert DL, Martinez JF, Baker MB, Walter WV, Mirtallo JM. Compatibility of parenteral nutrient solutions with selected drugs during simulated Y-site administration. Am J Health Syst Pharm. 1997;54(11):1295-1300.
127. Trissel LA, Gilbert DL, Martinez JF, Baker MB, Walter WV, Mirtallo JM. Compatibility of medications with 3-in-1 parenteral nutrition admixtures. JPEN J Parenter Enteral Nutr. 1999;23(2):67-74.
128. Bouchoud L, Fonzo-Christe C, Klingmuller M, Bonnabry P. Compatibility of intravenous medications with parenteral nutrition: in vitro evaluation. JPEN J Parenter Enteral Nutr. 2013;37(3):416-424.
129. Kalikstad B, Skjerdal A, Hansen TW. Compatibility of drug infusions in the NICU. Arch Dis Child. 2010;95(9):745-748.
130. Gellis C, Sautou-Miranda V, Bleyzac N, Jarrige JF, Minet-Quinard R, Chopineau J. Continuous infusion of methylprednisolone via paediatric paren-teral nutrition: a pharmacokinetic animal study. Clin Nutr. 2007;26(4):491-497.
131. Christianson MA, Schwartz MW, Suzuki N. Determinants of insulin availability in parenteral nutrition solutions. JPEN J Parenter Enteral Nutr. 2006;30(1):6-9.
132. Rusavy Z, Sramek V, Suchat R, Lacigova S, Topolcan O. Effects of car-rier solution on insulin bioavailability. JPEN J Parenter Enteral Nutr. 2004;28(6):439-441.
133. Huynh-Delerme C, Penaud JF, Lacombe C, Brunhes A, Moriette G. Stability and biological activity of epoietin beta in parenteral nutrition solutions. Biol Neonate. 2002;81(3):158-162.
134. Gellis C, Sautou-Miranda V, Arvouet A, Vasson MP, Chopineau J. Stability of methylprednisolone sodium succinate in pediatric par-enteral nutrition mixtures. Am J Health Syst Pharm. 2001;58(12): 1139-1142.
135. Allwood MC, Martin HJ. Long-term stability of cimetidine in total par-enteral nutrition. J Clin Pharm Ther. 1996;21(1):19-21.
136. Hensrud DD, Burritt MF, Hall LG. Stability of heparin anticoagulant activity over time in parenteral nutrition solutions. JPEN J Parenter Enteral Nutr. 1996;20(3):219-221.
137. Matsui T, Motomura A, Arita M, Takeyama Y, Sakurai T, Yao T. Control of gastric pH with ranitidine in patients with Crohn’s disease receiving total parenteral nutrition: comparison of two intravenous regi-mens. J Gastroenterol. 1996;31(1):6-11.
138. Kirkham JC, Rutherford ET, Cunningham GN, Daneshmand KA, Falls AL. Stability of ondansetron hydrochloride in a total parenteral nutrient admixture. Am J Health Syst Pharm. 1995;52(14):1557-1558.
139. Ritchie DJ, Holstad SG, Westrich TJ, Hirsch JD, O’Dorisio TM. Activity of octreotide acetate in a total nutrient admixture. Am J Hosp Pharm. 1991;48(10):2172-2175.
140. Williams MF, Hak LJ, Dukes G. In vitro evaluation of the stability of ranitidine hydrochloride in total parenteral nutrient mixtures. Am J Hosp Pharm. 1990;47(7):1574-1579.
141. Bullock L, Fitzgerald JF, Glick MR, Parks RB, Schnabel JG, Hancock BG. Stability of famotidine 20 and 40 mg/L and amino acids in total par-enteral nutrient solutions. Am J Hosp Pharm. 1989;46(11):2321-2325.
142. Bullock L, Fitzgerald JF, Glick MR. Stability of famotidine 20 and 50 mg/L in total nutrient admixtures. Am J Hosp Pharm. 1989;46(11):2326-2329.
143. DiStefano JE, Mitrano FP, Baptista RJ, et al. Long-term stability of famotidine 20 mg/L in a total parenteral nutrient solution. Am J Hosp Pharm. 1989;46(11):2333-2335.
144. Montoro JB, Pou L, Salvador P, Pastor C, Cano SM. Stability of famoti-dine 20 and 40 mg/L in total nutrient admixtures. Am J Hosp Pharm. 1989;46(11):2329-2332.
145. Walker SE, Iazetta J, Lau DWC, Madorin PL. Famotidine stability in total parenteral nutrient solutions. Can J Hosp Pharm. 1989;42:97-103.
146. Cano SM, Montoro JB, Pastor C, Pou L, Sabin P. Stability of raniti-dine hydrochloride in total nutrient admixtures. Am J Hosp Pharm. 1988;45(5):1100-1102.
147. Pesko LJ, Arend KA, Hagman DE, et al. Physical compatibility and sta-bility of metoclopramide injection. Parenter. 1988;5:1-3.
148. Raupp P, von Kries R, Schmidt E, Pfahl HG, Gunther O. Incompatibility between fat emulsion and calcium plus heparin in parenteral nutrition of premature babies. Lancet. 1988;1(8587):700.
149. Underberg WJ, Koomen JM, Beijnen JH. Stability of famotidine in commonly used nutritional infusion fluids. J Parenter Sci Technol. 1988;42(3):94-97.
150. Bullock L, Parks RB, Lampasona V, Mullins RE. Stability of ranitidine hydrochloride and amino acids in parenteral nutrient solutions. Am J Hosp Pharm. 1985;42(12):2683-2687.
151. Walker SE, Bayliff CD. Stability of ranitidine hydrochloride in total par-enteral nutrient solution. Am J Hosp Pharm. 1985;42(3):590-592.
152. Niemiec PW Jr, Vanderveen TW, Hohenwarter MW, Gadsden RH Sr. Stability of aminophylline injection in three parenteral nutrient solu-tions. Am J Hosp Pharm. 1983;40(3):428-432.
153. Tsallas G, Allen LC. Stability of cimetidine hydrochloride in parenteral nutrition solutions. Am J Hosp Pharm. 1982;39(3):484-485.
154. Rosenberg HA, Dougherty JT, Mayron D, Baldinus JG. Cimetidine hydrochloride compatibility, I: chemical aspects and room tem-perature stability in intravenous infusion fluids. Am J Hosp Pharm. 1980;37(3):390-392.
155. Yuhas EM, Lofton FT, Mayron D, Baldinus JG, Rosenberg HA. Cimetidine hydrochloride compatibility, II: room temperature stability in intravenous infusion fluids. Am J Hosp Pharm. 1981;38(6):879-881.
156. Kakzanov V, Monagle P, Chan AK. Thromboembolism in infants and children with gastrointestinal failure receiving long-term parenteral nutrition. JPEN J Parenter Enteral Nutr. 2008;32(1):88-93.
157. Bailey MJ. Reduction of catheter-associated sepsis in parenteral nutrition using low-dose intravenous heparin. Br Med J. 1979;1(6179):1671-1673.
158. Kudsk KA, Powell C, Mirtallo JM, Fabri PJ, Ruberg RL. Heparin does not reduce catheter sepsis during total parenteral nutrition. JPEN J Parenter Enteral Nutr. 1985;9(3):348-349.
159. Birch P, Ogden S, Hewson M. A randomised, controlled trial of heparin in total parenteral nutrition to prevent sepsis associated with
at SAINT FRANCIS HOSPITAL on March 13, 2015pen.sagepub.comDownloaded from
Boullata et al 377
neonatal long lines: the Heparin in Long Line Total Parenteral Nutrition (HILLTOP) trial. Arch Dis Child Fetal Neonatal Ed. 2010;95(4):F252-F257.
160. Kamala F, Boo NY, Cheah FC, Birinder K. Randomized controlled trial of heparin for prevention of blockage of peripherally inserted central catheters in neonates. Acta Paediatr. 2002;91(12):1350-1356.
161. Uslu S, Ozdemir H, Comert S, Bolat F, Nuhoglu A. The effect of low-dose heparin on maintaining peripherally inserted percutaneous central venous catheters in neonates. J Perinatol. 2010;30(12):794-799.
162. Brismar B, Hardstedt C, Jacobson S, Kager L, Malmborg AS. Reduction of catheter-associated thrombosis in parenteral nutrition by intravenous heparin therapy. Arch Surg. 1982;117(9):1196-1199.
163. Klerk CP, Smorenburg SM, Buller HR. Thrombosis prophylaxis in patient populations with a central venous catheter: a systematic review. Arch Intern Med. 2003;163(16):1913-1921.
164. Rattenbury JM, Timmins JG, Cawthorne EA, Ganapathy S, Taylor CJ. Identification of the cause of separation (creaming) of lipid emulsions in intravenous infusion. J Pediatr Gastroenterol Nutr. 1989;8(4):491-495.
165. Silvers KM, Winterbourn CC. The destabilisation of total paren-teral nutrition by heparin: how real is the problem? N Z Med J. 1997;110(1053):386.
166. Macoviak JA, Melnik G, McLean G, et al. The effect of low-dose hepa-rin on the prevention of venous thrombosis in patients receiving short-term parenteral nutrition. Curr Surg. 1984;41(2):98-100.
167. Imperial J, Bistrian BR, Bothe A Jr, Bern M, Blackburn GL. Limitation of central vein thrombosis in total parenteral nutrition by continuous infusion of low-dose heparin. J Am Coll Nutr. 1983;2(1):63-73.
168. Fabri PJ, Mirtallo JM, Ruberg RL, et al. Incidence and prevention of thrombosis of the subclavian vein during total parenteral nutrition. Surg Gynecol Obstet. 1982;155(2):238-240.
169. Brennan MF, O’Connell RC, Rosol JA, Kundsin R. The growth of Candida albicans in nutritive solutions given parenterally. Arch Surg. 1971;103(6):705-708.
170. Deitel M, Kaminsky VM, Fuksa M. Growth of common bacte-ria and Candida albicans in 10% soybean oil emulsion. Can J Surg. 1975;18(6):531-535.
171. Melly MA, Meng HC, Schaffner W. Microbiol growth in lipid emul-sions used in parenteral nutrition. Arch Surg. 1975;110(12):1479-1481.
172. Keammerer D, Mayhall CG, Hall GO, Pesko LJ, Thomas RB. Microbial growth patterns in intravenous fat emulsions. Am J Hosp Pharm. 1983;40(10):1650-1653.
173. Kim CH, Lewis DE, Kumar A. Bacterial and fungal growth in intrave-nous fat emulsions. Am J Hosp Pharm. 1983;40(12):2159-2161.
174. Crocker KS, Noga R, Filibeck DJ, Krey SH, Markovic M, Steffee WP. Microbial growth comparisons of five commercial parenteral lipid emulsions. JPEN J Parenter Enteral Nutr. 1984;8(4):391-395.
175. Jarvis WR, Highsmith AK. Bacterial growth and endotoxin production in lipid emulsion. J Clin Microbiol. 1984;19(1):17-20.
176. Ebbert ML, Farraj M, Hwang LT. The incidence and clinical signifi-cance of intravenous fat emulsion contamination during infusion. JPEN J Parenter Enteral Nutr. 1987;11(1):42-45.
177. Reiter PD. Sterility of intravenous fat emulsion in plastic syringes. Am J Health Syst Pharm. 2002;59(19):1857-1859.
178. Reiter PD, Robles J, Dowell EB. Effect of 24-hour intravenous tubing set change on the sterility of repackaged fat emulsion in neonates. Ann Pharmacother. 2004;38(10):1603-1607.
179. Crill CM, Hak EB, Robinson LA, Helms RA. Evaluation of micro-bial contamination associated with different preparation methods for neonatal intravenous fat emulsion infusion. Am J Health Syst Pharm. 2010;67(11):914-918.
180. McKee KT Jr, Melly MA, Greene HL, Schaffner W. Gram-negative bacillary sepsis associated with use of lipid emulsion in parenteral nutri-tion. Am J Dis Child. 1979;133(6):649-650.
181. Jarvis WR, Highsmith AK, Allen JR, Haley RW. Polymicrobial bacte-remia associated with lipid emulsion in a neonatal intensive care unit. Pediatr Infect Dis. 1983;2(3):203-208.
182. de Beaufort AJ, Bernards AT, Dijkshoorn L, van Boven CP. Acinetobacter junii causes life-threatening sepsis in preterm infants. Acta Paediatr. 1999;88(7):772-775.
183. Fairchild KD, Patterson A, Gumpper KF. Overdose of intravenous fat emul-sion in a preterm infant: case report. Nutr Clin Pract. 1999;14(3):116-119.
184. Chuo J, Lambert G, Hicks RW. Intralipid medication errors in the neona-tal intensive care unit. Jt Comm J Qual Patient Saf. 2007;33(2):104-111.
185. Low E, Ryan CA. Overdose of intravenous intralipid in a premature neonate. Jt Comm J Qual Patient Saf. 2007;33(10):588-589; author reply 589-590.
186. Hicks RW, Becker SC, Chuo J. A summary of NICU fat emulsion medication errors and nursing services: data from MEDMARX. Adv Neonatal Care. 2007;7(6):299-308; quiz 309-210.
187. Parenteral nutrition. In: Kleinman RE, ed. Pediatric Nutrition Handbook. 6th ed. Elk Grove, IL: American Academy of Pediatrics; 2009:519-540.
188. Ybarra JV, Rose WE, Curtis CS, Sacks GS. Sterility of pediatric lipid emulsions repackaged by an automated compounding device. JPEN J Parenter Enteral Nutr. 2011;35(3):391-394.
189. Intralipid 30% [package insert]. Uppsala, Sweden: Fresenius Kabi AB; April 2000.
190. Intralipid 20% [package insert]. Uppsala, Sweden: Fresenius Kabi AB; April 2007.
191. Liposyn III 30% [package insert]. Lake Forest, IL: Hospira, Inc; August 2005. 192. Liposyn III [package insert]. Lake Forest, IL: Hospira, Inc; September 2005. 193. Properties of Intralipid in Excel container after removal of over pouch.
Uppsala, Sweden: Fresenius Kabi; April 2010. 194. Driscoll DF, Thoma A, Franke R, Klutsch K, Nehne J, Bistrian BR. Lipid
globule size in total nutrient admixtures prepared in three-chamber plas-tic bags. Am J Health Syst Pharm. 2009;66(7):649-656.
195. Driscoll DF, Ling PR, Bistrian BR. Physical stability of 20% lipid injectable emulsions via simulated syringe infusion: effects of glass vs plastic product packaging. JPEN J Parenter Enteral Nutr. 2007;31(2):148-153.
196. Scott EM, Gorman SP, Wyatt TD, Magill EA. Growth of microorgan-isms in total parenteral nutrition mixtures and related clinical observa-tions. J Clin Hosp Pharm. 1985;10(1):79-88.
at SAINT FRANCIS HOSPITAL on March 13, 2015pen.sagepub.comDownloaded from