journal of materials processing technology - spiral: home · pdf filejournal of materials...
TRANSCRIPT
Aq
Ta
b
c
a
ARRAA
KASXPQ
1
ioruDtmatpwpt
pT
h0
Journal of Materials Processing Technology 214 (2014) 2706–2715
Contents lists available at ScienceDirect
Journal of Materials Processing Technology
jo ur nal home p ag e: www.elsev ier .com/ locate / jmatprotec
dditive manufactured porous titanium structures: Through-processuantification of pore and strut networks
aek Bo Kima, Sheng Yueb, Ziyu Zhanga, Eric Jonesc, Julian R. Jonesa, Peter D. Leeb,∗
Department of Materials, Imperial College London, London SW7 2AZ, UKSchool of Materials, University of Manchester, Manchester M13 9PL, UKCentre for Materials and Structures, University of Liverpool, Liverpool L69 3GH, UK
r t i c l e i n f o
rticle history:eceived 16 December 2013eceived in revised form 24 March 2014ccepted 4 May 2014vailable online 13 May 2014
eywords:dditive manufacturingelective laser melting-ray microtomography
a b s t r a c t
Titanium and its alloys are successfully used in aerospace through to marine applications. Selective lasermelting (SLM) is an additive manufacturing technique, which promises to allow production of novel Tistructures. However, there is still a paucity of accepted methods for quantifying build quality. The viabilityof using X-ray microtomography (�CT) to quantify and track changes in morphology of SLM Ti porousstructures at each stage of the post-laser melting production was tested, quantifying its quality throughprocess. Quantification was achieved using an accessible volume tool to determine pore and strut sizes.Removal of partially sintered struts by cleaning was visualised and quantified. Eighty-eight percent of thestruts broken by the cleaning process were found to have connecting neck diameters of less than 180 �mwith a mean of 109 �m allowing build criteria to be set. Tracking particles removed during cleaning
orous titaniumuantification methods
revealed other methods to improve build design, e.g. avoiding low angle struts that did not sinter well.Partially melted powder particles from strut surfaces were quantified by comparing surface roughnessvalues at each cleaning step. The study demonstrates that �CT provides not only 3D quantification ofstructure quality, but also a feedback mechanism, such that improvements to the initial design can bemade to create more stable and reliable titanium structures for a wide variety of applications.
© 2014 The Authors. Published by Elsevier B.V. This is an open access article under the CC BY license
. Introduction
Titanium (Ti) and its alloys have been used extensively in manyndustries due to their low density, high corrosion resistance andxidation resistance as outlined by Leyens and Peters (2005). Moreecently, the production of porous structures by additive man-facturing techniques has become more widespread, such as byavies and Zhen (1983) who outlined several methods of produc-
ion for foamed metals. In particular, porous Ti structures have beenanufactured for use in many applications using a powder met-
llurgy route which presents a number of advantages, primarilyhe ability to shape complex structures with tailored mechanicalroperties at low temperature as shown by Brenne et al. (2013)
ho studied the microstructure of additive manufactured (AM)orous Ti and its impact on mechanical properties. Of the many AMechniques presented in literature – Dunand (2004) reviewed the∗ Corresponding author at: The Manchester X-Ray Imaging Facility Research Com-lex at Harwell Rutherford Appleton Laboratory Didcot, Oxon OX11 0FA, UK.el.: +44 1235 567789; fax: +44 1235 567799.
E-mail addresses: [email protected], [email protected] (P.D. Lee).
ttp://dx.doi.org/10.1016/j.jmatprotec.2014.05.006924-0136/© 2014 The Authors. Published by Elsevier B.V. This is an open access article u
(http://creativecommons.org/licenses/by/3.0/).
production methods of Ti foams by powder sintering and bubbleexpansion, Wadley (2002) reviewed the development of periodicmetallic porous structures and Singh et al. (2010) looked at theAM methods to produce Ti scaffolds for biomedical applications –selective laser melting (SLM) has been found to be a very promisingmethod. This AM approach uses a computer aided design to directa laser point that melts a powder bed of titanium to directly buildTi structures with controlled porosity. SLM provides a continuousconnected pore network that is difficult to achieve using typicalfoaming methods such as bubble foaming or space-holder foam-ing, which can form closed pores. SLM allows greater control overthe final structure of very complex interconnected strut designs totailor pore and strut sizes and therefore allows customisation of themechanical properties of a porous structure.
As SLM is a relatively new technology, it is important to ver-ify and match as-built structures with the original design. This isparticularly challenging as AM structures can have complex 3Dfeatures that cannot be quantified using normal metrology tech-
niques. Characterisation of porous Ti structures has focused on themicrostructure and its bulk mechanical properties. For example,Kobryn and Semiatin (2001) showed how the processing parame-ters affected Ti microstructure in laser AM Ti foams and Heinl et al.nder the CC BY license (http://creativecommons.org/licenses/by/3.0/).

ocessin
(ufdeiawaen
jeipsSmMeatoocetbs
csostTattVwid
�s(rstqbicbAsbTaTanct
T.B. Kim et al. / Journal of Materials Pr
2008) tailored the elastic modulus of SLM cellular Ti by varyingnit cell sizes and laser energy. However it is equally importantor morphological characterisation of porous structures to be stan-ardised with proven quality control and assurance technologies,specially as porous structures can be customised and changed eas-ly to tailor its properties. Therefore, there is a great need for thebility to track the development of these porous structures not onlyithin batches (quality control) but the same structure throughout
production lifecycle (quality assurance). This is particularly rel-vant as potentially un-melted and loosely connected Ti particleseed to be removed from the structure before use.
One such method to clean structures is to administer abrasiveet blasting using sublimating pellets. Sintering is then applied tonhance the mechanical properties of the scaffolds by homogenis-ng the strut diameters. The rationale for using such a cleaningrocedure is to reduce the risk of contamination in the poroustructure and there is also the potential to eliminate a drying cycle.herman (2007) reviews the key parameters in jet blasting whichake such a technique widely accepted in industry. In particular,asuda et al. (1994) optimised cleaning parameters for improved
fficiency using a model based on jet theory, whilst Liu et al. (2011)ssessed jet blasted surfaces by high-speed microscopes to trackhe removal of contaminants on a surface, exemplifying the devel-pment of jet blasting. However, these studies have mainly focusedn the removal of organic contaminants rather than powder parti-les and the effectiveness of jet-blasting, whilst there has not beennough study on jet blasting’s influence on final build quality. Fur-her, studies have been restricted to measuring surface quality of aulk piece, not a porous 3D structure such as the ones used in thistudy.
To study morphological changes, X-ray microtomography (�CT)an be used as a non-destructive method to examine individualtructures. Kerckhofs et al. (2008) used �CT to validate the usef SLM manufacture of porous structures with the current gold-tandard of using histology and have shown that within error, �CTomograms can be used to validate structural features of porousi. Further to this, Van Bael et al. (2011) used �CT to study thes-built porous Ti structures built via SLM to its design parame-ers and showed good repeatability in production but showed thathe final products could be very different from the original design.an Bael’s study acts as a good precursor for our current studyhich applies the work further by quantifying the changes dur-
ng the process lifecycle of porous Ti structures, not just to its CADesign.
Combined with three-dimensional (3D) visualisation usingCT, a number of quantification tools have been developed to
tudy pore sizes in different materials. Mangan and Whitaker1999) introduced the distance transform and watershed algo-ithm, which provided a good basis to segment an interconnectedpherical pore structure from a �CT scan. Atwood et al. (2004)hen showed how spherical pore and interconnect sizes can beuantified. An experimental approach to measuring pore size isy using mercury intrusion porosimetry (MIP). However, MIP
s a destructive method and calculates the constriction of mer-ury intrusion, which approximates to interconnect (area sharedetween conjoined pores) sizes more than the actual pore sizes.
validation of MIP results of open spherical pores sizes mea-ured from �CT quantification via watershed was carried outy Jones et al. (2007). However for SLM-manufactured porousi structures, which have a channel-like pore network, a medialxis approach is more appropriate than estimating to spheres.he minimal ball approach to quantify pore size in channels
s shown by Ngom et al. (2011) or approximation of chan-el space as simple volumes as shown by Monga et al. (2007),an be successfully applied not only to pores but also to struthicknesses.g Technology 214 (2014) 2706–2715 2707
This study aims to develop methods of quantifying AM compo-nents together with �CT and applying this to study the effects thatjet blasting and sintering may have on the morphology and shapeof porous structures and quantifying these changes. The quantifica-tion tools to characterise pore and strut size distributions, and theability to track morphological changes in the same sample through-out its manufacturing life-cycle via �CT is outlined in this paper.Using �CT, it is possible to non-destructively image the structureof the scaffolds in 3D and identify defects to assess quality and alsoacts as a feedback tool to continuously update and improve designs.
2. Materials and methods
2.1. Production and cleaning of irregular porous titaniumstructures
SLM was used to build Ti structures with 60 and 75% porositylevels (termed S60 and S75 respectively). The component designwas defined in a 3D CAD model using Pro Engineer software (CreoElements Pro, PTC, Needham, MA) and represents a portion ofa specimen which is to be manufactured in a porous form. Thisportion is then populated with predetermined unit cell geometry(octahedrons) which are also tessellating. These structures werethen subjected to distortion by perturbation of its Cartesian co-ordinates which represent the spatial location of the vertices ofthe strut members that form the octahedron. This is to modify theappearance and structural properties of the unit cells to create arandom appearance; it also provides a very complex structure idealfor testing the robustness of quantification algorithms.
The SLM fabrication process develops in a layer wise fashion,with the laser beam creating a series of melt spots on the pow-der bed that correspond to the build files created from the CADmodel, thereby forming a small slice of the cellular structure. TheTi powders used were highly spherical, gas atomised grade 1 andhad a diameter between 0 and 45 �m, with a modal diameter of28.5 �m (Sumitomo Corp., Tokyo, Japan). Subsequent powder lay-ers of 50 �m are deposited and laser scanned until the parts arebuilt, with the process taking place in an argon atmosphere to pre-vent oxidation. The laser power was set at 2253 W and the exposuretime for each spot was 300 �s.
Six cylindrical specimens of diameter 25.4 mm (1′′) and height7.5 mm (top 1.2 mm is porous) were fabricated for each sampleset, S60 and S75, and embedded with three solid fiduciary mark-ers to assist image registration. Excess powder was removed andrecouped by blowing with argon gas. The as-built samples werescanned by �CT at two resolutions as described later (termed as-built).
The effect of a jet blasting process was then investigated. Thesamples were cleaned through vigorous jet blasting using pelletsthat sublimate on impact, before being placed in an ultrasonic washof Micro-90 (Sigma-Aldrich Corp., St. Louis, MO) solution. A seriesof rinses using de-ionised and distilled water was used to furtherremove any powder trapped within the parts. The samples werescanned by �CT again after this step (termed cleaned).
Once cleaned, the porous structures were put through a sinter-ing process in high vacuum. The samples were set at 100 ◦C for30 min before being heated at a ramp rate of 7.5 ◦C/min to 900 ◦Cand held for 3 h to sinter. The samples were scanned a third timeby �CT after sintering (termed sintered).
Test porous pieces were included on the build plate in orderto characterise the porous designs post-production in terms of
its porosity by the gravimetric method and compressive strength(Instron, Norwood, MA).In this study, the following sequences in the build process aredefined:
2708 T.B. Kim et al. / Journal of Materials Processing Technology 214 (2014) 2706–2715
F m/voxt the ret
•
•
2
fsccsa3a
oawwtpwftscrt
2
2
mtiTtb
b
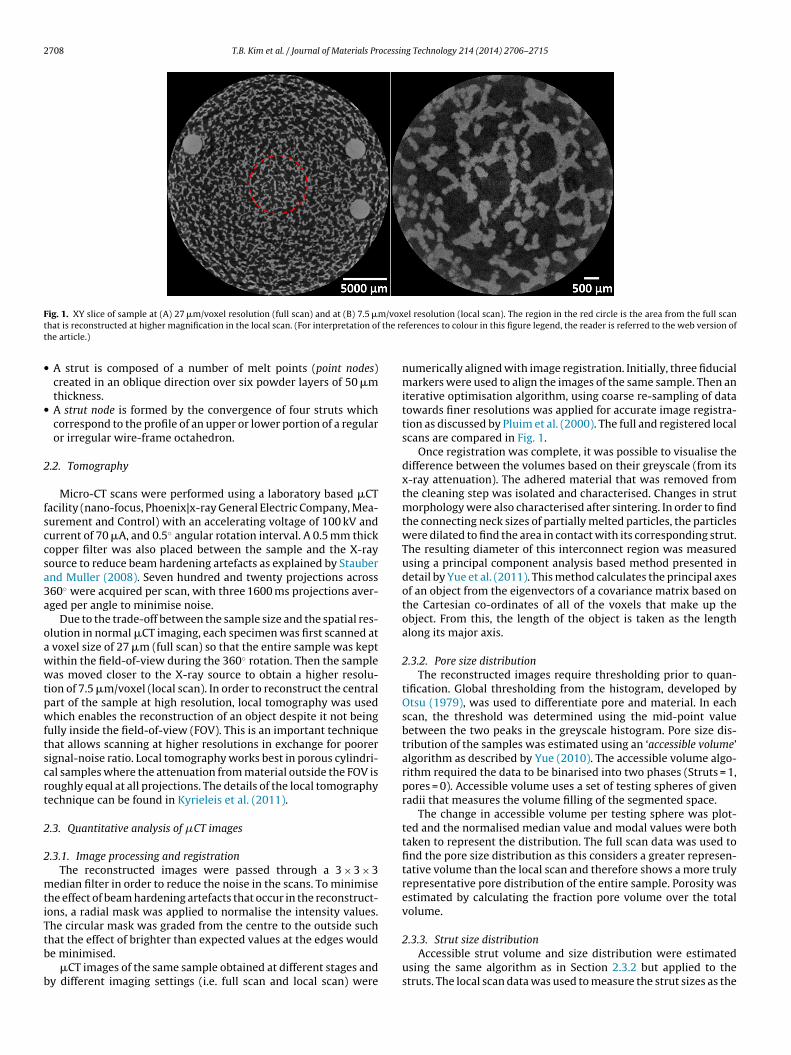
ig. 1. XY slice of sample at (A) 27 �m/voxel resolution (full scan) and at (B) 7.5 �hat is reconstructed at higher magnification in the local scan. (For interpretation ofhe article.)
A strut is composed of a number of melt points (point nodes)created in an oblique direction over six powder layers of 50 �mthickness.A strut node is formed by the convergence of four struts whichcorrespond to the profile of an upper or lower portion of a regularor irregular wire-frame octahedron.
.2. Tomography
Micro-CT scans were performed using a laboratory based �CTacility (nano-focus, Phoenix|x-ray General Electric Company, Mea-urement and Control) with an accelerating voltage of 100 kV andurrent of 70 �A, and 0.5◦ angular rotation interval. A 0.5 mm thickopper filter was also placed between the sample and the X-rayource to reduce beam hardening artefacts as explained by Staubernd Muller (2008). Seven hundred and twenty projections across60◦ were acquired per scan, with three 1600 ms projections aver-ged per angle to minimise noise.
Due to the trade-off between the sample size and the spatial res-lution in normal �CT imaging, each specimen was first scanned at
voxel size of 27 �m (full scan) so that the entire sample was keptithin the field-of-view during the 360◦ rotation. Then the sampleas moved closer to the X-ray source to obtain a higher resolu-
ion of 7.5 �m/voxel (local scan). In order to reconstruct the centralart of the sample at high resolution, local tomography was usedhich enables the reconstruction of an object despite it not being
ully inside the field-of-view (FOV). This is an important techniquehat allows scanning at higher resolutions in exchange for poorerignal-noise ratio. Local tomography works best in porous cylindri-al samples where the attenuation from material outside the FOV isoughly equal at all projections. The details of the local tomographyechnique can be found in Kyrieleis et al. (2011).
.3. Quantitative analysis of �CT images
.3.1. Image processing and registrationThe reconstructed images were passed through a 3 × 3 × 3
edian filter in order to reduce the noise in the scans. To minimisehe effect of beam hardening artefacts that occur in the reconstruct-ons, a radial mask was applied to normalise the intensity values.he circular mask was graded from the centre to the outside such
hat the effect of brighter than expected values at the edges woulde minimised.�CT images of the same sample obtained at different stages andy different imaging settings (i.e. full scan and local scan) were
el resolution (local scan). The region in the red circle is the area from the full scanferences to colour in this figure legend, the reader is referred to the web version of
numerically aligned with image registration. Initially, three fiducialmarkers were used to align the images of the same sample. Then aniterative optimisation algorithm, using coarse re-sampling of datatowards finer resolutions was applied for accurate image registra-tion as discussed by Pluim et al. (2000). The full and registered localscans are compared in Fig. 1.
Once registration was complete, it was possible to visualise thedifference between the volumes based on their greyscale (from itsx-ray attenuation). The adhered material that was removed fromthe cleaning step was isolated and characterised. Changes in strutmorphology were also characterised after sintering. In order to findthe connecting neck sizes of partially melted particles, the particleswere dilated to find the area in contact with its corresponding strut.The resulting diameter of this interconnect region was measuredusing a principal component analysis based method presented indetail by Yue et al. (2011). This method calculates the principal axesof an object from the eigenvectors of a covariance matrix based onthe Cartesian co-ordinates of all of the voxels that make up theobject. From this, the length of the object is taken as the lengthalong its major axis.
2.3.2. Pore size distributionThe reconstructed images require thresholding prior to quan-
tification. Global thresholding from the histogram, developed byOtsu (1979), was used to differentiate pore and material. In eachscan, the threshold was determined using the mid-point valuebetween the two peaks in the greyscale histogram. Pore size dis-tribution of the samples was estimated using an ‘accessible volume’algorithm as described by Yue (2010). The accessible volume algo-rithm required the data to be binarised into two phases (Struts = 1,pores = 0). Accessible volume uses a set of testing spheres of givenradii that measures the volume filling of the segmented space.
The change in accessible volume per testing sphere was plot-ted and the normalised median value and modal values were bothtaken to represent the distribution. The full scan data was used tofind the pore size distribution as this considers a greater represen-tative volume than the local scan and therefore shows a more trulyrepresentative pore distribution of the entire sample. Porosity wasestimated by calculating the fraction pore volume over the totalvolume.
2.3.3. Strut size distributionAccessible strut volume and size distribution were estimated
using the same algorithm as in Section 2.3.2 but applied to thestruts. The local scan data was used to measure the strut sizes as the

ocessin
hibs�tsta
2
ue
2
visiataobt
3
3
swt
s(
gtl5
3
tsot
TMp
peak at 292 �m were also observed in some samples as shown inFig. 2c. The local scans were not used to find the pore size distribu-tion, as the sampling volume was too small to give a representative
T.B. Kim et al. / Journal of Materials Pr
igher resolution was required to differentiate the small changesn strut thickness. Comparable strut distributions were compiledy more conventional methods such as manual measurement oftrut thicknesses from SEM images. Manual measurements fromCT reconstructions were also taken. This was done by measuring
he perpendicular width of struts in a 2D slice to the strut length aseen in Fig. 3b and d. 40–75 measurements were taken for each dis-ribution for each porosity: S60 and S75; and each cleaning state:s-built, cleaned and sintered.
.4. SEM imaging
The samples were scanned using secondary electron imagingsing the JSM 5610 LV (Variable Pressure SEM JEOL) with an accel-rating voltage of 20 kV and a 15 mm working distance.
.5. Sampling and statistics
As each process in the cleaning and sintering procedure can haveariable effects on the Ti structures, six samples produced using thedentical design for each porosity were analysed. Each of the sixamples was put through the same process of cleaning and sinter-ng and �CT was performed at every step. Detailed analysis usingccessible volume was applied to three of the six samples. Due tohe huge amount of data obtained, the results shown in this studyre from a typical representative sample of S60 and S75. The field-f-view for the high resolution (7.5 �m/voxel) scans were limitedy the size of the detector and therefore is only a selective view ofhe centre of the entire sample.
. Results
.1. Porosity and reconstruction
Initial characterisation showed that the porosity of the builttructures (65 ± 2%) matched closely to its target porosity (65%)hen tested gravimetrically. The compressive strength was found
o be 42 ± 4 MPa.A typical 2D slice through the sample obtained from the �CT
can reconstruction is shown in Fig. 1: for the low (Fig. 1a) and highFig. 1b) resolution scan.
The mean porosities of the samples at each process step areiven in Table 1. The average porosities measured match the designargets closely. The lower resolution (full scans) tended to give aower apparent porosity than the higher resolution scans by about%, due to the large voxel size over-estimating strut thickness.
.2. Pore size and strut size distributions from accessible volume
Fig. 2a–c shows the pore size distributions as quantified using
he accessible volume algorithm from volumes with a 27 �m voxelize. The graph plots the change in accessible volume as a functionf the pore diameter. A large change in accessible volume correlateso a larger proportion of pores constricted at this diameter. Fig. 2aable 1ean porosity determined by analysis from micro-CT 3D reconstruction volumes of
orous titanium structures.
Cleaning stage Actual porosity (%)
60% target 75% target
Full Local Full Local
Original 55.3 ± 0.6 61.3 ± 1.1 64.8 ± 0.4 69.2 ± 2.1Cleaned 57.7 ± 0.2 62.2 ± 1.3 66.9 ± 0.5 71.5 ± 0.2Sintered 56.7 ± 1.1 65.4 ± 0.5 66.4 ± 1.4 69.8 ± 1.4
g Technology 214 (2014) 2706–2715 2709
shows the pore distribution of a representative cleaned samples forthe different porosity levels, S60 and S75. The median/modal val-ues for the S60 and S75 samples are 287/292 �m and 326/426 �m,respectively. The median values are given as they fully illustratechanges in distribution skew and representative diameter throughprocessing (see Table 2).
Fig. 2b shows the pore size distribution of a S60 sample at eachstage with the median values in Table 2. For S75 sample, the modalvalues were higher than the S60 sample at 426 �m; however a small
Fig. 2. Accessible volume method to find pore size distributions of (A) cleaned S60and S75 samples; and (B) after each stage in the procedure as-built, cleaned and sin-tered for S60 sample and (C) in a S75 sample. The resolution used was 27 �m/voxel.

2710 T.B. Kim et al. / Journal of Materials Processing Technology 214 (2014) 2706–2715
Table 2Median pore and strut sizes from accessible volume for 60 and 75% porosity foams at each processing stage. Values are obtained from scans at two different resolutions –27 �m/voxel for full scan and 7.5 �m/voxel for local scan (Note: error is variability between samples).
Porosity Cleaning stage Median pore size (�m) Median strut size (�m)
Full Local Full Local
60% Original 283 ± 1.4 276 ± 6.0 235 ± 3.2 226 ± 7.1Cleaned 296 ± 1.0 279 ± 1.6 230 ± 0.6 231 ± 12Sintered 292 ± 5.3 314 ± 7.8 236 ± 3.3 231 ± 3.2
283 ± 8.0 193 ± 2.1 189 ± 9.7303 ± 1.5 191 ± 1.5 191 ± 2.9302 ± 5.6 183 ± 8.8 198 ± 10
dbup
nccitsfs
p(SsnsTmdot
scfu2pTdp
atTsv
stss3mltsaf
Fig. 3. (A) Shows a SEM image taken at ×35 magnification of a cleaned and sinteredS60 sample showing the strut network, with the strut and point nodes being clearlyidentifiable. (B) Shows a SEM image at ×150 magnification of an individual strut. The
75% Original 308 ± 1.7
Cleaned 328 ± 1.8
Sintered 317 ± 7.6
istribution of the entire sample. The differences in pore size distri-utions are small, although the greatest difference is between thencleaned state and the cleaned step as this is the most aggressiverocedure.
Fig. 3a shows a SEM image of a region of a S60 at 35× mag-ification. Reconstruction of the �CT images as shown in Fig. 3can be visually correlated with the SEM images. The point nodesan be more clearly defined in the SEM images, whilst the qual-ty of the �CT image is voxel size dependent. Fig. 3b and d showshe comparison of the same strut. The �CT strut shows a muchmoother surface than the SEM image. The manual measurementsrom the SEM images and �CT images are compared to the strutize distributions obtained by accessible volume in Fig. 4d.
Fig. 4 shows the strut size distributions of representative sam-les comparing both porosities (Fig. 4a) and at each cleaning stepFig. 4b and c). Again, the difference in strut size between S60 and75 samples were as expected, with the S60 having overall thickertruts. Both porosities measured by accessible volume had thick-esses close to the target thickness of 180 �m. The S60 samplehowed modal values of 188 �m and a smaller peak at 274 �m.he median value was found to be 227 �m. The S75 sample showedodal value of 155 �m and a median value of 201 �m. There was no
efining peak found using the accessible volume algorithm, but 86%f the strut volume change occurred in the range of 129–331 �m forhe S60 sample and in the range 129–274 �m for the S75 sample.
Fig. 4b shows the strut distribution after each step from acces-ible volume of a S60 sample. It shows that there was only a smallhange in the strut sizes, but there was a marked reduction in theraction of 188 �m struts in the cleaned sample. The median val-es for as-built, cleaned and sintered samples were 218, 245 and27 �m respectively for this sample, but the variance between sam-les measured showed that these differences were not significant.he apparent increase in the median value of the cleaned sample isue to the lower fraction of 188 �m struts. The struts showed twoeaks at 188 and 274 �m.
Fig. 4c shows the S75 strut distribution from accessible volumelgorithm. From the graph, the fraction of thinner struts (from 50o 129 �m) has decreased for the cleaned and sintered samples.he sintered sample also showed a drop in the 274 �m peak, as theintering smoothens rougher struts. This is reflected in the medianalues for as-built, cleaned and sintered samples (Table 2).
Fig. 4d compares the S60 strut distributions after cleaning andintering, measured using three different techniques. First is usinghe accessible volume algorithm, a specific code to measure thetrut thickness based on its distance map; secondly is manual mea-urements from SEM and lastly from manual measurements fromD reconstruction of �CT images. Fig. 3b and d shows the measure-ent of a typical strut in SEM and �CT reconstructions. Despite the
arge number of measurements taken from SEM and �CT images,
hese tended to give a narrower distribution than from the acces-ible volume algorithm. The modal values of strut size from theccessible volume algorithm, SEM and �CT measurements were allound to be 187 �m. SEM measurements were also able to show adiameter of the strut (in red arrows) was measured as the perpendicular thicknessfrom the centre line of the strut (dotted red line). (C) Shows the �CT reconstructed3D image of the same area as (A), voxel size is 27 �m. (D) Shows the diametermanually measured from �CT. (For interpretation of the references to colour in thisfigure legend, the reader is referred to the web version of the article.)

T.B. Kim et al. / Journal of Materials Processin
Fig. 4. Strut size distributions measured from accessible volume for (A) Two cleanedsamples of different porosities 60 and 75%; (B) shows the strut size distributions ateach stage during the cleaning process for a S60 sample; (C) shows the strut sizedistribution for a S75 sample. (D) Shows the comparison of strut size distributions ofsintered S60 samples obtained by 3 different methods: accessible volume, manual3D measurements of �CT reconstructions and manual measurements from SEMimages.
g Technology 214 (2014) 2706–2715 2711
second peak at 274 �m which was also present from the accessiblevolume distribution.
3.3. Jet blasting and strut removal
Jet blasting is a common method of abrasive method of clean-ing. It is used to remove unwanted particles left over that may bepartially melted onto struts. In order to quantify its effects using�CT, the scans must be registered before and after cleaning. Fig. 5ashows the 3D reconstruction of a S60 sample with the parts of thestrut that were removed or bent by the cleaning highlighted in red,scanned at 27 �m/voxel. The unaffected struts are shown in yel-low. The volume of material that was affected was less than 3%(2.4 ± 0.5%) for S60. The affected struts were spread evenly acrossthe surface, but struts nearer the surface were more likely to haveparticles removed or bent. The number of affected particles in theROI was 450, of varying sizes between 30 and 475 �m. The averagesize of neck diameter of the removed particles in this ROI was foundto be 109 ± 56 �m. 88% of the connecting neck diameters were lessthan 180 �m, which was the target strut size.
Using a large voxel size was necessary to analyse a statisticallysignificant volume, however to quantify the neck sizes accurately,the local scan (7.5 �m per voxel) was used. Fig. 5b shows a smallarea where particles are removed. The particles have a diametersimilar to the thickness of the struts (200 ± 20 �m) and have con-necting neck diameters of 97 �m ± 22 �m as found by principalcomponent analysis. Fig. 5b–d shows the removed particles in darkorange from the struts. Fig. 5e shows the particles from an X–Zviewpoint, from which the angle the line of particles makes withthe X–Y plane was found to be 6.06◦.
Fig. 6 shows struts at each stage of the cleaning process (A – asbuilt, B – cleaned, C – sintered) showing the removal of small par-tially melted powder particles. These particles can only be resolvedat the higher resolution of 7.5 �m/voxel due to their small size. Thered arrows highlight the powder particles that have been removedfrom the as built strut to the jet-blasted strut. Sa, the areal surfaceroughness defined as the arithmetical mean height of the surface,was found to be 11.0 ± 4.1 �m for the as-built strut, 10.6 ± 3.8 �mfor the jet-blasted strut and 10.8 ± 3.8 �m for the sintered strut.The strut thicknesses match the target strut thickness which wasa radius of 90 �m. The error values correspond to the accuracy ofthe polar co-ordinates of the strut surface, which was accurate towithin ± 0.5 voxel.
Fig. 7 shows examples of individual strut bending after each pro-cess. After registration of the samples, struts that are bent can beeasily identified. The bending occurs at the surface of the sampleswhich are in direct contact with the blasting. Fig. 7a and b showsdeformation before cleaning (in yellow) and after cleaning (shownin green), which is the step that exhibits the majority of deforma-tion. Fig. 7c shows deformation of a strut before sintering (in green)and after sintering (in purple). Such examples of deformation aremuch rarer in the post-sintering case than the post-blasting case.
4. Discussion
4.1. Tomography
Acquiring 3D tomography scans can give high quality imagesof the volume, but it is much more difficult to obtain informationregarding its properties. In order to quantify changes in the tita-nium, it is necessary to threshold the images. Thresholding is an
inherent difficulty in �CT due to noise and reconstruction arte-facts and has been previously discussed by Koseki et al. (2008)and Stauber and Muller (2008) in greater detail. At lower reso-lutions, the error in thresholding can lead to large differences in
2712 T.B. Kim et al. / Journal of Materials Processing Technology 214 (2014) 2706–2715
Fig. 5. (A) Shows the interconnecting neck diameter distributions of strut particlesthat have been removed during the blasting step for a S75 samples. Inset is a recon-struction of a small volume of the structure (27 �m/voxel) where the titanium strutsare shown in yellow and the particles that were removed highlighted in red. (B–D)Shows a progression of images that show how the interconnecting neck diameterswere found. In (B), the titanium struts are shown in yellow. The dark-orange spher-ical particles are particles of the original titanium network that were broken offduring blasting. (C) and (D) show the individual particles and their neck intercon-nects which are shown in blue. E: shows the low angle struts that could be removedfrom the design prior to production. The scale bar shows 300 �m. (For interpretationof the references to colour in this figure legend, the reader is referred to the webversion of the article.)
Fig. 6. Shows the surface profiles of a typical strut shown inset scanned at7.5 �m/voxel resolution. Rho is the height of the surface from the centreline of thestrut, strut length and theta are the components of the polar co-ordinates of the strut.
(A–C) Compares the same strut at as-built, cleaned and sintered stages respectively.(For interpretation of the references to colour in text, the reader is referred to theweb version of the article.)measurements. Since the intensities of each scan changes from scanto scan, the threshold value was found for each scan using its his-togram. The values of the pore space and titanium peaks provide areliable, objective and repeatable way of finding a threshold value.
4.2. Accessible volume
The accessible volume theory is used as a method to quantify thepore and strut sizes by comparing the volume filled by spheres ofincreasing radius. The use of previous techniques is not adequate orappropriate for the pore shapes found in SLM-manufactured struc-tures as they are not spherical pores as in Jones et al. (2009) and
others previously mentioned. Accessible volume theory producesa distance map from the struts towards the centre of the pore andassigns whether or not a sphere of a given diameter is able to occupythat space as long as it is connected to pores on the surface. As the
T.B. Kim et al. / Journal of Materials Processin
Fig. 7. Three examples of bending found by the comparison of registered samples(A–B) before (in yellow) and after (in green) blasting and (C) before (in green) andabl
ritotip
rapha
fter (in purple) sintering. Region of deformation is shown in red circles. The scalear shows 300 �m. (For interpretation of the references to colour in this figure
egend, the reader is referred to the web version of the article.)
adii of the spheres increase, pore spaces that are smaller or have annterconnect size less than this, cannot be filled and therefore leadso a smaller volume being filled. The pores must be linked to theuter face of the sample, such that it measures the volume that theesting sphere can cover. In this way, accessible volume algorithms analogous to the pore size distribution calculated by changes inressure in MIP.
The pore size distributions from the accessible volume algo-ithm showed similar variance in the S60 and S75 samples,
lthough the S75 sample shows a positive skew due to the largerore diameters. For the strut size distributions, the S60 samplesave positive skew. The smaller peaks seen at 274 �m in the SEMnd accessible volume strut distributions are representative of theg Technology 214 (2014) 2706–2715 2713
larger strut nodes that form due to the convergence of struts. Fur-thermore, the modal values of strut size from accessible volume,SEM and manual �CT measurements were all found to be 187 �m.This correlates well with the initial target strut diameter which was180 �m (Fig. 4d).
It is interesting to note that there was very little difference seenbetween the pore size distributions at each cleaning stage (Fig. 2).This means that overall; there is little change in the macro-structurewhen the samples undergo this cleaning process. This lends tothe assumption that these cleaning and production methods donot change the inherent pore and strut sizes. The accessible vol-ume method is able to differentiate the pore and strut sizes oftwo samples of different porosities, which means it is sensitiveto manufacturing design and reflects such differences. The reso-lution was also an important factor in the quantification as largervoxel sizes (27 �m in this case) were found to overestimate thesize of the struts, leading to generally lower porosities and poresizes. When measuring strut size, the median values of the strutswere seen to increase from as-built to cleaned. It would be expectedfrom blasting for material to be removed and therefore the strutsize should show a decrease in the strut size. However, with theremoval of thin struts, the accessible volume of struts shifts to theright to reflect the larger fraction of thicker struts that was notremoved.
As the nature of the manufacturing method of these struc-tures produces uneven and globular struts, the measuring strutand pore sizes are difficult using conventional methods. A prob-lem when measuring the strut diameters from SEM and even from�CT reconstruction images is that the struts are not of uniformdiameter across its length. This means that manual measurementsfrom images are based on measurements that are considered a rep-resentative length of the strut can be prone to bias. This leads tothe narrow distribution, but similar modal values as seen in Fig. 4.The accessible volume method considers all the thicknesses in eachstrut and pore, which provides information about the proportionof small, constricting interconnects.
4.3. Quantification of effect of cleaning
By using SLM, it is possible to reproduce almost identical struc-tures repeatedly by using the same design. However, there arepotential problems related to SLM such as partial melting of pow-ders and trapped powder. Xue et al. (2007) fabricated porous Tistructures using a similar additive layer manufacturing method likeSLM termed laser engineered net shaping (LENS). These cellularmaterials had a pore size range of 100–700 �m and a widely vary-ing porosity of 17–70%, but contained partially sintered Ti particleswhich could lead to reduced wear and fatigue properties.
In order to find the connecting neck diameter distribution, asignificant number of necks were required. The particles that wereremoved from blasting were found to have spherical morphologywith a diameter similar to the strut diameters measured by accessi-ble volume. This suggests that the particles that are removed are notparticles from the melting process, but are more likely to be strutsthat have broken off as a result of the cleaning process. Struts withthin necks are a result of individual point nodes within the strutbeing too far away from its adjacent neighbours, when the strutwith a low angle is formed. This however, can be easily resolvedby modifying the initial design files such that struts that form lowangles – and are therefore more likely to have thin necks – areremoved. This observation is clearly illustrated in Fig. 5 as a string
of disconnected fragments. In 3D, these particles look largely spher-ical in shape and it is clear that these fragments are components ofa strut (individual laser melt spots) that have possibly broken offdue to weak connecting necks (highlighted in blue).
2 ocessin
wttgIiatsn
rassbmpts(ttetbr
rttt2rteta
4p
ttr
rawainllicnFs
5
ls
714 T.B. Kim et al. / Journal of Materials Pr
Jet blasting and subsequent sintering removes particles thatould be liable to becoming loose if they had been implanted into
he body. From Fig. 5a, it can be seen that struts with sub-optimalhickness (88% of connecting neck diameters were less than the tar-et strut thickness), are most likely to be removed during cleaning.t is also important to note that �CT is able to detect the changesn structure of individual struts whereas this would be difficult tochieve from SEM or other conventional methods used to quan-ify these structures. It is also not possible to separate the differentubstituent parts as in Fig. 5b–d in SEM and thus quantifying theseeck sizes would be impossible.
Local scans (voxel size 7.5 �m) are required to visualise theemoval of powder that have been partially melted onto the strutss opposed to large scale strut particle removal seen in the fullcans. As seen in Fig. 6, the struts before and after cleaning showigns of powder particles being removed at the positions indicatedy the arrows. Qualitatively, the cleaned strut is smoother whicheans that there is a reduced chance of partially melted powder
articles breaking off. When this change is characterised quantita-ively by Sa, the areal surface roughness, it can be seen that thetandard deviation of the struts are lower for the cleaned strut10.6 ± 3.8 �m) than the as built strut (11.0 ± 4.1 �m), althoughhere is no statistical significance in the difference. The quantita-ive values of Sa are not conclusive of cleaning having a positiveffect on powder removal, however, when considered in associa-ion with the qualitative observations, it appears that powder iseing removed from the strut surface and thus lowering the strutoughness.
As is the case for most �CT scans, the trade-off between spatialesolution and sample size means that often detail is lost in ordero accommodate a greater sample size. For example, in this study,he lower resolution scan at 27 �m voxel size was used to quan-ify the neck diameter distribution. This means necks of less than7 �m were not measured and the sensitivity of the results waseduced when the features themselves are less than 100 �m. Addi-ionally, scanning titanium also leads to beam hardening and theseffects also impair image quality and therefore reduces the effec-ive resolution. In this study, the use of dual-resolution scanningnd registration minimises themeasurements error.
.4. Qualitative observations of the effects of the cleaningrocedure
An unintended effect of the cleaning procedure was observed inhe form of strut bending. The bending of struts on the surface ofhe samples could only be made by visual inspection after accurateegistration of the samples.
Although the jet blasting technique is primarily used for theemoval of unmelted titanium powder on the strut surface, thebrasive technique may also cause deformation of the structurehich can lead to strut bending. The regions that were most
ffected were struts near the surface, which were in closer prox-mity with the blast media. As seen in Fig. 7a and b, struts that areot connected to a central node (i.e. unsupported struts) are more
ikely to bend than struts that are connected. Bending of struts canead to a possible reduction in the strength of the strut, thus makingt more likely to break. It is proposed that by modifying the initialomputer design to make all struts on the surface end in a node, theumber of bending occurrences from jet-blasting can be reduced.ig. 7c illustrates a case of bending that was found before and afterintering.
. Conclusions
Jet blasting and sintering of the structures produced by SLMeads to localised removal of partially adhered Ti powder and weaktruts. This process does not affect the macro-properties of the
g Technology 214 (2014) 2706–2715
overall pore or strut network, indicating that the cleaning pro-cess does not change the original computer aided design of thestructure and its porosity. Micro-CT is able to track and quantifythese changes to the porous structure in a non-destructive man-ner progressively through the 3 stage process and using the samesample. Such an analytical procedure is a powerful tool and maybe applicable to quality control procedures. The resolution of �CTscans is an important factor in the accuracy of the quantification ofpore and strut sizes; the 7.5 �m voxel size used in this study wassufficient to find struts that had been broken off and also powderparticles that were removed during the cleaning process. The abilityto register large volumes in 3D, allows the observation of the phys-ical effects of cleaning such as bending. From these observations,modifications in the design phase can lead to direct and effec-tive improvements in the end-product such as node-terminatingstruts and the removal of potential low-angle struts. The 3D imagesoffered by �CT give unique advantages from visualisation of directchanges to porous structures, and for quantifiable datasets whichcan be used to improve structure designs, that are not availableusing conventional 2D techniques.
Acknowledgements
We would like to acknowledge the assistance provided by theManchester X-ray Imaging Facility, which was funded in part bythe EPSRC (grants EP/F007906/1, EP/F001452/1 and EP/I02249X/1)and the Research Complex at Harwell.
References
Atwood, R., Jones, J., Lee, P., Hench, L., 2004. Analysis of pore interconnectivity inbioactive glass foams using X-ray microtomography. Scr. Mater. 51, 1029–1033.
Brenne, F., Niendorf, T., Maier, H.J., 2013. Additively manufactured cellular struc-tures: impact of microstructure and local strains on the monotonic and cyclicbehavior under uniaxial and bending load. J. Mater. Process. Technol. 213,1558–1564.
Davies, G.J., Zhen, S., 1983. Metallic foams: their production, properties and appli-cations. J. Mater. Sci. 18, 1899–1911.
Dunand, D., 2004. Processing of titanium foams. Adv. Eng. Mater. 6, 369–376.Heinl, P., Körner, C., Singer, R.F., 2008. Selective electron beam melting of cellular
titanium: mechanical properties. Adv. Eng. Mater. 10, 882–888.Jones, J.R., Poologasundarampillai, G., Atwood, R., Bernard, D., Lee, P.D., 2007. Non-
destructive quantitative 3D analysis for the optimisation of tissue scaffolds.Biomaterials 28, 1404–1413.
Jones, J.R., Atwood, R., Poologasundarampillai, G., Yue, S., Lee, P.D., 2009. Quantifyingthe 3D macrostructure of tissue scaffolds. J. Mater. Sci. Mater. Med. 20, 463–471.
Kerckhofs, G., Schrooten, J., Van Cleynenbreugel, T., Lomov, S.V., Wevers, M., 2008.Validation of X-ray microfocus computed tomography as an imaging tool forporous structures. Rev. Sci. Instrum. 79, 013711.
Kobryn, P.A., Semiatin, S.L., 2001. The laser additive manufacture of Ti–6Al–4V. J.Min. Met. Mater. Soc. 53, 40–42.
Koseki, M., Hashimoto, S., Sato, S., Kimura, H., Inou, N., 2008. CT image reconstructionalgorithm to reduce metal artifact. J. Solid Mech. Mater. Eng. 2, 374–383.
Kyrieleis, A., Titarenko, V., Ibison, M., Connolley, T., Withers, P.J., 2011. Region-of-interest tomography using filtered backprojection: assessing the practical limits.J. Microsc. 241, 69–82.
Leyens, C., Peters, M., 2005. Titanium and Titanium Alloys: Fundamentals and Appli-cations. Germany: DLR-German Aerospace Center, pp. 513.
Liu, Y.-H., Maruyama, H., Matsusaka, S., 2011. Effect of particle impact on surfacecleaning using dry ice jet. Aerosol Sci. Technol. 45, 1519–1527.
Mangan, A., Whitaker, R., 1999. Partitioning 3D surface meshes using watershedsegmentation. IEEE Trans. Vis. Comput. Graph. 5, 308–321.
Masuda, H., Gotoh, K., Fukada, H., Banba, Y., 1994. The removal of particles from flatsurfaces using a high-speed air jet. Adv. Powder Technol. 5, 205–217.
Monga, O., Ndeye Ngom, F., Franc ois Delerue, J., 2007. Representing geometricstructures in 3D tomography soil images: application to pore-space modeling.Comput. Geosci. 33, 1140–1161.
Ngom, N.F., Garnier, P., Monga, O., Peth, S., 2011. Extraction of three-dimensionalsoil pore space from microtomography images using a geometrical approach.Geoderma 163, 127–134.
Otsu, N., 1979. Threshold selection method from gray-level histograms. IEEE Trans.Syst. Man Cybern. 9, 62–66.
Pluim, J., Maintz, J., Viergever, M., 2000. Image registration by maximization ofcombined mutual information and gradient information. In: Delp, S., DiGoia,A., Jaramaz, B. (Eds.), Medical Image Computing and Computer-Assisted Inter-vention – MICCAI 2000. Springer, Berlin/Heidelberg, pp. 103–129.
Sherman, R., 2007. Carbon dioxide snow cleaning. Part. Sci. Technol. 25, 37–57.

ocessin
S
S
V
T.B. Kim et al. / Journal of Materials Pr
ingh, R., Lee, P.D., Dashwood, R., Lindley, T., 2010. Titanium foams for biomedicalapplications: a review. Mater. Technol. 25, 127–136.
tauber, M., Muller, R., 2008. Micro-computed tomography: a method for thenon-destructive evaluation of the three-dimensional structure of biologicalspecimens. In: Westendorf, J.J. (Ed.), Methods in Molecular Biology. Humana
Press, Totowa, NJ.an Bael, S., Kerckhofs, G., Moesen, M., Pyka, G., Schrooten, J., 2011. Micro-CT-based improvement of geometrical and mechanical controllability ofselective laser melted Ti6Al4V porous structures. Mater. Sci. Eng. 528,7423–7431.
g Technology 214 (2014) 2706–2715 2715
Wadley, H.N.G., 2002. Cellular metals manufacturing. Adv. Eng. Mater. 4, 726–733.Xue, W., Krishna, B.V., Bandyopadhyay, A., Bose, S., 2007. Processing and bio-
compatibility evaluation of laser processed porous titanium. Acta Biomater. 3,1007–1018.
Yue, S., (Thesis) 2011. Non-destructive quantification of tissue scaffolds and aug-
mentation implants using X-ray microtomography. Department of Materials,Imperial College London, London.Yue, S., Lee, P.D., Poologasundarampillai, G., Jones, J.R., 2011. Evaluation of 3-Dbioactive glass scaffolds dissolution in a perfusion flow system with X-ray micro-tomography. Acta Biomater. 7, 2637–2643.