journal of cooperativesageconsearch.umn.edu/bitstream/164708/2/gingrich.pdf · journal of...
TRANSCRIPT
Journal of Cooperatives
Volume 26 2012 Page 17-39
Does Fair Trade Fulfill the Claims of its Proponents? Measuring the Global Impact of Fair Trade on
Participating Coffee Farmers Chris D. Gingrich* Emily J. King** Contact: *Professor of Economics, Eastern Mennonite University, Harrisonburg, VA 22802 USA. [email protected], 540-432-4154 (office); 540-432-4071 (fax) ** Former student, Eastern Mennonite University, Eastern Mennonite
University, Harrisonburg, VA 22802 USA. The authors thank Walter Surratt and James Leaman for their helpful suggestions. However, any errors remain the authors' responsibility. The Master of Business Administration Program, Longacre Endowed Chair in Business, and Orie Miller Center at Eastern Mennonite University all provided financial support for this study. Copyright and all rights therein are retained by authors. Readers may make verbatim copies of this document for non-commercial purposes by any means, provided that this copyright notice appears on all such copies.

18
Does Fair Trade Fulfill the Claims of its Proponents? Measuring the Global Impact of Fair Trade on Participating
Coffee Farmers
Chris D. Gingrich Emily J. King Abstract: While proponents claim that fair trade provides meaningful benefits for participating commodity growers, few studies to date have measured these benefits on a global scale. This study estimates the worldwide monetary benefits that fair trade provides to participating coffee farmers, most of whom belong to cooperative organizations. These benefits can be significant for individual farmers and reach up to $100 per year, averaged across all beneficiaries, when coffee prices are low. When market prices for coffee are relatively high, the annual benefits from fair trade shrink to an average of $35 per beneficiary. The fact that less than two percent of the world's coffee farmers currently sell any coffee under certified fair trade labels - and because fair trade coffee farmers are already producing quantities that exceed market demand - weakens proponents' arguments that fair trade provides an attractive new paradigm for the global coffee market. Another concern is that consumers spend between $2 and $10 extra on fair trade for every dollar that reaches participating farmers. By comparison, projects that aim to improve coffee farmers' production, processing, and marketing skills show the potential to provide benefits at a lower cost and also reach a broader clientele.
Key words: coffee; fair trade; efficiency; economic development
Background
Developing country exports of fair trade commodities represent some of the world's most dynamic markets. Although no universal definition of fair trade exists, it is generally considered to be an alternative marketing system that seeks to provide better trading conditions for economically disadvantaged producers, mainly in developing countries (Hutchens 2009). Total yearly sales of certified fair trade products, such as coffee, cocoa, tea, cotton, and bananas, recently reached $5 billion (FLO 2010), with annual growth of 40 to 60 percent during the mid-2000s (Hutchens 2009; Glazer 2007). Fair trade even grew by 15 percent in 2009 following the global financial crisis (FLO 2010). Supporters of fair trade
19 Vol. 26 [2012]
believe this growth heralds a new paradigm for assisting poverty-stricken farmers in developing countries. They emphasize that 75 percent of fair trade producer organizations are small farmer cooperatives that follow democratic principles (FLO 2012). Supporters contrast fair trade with the shortcomings of traditional trade doctrines and practices, such as restricted markets, imperfect information, and unequal power structures within trade's governing bodies (Wunderlich 2011; Hutchens 2009). Additional concerns about conventional trade include volatile prices for primary commodities, which comprise a large share of many developing countries' exports, and excess market power for intermediate buyers and processors of these same commodities (Ronchi 2006). Fair trade initiatives aim to mitigate these shortcomings (Hiscox 2007; Jaffee 2007).
On the other hand, skeptics argue that fair trade programs are misguided because they promote excess production of primary commodities and ignore the role of prices in regulating markets (Lindsey 2003; Valkila and Nygren 2010; Booth and Whetstone 2007). The most economically disadvantaged and marginalized farmers in developing countries, including landless sharecroppers, often remain outside fair trade's reach, and fair trade governance rests mainly within the developed countries (Lyon 2007). In addition, the fair trade movement depends on continued consumption growth in developed countries and further entrenches developing countries' dependency on primary commodity exports (LeClair 2002; Moore, Gibbon, and Slack 2006). Consequently, fair trade skeptics generally believe that improving farmers' production and marketing practices and removing trade barriers in developed countries will provide superior benefits to a broader group of commodity producers, compared to fair trade.
A key item often missing in this debate is accurate and transparent estimates for the monetary benefits that fair trade provides to participating farmers. The most commonly cited benefit is the difference between the farmers' guaranteed fair trade price and the local market price (Pay 2009; FLO 2010). But these price differences alone do not reveal whether fair trade provides meaningful benefits to farmers. For example, the monetary receipts from fair trade might be trivial if farmers earn a small share of their total income from the specific fair trade crop or sell a small portion of their harvest at the fair trade price. A necessary condition for fair trade's success is that the corresponding monetary benefits be sufficiently large when compared to farmers' normal income levels.
Answers to other crucial questions regarding fair trade remain elusive. How wide is fair trade's current reach among producers of primary commodities in developing countries? How efficiently does the fair trade system transfer consumer spending on related products into payments for these producers? In

Journal of Cooperatives - 20
addition to meaningfully raising incomes for participants, fair trade should reach a large number of farmers and efficiently convert consumer expenditures into farmer benefits to fulfill the claims of its supporters.
This study addresses these questions by estimating the global benefits of existing fair trade programs for coffee. Among all fair trade products, the choice of coffee is somewhat arbitrary, though partly driven by relatively abundant data. Coffee also represents fair trade's hallmark product and provides a logical starting point to examine the overall success of fair trade (Luetchford 2011). However, this study makes no claims whether the results regarding fair trade coffee apply to other commodities.
Following this introduction, the study contains four sections. Section II explains the framework and methods used to estimate fair trade's monetary benefits for participants. Section III describes the results in detail. Section IV assesses both the importance of fair trade to coffee farmers in some of the world's poorest coffee producing countries, and the efficiency of fair trade transfers from consumers to farmers. The final section summarizes the findings and suggests areas for future research and discussion.
Methods
Prior to the mid-2000s, the economic literature regarding fair trade and its effect on participating producers remained undeveloped. More recently, several authors have applied microeconomic, marketing, and industrial organization concepts to describe fair trade (Mutersbaugh 2005; Ponte and Gibbon 2005; Hutchens 2009; Getz and Shreck 2006; Becchetti and Huybrechts 2008). For the purposes of this study, a particularly useful framework comes from Guthman (2004), who describes how farmers in developed countries provide consumers with information about specialized cultivation methods or a product's nutritional value in order to receive higher prices for their goods. Other strategies involve advertising to change a food's utility value from measureable physical traits to aspects of its cultural or psychological image. Farmers may increase consumer trust regarding the advertised traits of a product or its production methods. Some farmer groups have sought organic certification for their products.
Mutersbaugh (2005) describes how similar circumstances prevail among groups of coffee farmers in developing countries seeking fair trade and organic certification. These certification schemes aim to increase consumer preferences for fair trade products and thereby provide higher prices to farmers. In addition, the elimination of coffee middlemen, known as coyotes in some settings, can
21 Vol. 26 [2012]
provide even higher prices (Potts, Fernandez, and Wunderlich 2007). The fair trade certification process for coffee under Fairtrade International, previously known as the Fairtrade Labeling Organizations International or FLO, is thoroughly described elsewhere (Raynolds, Murray, and Heller 2007; Levi and Linton 2003; Murray, Raynolds, and Taylor 2006; Bacon 2005).
Several studies estimate the monetary benefits that farm organizations have earned from fair trade coffee sales. While each study employs a slightly different method, the general approach is that the fair trade benefits equal the difference between the fair trade price and the conventional market price, times the quantity of fair trade coffee sold. Parrish, Luzadis, and Bentley (2005) examine a cooperative in northern Tanzania with 65,000 members and find $607,480 in additional earnings or $9.34 per member due to fair trade in 2002/2003. Ronchi (2002) studies a cooperative in Costa Rica with 4,000 members and finds that they earned roughly $1.80 million additionally from fair trade between 1989 and 1999, or an annual average of $45 per member. Garza and Trejo (2002) report that a Mexican cooperative with 1,500 members earned roughly $675 additionally per member from fair trade in 2001/2002a. For all fair trade coffee sales in 2002, Zehner (2002) estimates that farmers received a net gain of $0.67 per pound in 2002.
The challenge for this study is to correctly "scale up" these firm-level estimates to obtain the global benefits across several years. The divergent results and variation in coffee prices suggest that the existing estimates should not simply be increased by the number of participating farmers or the quantity of coffee sold. Instead, this section employs procedures resembling the firm-level studies, but applies them on a global scale. The net benefit per pound in a given year equals the fair trade price minus the conventional farmgate price. Multiplying this figure by the total quantity of fair trade coffee sold yields the total annual net benefits. The average benefit per farmer equals the total benefits divided by the number of participating farmers. Ideally, the specific farmgate price for each country would be compared against the fair trade price (which is uniform globally) to obtain each country's annual net benefit per pound. While farmgate coffee prices are available for most coffee producing countries, this is not true for the higher-quality Arabica/mild varieties used in most fair trade brandsb. In addition, year-to-year fair trade coffee exports for individual countries are unavailable. An alternative procedure is to use a representative farmgate price and an aggregate figure for fair trade coffee exports.
The Colombian farmgate price provides a reasonable proxy for the world farmgate coffee price. Colombia is the world's third largest producer and exporter

Journal of Cooperatives - 22
of coffee (all types combined), trailing only Brazil and Vietnam. However, much of the Brazilian and Vietnamese coffee is the Robusta variety, while Colombian coffees consist almost exclusively of Arabica/mild varieties. Hence, the Colombian farmgate price provides a better candidate to proxy the conventional market price faced by fair trade participants.
The law of one price suggests that the Colombian farmgate price should move uniformly with the international wholesale price of Arabica coffee. Table 1 and figure 1 confirm this hypothesis, with a correlation coefficient above 0.99 for the Colombian farmgate price and the New York wholesale price from 2000 to 2010. Moreover, the New York wholesale markup over the Colombian farmgate price is reasonably stable with a mean of 30 percent. Figure 2 further demonstrates a single global market in Arabica coffee since farmgate prices in Colombia and other Latin American countries, which dominate fair trade exports, generally move in tandem (Murray, Raynolds, and Taylor 2006). Correlation coefficients between each country's price and the Colombian price range from 0.63 to 0.94, with an average of 0.88 between 2000 and 2010c.
The net benefit per pound can then be established from the guaranteed FLO prices. Prior to 2007, FLO paid $1.21 minimum per pound of green coffee, plus an additional payment of $0.05 per pound. If the local price exceeded the FLO price, farmers received the local price plus $0.05 per pound. In 2007, FLO increased the bonus payment to $0.10 per pound and in 2008 increased the minimum price to $1.25 per pound (Beyer 2008; Tuvhag 2008; FLO 2007). The farmgate price, FLO price, and benefits per pound from 2000 to 2008 appear in table 2. Table 2 also lists global fair trade coffee exports. These data are compiled from several sources, but no figure is available for 2004. Hence, the missing value comes from an exponential trend across all other points (R2 = 0.96). Aggregate coffee exports are then multiplied by the net benefit per pound to estimate the total benefits from fair trade (table 2 and figure 3).
Unfortunately, reliable year-to-year data for the number of fair trade coffee farmers are unavailable. Three separate estimates of 433,000, 550,000 and 670,000 farmers are available for 1996/1997, 2000, and 2005, respectively (Rice 2001; Conroy 2001; Raynolds, Murray, and Heller 2007). To estimate year-to-year values between 2000 and 2008, a linear trend is employed over the three available points, with the predicted trend values shown in table 2 (R2 = 0.97). Finally, the estimated benefits per farmer equal the total benefits divided by the number of farmers (figure 3)d.

23 Vol. 26 [2012]
Results
The results from table 2 and figure 3 reveal two distinct trends in farmers' fair trade coffee benefits from 2000 to 2008. First, prior to the recent era of high coffee prices, fair trade coffee benefits steadily increased. Aggregate benefits in 2000 were $20 million or $37 per farmer, but grew to $63 million total and $93 per farmer in 2006. Table 2 suggests that both increased export volume and declining market prices lead to the growth in benefits. Conversely, increases in the market price of coffee after 2006 lead to declines in benefits, which totaled $26 million and $36 per farmer in 2008. While fair trade export data are unavailable after 2008, the fact that conventional coffee prices actually exceeded the FLO minimum in 2009 and 2010 (figures 1 and 2) suggests additional declines in benefits since the higher fair trade prices only consists of the $0.10 payment per pound.
The estimated benefits in table 2 compare favorably to various other reports in the literature. The Food and Agriculture Organization reports that total (additional) income earned by fair trade coffee farmers in 2008 equaled $30 million, compared to $26.1 million in table 2 (Pay 2009). FLO claims that fair trade coffee earnings equaled $60 million in 2006 (Beyer 2008, 43), compared to $62.7 million in table 2. Regarding the per farmer benefits in table 2, previous estimates range from $10 to $675, depending on the year (Garza and Trejo 2002; Parrish, Luzadis, and Bentley 2005). The only available long term estimate for annualized benefits is $44 per farmer, which resembles table 2's average of $59 (Ronchi 2002). Zehner's (2002) estimated benefits of $0.67 earnings per pound in 2002 nearly matches the $0.73 per pound from table 2.
By some arguments, the true benefits exceed the estimates in table 2 since the benefits of fair trade extend beyond higher prices for coffee farmers. Fair trade farmers receive access to credit and technical information (Utting-Chamorro 2005; Valkila and Nygren 2010; Giovannucci and Ponte 2005). A guaranteed price floor reduces farmers' insolvency risk (Utting-Chamorro). As farmer cooperatives achieve fair trade certification, they learn to access specialty markets that pay higher prices (Parrish, Luzadis, and Bentley 2005; Giovannucci and Ponte). Similarly, the certification process can promote human capital development, including increased women's leadership (Utting-Chamorro). Long term benefits accrue to fair trade farmers and their communities if participating cooperatives operate education, health, or other community development programs (Valkila and Nygren). Evidence suggests decreased emigration in communities with fair trade programs (Utting-Chamorro). Hayes (2006) explains

Journal of Cooperatives - 24
how fair trade interventions can improve the operation and efficiency of local commodity and labor markets.
Other factors suggest that table 2 actually overstates the true benefits from fair trade. Table 2 does not include the explicit costs of obtaining fair trade certification. These costs are not trivial, even for small cooperatives, starting at roughly $2,000 for an initial application and $1,600 annually thereafter (FLO-CERT 2011). Furthermore, certification might entail potential "distraction costs" if certification causes a cooperative to shift attention from its primary activities. Another rarely mentioned cost of fair trade certification is that other interest groups will try to appropriate farmer premiums via higher land values or input prices. Guthman (2004) documents this outcome in developed countries where farmers have achieved organic certification. Mutersbaugh (2005) believes this same result occurs for organic and fair trade certification schemes in developing countries.
Discussion
Table 2 provides a rough assessment of fair trade's ability to improve the lives of coffee farmers. Comparing the average benefit per farmer from 2000 to 2008 ($59) against the annual incomes of coffee farmers suggests that the gains are moderately helpful. Per capita incomes in some of the poorest coffee producing countries, such as Ethiopia, Rwanda, and Tanzania, are below $400 per year (World Bank 2011), and presumably less for small coffee farmers. Hence, the earnings from fair trade coffee could easily provide a 15 percent increase in a typical farmer's annual income and even more when coffee prices are low and the per farmer benefits reach nearly $100. However, the results are less encouraging when also considering the current limits of fair trade's outreach. Recent estimates for the total number of coffee farmers worldwide range from 25 million to 125 million so that fair trade at best reaches only two percent of all coffee farmers (Oxfam International 2002; Osorio 2002). Expanding fair trade beyond its current one percent share of global coffee sales could theoretically increase the number of beneficiaries (Valkila and Nygren 2010). However, an excess supply of fair trade coffee presently causes many participating farmers to sell less than half of their total harvest to fair trade buyers (Schmelzer 2010). Thus, any increase in demand would likely be captured first by existing beneficiaries rather than new entrants. A further concern is that the individual benefits in table 2 are average values, and some of the participating farmers will have received less than the stated amounts.
Another important assessment is the efficiency of transfers from fair trade consumers to the beneficiaries. This approach stems from basic welfare

25 Vol. 26 [2012]
economics, where a program's cost-benefit ratio measures its efficiency (Brent 1998). Relatively efficient programs (lower cost-benefit ratios) are more attractive to policy makers ceteris paribus because they provide greater results for each dollar spent. Alternatively, a specific policy goal can be achieved at a lower cost with an efficient program.
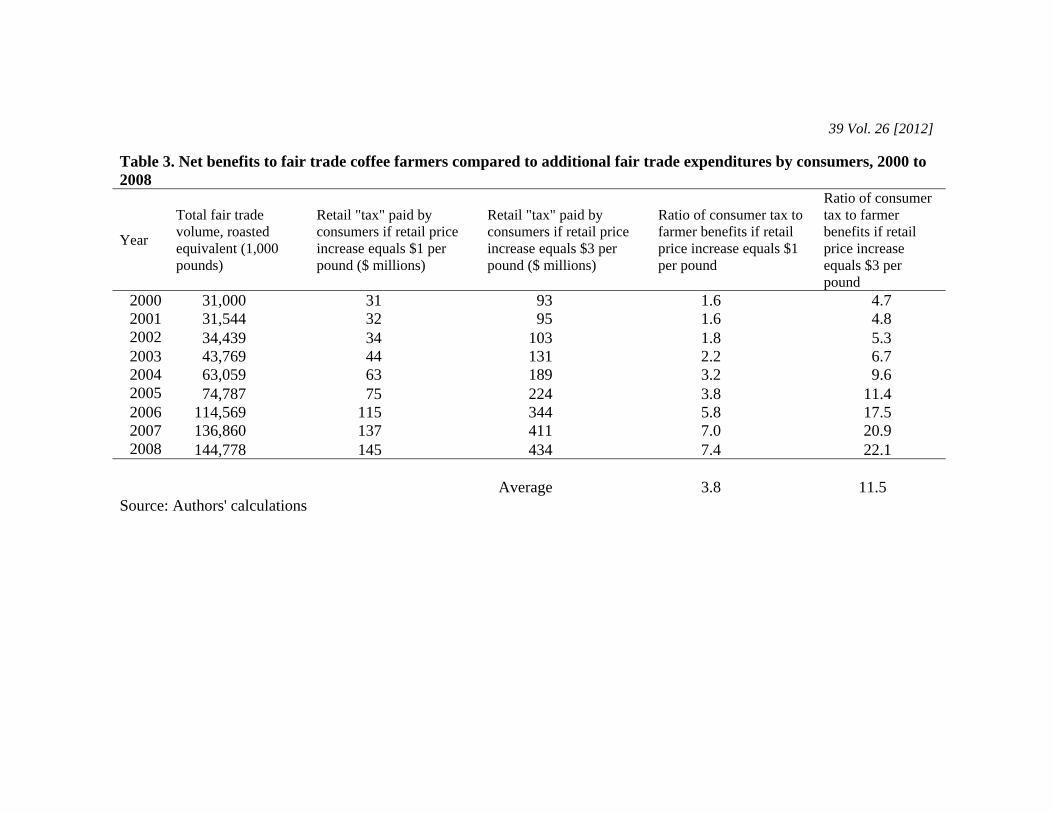
The related cost-benefit calculations for fair trade coffee are reasonably straightforward. The aggregate benefit values come from table 2. The costs are consumer expenditures on fair trade coffee above those for conventional coffee. Any additional spending on fair trade coffee thus represents a kind of "voluntary tax" that funds the program. This cost estimate should be straightforward since the consumption quantities from table 2 can be converted to an equivalent weight of roasted coffee and multiplied by the retail price difference per pound for fair trade coffee (ICO 2011). In reality, the price difference for fair trade coffee differs by country, the specific brand of fair trade coffee, the type of conventional coffee used as the numeraire, and market variables such as income level, awareness of fair trade products, and others. Existing reports of the price difference reveal a very wide range. Zehner (2002) finds a fair trade premium of $1.50 per pound at Starbucks in the United States. Niemi (2009) surveyed retail grocers in Finland and found examples where fair trade coffee sold on par with conventional coffee and others where fair trade coffee sold for an additional $3 per pound. To account for such diversity, this section will estimate cost-benefit ratios using both $1 and $3 per pound for the retail premium on fair trade coffee. While these values are somewhat arbitrary, they nevertheless provide example calculations that can be easily modified as new information becomes available. The results appear in table 3.The average cost-benefit ratios from 2000 to 2008 range from 3.8 to 11.5, with the variation due to assumptions regarding the retail price difference for fair trade coffee. The ratios imply that for every extra dollar fair trade programs generate for coffee farmers, consumers pay between $4 and $11 extra for fair trade coffee. At first glance, these findings suggest that fair trade coffee programs do not efficiently transfer funds from consumers to farmers. Obviously, a 1:1 cost-benefit ratio would be more attractive since every additional dollar spent on fair trade coffee would flow directly to the intended beneficiaries. The high cost-benefit ratios suggest that greater benefits to farmers could occur from direct donations by North Americans and Europeans than from the existing fair trade "tax".
Critics of the above analysis denounce this counterfactual argument since donations would never occur without fair trade's ability to mobilize funds (Hiscox 2007). These critics refer to the "warm-glow" effect of fair trade; that fair trade goods are not pure substitutes for conventional goods because of the

Journal of Cooperatives - 26
supplementary utility they provide to fair trade consumers (Becchetti and Huybrechts 2008; Niemi 2009). This study does not deny these effects for fair trade coffee consumers. Rather, the analysis focuses on the existing and direct monetary benefits to fair trade coffee farmers. Nonetheless, the monetary benefits in table 2 are conservative estimates for the total welfare gains because they ignore any supplementary utility gains for consumers. These secondary effects lie beyond the scope of this study.
With these limitations in mind, an alternative efficiency measure comes from Zehner (2002), who explains that a 1:1 cost-benefit benchmark is faulty since roasters and distributors will naturally appropriate some of the retail price premium for fair trade coffee. By assuming that roasters and distributors withhold five percent of gross sales, which he considers the most optimistic and realistic scenario, he claims that farmers could possibly receive 80 percent of consumers' additional spending on fair trade when coffee prices are low and 36 percent when coffee prices are high. Converting these percent values to benchmark cost-benefit ratios yields 1.3 for low coffee prices and 2.77 for high coffee prices. While a few of the cost-benefit ratios in table 3 achieve these benchmarks, they only occur when coffee prices are low (for example, from 2000 to 2004) and if the retail price premium for fair trade coffee equals one dollar or less. When coffee prices are high, the cost-benefit ratios in table 3 greatly exceed Zehner's benchmarks even with a small "tax" on fair trade coffee.
Moreover, to fully assess fair trade's effectiveness, the corresponding cost-benefit ratios should be compared to cost-benefit ratios for other projects that target coffee farmers. Unfortunately, a large sample of cost-benefit results for these projects is lacking. A further complication is that some projects for coffee farmers also support both fair trade and organic certification (USAID 2006), which precludes an accurate comparison to the results in table 3. Nonetheless, findings from two projects suggest lower cost-benefit ratios than for fair trade. One program in Haiti that improved coffee growing and processing yielded a cost-benefit ratio of approximately 1:1, depending on the particular discount rate applied to the future returns from new coffee trees (Schar, Vasquez, and Weiss 1994). A second coffee marketing project in Colombia yielded a cost-benefit ratio of 0.50 (ACDI/VOCA 2010)d. While these two examples cannot represent all comparable projects, they suggest that fair trade may not be the most cost effective method of benefitting coffee producers. Furthermore, general development projects can arguably reach more of the most disadvantaged producers, including those who are not cooperative members, than fair trade does since fair trade rules typically prohibit participation by landless farmers (Glazer

27 Vol. 26 [2012]
2007). Further research is needed before claiming whether these findings generalize across countries and other projects.
Conclusions
While fair trade has shown impressive growth in recent years, its underlying effectiveness and efficiency remain relatively unexplored. This study finds that the monetary benefits to fair trade coffee farmers are large enough to meaningfully improve the lives of participating farmers, most of whom belong to cooperative organizations. This finding is especially true when market prices for coffee are low, which causes the average annual per farmer benefits to reach $100. For coffee farmers in the world's poorest countries, this benefit could increase their incomes by roughly one-third. However, the number of beneficiaries pales next to the total number of coffee farmers in developing countries, thereby raising questions regarding fair trade's overall influence, both present and future.
In terms of efficiency, fair trade is a relatively high-cost vehicle for transferring expenditures from coffee consumers in developed countries to coffee farmers. Even under best case scenarios, consumers pay twice the amount in higher expenditures for fair trade coffee versus what actually reaches participating farmers. More troubling is that consumers pay $8 to $10 extra with fair trade for every dollar in farmer benefits when coffee prices are high. Fair trade has distinct advantages with its potential to mobilize consumers and generate revenues otherwise not available. However, to increase fair trade's appeal as a broad-based development strategy, its governing bodies should seek to improve the efficiency of transfer payments from consumers to farmers, while also expanding the pool of fair trade farmers.
Journal of Cooperatives - 28
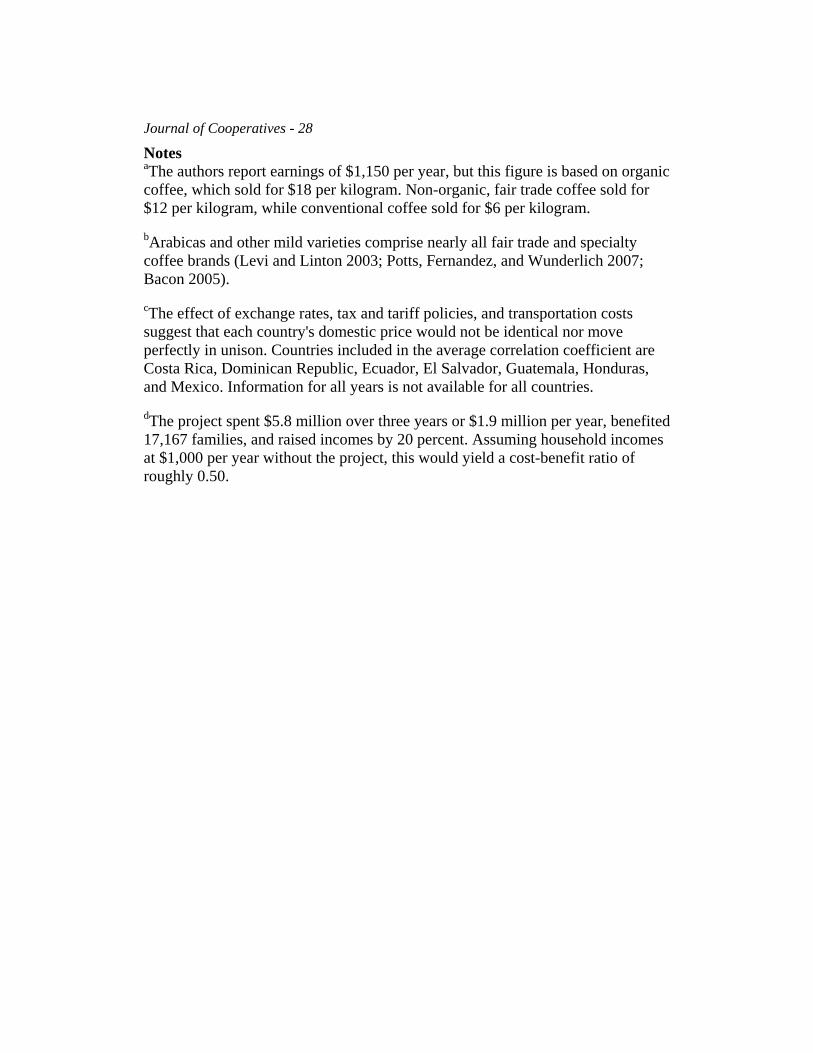
Notes aThe authors report earnings of $1,150 per year, but this figure is based on organic coffee, which sold for $18 per kilogram. Non-organic, fair trade coffee sold for $12 per kilogram, while conventional coffee sold for $6 per kilogram.
bArabicas and other mild varieties comprise nearly all fair trade and specialty coffee brands (Levi and Linton 2003; Potts, Fernandez, and Wunderlich 2007; Bacon 2005).
cThe effect of exchange rates, tax and tariff policies, and transportation costs suggest that each country's domestic price would not be identical nor move perfectly in unison. Countries included in the average correlation coefficient are Costa Rica, Dominican Republic, Ecuador, El Salvador, Guatemala, Honduras, and Mexico. Information for all years is not available for all countries.
dThe project spent $5.8 million over three years or $1.9 million per year, benefited 17,167 families, and raised incomes by 20 percent. Assuming household incomes at $1,000 per year without the project, this would yield a cost-benefit ratio of roughly 0.50.

29 Vol. 26 [2012]
References Agricultural Cooperative Development International and Volunteers in Overseas
Cooperative Assistance (ACDI/VOCA). 2010. "Project Profile: Colombia USAID Specialty Coffee Program." http://www.acdivoca.org/site/ID/colombiaCAFES/.
Bacon, C. 2005. "Confronting the Coffee Crisis: Can Fair Trade, Organic, and Specialty Coffees Reduce Small-Scale Farmer Vulnerability in Northern Nicaragua?" World Development 33 (3):497-511.
Becchetti, L., and B. Huybrechts. 2008. "The Dynamics of Fair Trade as a Mixed-Form Market." Journal of Business Ethics 81 (4):733-750.
Beyer, J. 2008. "The Impact of Fairtrade Coffee in Producer Countries." Honours Essay, Carleton University, Ottawa.
Booth, P., and L. Whetstone. 2007. "Half a Cheer for Fair Trade." Economic Affairs 27 (2):29-36.
Brent, R. 1998. Cost-Benefit Analysis for Developing Countries. Northampton, MA: Edward Elgar Publishing, Inc.
Conroy, M.E. 2001. "Can Advocacy-Led Certification Systems Transform Global Corporate Practices? Evidence and Some Theory." Political Economy Research Institute, University of Massachusetts Amherst.
Fairtrade International (FLO). 2007. "Annual Report 2007: An Inspiration for Change." Bonn.
Fairtrade International (FLO). 2010. "Growing Stronger Together: Annual Report 2009-10." Bonn.
Fairtrade International (FLO). 2012. "Celebrating Cooperatives."http://www.fairtrade.net/single_view1.html?&cHash=2e195f6a3bed9ac48fc93e29087cc07b&tx_ttnews[tt_news]=284.
FLO-CERT. 2011. "Fee System Small Producer Organization 1st Grade Explanatory Document" http://www.flo-cert.net/flo-cert/35.html?&L=0.
Garza, V.P., and E.C. Trejo. 2002. "One Cup at a Time: Poverty Alleviation through Participation in Fair Trade Coffee Networks." Fort Collins,

Journal of Cooperatives - 30
Colorado: Center for Fair and Alternative Trade, Colorado State University.
Getz, C., and A. Shreck. 2006. "What Organic and Fair Trade Labels Do Not Tell Us: Towards a Place-Based Understanding of Certification." International Journal of Consumer Studies 30 (5):490-501.
Giovannucci, D., and S. Ponte. 2005. "Standards as a New Form of Social Contract? Sustainability Initiatives in the Coffee Industry." Food Policy 30 (3):284-301.
Giovannucci, D., P. Liu, and A. Byers. 2008. "Adding Value: Certified Coffee Trade in North America." In Value-Adding Standards in the North American Food Market-Trade Opportunities in Certified Products for Developing Countries, edited by P. Liu. Rome: Food and Agriculture Organization of the United Nations, pp. 33-49.
Glazer, S. 2007. "Fair Trade Labeling: Is It Helping Small Farmers in Developing Countries?" CQ Researcher 17 (19):433-456.
Guthman, J. 2004. "Back to the Land: The Paradox of Organic Food Standards." Environment and Planning A 36 (3):511-528.
Hayes, M. 2006. "On the Efficiency of Fair Trade." Review of Social Economy 64 (4):447-468.
Hiscox, M.J. 2007. "Fair Trade and Globalization." Princeton, New Jersey: Memo prepared for the Conference on Europe and the Management of Globalization.
Hutchens, A. 2009. Changing Big Business: The Globalisation of the Fair Trade Movement. Northampton, MA: Edward Elgar.
International Coffee Organization (ICO). 2011. "Coffee Statistics." [CD-ROM] http://dev.ico.org/information_services.asp.
International Coffee Organization (ICO). 2011. "Conversion Factors for Roasted, Decaffeinated, Liquid and Soluble Coffee." http://dev.ico.org/documents/icc-106-2e-conversion-factors.pdf.
Jaffee, D. 2007. Brewing Justice: Fair Trade Coffee, Sustainability, and Survival. Berkeley and Los Angeles: University of California Press.

31 Vol. 26 [2012]
LeClair, M.S. 2002. "Fighting the Tide: Alternative Trade Organizations in the Era of Global Free Trade." World Development 30 (6):949-958.
Levi, M., and A. Linton. 2003. "Fair Trade: A Cup at a Time?" Politics and Society 31 (3):407-432.
Lindsey, B. 2003. "Grounds for Complaint? Understanding the "Coffee Crisis"." Trade Briefing Paper No. 16. Washington, D.C.: The Cato Institute.
Luetchford, P. 2011. "Case Studies: Coffee." In The Politics of Fair Trade: A Survey, edited by M. Warrier. New York: Routledge, pp. 116-122.
Lyon, S. 2007. "Maya Coffee Farmers and Fair Trade: Assessing the Benefits and Limitations of Alternative Markets." Culture and Agriculture 29 (2):100-112.
Moore, G., J. Gibbon, and R. Slack. 2006. "The Mainstreaming of Fair Trade: A Macromarketing Perspective." Journal of Strategic Marketing 14 (4):329-352.
Murray, D.L., L.T. Raynolds, and P.L. Taylor. 2006. "The Future of Fair Trade Coffee: Dilemmas Facing Latin America's Small-Scale Producers." Development in Practice 16 (2):179-192.
Mutersbaugh, T. 2005. "Fighting Standards with Standards: Harmonization, Rents, and Social Accountability in Certified Agrofood Networks." Environment and Planning A 37 (11):2033-2051.
Niemi, N. 2009. "The Price Elasticity of Demand of Fair Trade Coffee." Master's Thesis, Helsinki School of Economics, Aalto University, Töölö, Finland.
Osorio, N. 2002. "The Global Coffee Crisis: A Threat to Sustainable Development." London: International Coffee Organization (ICO).
Oxfam International. 2002. "Mugged: Poverty in Your Coffee Cup." Oxford, United Kingdom.
Parrish, B.D., V.A. Luzadis, and W.R. Bentley. 2005. "What Tanzania's Coffee Farmers Can Teach the World: A Performance-Based Look at the Fair Trade–Free Trade Debate." Sustainable Development 13 (3):177-189.
Journal of Cooperatives - 32
Pay, E. 2009. "The Market for Organic and Fair-Trade Coffee: Study Prepared in the Framework of FAO Project GCP/RAF/404/GER." Rome: Food and Agriculture Organization of the United Nations.
Ponte, S., and P. Gibbon. 2005. "Quality Standards, Conventions and the Governance of Global Value Chains." Economy and Society 34 (1):1-31.
Potts, J., G. Fernandez, and C. Wunderlich. 2007. "Trading Practices for a Sustainable Coffee Sector: Context, Strategies and Recommendations for Action." Winnipeg: International Institute for Sustainable Development.
Raynolds, L.T., D. Murray, and A. Heller. 2007. "Regulating Sustainability in the Coffee Sector: A Comparative Analysis of Third-Party Environmental and Social Certification Initiatives." Agriculture and Human Values 24 (2):147-163.
Rice, R.A. 2001. "Noble Goals and Challenging Terrain: Organic and Fair Trade Coffee Movements in the Global Marketplace." Journal of Agricultural and Environmental Ethics 14 (1):39-66.
Ronchi, L. 2002. "The Impact of Fair Trade on Producers and Their Organisations: A Case Study with Coocafé in Costa Rica." PRUS Working Paper No. 11. Brighton: Poverty Research Unit at Sussex. University of Sussex.
Ronchi, L. 2006. ""Fairtrade" and Market Failures in Agricultural Commodity Markets." World Bank Policy Research Working Paper 4011. Washington, D.C.: World Bank.
Schar, H.A., R. Vasquez, and K.D. Weiss. 1994. "Evaluation of the Coffee Revitalization Project (521-0216)." Washington, D.C.: United States Agency for International Development.
Schmelzer, M. 2010. "Marketing Morals, Moralizing Markets: Assessing the Effectiveness of Fair Trade as a Form of Boycott." Management and Organizational History 5 (2):221-250.
Tuvhag, E. 2008. "A Value Chain Analysis of Fairtrade Coffee with Special Focus on Income and Vertical Integration." Master Thesis, Department of Economics, Lund University, Lund, Sweden.

33 Vol. 26 [2012]
United States Agency for International Development (USAID). 2006. "Central America and Dominican Republic Quality Coffee Program (CADR QCP): Final Report." Washington, D.C.
Utting-Chamorro, K. 2005. "Does Fair Trade Make a Difference? The Case of Small Coffee Producers in Nicaragua." Development in Practice 15 (3/4):584-599.
Valkila, J., and A. Nygren. 2010. "Impacts of Fair Trade Certification on Coffee Farmers, Cooperatives, and Laborers in Nicaragua." Agriculture and Human Values 27 (3):321–333.
World Bank. 2011. "World Development Indicators." http://data.worldbank.org/data-catalog/world-development-indicators.
Wunderlich, J.U. 2011. "Free Trade, Fair Trade, and Globalization." In The Politics of Fair Trade: A Survey, edited by M. Warrier. New York: Routledge, pp. 12-23.
Zehner, D.C. 2002. "An Economic Assessment of "Fair Trade" in Coffee." Chazen Web Journal of International Business (Fall), http://www.gsb.columbia.edu/whoswho/getpub.cfm?pub=92.

Journal of Cooperatives - 34
Figure 1. Colombian farmgate price and New York wholesale price for green coffee, 2000-2010: June price for each year
Source: International Coffee Organization (2011)
0
50
100
150
200
25020
00
2001
2002
2003
2004
2005
2006
2007
2008
2009
2010
U.S
. cen
ts p
er p
ound
Colombian farmgate price New York wholesale price

35 Vol. 26 [2012]
Figure 2. Selected farmgate coffee prices (Arabica/milds) for Latin America, 2000-2010: June of each year
Source: International Coffee Organization (2011); Mexican prices not available for 2009 and 2010
0
20
40
60
80
100
120
140
160
180
200
2000
2001
2002
2003
2004
2005
2006
2007
2008
2009
2010
U.S
. cen
ts p
er p
ound
Costa Rica ColombiaDominican Republic Brazil

Journal of Cooperatives - 36
Figure 3. Annual net benefits from fair trade coffee to participating farmers, 2000-2008
Source: Authors' calculations
0
10
20
30
40
50
60
70
80
90
100
0
10
20
30
40
50
60
70
2000 2001 2002 2003 2004 2005 2006 2007 2008
doll
ars
per
farm
er
mil
lion
s of
dol
lars
total premiums earned

37 Vol. 26 [2012]
Table 1. Comparison of Colombian farmgate and New York wholesale price of green coffee, 2000-2010: June price for each year
Year Colombian farmgate price (US cents/lb.)
New York wholesale price (US cents/lb.)
New York markup over Colombian price (percent)
2000 72.77 100.30 37.8 2001 55.62 74.38 33.7 2002 53.32 60.86 14.1 2003 46.53 65.01 39.7 2004 63.19 78.27 23.9 2005 90.45 122.47 35.4 2006 79.98 106.84 33.6 2007 100.34 122.35 21.9 2008 119.90 150.60 25.6 2009 145.99 195.27 33.8 2010 176.43 229.06 29.8
Average 29.9
Source: International Coffee Organization (2011)

38 Vol. 26 [2012] Table 2. Estimated annual net benefits to fair trade coffee farmers, 2000 to 2008
Year Farmgate price (U.S. cents per pound) a
FLO price (U.S. cents per pound) b
Fair trade benefits, U.S. cents per pound of green coffee c
Global fair trade coffee exports (1,000 pounds of green coffee) d
Total fair trade coffee benefits to producers ($ millions) e
Number of participating fair-trade coffee farmers f
Annual benefits earned per farmer ($) g
2000 72.77 126 53.23 36,890i 19.6 525,573 37 2001 55.62 126 70.39 37,537ii 26.4 551,002 48 2002 53.32 126 72.68 40,982ii 29.8 576,431 52 2003 46.53 126 79.47 52,085 ii 41.4 601,860 69 2004 63.19 126 62.81 75,041iii 47.1 627,289 75 2005 90.45 126 35.55 88,996iv 31.6 652,718 48 2006 79.98 126 46.02 136,338iv 62.7 678,147 93 2007 100.34 131 30.66 162,863v 49.9 703,576 71 2008 119.90 135 15.10 172,285vi 26.1 729,005 36 Average 59 a June price paid to Colombian growers for green coffee (mild varieties) (ICO 2011) b Green coffee; price includes payment of either $0.05 or $0.10 per pound (Beyer 2008; FLO 2007; Tuvhag 2008) c FLO price less farmgate price d Various sources listed as follows. Where necessary, reported figures for roasted coffee converted to green equivalent by multiplying by 1.19 (ICO 2011):
i (Raynolds, Murray, and Heller 2007); ii (Murray, Raynolds, and Taylor 2006); iii data missing and interpolated using exponential regression of entire data series (average annual growth = 22.5%); iv (Giovannucci, Liu, and Byers 2008); v
(Luetchford 2011); vi (Pay 2009) e Per pound benefits multiplied times number of pounds exported f Data only available for 1996/97 (Rice 2001), 2000 (Conroy 2001), and 2005 (Raynolds, Murray, and Heller 2007). Column contains estimates from a linear regression based on these three points g Total gains divided by the number of participating farmers
39 Vol. 26 [2012]
Table 3. Net benefits to fair trade coffee farmers compared to additional fair trade expenditures by consumers, 2000 to 2008
Year
Total fair trade volume, roasted equivalent (1,000 pounds)
Retail "tax" paid by consumers if retail price increase equals $1 per pound ($ millions)
Retail "tax" paid by consumers if retail price increase equals $3 per pound ($ millions)
Ratio of consumer tax to farmer benefits if retail price increase equals $1 per pound
Ratio of consumer tax to farmer benefits if retail price increase equals $3 per pound
2000 31,000 31 93 1.6 4.7 2001 31,544 32 95 1.6 4.8 2002 34,439 34 103 1.8 5.3 2003 43,769 44 131 2.2 6.7 2004 63,059 63 189 3.2 9.6 2005 74,787 75 224 3.8 11.4 2006 114,569 115 344 5.8 17.5 2007 136,860 137 411 7.0 20.9 2008 144,778 145 434 7.4 22.1
Average 3.8 11.5
Source: Authors' calculations