journal of condensed matter nuclear science - cold...
TRANSCRIPT

JOURNAL OF CONDENSEDMATTER NUCLEAR SCIENCE
Experiments and Methods in Cold Fusion
VOLUME 22, February 2017

JOURNAL OF CONDENSED MATTER NUCLEAR SCIENCE
Experiments and Methods in Cold Fusion
Editor-in-ChiefJean-Paul BiberianMarseille, France
Editorial Board
Peter HagelsteinMIT, USA
Xing Zhong LiTsinghua University, China
Edmund StormsKivaLabs, LLC, USA
George MileyFusion Studies Laboratory,University of Illinois, USA
Michael McKubreSRI International, USA

JOURNAL OF CONDENSED MATTER NUCLEAR SCIENCE
Volume 22, February 2017
© 2017 ISCMNS. All rights reserved. ISSN 2227-3123
This journal and the individual contributions contained in it are protected under copyright by ISCMNS and the followingterms and conditions apply.
Electronic usage or storage of data
JCMNS is an open-access scientific journal and no special permissions or fees are required to download for personalnon-commercial use or for teaching purposes in an educational institution.
All other uses including printing, copying, distribution require the written consent of ISCMNS.
Permission of the ISCMNS and payment of a fee are required for photocopying, including multiple or systematiccopying, copying for advertising or promotional purposes, resale, and all forms of document delivery.
Permissions may be sought directly from ISCMNS, E-mail: [email protected]. For further details you mayalso visit our web site: http:/www.iscmns.org/CMNS/
Members of ISCMNS may reproduce the table of contents or prepare lists of articles for internal circulation within theirinstitutions.
Orders, claims, author inquiries and journal inquiries
Please contact the Editor in Chief, [email protected] or [email protected]

J. Condensed Matter Nucl. Sci. 22 (2017) 1–73
JOURNAL OF CONDENSED MATTER NUCLEAR SCIENCE
Volume 22 2017
©2017 ISCMNS. All rights reserved. ISSN 2227-3123
CONTENTS
PREFACE
RESEARCH ARTICLES
CR-39 Detector Track Characterization in Experiments with Pd/D Co-deposition 1Andriy Savrasov, Viktor Prokopenko and Eugene Andreev
Basic Design Considerations for Industrial LENR Reactors 7Jacques Ruer
On Plausible Role of Classical Electromagnetic Theory and Submicroscopic Physics tounderstand and Enhance Low Energy Nuclear Reaction: A Preliminary Review
27
Victor Christianto, Yunita Umniyati and Volodymyr Krasnoholovets
Oscillating Excess Power Gain and Magnetic Domains in NANOR®-type CF/LANRComponents
35
Mitchell R. Swartz
Development of a Cold Fusion Science and Engineering Course 47Gayle M. Verner, Mitchell R. Swartz and Peter L. Hagelstein
Probabilistic Models for Beam, Spot, and Line Emission for Collimated X-ray Emissionin the Karabut Experiment
53
Peter L. Hagelstein
Preface
This Volume 22 marks the tenth anniversary of the publication of the first volume of the Journal of CondensedMatter Nuclear Science. This journal was created to fill a void in the scientific world. Since the beginning, in 1989,the subject of Cold Fusion, discovered by Martin Fleischmann and Stanley Pons, has been, and is still, rejected by thescientific community. There was a need to go beyond the International Conferences on Cold Fusion proceedings topublish papers. It was necessary to have an internal way of communicating between scientists working together, justlike in any other field of science. From the very start, it was decided that the journal would be peer reviewed. Also,since ICCF16, the Journal publishes the proceedings of the conferences and workshops dedicated to Condensed MatterNuclear Science. A total of 312 papers have been published, 93 of them being conference proceedings.
I would like to thank all the anonymous referees those who have spent lot of time and effort to make the papers ofhigh quality. I have been pleasantly surprised to find that some of them do such a great job in improving the papers,they almost deserve to be listed as co-authors! I would like to thank Jed Rothwell for the great work which he is doingto improve the quality of the English of papers written by non-English speaking authors. It is also a pleasure to thankour Indian colleague Dr. Kumar who is doing an excellent job in the typesetting of the papers.
Please enjoy in reading this new volume.
Sincerely,
Dr. Jean-Paul Biberian( Editor-in-Chief )
February 2017

J. Condensed Matter Nucl. Sci. 22 (2017) 1–6
Research Article
CR-39 Detector Track Characterization in Experiments with Pd/DCo-deposition
Andriy Savrasov and Viktor ProkopenkoInstitute for nuclear research NAS of Ukraine, 47 Science ave., Kiev 03680, Ukraine
Eugene AndreevInstitute of physics NAS of Ukraine, 46 Science ave., Kiev 03680, Ukraine
Abstract
Four experiments replicating the GALILEO Project were performed. In two of them, excess ↵-particle track density was observedin the CR-39 detectors in comparison with background CR-39 detectors.c 2017 ISCMNS. All rights reserved. ISSN 2227-3123
Keywords: ↵-Particle, Co-deposition, CR-39 Detector, Electrolysis
1. Introduction
In LENR, the excess enthalpy production is followed in some cases by the generation of helium-4 [1] and neutrons [2].However reliable replication of successful results has been a serious problem. In 2007 a group of researchers from SanDiego [3] reported what they called the GALILEO project, in which they obtained anomalous tracks with a methodthey were able to replicate exactly.
The GALILEO project developers prepared for the experiment two cells made of plastic – one experimental andthe other a control cell. The control cell was similar to the experimental cell in all characteristics, timing and processeswith the sole exception that it used CuCl2 instead of PdCl2. The purpose of the controls was to show that the observedpitting was not due to chemical damage. In each cell electrolysis was conducted with 0.03 M PdCl2 and 0.3 M LiClsolutions in heavy water with a platinum anode and Pd, Ag, Ni or Au cathodes. The CR-39 track detector was incontact with the cathode. In the process electrolysis current was gradually increased from 0.1 to 0.5 mA. The solutionbecame completely transparent and all Pd accumulated on the cathode (plating phase) to (1–100 mA) – the chargingphase. During the last phase the nuclear events (presumably) occur. After the charging phase was finished the CR-39chips were taken from the solutions of both cells and were etched in etch solution (6.5 M NaOH in regular water) at
E-mail: [email protected].
c 2017 ISCMNS. All rights reserved. ISSN 2227-3123

2 A. Savrasov et al. / Journal of Condensed Matter Nuclear Science 22 (2017) 1–6
Table 1. Current quantity and duration during the experiments.
Experiment N1I(mA) 0.3 1 5 10t (h) 15a 10 14 17b
Experiment N2I (mA) 0.07 0.17 0.5 1 80 95 95t (h) 11.5 2 15 6.5c 2.5 4d 6Experiment N3I (mA) 0.05 0.1 0.15 0.05 3 10 30 90t (h) 26 18 24 65e 22 24 24 10.5Experiment N4I (mA) 0.1 2 5 10 2.5 80 80 85t (h) 74.5 17f 6 23 43 11g 8h 50aSolution became completely transparent.bCurrent decreased till 2.8 mA and did not increase any more. We have finished the experiment.cSolution became completely transparent.dPause – 11 h.eSolution became completely transparent.fSolution became completely transparent.gPause – 64 h.hPause – 20 h.
a temperature of 68C for 6 h. Next the track detectors were analyzed for the presence of pits similar to the tracksof alpha particles. There was a much higher number of tracks in the CR-39 chip in the experimental cell than in thecontrol cell. The control cell CR-39 chip had approximately the same number of tracks as the background CR-39 chip.Additional verification was carried out after irradiation of the track detector by a source of alpha particles of knownenergy and intensity.
As of today only eight groups of researchers [4] in the world have tried to replicate the reported results and only afew of them have obtained positive results. These first results reported at the conference of four groups in March 2007[5]. Other groups for various reasons have not been able to carry out the experiment. At the time of the conferencethere was a problem with the interpretation of tracks. Some believed that the tracks were due to the chemical damagecaused by oxygen and chlorine or even corona discharge [6]. All the teams brought CR-39 detector outside the cellclose to it (a dry experiment). After that pits were not observed in the detector, but that can be caused both lowerenergy of alpha particles and not taking into account water layers of varying thickness [7].
Based on what is described above, the purpose of this study was to replicate the GALILEO Project [3] in a wetconfiguration, which has the detector immersed in the cell and to obtain the ↵-particles tracks using a silver cathode.
2. Materials and Methods
During electrolysis, one cell was used, and the cell with CuCl2 solution was not used. Four experiments were done. Inall the experiments the same D2O, PdCl2, LiCl substances and anodes were used.
The cell was made from Quartz glass (outer size 1.1 2.4 4 cm, inner size 0.5 1.8 3.7 cm, wall thickness0.3 cm, volume 3.3 cm3). We bought this cell from the vender of chemical reactants in Kiev, called “Isotope.” Ourassembled cell in experiment N1 was the same as in the GALILEO project (except for the size), which was shown inphoto on page 16 of Ref. [3]. Heavy water, PdCl2 and LiCl salts, silver and platinum wires were bought from the samevendor. The Ag cathode placed in the electrolyte in this experiment was 0.1 mm thick and 48 mm long, while the Ptanode in the experiment N1 and in all following ones was 0.3 mm thick and its length was 147 mm in this experimentonly.

A. Savrasov et al. / Journal of Condensed Matter Nuclear Science 22 (2017) 1–6 3
Figure 1. Photo of the cell with cathode and anode assembles which used in experiments N2, N3 (a) and N4 (b).
It is necessary to note that the initial current was 300 µA during experiment N1. At lower current the cell had anegative potential. As a result of the initial current being too high, the plating was done non-uniformly on the surfaceof the cathode. The maximum current was only 10 mA (see Table 1), current density was J = 80 mA/cm2, cathodearea = 0.125 cm2 in experiment N1 and it did not increase any more. These circumstances became the possible reasonfor the insignificant number of excess tracks in the CR-39 chip in the solution in experiment N1, compared to thenumber of tracks in the background chip.
In experiments N2 and N3 cathode and anode assembles were used in which both the shapes and a spatial arrange-ment differed from ones described in Galileo protocol [3] (see Fig. 1(a)).
In these experiments the polyethylene base was absent. Both the cathode and anode were mounted on the sameCR-39 chip. In the chip openings were bored through and a silver wire (diameter – 0.1 mm, length – 42 mm) passedthrough them (in Fig. 1(a) this wire is more thin and is located in the middle of the CR-39 chip). Platinum anode(length – 62 mm) also was passed through the additional openings made in CR-39 and folded around the cathode fromthree sides (on the left, on the right and from below as shown in Fig. 1(a)). In experiments N2 and N3 both the anodeand cathode were located on one plane.
In experiment N4 the cathode with a bigger diameter (d = 0.3 mm, length – 72 mm) was used (see Fig. 1(b)),which was fastened on the CR-39 chip. The anode was mounted from the cell opposite side in the form of a wire withlength 31 mm (see Fig. 1(b)). In this experiment both cathode and anode were located in different planes, as opposedto the experiments N2 and N3. We used 15 mg of PdCl2 and 36 mg of LiCl on 2.8 ml of heavy water and this solutionwas poured in our cell. We added heavy water to the cell during the experiments. On average we added nearly 1.5 mlof heavy water per experiment.

4 A. Savrasov et al. / Journal of Condensed Matter Nuclear Science 22 (2017) 1–6
The CR-39 track detectors were fabricated in the Radium institute of V.G. Hlopina. They were wrapped in apolyethylene film the entire time, and stored in the freezer chamber of a refrigerator. The thickness of the CR-39 chipsis 300 µm and the velocity of etching – 1 µm/h. Dimensions of the track detectors were in the first experiment (Height width) – 1.5 1.0 cm, in the second and third ones – 3.3 1.5 cm, and in the fourth experiment – 3.6 0.8 cm.
We made a custom-built current source with power 3 W, made from the following components: transistor KP931A(range of values of a direct current on the exit: 20 µA – 95 mA) and transformer, which is switched in the alternatingcurrent network with U = 220 V (range of values of a direct voltage on an exit: 0–40 V). The resistance of the sourceon the exit is R 1 M.
When the experiments were terminated, the cell was disassembled and the CR-39 detectors were etched in anaqueous 6 M sodium hydroxide solution at 68–70C for 7.5 h. Microscopic examination of the etched CR-39 detectorswas done using an MTKF-1 microscope.
3. Results and Discussion
After etching, the number of excess tracks on the CR-39 detectors placed in electrolytic cell was compared to theCR-39 blanks. Extra tracks were observed in experiments N1 and N4. We used blank detectors which were exposedfor a week in the room in air near the experimental cell. The calculation of the number of pits was made by manualprocedures with the consecutive passage of the frames by MTKF-1 microscope. In experiment N1 on CR-39 in a cell,the track density 167 tr cm2 was measured (blanks 97 tr cm2), and in experiment N4 – 545 tr cm2 (back side –292 tr cm2).
We could best satisfy the condition of the GALILEO Project [3] only in experiment N4. We have carefully analyzedthis recent experiment.
Figure 2(a) and (b) shows two images taken at two different focal depths, at the surface (Fig. 2(a)) and bottom ofthe tracks (Fig. 2(b)) of the same CR-39 detector. This sample was in the electrolytic cell during experiment N4. Todetermine whether the pits are due to energetic particles or to chemical damage, we compared the pits obtained fromthe Pd/D co-deposition experiment with those obtained when CR-39 was exposed to an alpha particle source [8]. TheCR-39 detector was irradiated by 238Pu, 35 kBk activity for 3 s. The 238Pu nuclei decay on 234U irradiating alphaparticles with the following energy (intensity): 5.499 MeV (70.9%), 5.456 MeV (29.0%), 5.358 MeV (0.1%). Tracksare created by ↵-particles have the conic form. Figures 2(c) and (d) show two images taken at two different focaldepths (surface (Fig. 2(c)) and bottom of the tracks (Fig. 2(d))) of the same CR-39 detector, which was irradiatedby the ↵-particles. We used the microscope Axioscop 2 MAT mot (Carl Zeiss, Germany) with the digital chamberAxioCam MRc Rev 2 at high resolution to photograph the CR-39 chips shown in Fig. 2. This microscope is located inthe diagnostic centre for collective use at V. Lashkaryov Institute of Semiconductor Physics of NAS of Ukraine.
These tracks have a round form and dark color. When the microscope is focused more deeply in CR-39 than in thetrack centre a bright spot is observed (see Fig. 2(d)). This is caused by the bottom part of a conic track. The tracksalso have beautiful optical contrast range. These signs: the optical contrast range, the form and the bright spot in thetrack centre are important factors which help to distinguish the present ↵-particle tracks from chemical damage. Bycomparing Fig. 2(a) and (b) with Fig. 2(c) and (d) which are the ↵-particles tracks after 238Pu decay it is possible tosee that they are similar, but the track diameters of the ↵-particles are twice as large, as shown in Fig. 2(a) and (b). Wedo not have the calibration curve for a given CR-39 detector type, nevertheless the increase in diameter can be causedby both the longer etching times (7.5 h in comparison with 6 h for the CR-39 detector irradiated by ↵-particles from238Pu source), and possible smaller value of ↵-particle residual energy which are generated in the solution.
The photomicrographs were obtained using a magnification of 640.
On the entire surface of the CR-39 detector which was in the cell, the pits are distributed nonhomogeneously in area

A. Savrasov et al. / Journal of Condensed Matter Nuclear Science 22 (2017) 1–6 5
Figure 2. Images of pits in the CR-39 detector surface (Fig. 2(a)), and bottom (Fig. 2(b)) taken at two different focal depths of the same CR-39detector. This sample was in electrolytic cell during experiment N4. The similar images created by exposure to 238Pu source (Fig. 2(c) and (d)using a magnification of 640.
extent. Figure 3 shows the spatial distribution of the pits along the CR-39 surface. The count on the axis of abscises ismeasured from the upper part of the CR-39 detector to the depth of the cell. The thickness of the row is 0.22 mm. Thequantity of pits increases in the lower part of the CR-39 detector, but they are distributed regularly along the surface.There is no higher concentration of the pits near the cathode.
Unsuccessful experiments N2 and N3 prove that pits formed during Pd/D co-deposition are not due to radioactivecontamination of substances used in the experiments nor are they caused by impingement of gas bubbles on the surfaceof the CR-39, nor by chemical reactions of the surface of CR-39 with D2, O2 or Cl2 present in electrolyte. Themaximum current in experiment N4 was 85 mA, and its density J = 220 mA/cm2.
Based on the evidence presented above, it is possible to draw the following conclusions:
(1) The tracks on the CR-39 detector which were observed at their arrangement in electrolytic cells during exper-iments N1 and N4 had a nuclear origin.
(2) The source of the charged particles was in the solution volume adjacent to the CR-39 detector, and correlates

6 A. Savrasov et al. / Journal of Condensed Matter Nuclear Science 22 (2017) 1–6
Figure 3. Pits quantity on the row (N) in comparison with the depth of the immersion of CR-39 – detector in the solution (h).
with the Pd deposit.
References
[1] B.F. Bush, J.J. Lagowski, M.M. Miles and G.S. Ostrom, Helium production during the electrolysis of D2O in cold fusionexperiments, J. Electroanal. Chem. 304 (1991) 271–278.
[2] A. Battaglia, L. Daddi, S. Focardi, V. Gabbani, V. Montalbano, F. Piantelli, P.G. Sona and S. Veronesi, Neutron emission inNi–H systems, IL. Nuovo Cimento. 112 (9) (1999) 921–931.
[3] S. Szpak, P. Mosier-Boss and P. Gordon, The Galileo Project – Phase 1, 2007.Available from http://newenergytimes.com/v2/projects/tgp/2007TGP/2007GalileoProjectReport.pdf.
[4] S.B. Krivit, Galileo Project Report, 2007. Available from http://newenergytimes.com/projects/tgp/2007TGP/2007TGP-Report.shtml
[5] APS Mitting March 5, 2007, Colorado Convention Center.[6] P.A. Mosier-Boss, S. Szpak, F.E. Gordon and L.P.G. Forsley, Reply to comment on the use of CR-39 in Pd/D co-deposition
experiments: a response to Kowalski, Euro. Phys. J. Appl. Phys. 44 (2008) 291–295.[7] P.A. Mosier-Boss, S. Szpak, F.E. Gordon and L.P.G. Forsley, Characterization of tracks in CR-39 detectors obtained as a
result of Pd/D co-deposition, Euor. Phys. J. Appl. Phys. 46 (2009) 30901.[8] P.A. Mosier-Boss, S. Szpak, F.E. Gordon and L.P.G. Forsley, Use of CR-39 in Pd/D co-deposition experiments, Euro. Phys.
J. Appl. Phys. 40 (2007) 293–303.

J. Condensed Matter Nucl. Sci. 22 (2017) 7–26
Research Article
Basic Design Considerations for Industrial LENR Reactors
Jacques Ruer
Abstract
LENR reactors able to deliver heat at a high temperature can be coupled with heat engines to generate electric power. The conditionsof temperature and COP to achieve self-sustaining operation are given. According to the literature, the heat generation rate of someLENR processes increases rapidly with the temperature. This phenomenon dictates the cooling criteria to maintain a stable reactoroperation. Power control can be obtained through appropriate temperature regulation. Several types of heat engines can be coupledto LENR reactors with appropriate power control. Heat losses must be minimized with sufficient thermal insulation. The insulationenclosure is also useful to recover the leaks of light gas, if any are present in the system.c 2017 ISCMNS. All rights reserved. ISSN 2227-3123
Keywords: Gas leakage, Heat engines, Power control, Runaway, Self-sustaining, Stability, Thermal insulation
1. Introduction
Even if it is presently difficult to predict a precise timeframe, it can now be reasonably predicted that LENR reactorswill one day produce a sizeable source of power [1]. We focus in this paper on the particular class of LENR systemsthat produce excess heat at a temperature level sufficient to envisage the conversion of the heat into mechanical andelectrical energy.
Future progress in the field will form the basis of the technology applied for industrialization. Although it is notyet possible to describe the precise technology that will be utilized, some features that must be integrated in futurereactors can already be listed:
• Unless the reactor directly transforms the LENR phenomena into electricity, the reactors will produce heatthat will be converted into power via conventional heat engines.
• Because heat engines can only work with heat sources at a temperature above ambient, LENR reactors willpreferably operate at high temperature levels.
• LENR reactors require some form of excitation (in general in an electrical form), at least for the start-up phase.It is assumed here that the generation of LENR energy can be controlled to some extent via the regulation ofthe excitation input.
• It has now been reported by several authors that the energy generation increases with the temperature. Thedesign of the reactor must take this positive feedback into account.
E-mail: [email protected].
c 2017 ISCMNS. All rights reserved. ISSN 2227-3123

8 J. Ruer / Journal of Condensed Matter Nuclear Science 22 (2017) 7–26
Figure 1. Schematic diagram of an LENR generator including a reactor coupled with a heat engine. Electrical energies (power) are shown in blue,heat fluxes in orange. The sketch shows the following inputs/outputs. 1: Power input to the excitation supply, E
0
. 2: Excitation input to the reactor,E
1
= ↵E0
(↵ < 1). 3: Reactor heat loss: H1
. 4: Heat input to the engine at temperature Tr
: H2
. 5: Heat rejected by the engine at temperatureTa
, H3
. 6: Electricity exported, E2
. Note that the engine produces the electrical power Eout
= E + E2
.
This paper is a discussion of the above points.
Figure 2. Relationship between the temperature of the heat source (Thot
) and the typical efficiency of various thermal engines, Tcold = 25C.Compilation of various data by the author.

J. Ruer / Journal of Condensed Matter Nuclear Science 22 (2017) 7–26 9
Figure 3. Relationship between the temperature and the COP for different Z values, m
= 0.7, f = 1, Tcold = 25C.
2. Self-sustaining Operation
An LENR reactor consumes some energy to sustain its operation. If the quantity of electricity produced by the genera-tor exceeds the need of the power supply, there is a surplus of electricity that can be exported. This is the definition ofautonomous or self-sustaining operation. The parameters required to make such an operation possible are presented in[2] and reproduced here.
Different types of heat engines have been developed [3]. The thermodynamics teaches that such engines must takeheat (Hin) from a source at a high temperature (Thot) and reject a fraction to a heat sink at a lower temperature (Tcold)
[4]. They are characterized by their efficiency:
Figure 4. Plot of Eq. (16) between 300 and 500 K. The power is given in arbitrary units.

10 J. Ruer / Journal of Condensed Matter Nuclear Science 22 (2017) 7–26
Figure 5. Schematic temperature profile of an LENR reactor separated from the cooling medium by a heat resistance layer.
= Eout/Hin. (1)
The efficiency is limited by the Carnot formula:
c = 1 Tcold/Thot. (2)
The engines are not perfect, so that the effective efficiency is lower than the theoretical one:
= c m, (3)
where m is the relative machine efficiency.The machine efficiency includes all losses, e.g. the energy lost during the transformation of the mechanical energy
into electricity, or the energy required to drive ancillary components like pumps, fans, control system, etc. Figure 2shows the typical efficiencies attained by different types of thermal engines.
These equations can be utilized to determine the coefficient of performance (COP) required from the LENR reactorto obtain a self-sustained operation. The nomenclature of the energy fluxes is listed in Fig. 1. We write:
E1 = ↵E0, (4)
= Tr/Ta. (5)

J. Ruer / Journal of Condensed Matter Nuclear Science 22 (2017) 7–26 11
The heat loss H1 is written as a ratio of E using a dimensionless heat loss factor f :
H1 = f ( 1)E0. (6)
The efficiency is
= m( 1)/. (7)
The electrical power produced by the engine is
Eout = E0 + E2 = H2. (8)
We introduce the energy gain Z defined by
Z =
Eout
E0 1 =
E2
E0. (9)
A self-sustained operation is characterized by Z > 0
Eout = E0 + E2 = (1 + Z)E0 = H2, (10)
H2 = (1 + Z)E0/, (11)
COP↵E0 = H1 +H2, (12)
Figure 6. Cooling of an LENR reactor across a heat resistance. Any deviation of the temperature develops an instability.

12 J. Ruer / Journal of Condensed Matter Nuclear Science 22 (2017) 7–26
Figure 7. Cooling of an LENR reactor by a convective fluid flow. The temperature profile exhibits a pinch Tr Tf on the surface.
Figure 8. Cooling of an LENR reactor by a convective fluid flow. Any deviation of temperature is compensated by the system, the operation isstable.
J. Ruer / Journal of Condensed Matter Nuclear Science 22 (2017) 7–26 13
COP↵E0 = f( 1)E0 + (1 + Z)E0/. (13)
This yields
COP =
f( 1)
↵+
(1 + Z)
↵m( 1)
. (14)
Equation (14) allows the calculation of the COP required for a given heat loss factor and a desired Z value. Figure 3presents an example of results for an arbitrary set of parameters.
Figure 3 shows that the reactor temperature is a very important parameter to obtain self-sustaining operation. Italso shows that the heat loss through the insulation is obviously a detrimental factor that must be controlled as muchas possible.
3. Reactor Stability
3.1. Influence of the temperature
Several authors report that the LENR power measured in the experiments increases with the temperature [5–8].Arrhenius’ theory teaches that the rate of a process, for instance heat-producing reactions, is a function of an
activation energy E and the fuel temperature T [9].
W = AeE/kT , (15)
where W is the heat-production power, A, the pre-exponential factor, E, the activation energy, k, the Boltzmann’sconstant, and T the absolute temperature of the reactive medium.
If an experiment performed at different temperatures T1 and T2 yields the heat power levels W1 and W2, the aboveequation makes it possible to determine the activation energy:
log (W1) = log (A) E
kT1, (16)
log (W2) = log (A) E
kT2, (17)
log(W1/W2) =E
k
1
T2 1
T1
, (18)
E = k log (W1/W2)T1T2
T1 T2. (19)
In a recent paper [8], Storms reports a heat power curve well approximated by the equation:
logW = 4.54 1621/T . (20)
The corresponding activation energy is 1.8 kJ/mol. This value is close to the activation energy for deuterium diffusionin the lattice (1.9 kJ/mol). According to Storms, it is an indication that the role of the temperature is related to itsinfluence on the hydrogen diffusion coefficient.
Equation (20) is equivalent to
W = 34 600 e3732/T . (21)
14 J. Ruer / Journal of Condensed Matter Nuclear Science 22 (2017) 7–26
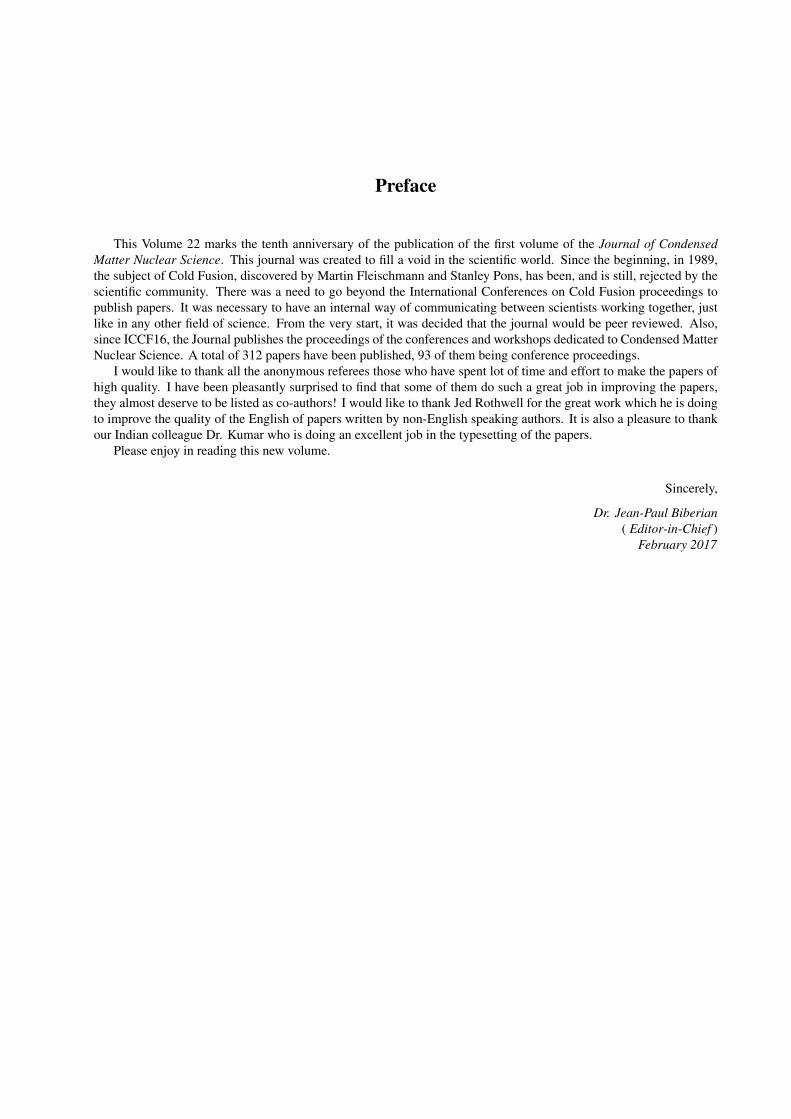
Figure 9. Schematic evaluation of the safe power limit. The LENR heat output involves bursts and fluctuations that must be taken into account todetermine the safe conditions of operation.
Figure 4 shows the corresponding curve for temperatures up to 500 K, although this is beyond the actual experimentspresented in [8].
The influence of the temperature must be taken into account in the design of the future reactors for the reasons thatare discussed in the following.
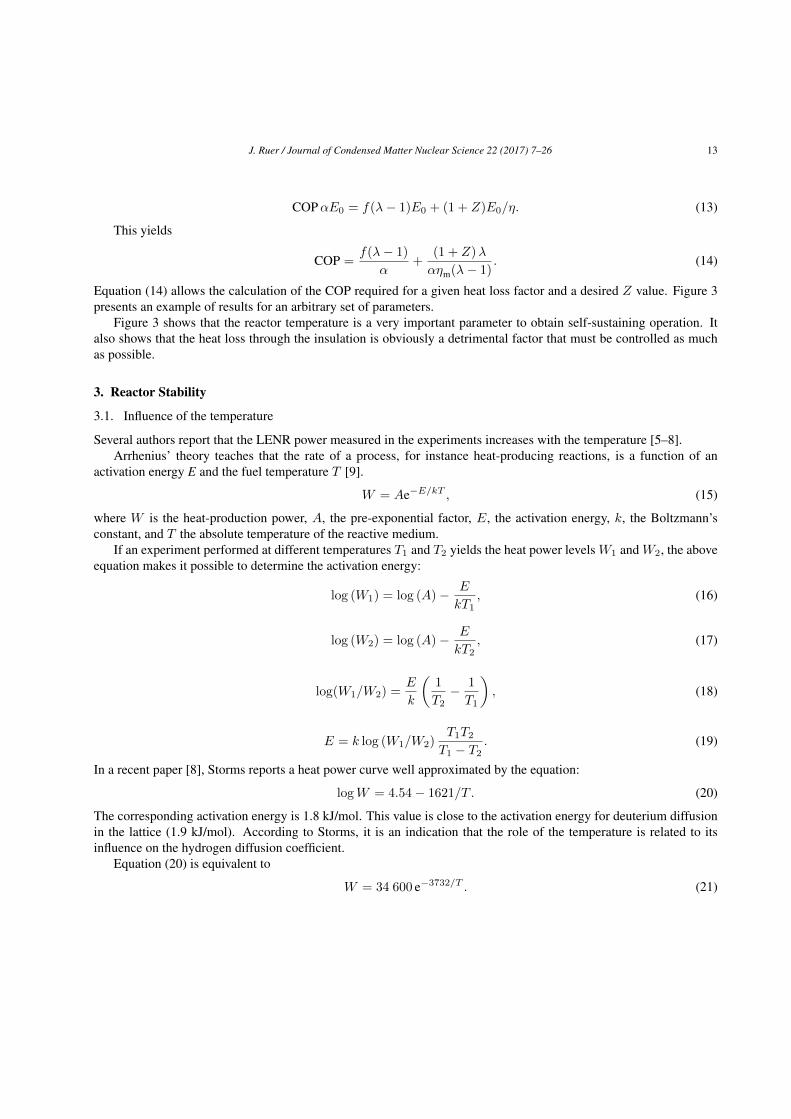
Figure 10. Power control increase. The fluid temperature is increased from T1
to T2
. The power is raised from P1
to P2
.

J. Ruer / Journal of Condensed Matter Nuclear Science 22 (2017) 7–26 15
Figure 11. Power control decrease. The fluid temperature is decreased from T1
to T2
. The power is reduced from P1
to P2
.
3.2. Thermal stability
Let us first consider Fig. 5. The reactor is separated from the cooling fluid by a thermal resistance layer. This con-figuration is found in many experimental setups. The heat flux is basically proportional to the difference between thereactor temperature Tr and the fluid temperature Tf .
Figure 6 compares the relationships between the temperature, the heat flux to the cooling fluid and the LENR heatoutput The theoretical operating point is located at point O, intersection of the two curves. The temperature at theinterface of the reactive material and the resistance layer is Tr, the heat power of the reactor is Pr. If the temperaturefor any reason is changed to Ta < Tr, the LENR power decreases to Pa, while the cooling heat exchange becomesP 0a. Figure 6 shows that Pa < P 0
a. This means that in such a case, the temperature can only drop further. The reactionslows down and the reactor stops.
Conversely, if the temperature is higher than Tr, the LENR power Pb is larger than the cooling capacity P 0b. The
temperature increases continuously. The reactor goes out of control. Cooling the reactor through a heat resistance layerleads therefore to an unstable configuration. The occurrence of an LENR excess heat may easily result in a runawayreaction.
Another configuration is shown in Fig. 7. The reactor is directly cooled by the fluid with a bulk temperature of Tf .The heat exchange between the reactor and the fluid can be described by the equation:
Pcooling = h (Tr Tf) , (22)
where h is the heat exchange coefficient, measured in W m2K1.The superposition of the LENR power curve and a cooling curve according to Eq. (22) is shown in Fig. 8. It
is supposed that Tf and the heat exchange coefficient h are such that the cooling curve intersects the power curve atpoint O. If the temperature becomes Ta < Tr, the power Pa exceeds the cooling flux P 0
a, so that the reactor returnsto the operating point. Inversely, if the temperature is higher than Tr, the cooling exceeds the LENR power, and thetemperature returns to Tr. We see that the intersection point O is stable.
The configuration shown in Fig. 7 allows stable operation. The reactor heat must be evacuated by a flow offluid organized in order to achieve a satisfactory exchange coefficient. The condition to be satisfied is given by the

16 J. Ruer / Journal of Condensed Matter Nuclear Science 22 (2017) 7–26
Figure 12. Schematic layout of an hypothetical LENR reactor. The thickness of the LENR cells is 2t. The cells are separated by gaps filled by thecooling fluid. Gap thickness is 2e.
relationship between the heat exchange coefficient and the slope of the power curve as given by the derivative of thepower curve equation:
h > dPLENR/dT. (23)
This condition must be obeyed in the system at any moment and any location. In fact, it is known that LENR sometimesoccur as local bursts of heat. The LENR power curve drawn in the above figure is therefore a simplification of theactual phenomena. Figure 9 presents a more realistic picture. The power curve is blurred, to illustrate that the local heatflux fluctuates even for a given temperature. In order to avoid instability, it is advisable to control the fluid temperatureand the power under safe limits.
3.3. Control of the reactor power
The power of LENR reactors can be controlled to some extent via the excitation energy input. However, some LENRdevices produce heat after death, meaning that the reaction proceeds even in the absence of excitation [5,6]. In suchcases, it is necessary to develop another method to control the energy output. The sensitivity of LENR to the tempera-ture can advantageously provide this additional mode of power control.
Figure 10 illustrates an LENR power curve and two different cooling lines. Let us suppose that the reactor is ini-tially operated at point O1. The cooling fluid temperature is then T1. Now, let us slightly increase the fluid temperature.The reactor temperature increases. The power rises to P2. This can be easily obtained via a temporary decrease of thefluid flow rate. This can also be accomplished by an external reheating of the fluid, especially during the startup phase,when the whole reactor system must be warmed up. This mode of control is called Power Control Increase or PCI.

J. Ruer / Journal of Condensed Matter Nuclear Science 22 (2017) 7–26 17
Figure 13. Schematic LENR reactor with gas cooling. The gas is distributed to obtain an uniform temperature Tf
all over the surface of the cells.
Similarly, the power can be reduced at will. Figure 11 shows that if the fluid temperature is lowered from T1 toT2, the reactor power is decreased from P1 to P2. This can be obtained via an additional cooling of the fluid before itenters the reactor. This mode of control is called Power Control Decrease or PCD.
If it is desired to stop the reactor, it is possible to quench it by circulating cold fluid for a sufficient time.
Figure 14. Schematic arrangement of an LENR reactor cooled by a forced flow of liquid (oil, molten salt or liquid metal) between the cells.
18 J. Ruer / Journal of Condensed Matter Nuclear Science 22 (2017) 7–26
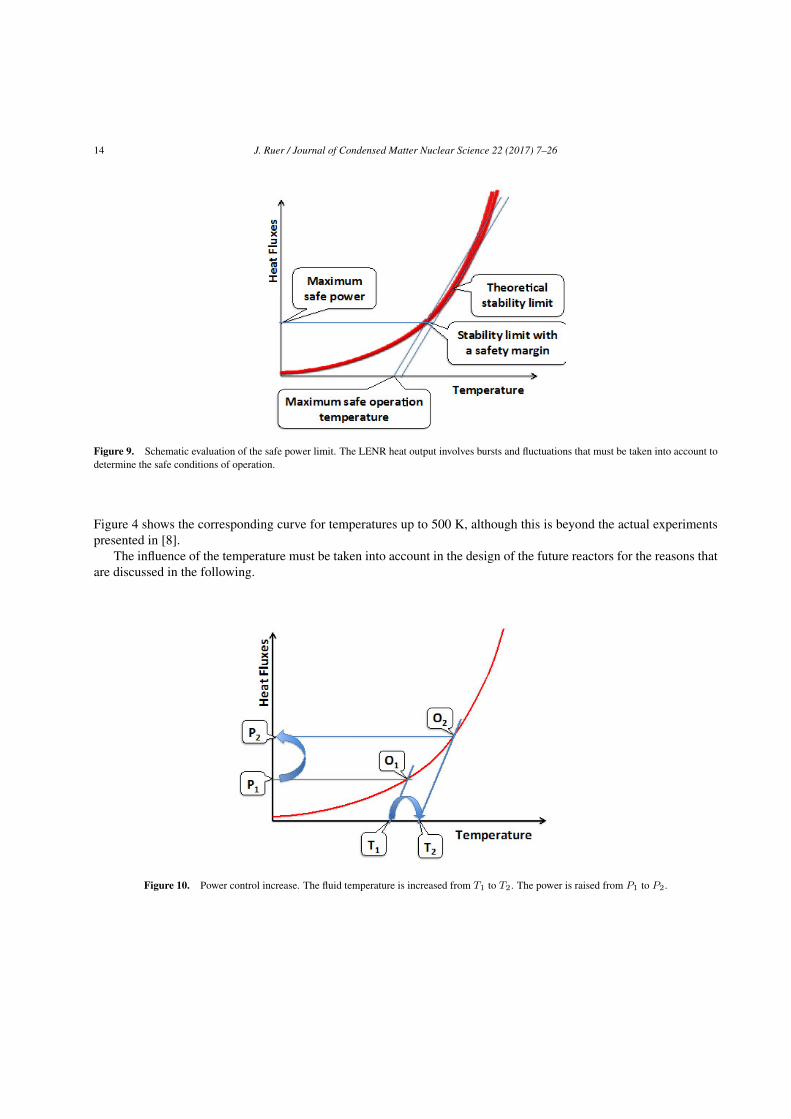
Figure 15. Schematic block diagram of an LENR power generator.
4. Potential Design of LENR Generators
4.1. Basic cooling methods
The above discussion leads to the basic design of an industrial LENR reactor. The LENR reactor must be cooled sothat the criteria of Eq. (23) is satisfied. The cooling fluid (gas or liquid) is hot, at a temperature slightly below Tr. To
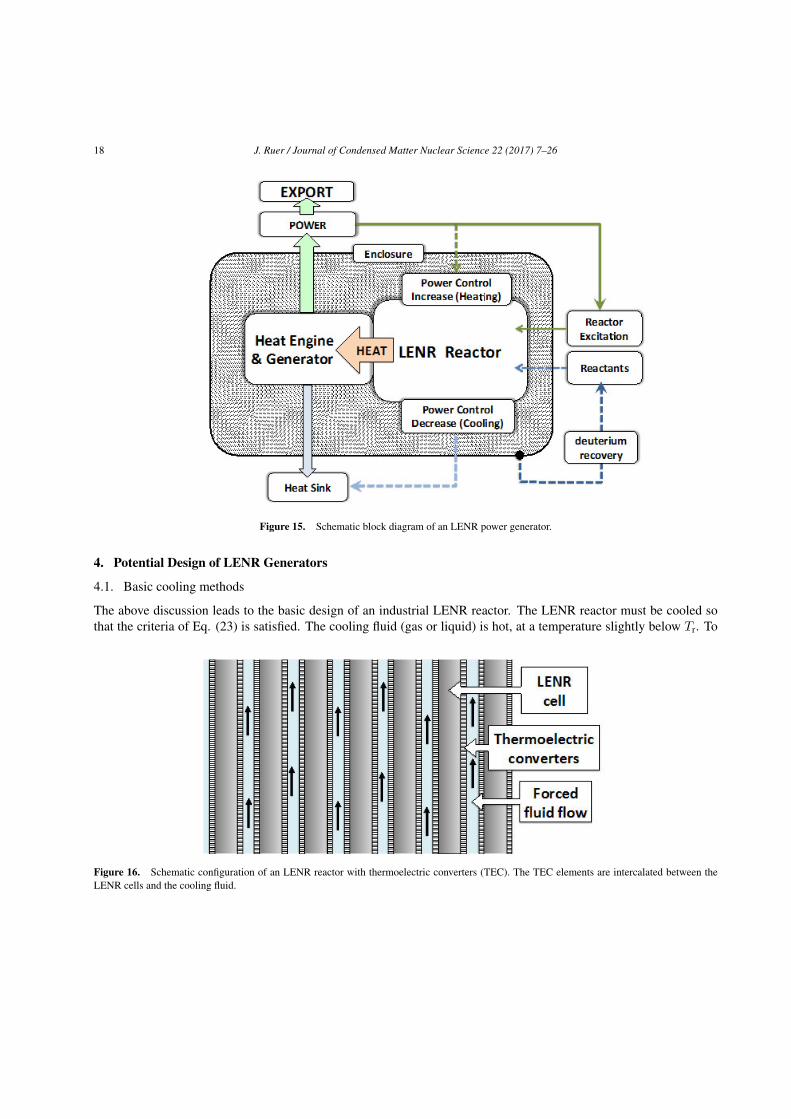
Figure 16. Schematic configuration of an LENR reactor with thermoelectric converters (TEC). The TEC elements are intercalated between theLENR cells and the cooling fluid.

J. Ruer / Journal of Condensed Matter Nuclear Science 22 (2017) 7–26 19
make the heat flow out of the LENR active material possible, this material is confined in multiple cells. The shape ofthe cells is prismatic, planar or tubular. The gap between adjacent cells is filled by the forced flow of cooling fluid.The sizing of the cell thickness is governed by the heat flow capacity across the active material, and by the heat fluxexchanged with the fluid.
In order to clarify the above, let us consider a theoretical example (see Fig. 12). We imagine a hypothetical LENRsystem characterized by a power density of 1 W cm 3, or 1 MW m 3. The supposed operating temperature is 600Cor 873 K. The LENR cells are square slabs 1 m 1 m with a thickness 2t = 20 mm. They are cooled on both sides,and the heat flux on each face is 10 kW. The fluid circulates in the gaps between adjacent cells upwards along thewhole height. Two different cases are examined in Table 1, cooling by a forced gas flow and a forced flow of liquid.
Table 1. Comparison of the cooling of an hypothetical LENR reactor by a gas or a liquid.
Gas cooling Liquid coolingHeat flux at interface 104 W m2 104 W m2
Typical fluid heat capacity 103 J N m3K1 106 J m 3K1
Fluid flow rate 0.1 N m3s1 (atmospheric pressure) 103 m3s1
Gap thickness: 2e 20 mm 5 mmFluid velocity 32 m s1(atmospheric pressure) 0.4 m s1
Typical exchange coefficient (9) 102 W m2K1 103 W m2K1
Delta T solid–fluid 100 K 10 KTemperature inlet 400C 580CTemperature outlet 500C 590C
In the case of gas cooling, the temperature difference adopted between the gas inlet and the gas outlet is 100 K. Atypical gas heat capacity is 103 J N m3K1. The evacuation of the heat requires a flow of 0.1 N m3s1. We supposethat the gap thickness is 20 mm. If the pressure is atmospheric, the gas velocity is 32 m s1. This is acceptable.However, the velocity is lower if a higher pressure is used. The heat exchange coefficient h between the cell and a gasflow is typically 100 W m2K1 [10]. The gas enters at 400C and leaves at 500C. The engine performance musttake these values into account, rather than Tr. Figure 13 presents a potential configuration with gas cooling. Becausethe LENR power is sensitive to the temperature, the gas circulation is organized to obtain a progressive mixing of thecold and the hot gas, so that the value of Tf remains constant over the whole cells surface.
In the case of liquid cooling, the temperature difference adopted between the liquid inlet and outlet is 10 K. Atypical heat capacity for a liquid medium is 106 J m3K1. The evacuation of the heat requires a flow of 103 m3s1,or 1 l.s1. We suppose that the gap thickness is 5 mm. The velocity of the liquid in the gap is 0.4 m s1.
The heat exchange coefficient h between the cell and a forced flow of liquid is typically 103 W m2K1 [9]. Thetemperature difference according to Eq. (22) is then 1 K. The liquid enters at 580C and leaves at 590C. These valuesare very close to Tr. Figure 14 presents a potential configuration with cooling by a liquid fluid. A simple film flow issuitable. The fluid flow rate is low and a narrow gap is sufficient. Another option is to immerse the cells in a boilingliquid. Heat exchange between a hot surface and a boiling fluid is very high [10]. This type of cooling is, for example,adopted in nuclear boiling water reactors (BWR). Boiling cooling may represent the best option for reactors with alarge LENR power density.
4.2. LENR generators generic configuration
Figure 15 presents a schematic block diagram of a complete LENR power generator. The LENR reactor is linkedto an excitation system and a supply of reactants. The heat is transferred to a heat engine by direct contact or via acirculating loop of hot fluid.

20 J. Ruer / Journal of Condensed Matter Nuclear Science 22 (2017) 7–26
Figure 17. Coupling with an Ericsson engine.
The engine transforms the heat into mechanical power. The engine is coupled to an electrical generator thatproduces electricity. A fraction of the electrical energy is used to energize the excitation supply and the other controlsystems. The surplus is exported. The power is controlled via the level of excitation. Additional control is providedwith PCI and PCD functions. An enclosure confines the whole assembly. The roles of the enclosure are discussedbelow.
This general description must be adapted following the exact type of reactor and engine used. In order to explainhow these principles can be translated into design features, some examples are detailed in the following.
4.3. Coupling with various heat converters
4.3.1. Thermoelectric converters
Figure 16 shows a LENR reactor made of reactive cells covered by thermoelectric heat converters (TEC) [11]. Thebacksides of these panels are cooled to remove the heat. Initial warming can be obtained by applying a DC current inthe TECs to use them temporarily as heaters during the startup phase. The level of power extracted from the reactivecells can be regulated through the amount of electrical current exported. This makes fine PCI or PCD possible. ForcedPCD cooling can be obtained with the help of an external DC source to enhance the heat removal. To date, the thermalefficiency of TECs is too low to make this solution viable. The situation may change when new TEC devices becomeavailable [12,13]. This type of LENR generator would be attractive because of the absence of moving parts other thanthe cooling fluid pump.

J. Ruer / Journal of Condensed Matter Nuclear Science 22 (2017) 7–26 21
4.3.2. Ericsson engine generator
Figure 17 shows an Ericsson engine, which includes expansion and compression cylinders, fitted with admission andexhaust valves. A heat exchanger recuperates a large part of the heat not transformed into mechanical energy, so thatthe efficiency is good [14].
The recuperator and the cooler may have large sizes. This reduces the gas pressure drops, and the associatedenergy losses. The pressure drops are also dramatically reduced if the gas loop is pressurized. The metallurgical heatresistance of the hot parts limits the working temperature of an Ericsson engine to approximately 600C.
PCI takes the form of an ancillary gas re-heater arranged on the gas line entering the reactor. This re-heater allowsthe reactor warming for the startup phase. During that period, the engine does not yet produce power. An ancillaryblower must provide the gas circulation. Alternatively, the gas is circulated by the engine itself, driven by the generatorused temporarily as a motor. PCD can be finely tuned during operation via a by-pass of the recuperator, as shown inthe picture. PCD forced cooling is also feasible with another cooler combined with the ancillary blower.
The PCD can be finely tuned during operation via a by-pass of the recuperator, as shown on the picture. The PCDforced cooling is also feasible with another cooler combined with the ancillary blower.
4.3.3. Brayton gas turbine
A closed loop gas turbine with the Brayton cycle is a suitable heat engine if the temperature exceeds about 700C(see Fig. 2) [15]. Figure 18 shows the configuration. It is quite similar to the Ericsson system, except that rotating
Figure 18. Coupling with a closed cycle gas turbine.

22 J. Ruer / Journal of Condensed Matter Nuclear Science 22 (2017) 7–26
Figure 19. Coupling with a Stirling engine (two pistons type). The heat is transferred from the reactor to the engine hot exchanger by a hot fluidloop.
equipment replaces the volumetric machines. During startup, the generator is used temporarily as a motor. The PCI isincluded as a gas re-heater before the reactor. A recuperator by-pass line provides the PCD function.
4.3.4. Stirling engine
Figure 19 schematizes the coupling of an LENR reactor with a Stirling engine. In this type of engine, a confined massof gas is alternatively transferred between a cold and a hot cylinder, while being heated or cooled. A heat regeneratorgreatly improves the thermal efficiency. There are no gas valves. Several types of Stirling engines exist, with differentarrangements of the cylinders [16].
The gas volume enclosed in the exchangers and regenerator must be commensurate with the volume swept by thecylinders. The size of the exchangers is therefore limited, and this gives a limit to the actual efficiency and powerdensity of the Stirling engines. The working gas is preferably of high conductivity (H2 or He). In order to controlthe effect of the viscous pressure drops, the gas circuit is pressurized The temperature in the hot exchanger is limitedbelow about 700C to withstand the high pressure. Because of the limited size of the hot exchanger, it is beneficialto input the heat by a fluid (gas or liquid) heat transfer circuit, as shown in Fig. 19. A pump drives the heating fluidcirculation. A re-heater installed in the fluid loop provides the PCI function. The PCD is obtained via a cooler alsoinserted in the circuit. The heating fluid loop is started before and independently from the Stirling engine.

J. Ruer / Journal of Condensed Matter Nuclear Science 22 (2017) 7–26 23
Figure 20. Coupling with an ORC turbine.
4.3.5. Organic Rankine cycle
Figure 20 shows the principle of an Organic Rankine Cycle (ORC) turbine coupled with an LENR reactor. An organicfluid is vaporized under pressure in the boiler. The vapor is expanded in the turbine. The residual heat of the lowpressure vapor is recovered in the heat exchanger. The vapor is condensed, and the liquid is pumped back to the boiler[17].
This description seems similar to a steam turbine. The use of an organic compound simplifies the overall design,because for a given temperature the pressure level can be much lower than for steam. In most cases, the turbine
Figure 21. Boiling LENR reactor. The fluid boils between the cell gaps. PCI: The re-heating of the reactor is provided by an ancillary heaterimmersed in the boiler. PCD: A vapor scavenging line allows the cooling of the boiling fluid.

24 J. Ruer / Journal of Condensed Matter Nuclear Science 22 (2017) 7–26
includes only one or two stages of blades. Contrary to steam, the expansion of the organic vapor does not result inpartial condensation. The absence of liquid droplets in the vapor stream eliminates the potential erosion of the turbineblades. Many different compounds are available following the temperature, between 100C and 350C [18].
The heat transfer fluid can be oil, a liquid salt or metal. It may also be a diphasic circuit, for example pressurizedsteam vaporized in the LENR reactor and condensed in the ORC boiler. This last option is interesting if the LENRreactor is a high temperature electrolytic system, provided the COP of the process is sufficient. To increase the power,the LENR reactor is re-heated by a PCI unit arranged on the hot fluid loop or inside the reactor When the operationtemperature increases, the vapor pressure in the boiler increases as well. A throttling valve regulates the vapor flowrate admitted in the turbine.
The PCD may be a cooler installed on the fluid loop. A vapor line directly linked between the boiler and thecondenser can provide additional cooling. Scavenging vapor results in a fast cooling of the fluid contained in the ORCboiler.
4.3.6. Boiling reactor
Figure 21 shows a boiler heated by LENR cells, coupled to a turbine. Future large reactors operated between 200Cand 300C may use a technology similar to BWR, with water as a cooling fluid and condensing steam turbines [19].However, as LENR does not suffer of the same constraints as fission reactors in terms of materials and neutron flux,organic fluids or other chemicals may replace water. This will make it possible to operate with modest pressures. Smallunits are also feasible.
4.3.7. Classification of the potential techniques
The different techniques for heat transfer and heat engines are summarized in Fig. 22 according to their typicaltemperature domain. The range of possibilities is very large and this sketch is only indicative.
Figure 22. Typical temperature domains for reactor cooling and heat engine types.

J. Ruer / Journal of Condensed Matter Nuclear Science 22 (2017) 7–26 25
4.4. Enclosure design
The last item visible in Fig. 15 is the enclosure that surrounds the whole generator assembly. The enclosure serves adual purpose:
• Limits the thermal losses to the environment.• Avoids the hydrogen (deuterium) loss to the atmosphere.
Heat losses originate at the LENR reactor walls, the hot parts of the heat engine, the heating fluid piping. These piecesmust be adequately insulated in order to limit heat transfer to the environment by conduction, convection and radiation.
Some LENR processes require the presence of hydrogen (H2) or deuterium (D2) to drive the reactions. It issupposed that the LENR cells are inserted in metallic containers. The walls of these containers are hot during operation.At high temperature, H2 or D2 diffuse through the metals. This is a problem in the case of D2, because this expensivegas must be conserved as much as possible.
The light gases leak out of the cells and accumulate in the cooling fluid, gaseous or liquid. The cooling fluid loopmust be designed to accommodate their presence. Because the partial pressure of the light gas in the cooling fluid isnonzero, from there, it can diffuse further within the atmosphere of the thermal insulation material. It is supposed thatthe temperature of the enclosure wall is close to the ambient, and that all passages through the wall are gas tight, sothat the enclosure does not leak any H2 or D2. The light gas accumulates within the insulation lagging. From there, itmay be recovered by a gas separation unit.
The presence of light gases in the insulation increases the gas thermal conductivity and adversely influences theinsulation performance. The higher conductivity must be taken into account.
5. Conclusion
The LENR reactors able to deliver heat at a high temperature can be coupled with heat engines to generate electricalpower. If the temperature and the COP are sufficient, the power covers the needs for the reactor excitation and surpluselectricity is available for external use
According to the literature, the heat generation rate of some LENR processes increases rapidly with the tempera-ture. It is desirable that the R&D related to all LENR processes includes the study of the influence of the temperature.The future industrial reactors will have to be designed in order to guarantee a safe and stable operation. Cooling isachieved by a fluid in direct contact with the reactive cells. Power control can be obtained through an appropriatetemperature regulation. Several types of heat engines can be coupled to LENR reactors to generate electricity.
Heat losses must be minimized thanks to a sufficient thermal insulation. The insulation enclosure is also usefulto recover the leaks of light gas if any. This may be an important economical factor if deuterium is utilized in hightemperature reactors.
Acknowledgments
The author acknowledges and thanks the referee for his editorial assistance and very helpful comments and suggestions.
References
[1] M. Srinivasan and A. Meulenberg (Guest Editors), Current Science, Special section, Low Energy Nuclear Reactions 108(4)(2015).
[2] J. Ruer, Characterization of energy fluxes in LENR reactors, excess heat, coefficient of performance and conditions forself-sustained operation, J. Condensed Matter Nucl. Sci. 21 (2016) 18–30.

26 J. Ruer / Journal of Condensed Matter Nuclear Science 22 (2017) 7–26
[3] Heat engine, https://en.wikipedia.org/wiki/Heat_engine.[4] Thermal efficiency, https://en.wikipedia.org/wiki/Thermal_efficiency.[5] M. Fleischmann and S. Pons, Calorimetry of the PdD–D2O system: from simplicity via complications to simplicity The
Third Int. Conf. on Cold Fusion, 1992, Nagoya, Japan, Universal Academy Press, Tokyo, p. 47.[6] E. Storms, The Explanation of Low Energby Nuclear Reaction, Infinite Energy Press, 2014, p. 216.[7] J.-P. Biberian, G. Lonchampt, L. Bonnetain and J. Delepine, Electrolysis of LaAlO3 single crystals and ceramics in a deu-
teriated atmosphere, The Seventh Int. Conf. on Cold Fusion, 1998, Vancouver, Canada, ENECO Inc., Salt Lake City, UT, p.27.
[8] E.K. Storms, How basic behavior of LENR can guide a search for an explanation, J. Condensed Matter Nucl. Sci. 20 (2016)105–143.
[9] Arrhenius equation, Wikipedia, https://en.wikipedia.org/wiki/Arrhenius_equation.[10] Thermopedia, Heat Transfer Coefficient, www.thermopedia.com/content/841/ .[11] Thermoelectric generator ], Wikipedia, https://en.wikipedia.org/wiki/Thermoelectric_generator.[12] Thermoelectric materials , Website of the TU-Chemnitz,
https://www.tu-chemnitz.de/physik/OFGF/research/thermoelectrics.php.[13] H. Schock, G. Brereton, E. Case, J. D’Angelo, T. Hogan, M. Lyle, R. Maloney, K. Moran, J. Novak, C. Nelson, A. Panayi,
T. Ruckle, J. Sakamoto, T. Shih, E. Timm, L. Zhang, and George Zhu, Prospects for implementation of thermoelectricgenerators as waste heat recovery systems in class 8 truck applications, J. Energy Resour. Technol. 135 (2013) 022001.
[14] ] Wikipedia, Ericsson engine, https://en.wikipedia.org/wiki/Ericsson_cycle.[15] Wikipedia, Closed-cycle gas turbine, https://en.wikipedia.org/wiki/Closed-cycle_gas_turbine.[16] Wikipedia, Stirling engine https://en.wikipedia.org/wiki/Stirling_engine.[17] Wikipedia, Organic Rankine cycle. https://en.wikipedia.org/wiki/Organic_Rankine_cycle.[18] Ngoc Anh Lai, Martin Wendland and Johann Fischer, Working fluids for high-temperature organic Rankine cycles, Energy
36 (2011) 199–211.[19] Wikipedia, Boiling water reactor, https://en.wikipedia.org/wiki/Boiling_water_reactor.

J. Condensed Matter Nucl. Sci. 22 (2017) 27–34
Research Article
On Plausible Role of Classical Electromagnetic Theory andSubmicroscopic Physics to understand and Enhance Low
Energy Nuclear Reaction: A Preliminary Review
Victor Christianto∗, †,‡
Malang Institute of Agriculture (IPM), Jl. Soekarno-Hatta, Malang, Indonesia
Yunita Umniyati §,¶
Head of Physics Laboratory, Swiss-German University, BSD City, Tangerang, Indonesia
Volodymyr Krasnoholovets∥Institute of Physics, Kyiv, Ukraine
Abstract
In this paper, we discussed how we can study some effects associated with LENR/CMNS from the principles of classical electro-magnetic theory, and also from a very new approach based on a submicroscopic concept of physics. Perhaps our considerationshave their own risks because the majority of mainstream physicists consider nuclear fusion rather as a phenomenon associated withtunneling through a Coulomb barrier, which is a pure quantum effect. We will discuss that there are some aspects of classicalelectromagnetic theories which may have impact on our understanding on LENR/CMNS phenomena, including: (a) nonlinear elec-trostatic potential as proposed by Eugen Andreev, (b) vortex sound theory of Tsutomu Kambe, (c) nonlinear ponderomotive force,and (d) submicroscopic consideration.c⃝ 2017 ISCMNS. All rights reserved. ISSN 2227-3123
Keywords: Classical electromagnetic theory, Coulomb barrier suppression, Electronuclear potential, Nuclear Van der Waals force,Ponderomotive force, Subdeuterium, Submicroscopic physics, Vortex sound theory
∗E-mail for correspondence: [email protected].†Founder and CEO of www.Ketindo.com.‡URL: http://www.researchgate.net/profile/Victor_Christianto.§E-mail: [email protected].¶Research & E-learning Development Director of www.Ketindo.com.∥E-mail: [email protected].
c⃝ 2017 ISCMNS. All rights reserved. ISSN 2227-3123

28 V. Christianto et al. / Journal of Condensed Matter Nuclear Science 22 (2017) 27–34
1. Introduction
Since Pons and Fleischmann reported their experiments in 1989, many labs in the world tried to replicate their results,but many failed. Thereafter, there was a wave of rejection to their claim of table-top nuclear fusion at room temperature.Some establishment physicists even called “cold fusion” pathological science. But many nonmainstream physicistsand chemists continued their works in an underground manner. Also some eminent physicists have taken risks to jointhis underground movement, including Prof. Peter Hagelstein from MIT.
But the rejection of mainstream physics towards cold fusion/LENR remains strong. Even the famous Prof. BrianJosephson from Cavendish Lab. in Cambridge University was denied access from arXiv server because of his endorse-ment to E. Storms’ works. He went on to write a paper suggesting that such a denial of many successful experimentsrelated to cold fusion/LENR can be called “pathological disbelief.”
In this context, allow us to recall a story that was told to the first author (VC) several times by Dr. Iwan Kurniawan,a nuclear engineer from Indonesia.a When he was a doctoral student in a University in Japan in the 1990s, his professorinvited him to do an experiment related to cold fusion in the physics lab. After setting all the apparatus properly, theywent home. In the morning, they were surprised that all the apparatus was blown up and it damaged the windowglasses in lab. Dr. Iwan told me that since then he concluded that cold fusion does not work as claimed by Pons andFleischmann.
He has been one of our good friends for a long time, and he and VC often discussed many things. But we havea different opinion regarding his cold fusion experiment: the fact that the apparatus blew the entire lab indicates thatthere was huge energy release in the device, so huge that it damaged the window glass. The problems appear tocome from at least two aspects: (a) poorly understood mechanism of the reaction and (b) the reactor failed to workproperly. So, it is basically similar to reactor meltdown in a usual fission reactor. We need to learn what makes theircold fusion reactor failed. It is not because there is no energy inside the system, but because there was a huge energyrelease. Reactor shutdown has recently been admitted as one of the real problems in many LENR reactors, and this isa challenge for experimenters and companies who want to design commercial LENR reactors [8–10].
However, in this paper we will not repeat such debates that have been discussed many times elsewhere. Insteadwe will discuss how we can study some effects associated with LENR from the principles of classical electromagnetictheory. We are aware that this approach has its own risks, because many physicists consider that nuclear fusion shouldbe associated with tunneling through Coulomb barrier, and this kind of tunneling is a pure quantum effect. But is thattrue?
We will discuss the possibility there are some aspects of Classical electromagnetic theories which may have animpact on our understanding on LENR phenomena, including: (a) nonlinear electrostatic potential as proposed byEugen Andreev, (b) vortex sound theory of Tsutomu Kambe, and (c) nonlinear ponderomotive force. The latter aspecthas been proposed recently by Lundin and Lidgren in order to understand the mechanism of LENR [13,14].
It is our hope that this paper will motivate young electrical engineers to study LENR phenomena from new per-spectives starting from classical electromagnetic theories. In short, classical electromagnetic theories still offer manysurprises to those who are willing to dig deeper into the hidden mysteries of nature.
2. Nonlinear Electrostatic Potential of Eugen Andreev
In modern physics, there is a firm conviction based on the vast empirical material that:
• The electromagnetic and nuclear interactions are of a different nature.• The field of electric charge (proton, electron) is spherically symmetric.
aSpecial thanks to Dr. Iwan Kurniawan for telling his first-hand experiment with cold fusion. Wishing you will recover soon, brother!

V. Christianto et al. / Journal of Condensed Matter Nuclear Science 22 (2017) 27–34 29
• The nucleon–nucleon forces depend on the direction.
In his paper, Andreev [1] suggested a hypothesis that the notion of the nuclear interaction could be interpreted as anonlinear distribution of the electrostatic potential, which manifests itself on the Fermi scale. An analytical form ofthe potential of the proton is proposed, which coincides with conventional forms used in the nuclear physics at a shortscale, but becomes the usual Coulomb potential at a large scale.
The model potential possesses a set of properties that could be called “nuclear van der Waals forces.”Coulomb’s law can be written in integral form as follows [1].
φ(x, y, z) =kφ
R= −k
!!!
v
div(∇φ(x, y, z))dV"(x2 + y2 + z2)
. (1)
If we replace R with Rdd, which is defined as follows:
Rdd =#x2 + y2 + β2z2 + r2o. (2)
Then we will have a two parameter field potential [1]
ϕ(x, y, x,β, r0) =ϕ
R+ r0(3)
or
ϕ(x, y, z,β, r0) = [φ]
$k1Rdd
+k2%%Rdd%%2
&. (4)
In Andreev’s approach, two new parameters were introduced, namely, a fundamental length of Heisenberg, r0, whichhas to describe a discreteness of the physical vacuum and a parameter β depicting a deformability or polarizability ofthe physical vacuum. The conventional Coulomb’s law appears from Andreev’s expressions when β = 1 and r0 = 0.
As a result, Andreev obtained an explicit analytic form of the electronuclear potential of a proton [1]:
ϕ(proton) =r0"
(x2 + y2 + 2z2 + r2o)+
dz r20(x2 + y2 + 2z2 + r2o)
. (5)
Especially for one of the four orientations in a wide range of distances, the interaction energy Eq. (5) is negative,which indicates the existence of an attractive force and the possibility of forming a bound state [1]. Such behavioris similar to the van der Waals interaction (dipole–dipole, dipole-induced dipole, dipole–quadrupole interaction, etc.)which emerges between two nonbonded atoms and can be expressed as a function of internuclear separation, r.
This model includes a kind of anisotropy of space, represented by a coefficient “beta” in the direction Z of thenuclear spin, and includes also a parameter r0 to eliminate the infinities in r = 0: r0 would be the size of a discreteelementary cell of the physical (quantum) vacuum. This is very interesting, because in particular, it leads withoutpreliminary hypothesis to retrieve the space partitioning into three areas, with a + sign for two external areas and a –sign for an internal one: that could represent the three quarks. Moreover, by computing the total energy of a proton-proton interaction, according to Andreev’s potential model and as a function of various relative orientations of theproton, the author finds a mutual orientation providing an attractive interaction.
The above result, in fact, demonstrates the Coulomb barrier suppression starting from classical electromagneticstheory. Furthermore, Andreev has shown that PP potential as described above can be compared with [1]:
• Lennard–Jones potential (resulting from the van der Waals interaction):

30 V. Christianto et al. / Journal of Condensed Matter Nuclear Science 22 (2017) 27–34
V LJ =0.01
r12− 1
r5. (6)
• Reed potential
VReed = −10e−r
r− 1650
e−4r
r+ 6484
e−7r
r. (7)
Thus the introduction of the discreteness of space (r0) and its deformability (β) allows one to resolve the problem ofovercoming the Coulomb barrier in nuclear physics.
Although this approach hints at a solution, much work still needs to be done, especially to establish how this modelcan be compared head-to-head with LENR/CMNS experiments. For more detailed information, the reader is advisedto refer [1].
3. Vortex Sound Theory of Tsutomu Kambe [2–4]
The above-described electronuclear potential starts with electrostatics/Maxwell equations. It is very interesting to notethat Prof. T. Kambe from University of Tokyo has made a connection between the equation of vortex sound and fluidMaxwell equations.
Kambe wrote that it would be no exaggeration to say that any vortex motion excites acoustic waves. Kambeconsiders the equation of vortex sound of the form [2] :
1
c2∂2t p−∇2p = ρ0∇ · L = ρ0div(ω × v). (8)
Also Kambe wrote that dipolar emission by the vortex–body interaction is [3]
pF(x, t) = − P0
4πcΠi
't− x
c
( xcx2
. (9)
Then he obtained an expression of fluid Maxwell equations as follows [4]:
∇ ·H = 0,∇ · E = q,∇× E + ∂tH = 0,a20∇×H − ∂tE = J,
(10)
where [4] a0 denotes the sound speed and
q = −∂t(∇ · υ)−∇!,J = ∂2t v +∇∂th+ a2o∇× (∇× υ).
(11)
In our opinion, this new expression of fluid Maxwell equations suggests that there is a deep connection between vortexsound and electromagnetic fields. Therefore, it may offer new ways to alter the form of electronuclear potential asdescribed in Section 2.
However, it should be noted that the above expressions based on fluid dynamics need to be verified with exper-iments. We should note also that in Eqs. (10) and (11), the speed of sound a0 is analogous of the speed of lightin Maxwell equations, whereas in Eq. (8), the speed of sound is designated “c” (as analogous to the light speed inelectromagnetic (EM) wave equation).
For octonic formulation of fluid Maxwell equations, see [15]. For alternative hydrodynamics expression of elec-tromagnetic fields, see [16].

V. Christianto et al. / Journal of Condensed Matter Nuclear Science 22 (2017) 27–34 31
4. Nonlinear Ponderomotive Force
According to Brechet et al. [6], a ponderomotive force results from the response of inhomogeneous matter fields tothe presence of electromagnetic fields. In particular, the Miller ponderomotive force could explain transmutations bythermal capture of neutrons in the context of the classical EM theory.
Ponderomotive forces are generally overlooked since the electromagnetic community is not much concerned withcontinuum mechanics, and the continuum mechanics community does not usually deal with electromagnetic systems.
The nonrelativistic ponderomotive force as proposed by Miller (1958) is as follows [7] :
F = m¯r = − q2
4mω2∇%%%E(r, t)
%%%2. (12)
Equation (12) can obviously be derived from the ponderomotive potential:
ϕ(p)(r, t) =q2
4mω2
%%%E(r, t)%%%2. (13)
Other than Miller’s force, there are other types of ponderomotive forces, i.e. [5] :
• Abraham force (1903),• Barlow (1958),• Lundin and Hultqvist (1989),• Bolotovsky and Serov (2003).
It can be noted here that the Miller force is independent of wave frequency for ω2 ≪ Ω2 and attractive for the entirefrequency range below resonance. The Miller force is repulsive at frequencies above resonance, but decays stronglyat higher frequencies. Ponderomotive forcing by electromagnetic waves is capable of causing the attraction of solidbodies.
Brechet et al. [6] discuss the electromagnetic force density of magnetoelectric ponderomotive force, which isdifferent from Miller’s force.
In a recent paper, Lundin and Lidgren proposed that Miller ponderomotive force may offer an explanation tonuclear spallation as observed in some LENR experiments [13]. Although their study is not yet conclusive, it opens anentirely new way to discuss LENR based on pure classical electromagnetic theory.
5. Submicroscopic Consideration
Monograph [11] presented a detailed structure of physical space (or a vacuum, ether), which is based on pure mathe-matical principles — set theory, topology and fractal geometry. The study shows that matter appears from a primarysubstrate that has a structure of a mathematical lattice named the tessellattice. Thus, all massive particles as wellas electrically charged particles emerge from the tessellattice as local distortions of its cells. In this motion suchanamorphosis has to interact with the tessellattice, which is neglected in quantum mechanical, quantum field and elec-tromagnetic theories. The bulk fractal deformation of a cell of the tessellattice is associated with the notion of mass; itis thought that the surface deformation of a cell is related to the electric charge.
Hence, two kinds of equations should appear: one system of equations describes the behavior of a massive particleand one more system of equations depicts the behavior of the electric charge. The first system is quite new andpresented in a book [11] and it is related to the quantum mechanical formalism; the other system is reduced to theconventional Maxwell equations, which is also illustrated in this book [11].
It has been demonstrated [11] that the interaction of a moving particle with the tessellattice results in the generationof a new kind of quasi-particles named ‘inertons’. These inertons are carriers of massive properties of particles and
32 V. Christianto et al. / Journal of Condensed Matter Nuclear Science 22 (2017) 27–34
they play in some sense the role of hidden variables introduced in physics by de Broglie, Bohm and Vigier. Inertonsexchange by mass, speed and hence momentum and kinetic energy with the particle that generates them. A section ofspace known as the particle’s de Broglie wavelength λ is the spatial amplitude of the particle. It is a section in whichthe particle initially generates inertons and passing the whole kinetic energy to the generated cloud of inertons finallystops; then in the next section λ inertons guide the particle passing on to it their velocity, mass, momentum and kineticenergy.
The particle’s inerton cloud together with the particle, which exist in real space, are projected to the quantummechanical formalism, which was developed in a phase space, as the particle’s wave ψ-function. Thus, in a solid eachatom is surrounded with its inerton cloud; the same for each free electron, proton or another canonical particle.
In the recent experiment [12], in a chamber filled with a gas, a discharge has been generated. Positive ions of thegas reached the cathode where they interacted with atoms of an electrode made of tungsten. If the gas is hydrogen,discharges produce free protons in it. Reaching the cathode, protons interact with a metal matrix in such a way, thatat the resonance conditions, i.e. when the momenta of the interacting atom and proton are coincide by absolute valueand have opposite directions, i.e. the proton impacts the tungsten atom being in antiphase oscillating in its site of thecrystal lattice, both particles must stop, mpυp + mWυW = 0. This condition means that the proton knocks out thetungsten’s atom inerton cloud.
One of the free electrons available at the surface of the electrode absorbs the tungsten atom’s inerton cloud and alsotraps a proton. The merging of the heavy electron with the proton results in the creation of a super heavy hydrogenatom. In this system the reduced mass of the proton and the electron is almost equal to mp (indeed 1/mp + 1/(me +mW) ≃ 1/mp). Therefore, the proton starts to rotate around the heavy electron; the Bohr radius for the rotating protonis
rp−e =4πε0!2n2
e2mp= 2.88× 10⁻¹⁴m, (14)
where we put n = 1. Although the electron orbit (14) deeply penetrates into the middle of the proton, the electron stilldoes not reach the critical distance of 2× 10⁻¹⁴ m that characterizes the quark orbit inside the proton [11]. If we putn = 2, 3, the radius (14) will be larger but still in the order of femtometers.
What is interesting, these small atoms named subatoms [12] behave like neutrons, namely, neutron detectors mea-sured the presence of neutrons in the experiment conducted. We [12] were able to generate subatoms, such as subhy-drogen and subhelium (in a helium atmosphere), which were perceived by the neutron detector as real neutrons. Theintensity of the measured “neutron” radiation was rather significant; the maximum value measured by the detector was3 × 105 neutrons/cm2 min. Nevertheless, the real intensity could even be five orders higher. Besides, analyzing ourexperiments, we came to the conclusion about the existence of other tiny systems: subdeuterium, neutral (deuteron +subhydrogen) pair, and neutral (deuteron + subhelium) pair.
Many other researchers reported similar very small stable atoms, or combined particles, though they were unableto explain their structure and properties.
All these nuclear systems had the size around several units of 10−14 nm. They can be generated artificially in achamber filled with a gas. When a discharge is generated in the chamber, positive ions of the gas reaches the cathodewhere they interact with atoms of the electrode, which is typically made of tungsten.
When we launch the production of subatoms and the above mentioned nuclear pairs, at the high intensity of theseentities we are able to anticipate the real transformation of nuclei in the system. Indeed, tiny subatoms and nuclearpairs (with the size ≤ 5 × 10⁻¹⁴ m) can easily penetrate the shell of electrons around each atom, which have a sizearound 10−10 m. In other words, a subatom or nuclear pair moving to the nucleus of the atom will pierce the electronshell similarly to a spaceship that is travelling in our solar system. Any electron of the electron shell cannot experiencethis pinhole because of the incommensurability of the sizes of tiny particles and electron orbits.
V. Christianto et al. / Journal of Condensed Matter Nuclear Science 22 (2017) 27–34 33
Note that Andreev’s phenomenological approach [1] to the suppression of the Coulomb barrier is consistent withthe submicroscopic concept. Andreev points to some minimum size r0. Indeed, scales of sizes of objects that composethe universal tessellattice prescribe an order of sizes of stable structures starting from the minimum, which is the sizeof the quark (in the lattice, the size is 10−10 or 10−17 m) and the size of an atom (in the lattice, the size is 10−17 or10−21 m) [11]. Hence real space has to influence a physical mechanism of interaction. The tessellattice possesses anelasticity and Andreev’s parameter β takes exactly this fact into account.
Approaching a nucleus, a subatom or nuclear part starts interacting with nuclides: a subatom brings to the nucleusa thermal proton (deuteron or α particle), the inerton cloud and electron. The electron will be getting away fromthe nucleus because it does not participate in nuclear reactions. But the proton (deuteron or α particle) will bring anadditional interaction inside the nucleus, which has to result in its mutation.
In fact, studying samples of iron and samples of water contaminated with Cs-137 we [11] revealed significantmutations in iron (in which emerged such elements, as Co, Ni, Ca, Hf, Cs) and decrease in radioactivity of the watersample up to 30–40% at the application of an inerton field. It seems in those experiments initially subatoms formedthat then influenced nuclei of Fe (in samples of iron) and nuclei of Cs-137 (in samples of water contaminated withradioactive cesium).
6. Discussion and Concluding Remarks
We have discussed a new expression of electronuclear potential starting from electrostatics law. This explains Coulombbarrier suppression from a purely classical origin, without the use of nuclear potential such as Woods–Saxon potential.The model potential possesses a set of properties that could be called “nuclear van der Waals forces.” In our opinion,this is a quite surprising result that offers a novel way to explain low energy nuclear reaction (LENR) from ClassicalElectromagnetic theories.
Moreover, Kambe’s new expression of fluid Maxwell equations suggests that there is a deep connection betweenvortex sound and electromagnetic fields. Therefore, this result may offer a new insight on how to alter and modify theform of electronuclear potential using vortex sound equations. This requires further investigations.
In a recent paper, Lundin and Lidgren proposed that Miller ponderomotive force might offer an explanation tonuclear spallation as observed in LENR experiments. Although their study is not yet conclusive, it opens an entirelynew way to discuss LENR from purely classical electromagnetic theories.
The electrostatic/electronuclear potentials, fluid Maxwell equations and ponderomotive force have been proposedas an alternative to tunneling effects that could occur as a quantum mechanical consideration of LENR. However, inSection 5, we have shown that the tunneling effect itself can be considered in deeper terms, namely from the submicro-scopic point of view. This is a quite new approach to the description of physical phenomena, which however, promisesa lot in both our understanding of mysterious phenomena of nature and the modeling of some crucial experiments,such as LENR and similar work.
As follows from the submicroscopic concept, LENR can be possible only in the case when subatoms or nuclearpairs emerge in the system studied. An efficiency of LENR is directly proportional to the quantity of generatedsubatoms and nuclear pairs. That is why it seems possible that the highest efficiency in LENR can reached under thefollowing two main conditions: (i) in a reaction chamber one has to increase the number of subatoms and nuclearpairs to the value of no less than 1012; at this quantity of deuterons in a macroscopic sample reactions d + d = Heproduces heat comparative to room temperature; (ii) we need to invent mechanism(s) that would stimulate collisionsof subatoms and nuclear pairs with potential targets and between themselves.
Of course, we do not pretend to have the last word on how to apply Classical Electromagnetic theory to understandLENR, instead we offer some new insights on how to explain and enhance the Coulomb barrier suppression withoutthe usual quantum tunneling paradigm.

34 V. Christianto et al. / Journal of Condensed Matter Nuclear Science 22 (2017) 27–34
It is our hope that some of the proposed new theoretical approaches as described herein will be proved fruitful inthe continuing study of CMNS/LENR.
Acknowledgements
The first author (VC) dedicates this paper to Prof. Liek Wilardjo and Dr. Iwan Kurniawan for all encouraging com-ments and discussions over many subjects for more than 10 years. Many thanks to Prof. Jean-Paul Biberian whohas considered this paper for JCMNS. Special thanks to an anonymous reviewer for his encouraging remarks andcorrection.
References[1] E. Andreev, About the Coulomb barrier in LENR processes (2015).
URL: http://www.e-catworld.com/wp-content/uploads/2016/01/Coulomb-barrier-in-LENR.pdf.[2] T. Kambe, Vortex sound with special reference to vortex rings: theory, computer simulation, and experiments, Int. J. Aeroa-
coustics 9(1,2) (2010) 52. URL: http://www.purple.dti.ne.jp/kambe/IJA09-Vortex-Sound.pdf.[3] T. Kambe, Theory of vortex sound with special reference to vortex rings, Int. Conf. Math. Fluid Dyn., Dec. 2004. URL:
http://citeseerx.ist.psu.edu/viewdoc/download?doi=10.1.1.571.8078&rep=rep1&type=pdf.[4] T. Kambe, New formulation of equations of compressible fluids on analogy of Maxwell equations, Fluid Dyn. Res. 42 (2010)
4 . URL: http://www.purple.dti.ne.jp/kambe/FDR-IOP-42(2010).pdf.[5] Rickard Lundin and A. Guglielmi, Ponderomotive force in cosmos, Space Sci. Rev. 127 (2006) 1–116.[6] S.D. Brechet, A. Roulet and J.P. Ansermet, Magnetoelectric ponderomotive force, Modern Phys. Lett. B 27(21) (2013)
1350150 (10 pages).[7] D. Bauer, Theory of intense matter-laser interaction, 2006.
URL: http://www.physik.uni-rostock.de/fileadmin/Physik/Bauer/tilmi.pdf.[8] D. J. Nagel, Challenges, attractions and possible impacts of commercial generators based on low energy nuclear reactions,
Proc. ILENRS-’12, Williamsburg, USA, July 1–3, 2012.[9] D.J. Nagel, Potential advantages and impacts of LENR generators of thermal and electrical power and energy, Infinite Energy
Issue 103, May/June 2012.[10] L.F. DeChiaro, Low Energy Nuclear Reactions (LENR) Phenomena and Potential Applications, NAVSEA, Dahlgren Divi-
sion (2015).[11] V. Krasnoholovets, Structure of Space and the Submicroscopic Deterministic Concept of Physics, Apple Academic Press,
Waretown, 2017.[12] V. Krasnoholovets, Yu. Zabulonov and I. Zolkin, On the nuclear coupling of proton and electron, Universal J. Phys. Appl.
10(3) (2016) 90–103. URL: http://www.hrpub.org/download/20160530/UJPA6-18406680.pdf.[13] R. Lundin and H. Lidgren, Nuclear spallation and neutron capture induced by Ponderomotive forcing (2015). URL:
https://documents.irf.se/get_document.php?group=Administration&docid=1772.[14] R. Lundin and H. Lidgren, On the attraction of matter by the Ponderomotive Miller force (2010).
URL: https://arxiv.org/pdf/1005.4913.pdf.[15] M.Tanıslı, S. Demir and N. Sahin, Octonic formulations of Maxwell type fluid equations, J. Math. Phys. 56 (2015) 091701.
URL: http://scitation.aip.org/content/aip/journal/jmp/56/9/10.1063/1.4930805.[16] M. Liu, Hydrodynamic theory of electromagnetic fields in continuous media, Phys. Rev. Lett. 70(23) (1993) 3580–3583.
URL: http://www.uni-tuebingen.de/fileadmin/Uni_Tuebingen/Fakultaeten/MathePhysik/Institute/ITP/Dokumente/liu/phys-rev-lett-70-3580_1993.pdf.
J. Condensed Matter Nucl. Sci. 22 (2017) 35–46
Research Article
Oscillating Excess Power Gain and Magnetic Domains inNANOR R⃝-type CF/LANR Components
Mitchell R. Swartz∗Nanortech Inc., Wellesley Hills, MA 02148, USA
Abstract
Post-magnetization effects, both significant and time-variant, were observed in NANOR R⃝-type CF/LANR components. In con-trast to previously observed exponential falloffs of sample activity (peak incremental excess power gain), post-magnetization activitydemonstrates oscillatory activity. This paper reports an analysis of the force density and expected theoretical frequency for oscil-lations, which have already been observed to exist between these magnetic domains after magnetization, calculated by using theMaxwell stress tensor.c⃝ 2017 ISCMNS. All rights reserved. ISSN 2227-3123
Keywords: LANR, Magnetic domains, Magnetism, NANOR R⃝, Oscillating power gain
1. Introduction – NANOR R⃝-type CF/LANR Dry Preloaded Components
A NANOR R⃝-type component is a hermetically sealed CF/LANR (cold fusion/lattice assisted nuclear reaction) nano-material, preloaded and arranged as a two-terminal electrical component which can yield significant heat (Figs. 1 and2). They are designed to avoid leakage, enable stabilization and activation of the contained nanostructured alloyedmaterial. As a result, the NANOR R⃝-type preloaded component [1,2] has been like the proverbial “lab rat” for severalpapers, and was also the central component in an open demonstration at MIT in 2012 ([3]; which is one of the locationswhere the “normal” (unexposed to magnetization effects) exponential fall off of CF/LANR activity was followed overmonths). The papers include investigations of material science [4–6] and radiation physics [5,6,8], which have revealedseveral electrical transconduction states. Most importantly, of these transconduction states, only one produces the de-sired trait known as “excess heat” [7]. We begin by considering how the activity of these components is measured,and then how they are affected by the applied magnetic field intensity, and finally what may cause the post-magneticactivity-oscillations.
∗Dr. Mitchell R. Swartz ScD, MD, EE, E-mail: [email protected].
c⃝ 2017 ISCMNS. All rights reserved. ISSN 2227-3123

36 M.R. Swartz / Journal of Condensed Matter Nuclear Science 22 (2017) 35–46
2. Methods
2.1. Determination of activity of NANOR R⃝-type components
The preloaded NANOR R⃝-type components are driven by a high voltage circuit (up to 3000 V peak). In addition to us-ing several types of commercial calibrations, we augment the calibrations using Keithley picoammeters (Types 480 and486) and Keithley current sources (Type 225). For voltage measurements, Keithley electrometers (610B,610CR,602)and HP5334, HP3490, and Keithley multimeters were used. Voltage sources include HP-Harrisons, Kepco, and VWR.The input voltage was delivered in every run alternatively to the NANOR R⃝ and the ohmic control which was at thesame location and used to thermally calibrate the system [9–11].
Input power is defined as V × I. There is no thermoneutral correction in the denominator. Therefore, becauseconsideration of loss by possible recombination is not removed, the observed power is a lower limit [12]. The energycalculations are also calibrated by time integration for additional validation. The instantaneous power gain (non-dimensional power amplification factor [10.11,13]) is defined as Pout/Pin. When present, the excess energy is definedas (Poutput – Pinput) × time. Data acquisition is taken from voltage and current sensors, and temperatures and heatflux sensors at multiple sites of the system. Data sampling is at 0.20 – 1 Hz, with 16–24+ bit resolution, a voltageaccuracy of 0.015+/−0.005 V, and a temperature accuracy of <0.6 degrees C. The noise power of the Keithley currentsources driving the reactions is generally ~10 nW.
After driving the component and the control in each run, their power and energy gain were separately determinedboth by power-normalized delta-T (dT / Pin), and input power normalized increase in heat flow (delta-HF/Pin), and thedirectly by semiquantitative calorimetry [2,3]. In semiquantitative calorimetry, the amount of output energy is directlydetermined from the heat release, which is then compared to the input energy. The excess heat-producing activity canbe determined by comparing the output of the NANOR R⃝ type component to the output of the precisely driven ohmiccontrol, as demonstrated in the middle of Fig. 1.
2.2. Magnetization of NANOR R⃝-type components
For what is reported here, the applied magnetization sequence consisted of rapidly repeating pulses of an intense >2Tesla magnetic field intensity [4]. The applied magnetic field intensity, thus, highly fractionated with 3500 pulsesdelivered, each with a rise time of <0.1 ms, followed by an intra-pulse delay of one second.
3. Results
3.1. Response without applied magnetic field
Figure 1 shows the responses of these CF/LANR NANOR R⃝-type components with any applied magnetic field inten-sity in three graphs of the same experimental run. A determination of the presence of excess heat can be made bycomparing the output for NANOR R⃝-type LANR component to the thermal (ohmic) control. The top of Fig. 1 showsthe electrical input power and the incremental output temperature rise (defined as “delta-T ”). The x-axis representstime. The y-axis on the left-hand side represents electrical input power in watts. The y-axis on the right-hand siderepresents delta-T . The calibration pulses, used for accuracy and precisions checks of voltages and currents and time,are also shown. The middle of Fig. 1 includes the same data but the incremental output temperature rise is normalizedto the input power by dividing by the input power. This metric has delta-T /Pin be a nearly straight horizontal line forthe ohmic control; which facilitates semiquantitative measurements by use of a simple ratio. The bottom of Fig. 1is a full calorimetric presentation showing the input power and energy and output power and heat (energy) from theohmic control and the NANOR R⃝-type component at several input powers. The y-axis on the left-hand side representselectrical input power in watts. The y-axis on the right-hand side is the time-integrated amount of energy delivered at

M.R. Swartz / Journal of Condensed Matter Nuclear Science 22 (2017) 35–46 37
Figure 1. Response of a control and NANOR R⃝-type component – No magnetic field. This figure shows three different ways of evaluating thepossible presence of excess energy from a single run of an ohmic control and a NANOR R⃝-type component. The ohmic control was driven firstand then the component was electrically driven, as marked (top). The electrical input power and resultant delta-T for the ohmic control and thenthe NANOR R⃝-type component are shown (middle). The electrical input power and resultant delta-T normalized to the input power (delta-T /Pin).Importantly, this linearizes the output and enables calculation of power gain. In contrast to the graph on the top, this metric is a nearly straighthorizontal line for the ohmic control (bottom). Calorimetric presentation of the input power and energy and output power and heat for the ohmiccontrol and the NANOR R⃝-type component.
input, and then released. The lighter energy curves (dots) are read off of the right-hand side y-axis, which representsthe amount of energy released in joules.
Thus, these calorimetric curves rule out energy storage, chemical sources of the induced heat, possible phasechanges, and other sources which might interfere with obtaining semiquantitative results.
Figure 2 shows the calorimetric responses of both the ohmic control and the preloaded NANOR R⃝-type compo-
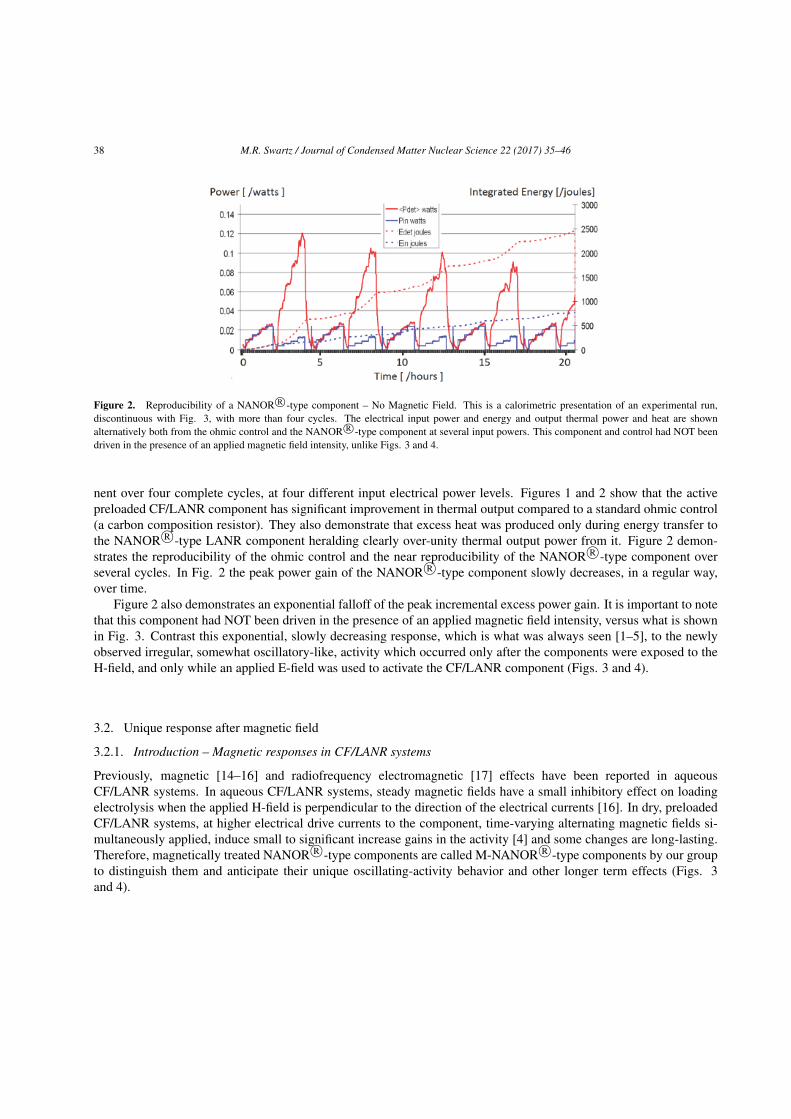
38 M.R. Swartz / Journal of Condensed Matter Nuclear Science 22 (2017) 35–46
Figure 2. Reproducibility of a NANOR R⃝-type component – No Magnetic Field. This is a calorimetric presentation of an experimental run,discontinuous with Fig. 3, with more than four cycles. The electrical input power and energy and output thermal power and heat are shownalternatively both from the ohmic control and the NANOR R⃝-type component at several input powers. This component and control had NOT beendriven in the presence of an applied magnetic field intensity, unlike Figs. 3 and 4.
nent over four complete cycles, at four different input electrical power levels. Figures 1 and 2 show that the activepreloaded CF/LANR component has significant improvement in thermal output compared to a standard ohmic control(a carbon composition resistor). They also demonstrate that excess heat was produced only during energy transfer tothe NANOR R⃝-type LANR component heralding clearly over-unity thermal output power from it. Figure 2 demon-strates the reproducibility of the ohmic control and the near reproducibility of the NANOR R⃝-type component overseveral cycles. In Fig. 2 the peak power gain of the NANOR R⃝-type component slowly decreases, in a regular way,over time.
Figure 2 also demonstrates an exponential falloff of the peak incremental excess power gain. It is important to notethat this component had NOT been driven in the presence of an applied magnetic field intensity, versus what is shownin Fig. 3. Contrast this exponential, slowly decreasing response, which is what was always seen [1–5], to the newlyobserved irregular, somewhat oscillatory-like, activity which occurred only after the components were exposed to theH-field, and only while an applied E-field was used to activate the CF/LANR component (Figs. 3 and 4).
3.2. Unique response after magnetic field
3.2.1. Introduction – Magnetic responses in CF/LANR systems
Previously, magnetic [14–16] and radiofrequency electromagnetic [17] effects have been reported in aqueousCF/LANR systems. In aqueous CF/LANR systems, steady magnetic fields have a small inhibitory effect on loadingelectrolysis when the applied H-field is perpendicular to the direction of the electrical currents [16]. In dry, preloadedCF/LANR systems, at higher electrical drive currents to the component, time-varying alternating magnetic fields si-multaneously applied, induce small to significant increase gains in the activity [4] and some changes are long-lasting.Therefore, magnetically treated NANOR R⃝-type components are called M-NANOR R⃝-type components by our groupto distinguish them and anticipate their unique oscillating-activity behavior and other longer term effects (Figs. 3and 4).

M.R. Swartz / Journal of Condensed Matter Nuclear Science 22 (2017) 35–46 39
Figure 3. Impact of an H-field on the behavior of a NANOR R⃝-type component. This experimental runs shows the impact of an applied H-fieldon the activity of a NANOR R⃝-type component before, during and after, a single sequence of fractionated high intensity magnetic field applicationbetween the arrows. At all other points in time there were NO additional large applied magnetic field intensity. Note the absence of an exponentialor linear fall-off of peak activity.
3.2.2. Synchronous magnetically induced increased energy gain
During the first magnetic-NANOR R⃝ run, we were quite surprised by the different responses of the NANOR R⃝ com-ponent during and after dH/dt coercing. It was discovered that for magnetic interactions with active nanostructuredCF/LANR systems [4], there is enhanced improvement of LANR (which occurs at the same time as the magnetizationand therefore is called “synchronous”). As a result of the magnetization sequence, there appeared a significant increase
Figure 4. Subsequent late-term impact of magnetization on CF/LANR activity. The post-magnetization electrical input power and energy andoutput power and heat are shown for the ohmic control and the NANOR R⃝-type component. This experimental run of a M-NANOR R⃝-typecomponent was made several hours after a single application sequence of the fractionated magnetic field was delivered. There was no additionalH-field applied for this figure. The peak applied voltage was ~125 V. Note the absence of an exponential or linear fall-off of peak activity.

40 M.R. Swartz / Journal of Condensed Matter Nuclear Science 22 (2017) 35–46
in incremental power gain and excess energy gain, over ordinary CF/LANR. This magnetization sequence created anincrease of ca. 4–10 times the peak power gain over conventional LANR with the same system. The peak power gainof such treated NANOR R⃝s ranged from 22 to up to ~80 times input electrical power or more beyond the control, asdetermined by calorimetry [4,10,11].
There are also subsequent effects (occurring later, or metachronous) and strong evidence for the first ever-observedtwo (2) optimal operating point (OOP) manifolds [4]. Some of these dramatic changes can be seen in Fig. 3, whichshows the first evidence of magnetic rejuvenation of nanostructured CF/LANR material, and even increasing theCF/LANR activity to higher levels than observed initially!
Figure 3 shows a calorimetric presentation of the ohmic control and the NANOR R⃝-type component. It demon-strates the impact of the magnetic field, with no change from the same magnetic field on the background or control. InFig. 3, the magnetic field intensity was applied only at one point in time which is indicated by the black arrows. At allother points in time, there was NO additional applied magnetic field intensity. Note the synchronous amplification ofthe M-NANOR R⃝ power output induced by the magnetic field. This is not seen in the ohmic control.
3.2.3. Metachronous magnetically induced increased energy gain
Other effects were noted. Astonishingly, after the single application of the fractionated large applied magnetic fieldintensity was delivered at one point in time (between the arrows), there is improvement in the CF/LANR activitywhich also appears later – long after the initiation of the magnetization [4]. This metachronous impact wroughtupon the treated CF/LANR M-NANOR R⃝s, long after the treatment, is heralded as increased power and energy gainas determined by delta-T /Pin, delta-HF/Pin, and calorimetry. Subsequent, metachronous effects are those physicalchanges wrought by the applied high intensity fractionated magnetic field after the field was applied.
Figure 4 is a calorimetric presentation of a different run later many hours after the single application of the fraction-ated large applied magnetic field intensity was delivered. In Fig. 4, many cycles are shown which demonstrated clearlythat there was more output than the ohmic control, and as astonishingly, there is improved activity which is shownhere to be metachronous and long-lasting. Notice that the peak power gain of the M-NANOR R⃝-type component isincreased after the application of the fractionated large applied magnetic field intensity.
3.2.4. Magnetically induced activity has an oscillation of activity
There are other remnant effects long after the application of the H-field. These late-appearing effects include anincreased, but variable, activity. The subsequent activity of the magnetized M-NANOR R⃝-type components no longerdecreases in a simple regular, evanescent manner over time (as described in previous publications [1–5]); but insteadappears irregular with a periodic component, as first seen in Fig. 3 and also shown in Fig. 4. The cyclic component ofthe activity in in the range of circa 1.3 × 10⁻⁴ Hz (0.2–5 × 10⁻⁴ Hz).
3.2.5. Magnetically induced unique dual optimal operating manifolds (OOPs)
Although not covered in detail here, previously, all CF systems and the NANOR R⃝s had shown a single optimaloperating point manifold for excess heat operation, 4He production, and other products [15,14,4]. Today, that is nolonger accurate. Even after a single treatment to a high intensity fractionated magnetic field, there arise two OOPmanifolds. The new OOP is elicited at higher input electrical power, and so the new, second, OOP is located to the“right” of the conventional, first, CF/LANR OOP [4]. Although this revelation is far beyond the scope of this paper,its impact is very important because magnetically activating preloaded nanostructured CF/LANR devices is both veryuseful [4] and instructive [8]. Although cold fusion (LANR) has a first stage mediated by phonons within the loaded

M.R. Swartz / Journal of Condensed Matter Nuclear Science 22 (2017) 35–46 41
lattice by coherent Phusons [18], there is also a magnetically coerced second stage, which we believe may be mediatedby magnons, or interactions of phonons in H-field and included magnetization field.
4. Interpretation
4.1. Possible implications of magnetized domains
The unique temporal changes, shown in Figs. 3 and 4, and the amplification of CF/LANR excess heat by fractionedmagnetic fields effects suggest a new CF/LANR material science/nuclear interaction. The analysis below is thusimportant because the magnetic domains, magnetic interactions, magnetically increased incremental power gain, mightbe relevant to other materials and other systems.
4.2. Magnetism in ZrO2–Pd/Ni and ZrO2–Pd components
How can palladium become magnetic? Nickel is ferromagnetic and the induction of magnetization is to be expected. Sothis is expected for the nickel-containing NANOR R⃝s, but it is somewhat surprising for the palladium M-NANOR R⃝s.However, palladium like platinum, has potential capacity as an exchange-enhanced paramagnetic materials to exhibita strong Stoner enhancement and become ferromagnetic upon tension [19]. When the Stoner criterion is satisfied, inresponse to external stimuli such as applied E-field, the materials can exhibit unconventional magnetic responses –they become exchanged-enhanced ferromagnetic.
Thus, the solid state metallurgical lattice of Pd can become ferromagnetic or its equivalent post-magnetization.This has now been seen [20] and confirmed in magnetic domain scanning and imaging which will be the subject of anupcoming paper (cf. also Fig. 5).
The magnetization and oscillations may also be consistent with other reports of quantum oscillations in severalsystems, including metallic triangular-lattice antiferromagnet PdCrO2 [21], and as seen in the (electrically tunable)anomalous Hall effect observed in platinum thin films [22], as seen with both lattice and magnetic oscillations in stacksof Josephson junctions [23], and with reports of excess energy production with high voltage magnetic pulses coercedthrough nanograined magnetic materials such as strontium ferrites [24]. The coerced magnetization is important andmay also be consistent with some of those materials considered theoretically in investigations using DFT calculationsof strained ferromagnetic lattices [25].
4.3. Interaction forces between magnetized domains
It is important to consider the material science and metallurgy of this new magnetic behavior and material(s) (Fig. 5).From what do the domains arise, and how do they interact. How can the magnetic domains couple and accountfor the unusual time-variant activity? Magnetic materials can self-interact, as described by the Langevin function[26]. Theoretically, this is supported by density-functional calculations [27]. Most interestingly, this appears to bedriven by vacancies in Pd (theoretically, up to 15% calculated using the SCR Korringa–Kohn–Rostoker coherentpotential approximation method, which predicts a magnetic moment at ~10% vacancies) [28]. Attention is drawn tothe interesting fact that several theories of cold fusion also require vacancies [29].
5. New Hypothesis. Is Oscillation of Activity Linked to Magnetized Domains
The continuum electromechanical equations may give a possible new understanding of the just-discovered time-varying activity change that appears in post-magnetized components [4]. This is important because these changesare uniquely different from observations of hundreds of runs on scores of samples. These M-NANOR R⃝-type compo-nents have responded markedly differently, requiring this attempt to mathematically analyze, and possibly explain, this

42 M.R. Swartz / Journal of Condensed Matter Nuclear Science 22 (2017) 35–46
Figure 5. Magnetic Domains in NANOR R⃝-type components. (top) Schematic showing magnetic domains interacting within a lattice. Themagnetization is observed changing over a distance (after John Mara and A.von Hippel [32]. (bottom) These magnetic domains have been observedexperimentally and their imaging, and possible implications, are the focus of a manuscript [20]. The graph shows the vectorial scanned magnetizationfrom the domain (in nanotesla) as a function of distance along the long axis of the M-NANOR R⃝ 7-8 at rest, long after it was previously operated.The square of each of the x-, y-, and z-axis components are shown as a function of x-axis. (bottom inset) Estimated vectorial magnetization along,and just vicinal to, the body of M-NANOR R⃝ 7-8.
new post-magnetization observation. The activity oscillations observed in the output excess power of M-NANOR R⃝-type components long after their magnetic field interaction must result from the applied magnetic field intensity. Sowhat is the impact of the H-field on any magnetic domains there? We have begun to measure them in M-NANOR R⃝safter magnetization [20] as shown in Fig. 5.
In this report, we examine the behavior of the oscillating excess heat activity of magnetized M-NANOR R⃝-typecomponents, and attempt to link that behavior to loco-regional magnetic domains in the treated coerced lattice to

M.R. Swartz / Journal of Condensed Matter Nuclear Science 22 (2017) 35–46 43
understand the very unique observed responses of these magnetically treated components. Although better models for,and a solution to, this observation are needed, this is a first approximation.
These domains can be modeled as a remnant magnetization of the lattice, and here are taken into account throughthe forces and tension they incur through the density of the lattice and Poisson’s ratio. Specifically, using the findingsof strained layer ferromagnetism in transition metal, it is found that tension increases magnetization and simultaneousshould decrease density [25], and these may be the conditions that give rise to the activity oscillations.
6. New Results. Magnetic Forces and Oscillations from CF/LANR Domains
To model the interactions of two neighboring magnetic domains, we assume that in addition to the normal mechanicalrestoring forces that there are also electromechanical forces. We begin the analysis with Newton’s equation, using acontinuum model using a simple spring constant equation for the initial analysis.
d2xdt2
=F
M. (1)
The magnitude of the restoring force is derived using Hooke’s law augmented by the Maxwell stress tensor which isintegrated over the surface boundary between those two magnetic domains to derive the volume-integrated inducedforce [30–32].
The force density, in integral and differential forms, thus becomes!
V
"−1
2H ·H∇µ+∇
#1
2H ·H∂µ
∂ρρ
$− F
%· δξdV = 0, (2)
F = −1
2H ·H∇µ+∇
#1
2H ·H∂µ
∂ρρ
$. (3)
Therefore, the force, and the stress tensor, would there be, and derived as follows:
Fm =∂Tmn
∂xn, (4)
Tmn = µHnHm − 1
2δmnHkHk
#µ− ∂µ
∂ρρ
$. (5)
Note the magnetoelectric term at the end (reminiscent of electrical dielectrophoresis). Substitution in the originalequation, with terms including magnetostriction, gives
Md2x
dt2= − [K × x]− [Bo]2
2× µ2
"∆µ+
"(−∆ρ)
#δµ
δρ
$%%. (6)
The solution has an amplitude of
[Bo]2
2V ρµ2K&(ω2
0 − ω2)
"∆µ+
"(−∆ρ)
#δµ
δρ
$%%(7)
and a natural frequency of

44 M.R. Swartz / Journal of Condensed Matter Nuclear Science 22 (2017) 35–46
ω0 =
'K
ρV. (8)
This might be the resultant natural frequency which we see in the M-Nanor R⃝’s excess energy cyclic activity (cf.Figs. 3 and 4).
7. Conclusion. Oscillating Activity and Magnetic Domains
There are two types of NANOR R⃝-type CF/LANR components. They have very different behavior. The post-magnetization effects are significant and time-variant because it has now been discovered that high intensity, dynamic,repeatedly fractionated, magnetic fields have an incremental major, significant and unique, complex, metachronousamplification effect on preloaded M-NANOR R⃝-type LANR devices.
Furthermore, in contrast to previously observed exponential falloffs of sample activity (peak incremental excesspower gain), post-magnetization activity demonstrates oscillatory activity, and the Maxwell stress tensor heralds atheoretical frequency for oscillations now observed to exist between these magnetic domains in these magnetizedNANOR R⃝-type components. The observed frequencies of activity change observed appear be circa 1.3 × 10⁻⁴ Hz(range 0.2–5 × 10⁻⁴ Hz).
This paper’s analysis of the force density, calculated by using the Maxwell stress tensor, predicts oscillations nowobserved to exist between these magnetic domains in these magnetized NANOR R⃝-type components. This analysisindicates that magnetic interactions between domains should augment other restoring forces, and that the frequencyshould increase with decreasing mass, and increasing applied magnetic field intensity (presumably until coercioneffects elicit no further increase). It is important to consider this new material science and metallurgy with surprisingnew magnetic behavior in future analyses and experiments.
Acknowledgments
The author acknowledges and thanks Gayle Verner and Alex Frank for their very helpful editorial support. The au-thor is grateful to and thanks the teams who have helped collect the data, support the work, and have helped betterunderstand the physics and materials with their assistance, ideas and suggestions including Richard Goldbaum, Jef-frey Tolleson, Gayle Verner, Leslie Wright, Linda Hammond, Alex Frank, Alan Weinberg, Charles Entenmann, AllenSwartz, Joshua Gyllinsky, Peter Hagelstein, Florian Metzler, Brian Ahern, Jeff Driscoll, Dennis Cravens, PamelaMosier Boss, Lawrence P.G. Forsley, Frank Gordon, Louis DeChiaro, and Dennis Letts. This effort was supportedby JET Energy Inc. and the New Energy Foundation. NANOR R⃝ and PHUSOR R⃝ are registered trademarks of JETEnergy, Incorporated. NANOR R⃝-technology, and PHUSOR R⃝-technology are protected by U.S. Patents D596724,D413659 and several other patents pending.
References[1] M.R. Swartz, G. Verner, J. Tolleson and P. Hagelstein, Dry, preloaded NANOR R⃝-type CF/LANR components, Current Sci.
108 (4) (2015) 595.[2] M.R. Swartz and P.L. Hagelstein, Demonstration of energy gain from a preloaded ZrO2–PdD nanostructured CF/LANR
quantum electronic device at MIT, J. Condensed Matter Nucl. Sci. 13 (2014) 516. www.iscmns.org/CMNS/JCMNS-Vol13.pdf.
[3] M.R. Swartz and P.L. Hagelstein, Demonstration of energy gain from a preloaded ZrO2–PdD nanostructured CF/LANRquantum electronic device at MIT, J. Condensed Matter Nucl. Sci. 13 (2014) 516. www.iscmns.org/CMNS/JCMNS-Vol13.pdf.

M.R. Swartz / Journal of Condensed Matter Nuclear Science 22 (2017) 35–46 45
[4] M.R. Swartz, G.M. Verner, J. Tolleson, L. Wright, R. Goldbaum and P.L. Hagelstein, Amplification and restoration of energygain using fractionated magnetic fields on ZrO2–PdD nanostructured components, J. Condensed Matter Nucl. Sci. 15 (2015)66. www.iscmns.org/CMNS/JCMNS-VoI15.pdf.
[5] M.R. Swartz, Incremental high energy emission from a ZrO2–PdD nanostructured quantum electronic componentCF/LANR, J. Condensed Matter Nucl. Sci. 15 (2015) 92. www.iscmns.org/CMNS/JCMNS-Vol15.pdf.
[6] M.R. Swartz, G. Verner, J. Tolleson, L. Wright and R. Goldbaum„ Imaging of an active NANOR R⃝-type LANR componentusing CR-39, J. Condensed Matter Nucl. Sci. 15 (2015) 81. www.iscmns.org/CMNS/JCMNS-Vol15.pdf.
[7] M.R. Swartz, P.L. Hagelstein and G. Verner, Impact of electrical avalanche through a ZrO2–NiD nanostructured componenton its incremental excess power gain, ICCF-19, J. Condensed Matter Nucl. Sci. 19 (2016) 287–297.
[8] M.R. Swartz, Detection of phonon gain from a NANOR R⃝-type CF component (2016, in preparation and review).[9] M.R. Swartz and G. Verner, Excess heat from low electrical conductivity heavy water spiral-wound Pd/D2O/Pt and Pd/D2O-
PdCl2/Pt devices, Condensed Matter Nuclear Science, Proc.ICCF-10, World Scientific, Singapore, ISBN 981-256-564-6,29-44; 45–54 (2006).
[10] M.R. Swartz, Excess power gain using high impedance and codepositional LANR devices monitored by calorime-try, heat flow, and paired stirling engines, Proc. ICCF14 1 (2008) 123; ISBN: 978-0-578-06694-3, 123 (2010).www.iscmns.org/iccf14/ProcICCF14a.pdf.
[11] M.R. Swartz, Survey of the observed excess energy and emissions in lattice assisted nuclear reactions, J. Scientific Explo-ration 23(4) (2009) 419–436.
[12] J. Marwan, M.C.H. McKubre, F.L. Tanzella, P.L. Hagelstein, M.H. Miles, M.R. Swartz, E. Storms, Y. Iwamura, P.A. Mosier-Boss and L.P.G. Forsley, A new look at low-energy nuclear reaction (LENR) research: a response to Shanahan, J. Environ.Monit. 12(9) (2010) 1765–1770.
[13] M.R. Swartz, G. Verner, A. Frank and H. Fox, Importance of non-dimensional numbers and optimal operating points in coldfusion, J. New Energy 4 (2) (1999) 215–217.
[14] D. Cravens, Factors affecting success rate of heat generation in CF cells, Proc. ICCF-4, Maui, Hawaii, July 1994, pp. 18-1through 18-14.
[15] S. Szpak, P.A. Mosier-Boss and F.E. Gordon, Further evidence of nuclear reactions in the Pd/D lattice: emission of chargedparticles, Naturwissenschaften 94 (2007) 511–514.
[16] M.R. Swartz, Impact of an applied magnetic field on the electrical impedance of a LANR device, JCMNS, Volume 4, Proc.,March 2010, New Energy Technology Symposium held at the 239th American Chemical Society, San Francisco, 2011.
[17] J. O’M. Bockris, R. Sundaresan, D. Letts and Z.S. Minevski, Triggering and structural changes in cold fusion electrodes,Proc. ICCF4, Maui, Hawaii, July 1994, 1–46.
[18] M.R. Swartz, Phusons in nuclear reactions in solids, Fusion Technol. 31 (1997) 228–236.[19] D.L.R. Santos, P. Venezuela, R.B. Muniz and A.T. Costa, Spin pumping and interlayer exchange coupling through palladium,
Phys. Rev. B 88 (2013) 054423.[20] M.R. Swartz, Scanning vector magnetometry of NANOR R⃝-type components, in preparation.[21] J.M. Ok, Y.J. Jo, K. Kim, T. Shishidou, E.S. Choi, H.J. Noh, T. Oguchi, B.I. Min and J.S. Kim, Quantum oscillations of the
metallic triangular-lattice antiferromagnet PdCrO2. 3. Phys Rev Lett. (2013);111(17):176405 (2013).[22] Shimizu Sunao, Kei S. Takahashi, Takafumi Hatano, Masashi Kawasaki, Yoshinori Tokura, and Yoshihiro Iwasa, Electrically
tunable anomalous hall effect in Pt thin films, Phys. Rev. Lett. 111 (2013) 216803.[23] Lattice configurations and magnetic oscillations in stacks of Josephson junctions,
http://mti.msd.anl.gov/homepages/koshelev/projects/mag-osc.htm.[24] Brian Ahern on the late Arthur Manelas; personal communication (2015).[25] Louis DeChiaro, L. Forsley and P.A. Mosier-Boss, Strained layer ferromagnetism in transition metals and its impact upon
low energy nuclear reactions, J. Condensed Matter Nucl. Sci. 17 (2015) 1–26.[26] Shimizu, Sunao, Kei S. Takahashi, Takafumi Hatano, Masashi Kawasaki, Yoshinori Tokura and Yoshihiro Iwasa, Electrically
tunable anomalous Hall effect in Pt thin films, Phys. Rev. Lett. 111 (2013) 216803.[27] Y. Sun, J.D. Burton and E.Y. Tsymbal, Electrically driven magnetism on a Pd thin film, Phys. Rev. B 81 (2010) 064413.[28] N. Takanol, T. Kai, K. Shiiki and F. Terasakil, Effect of copious vacancies on magnetism of Pd, Solid State Commun. 97(2)
(1996) 153–156.

46 M.R. Swartz / Journal of Condensed Matter Nuclear Science 22 (2017) 35–46
[29] M.R. Swartz and P.L. Hagelstein, Transient vacancy phase states in palladium after high dose-rate electron beam irradiation,J. Condensed Matter Nucl. Sci. 14 (2014) 50.
[30] J.R. Melcher, Continuum Electromechanics, MIT Press, Cambridge, 1981. ISBN-10: 026213165X; ISBN-13: 978-0262131650.
[31] H.H. Woodson and J.R. Melcher, Electromechanical Dyanamics, Wiley, New York, 1968.[32] A.R. von Hippel, Molecular Science and Molecular Engineering, MIT Press, Cambridge, 1959.

J. Condensed Matter Nucl. Sci. 22 (2017) 47–52
Research Article
Development of a Cold Fusion Science and Engineering Course
Gayle M. Verner and Mitchell R. Swartz∗JET Energy Inc., Wellesley Hills, MA 02148, USA
Peter L. HagelsteinResearch Laboratory of Electronics, Massachusetts Institute of Technology, Cambridge, MA 02139, USA
Abstract
For three consecutive years, an introductory non-credit short course was taught on the science and engineering of cold fusion (CF).It reviewed its origin, extent, basis and substantial experimental proof of the observed excess energy (XSE) from active cold fusion(lattice assisted nuclear reactions) systems. The range of CF technologies spanned from early aqueous CF/LANR systems to recentday nanomaterials. While academic officials are slow to recognize cold fusion and its viability, the fact is that the subject and itsscience have entered the academic domain, and students can learn that the phenomenon is real and reproducible.c⃝ 2017 ISCMNS. All rights reserved. ISSN 2227-3123
Keywords: CF academic course, CF curriculum, CF education, CF training, LANR academic course, LANR education, LENRacademic course, LENR education
1. Introduction
Education plays a critical role in the development of any science and technology, and it is especially significant in anemergent, controversial field like cold fusion. What heightens its difficulty here, however, is that the scientists andothers interested in learning more about the field are almost always under an intense barrage of unfair criticism andblistering attacks from competing interests and skeptics. Despite this major obstacle, just as it has been important tohave occasional cold fusion open demonstrations, it is important to create (and expand) cold fusion education in theclassroom.
This report describes how a complicated and new alternative energy subject-matter was tailored to a college course-work program, and was offered as an introduction to cold fusion during its Independent Activities Period (IAP),designed for students to engage in topics outside-of the-normal-curriculum.
∗Dr. Mitchell R. Swartz ScD, MD, EE, E-mail: [email protected].
c⃝ 2017 ISCMNS. All rights reserved. ISSN 2227-3123
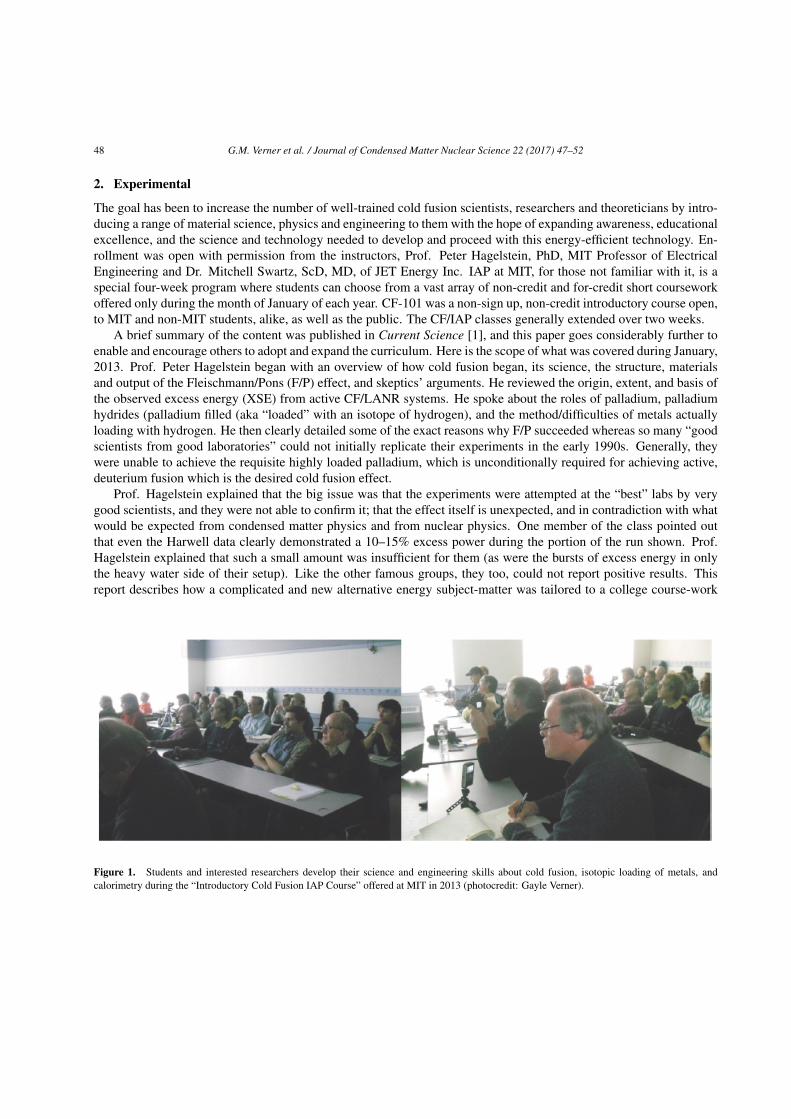
48 G.M. Verner et al. / Journal of Condensed Matter Nuclear Science 22 (2017) 47–52
2. Experimental
The goal has been to increase the number of well-trained cold fusion scientists, researchers and theoreticians by intro-ducing a range of material science, physics and engineering to them with the hope of expanding awareness, educationalexcellence, and the science and technology needed to develop and proceed with this energy-efficient technology. En-rollment was open with permission from the instructors, Prof. Peter Hagelstein, PhD, MIT Professor of ElectricalEngineering and Dr. Mitchell Swartz, ScD, MD, of JET Energy Inc. IAP at MIT, for those not familiar with it, is aspecial four-week program where students can choose from a vast array of non-credit and for-credit short courseworkoffered only during the month of January of each year. CF-101 was a non-sign up, non-credit introductory course open,to MIT and non-MIT students, alike, as well as the public. The CF/IAP classes generally extended over two weeks.
A brief summary of the content was published in Current Science [1], and this paper goes considerably further toenable and encourage others to adopt and expand the curriculum. Here is the scope of what was covered during January,2013. Prof. Peter Hagelstein began with an overview of how cold fusion began, its science, the structure, materialsand output of the Fleischmann/Pons (F/P) effect, and skeptics’ arguments. He reviewed the origin, extent, and basis ofthe observed excess energy (XSE) from active CF/LANR systems. He spoke about the roles of palladium, palladiumhydrides (palladium filled (aka “loaded” with an isotope of hydrogen), and the method/difficulties of metals actuallyloading with hydrogen. He then clearly detailed some of the exact reasons why F/P succeeded whereas so many “goodscientists from good laboratories” could not initially replicate their experiments in the early 1990s. Generally, theywere unable to achieve the requisite highly loaded palladium, which is unconditionally required for achieving active,deuterium fusion which is the desired cold fusion effect.
Prof. Hagelstein explained that the big issue was that the experiments were attempted at the “best” labs by verygood scientists, and they were not able to confirm it; that the effect itself is unexpected, and in contradiction with whatwould be expected from condensed matter physics and from nuclear physics. One member of the class pointed outthat even the Harwell data clearly demonstrated a 10–15% excess power during the portion of the run shown. Prof.Hagelstein explained that such a small amount was insufficient for them (as were the bursts of excess energy in onlythe heavy water side of their setup). Like the other famous groups, they too, could not report positive results. Thisreport describes how a complicated and new alternative energy subject-matter was tailored to a college course-work
Figure 1. Students and interested researchers develop their science and engineering skills about cold fusion, isotopic loading of metals, andcalorimetry during the “Introductory Cold Fusion IAP Course” offered at MIT in 2013 (photocredit: Gayle Verner).
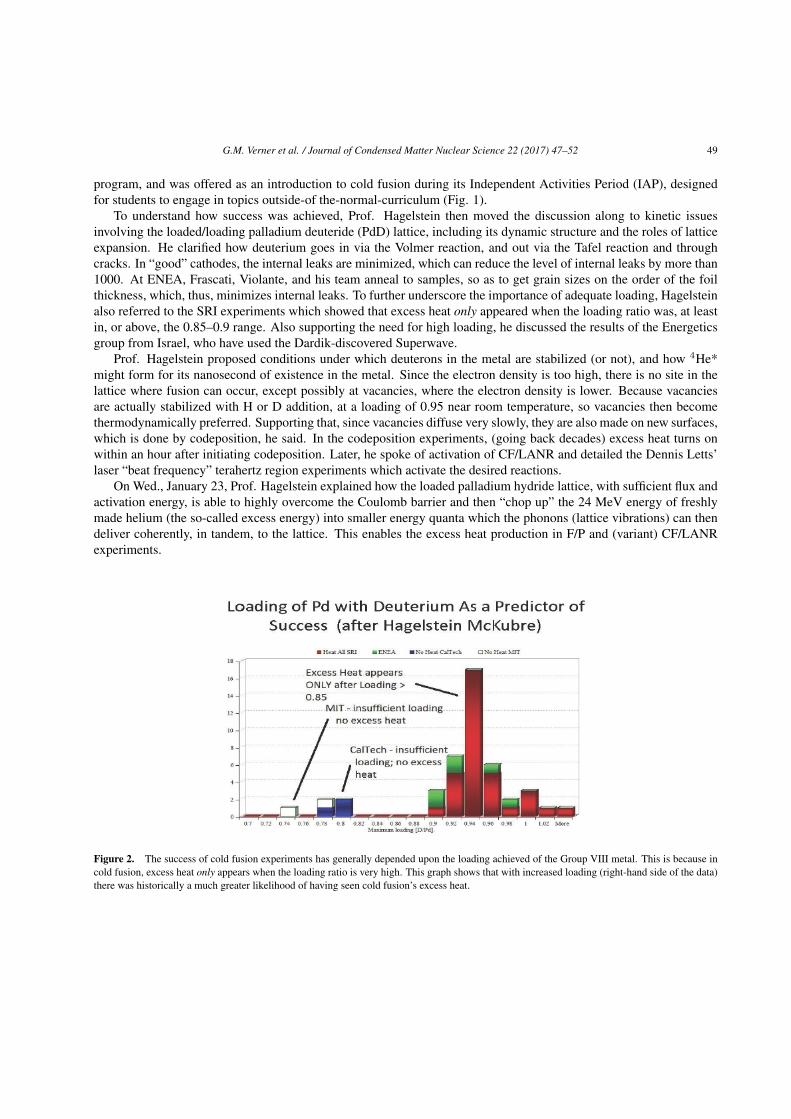
G.M. Verner et al. / Journal of Condensed Matter Nuclear Science 22 (2017) 47–52 49
program, and was offered as an introduction to cold fusion during its Independent Activities Period (IAP), designedfor students to engage in topics outside-of the-normal-curriculum (Fig. 1).
To understand how success was achieved, Prof. Hagelstein then moved the discussion along to kinetic issuesinvolving the loaded/loading palladium deuteride (PdD) lattice, including its dynamic structure and the roles of latticeexpansion. He clarified how deuterium goes in via the Volmer reaction, and out via the Tafel reaction and throughcracks. In “good” cathodes, the internal leaks are minimized, which can reduce the level of internal leaks by more than1000. At ENEA, Frascati, Violante, and his team anneal to samples, so as to get grain sizes on the order of the foilthickness, which, thus, minimizes internal leaks. To further underscore the importance of adequate loading, Hagelsteinalso referred to the SRI experiments which showed that excess heat only appeared when the loading ratio was, at leastin, or above, the 0.85–0.9 range. Also supporting the need for high loading, he discussed the results of the Energeticsgroup from Israel, who have used the Dardik-discovered Superwave.
Prof. Hagelstein proposed conditions under which deuterons in the metal are stabilized (or not), and how 4He*might form for its nanosecond of existence in the metal. Since the electron density is too high, there is no site in thelattice where fusion can occur, except possibly at vacancies, where the electron density is lower. Because vacanciesare actually stabilized with H or D addition, at a loading of 0.95 near room temperature, so vacancies then becomethermodynamically preferred. Supporting that, since vacancies diffuse very slowly, they are also made on new surfaces,which is done by codeposition, he said. In the codeposition experiments, (going back decades) excess heat turns onwithin an hour after initiating codeposition. Later, he spoke of activation of CF/LANR and detailed the Dennis Letts’laser “beat frequency” terahertz region experiments which activate the desired reactions.
On Wed., January 23, Prof. Hagelstein explained how the loaded palladium hydride lattice, with sufficient flux andactivation energy, is able to highly overcome the Coulomb barrier and then “chop up” the 24 MeV energy of freshlymade helium (the so-called excess energy) into smaller energy quanta which the phonons (lattice vibrations) can thendeliver coherently, in tandem, to the lattice. This enables the excess heat production in F/P and (variant) CF/LANRexperiments.
Figure 2. The success of cold fusion experiments has generally depended upon the loading achieved of the Group VIII metal. This is because incold fusion, excess heat only appears when the loading ratio is very high. This graph shows that with increased loading (right-hand side of the data)there was historically a much greater likelihood of having seen cold fusion’s excess heat.

50 G.M. Verner et al. / Journal of Condensed Matter Nuclear Science 22 (2017) 47–52
Dislocations and cracks in the average cathode generate many pathways that include many internal leaks. Thesecan become “superhighways” of hydrogen loss, can appear suddenly, and can end active samples, as they reduce stressinternally. Generally, they were unable to achieve the requisite highly loaded palladium, which is unconditionallyrequired for achieving active, deuterium fusion which is the desired cold fusion effect (Fig. 2).
On Thursday, Jan. 24th, Prof. Hagelstein continued about the several meticulous experiments which documentedthat helium (4He) is made as the product of cold fusion from the deuterium which is loaded at very high levels into thepalladium lattice. He showed this for three sets of experimenters including Dr. Mel Miles at the US Navy, and Dr. LenCase (working independently) from N.H., and at SRI in Calif., where it was also measured.
Prof. Hagelstein said that even the rate of helium production is also commensurate with observed excess powerof cold fusion experiments, as was reported years ago in Italy by Gozzi. Furthermore, he said, regarding 4He mea-surements that Bush and Miles demonstrated it was there; Gozzi showed that it was correlated in time with the excesspower; SRI provided important confirmations, but beyond that they made the best measurement in his view of theQ-value. The issue is that some of the He is retained in the PdD (which was obvious from the Gozzi experiment).
One class attendee asked why there were not more of these experiments done. Prof. Hagelstein quickly pointedout that helium measurements are difficult because of both atmospheric contamination and confusion with materials ofsimilar mass (that is D2), and that meticulous efforts are required to shield the experiments from the atmosphere (bymetal flasks, for example) and that expensive equipment is required to make the discriminating measurements required.
As a result, this type of work is very hard to do, he said, and expensive, and simply put, there has not been enoughfunding.
He also talked about the problem of helium occupancy at important choke-points in the lattice which must beempty as required for active, excess heat-producing, cold fusion systems. He proposed that the big advantage that theNANOR R⃝-type CF/LANR components (JET Energy’s) have is that the helium does not have to diffuse very far, sothat the power level can be much higher.
Prof. Hagelstein discussed the activation energy required to get the desired reactions. He went through the dataof several experimenters in the field including Dennis Cravens, who demonstrated observation of heavy water cellsincreasing output with a temperature rise. Hagelstein then followed that up with corroboration from other experi-menters, including early recognition of this effect, an increase in excess power in time following a brief temperaturerise (usually due to a calibrating pulse), as was seen by Fleischmann, Storms and Swartz.
Regarding activation energy, Prof. Hagelstein discussed the Dennis Letts laser experiment which activates specif-ically required, key phonon modes in the lattice – compressional optical phonon modes when the beat frequency isaround 8.5 THz, and compressional optical phonon modes when the beat frequency is ~16 THz.
Prof. Hagelstein introduced the cold fusion/LANR Hamiltonian and the role of orbitals of hydrogen. Next, herelated to the Hamiltonian he developed to also include the roles of deuteron flux through, and loading into, thepalladium citing work by Mitchell Swartz and Akito Takahashi. He then explained how Corkum’s mechanism led himto further understand his own, developing spin boson model which was derived from the work of Cohen–Tannoudji,and which explained how the 24 MeV from the 4He* is chopped up into tiny amounts, and then delivered to the loadedpalladium lattice. This is where there is then the appearance of the “excess heat” as the excited helium (4He*) returnsto its own ground state (4He) as the energy is converted to THz phonons, and then thermalized to produce that heat.
Hagelstein’s Take Away Message is that the lattice is key, and the physicist’s theories are really not inconsistentwith cold fusion, after all. He demonstrated exactly where it was insufficient to explain CF/LANR in the absence ofhis later discovery of the role of destructive interference and other loss and dephasing issues. Those loss mechanismsoccur in the real loaded lattice.
On Friday, Prof. Hagelstein focused on the mathematical models and physical models for coherent energy ex-change under conditions of fractionation, and on the Karabut collimated X-rays, which appears to show this effect, andexpanded his CF/LANR Hamiltonian to now include coupling parameters.

G.M. Verner et al. / Journal of Condensed Matter Nuclear Science 22 (2017) 47–52 51
Prof. Hagelstein continued with relativistic physics. Examination of the very strong coupling between the center ofmass momentum and internal nuclear degrees of freedom is normally eliminated by a generalized Foldy–Wouthuysenrotation. However, under conditions of destructive interference such as in the lattice filled with lossy bosons, it doesnot appear appropriate. The Take Away Message was that his corrected condensed matter nuclear science (CMNS)Hamiltonian with all the additions is finally becoming very close to describing accurately what is actually beingobserved in CF/LANR
After a weekend break, lectures resumed on Mon., Jan. 28, led by Dr. Mitchell Swartz. He continued the talkregarding substantial experimental proof for cold fusion (lattice assisted nuclear reactions). Dr. Swartz presented whatmany consider the well-researched, evidence for existence (and development) of cold fusion in an understandable fourplus hours (two each day) of scientific detail, not only reviewing decades of CF/LANR experiments but also presentingmany how-to’s of the successful processes.
He then shifted to hot fusion which unfortunately has a long history of technical and engineering failures. Bycontrast to hot fusion, cold fusion does not make any significant amount of dangerous radiation, he said, nor does itmake other materials radioactive. It has zero carbon footprint. It could change everything.
He then discussed yet another reason why CF/LANR is so important – its energy density. He directed the classto the hard facts that the helium (4He) production is in quantitative agreement with the XSE, as Mel Miles, Case, andSRI had measured; and that the rate of He4 production is commensurate with the power, as the Gozzi experiment haddemonstrated.
Dr. Swartz continued, talking about the materials involved in CF/LANR. He taught how loading is achieved witheither an applied electric field intensity acting upon water, separating out the deuterium, which with palladium, comesfrom the surrounding heavy water.
In the next session, after Dr. Swartz surveyed the methods of calibration of heat-producing reactions and systems,he detailed how there are now available many types of controls, time-integration, thermal waveform reconstruction,noise measurement and additional techniques, which are used, and is needed, for verification.
He then spoke at great length of the importance of the role of deuteron flow (flux) and explained the differencesbetween flow calorimetry which can be inaccurate under some conditions where it is not calibrated, and the preferredmethods of measuring excess energy. Having discussed the materials, and methods of measuring excess energy accu-rately, he segued to many examples of actual excess heat generated by a variety of CF/LANR systems. He showedgraphs that were derived, using aqueous nickel and palladium systems.
Dr. Swartz returned to the concept of deuteron flux. Then using the Navier–Stokes equation, he developed theflow equations for both protons and deuteron flow in “conventional” cold fusion and in its variant, codeposition, wherethere is also flux of the palladium ions into the cathode which builds up a loaded compartment of active material. Theconcept of deuteron flux then led to metamaterials, a major improvement of CF systems. He focused on the salientadvantages of the LANR metamaterials with the PHUSOR R⃝-type system, stating that it is one prime, extremelyuseful, example with high output.
Dr. Swartz then shared another of his discoveries – Optimal Operating Point (OOP’s) manifolds that organizeCF/LANR output by the amount of input power. He explained how he discovered the OOP experimentally and showedhow in all CF/LANR systems, no matter what the product (helium4, heat, or tritium production), and no matter whatthe system (palladium with heavy water, nickel with ordinary water, and nanomaterials) all of these when plotted as afunction of input power demonstrate a series of dots which assemble and show a distinct pattern.
He went through the different regions, and showed where the reactions turn on and off, and how by plotting outthe experiments this way, one could show consistency and reproducibility, time and time again. He demonstrated thatOOP operation has shown the ability to determine the products of CF/LANR, and why OOP manifolds demonstratethat CF is a reproducible phenomenon, applicable to science and engineering. He also said that he had found OOPs inother colleague’s experiments where they had not, and showed that their data also fit these curves.

52 G.M. Verner et al. / Journal of Condensed Matter Nuclear Science 22 (2017) 47–52
Returning to the experimental results and engineering methods developed to control cold fusion, he then surveyed“heat after death” and its control for several useful applications, including the use of CF/LANR systems to drivemotors. The important Take Home Point, he said, was that there is an extraordinary amount of data and informationfrom it that has been collected over the years.
Emissions and energy derived from CF systems is how Dr. Swartz led the lecture on Tues., Jan. 29, 2013. Hecontinued with the discussion of experimental results, now beginning with the near infrared emissions from activeLANR devices, and the use of CF/LANR engines to generate electricity.
He finally focused the class from aqueous cold fusion to the nanomaterials in CF/LANR, now holding worldwideintrigue. Of particular interest was his discovery of a new type of dry and preloaded nanomaterials, a CF/LANRmaterial which is producing phenomenal excess heat output.
After discussing these novel characteristics and electrical breakdown (avalanche) issues, which electric drive re-gions actually generate excess energy, he presented the development of several types of the NANOR R⃝-type CF elec-tronic components. He concluded with introduction to advanced driving circuits that were shown to have excess energydocumented by temperature rise, heat flow, and calorimetry; heralding their revolutionary potential to change the en-ergy landscape in circuits, distributed electrical power systems, artificial internal organs, propulsion systems, spacetravel, and more.
3. Results
According to the participants, the course was a success. At the beginning of the two week course, Room 4-153 inthe Electrical Engineering building was nearly packed with a blend of about 35–40 students, as well as entrepreneurs,engineers, physicists, and “curious” members of the community, as the class size ebbed and flowed throughout the six-day event. Attendees came from as far away as Spain, China, Germany, and Switzerland. But they also traveled fromCalifornia, Pennsylvania, New York, and throughout Massachusetts. Many said the course was “great” and reportedalso they were glad they came. If others disapproved, no one said so publicly.
4. Conclusion
While MIT officials still reportedly do not recognize cold fusion or its viability, the fact that it has entered the academicdomain, albeit through the less-structured IAP agenda, is certainly noteworthy, both for those scientists working forits public acknowledgement and for the appearance of a place to go and get an education in this field. Twenty-sevenyears later, one can now walk into an MIT classroom, listen to academic lectures on the subject, and learn that thephenomenon is real and reproducible. And while it is still controversial, cold fusion seems to have found a fit, albeittight, in the academic world.
References[1] G. Verner, M. Swartz and P.L. Hagelstein, Summary report: ‘Introduction to Cold Fusion’–IAP course at the Massachusetts
Institute of Technology, Current Science 108(4) (2015) 653. http://www.currentscience.ac.in/Volumes/108/04/0653.pdf.
J. Condensed Matter Nucl. Sci. 22 (2017) 53–73
Research Article
Probabilistic Models for Beam, Spot, and Line Emission forCollimated X-ray Emission in the Karabut Experiment
Peter L. Hagelstein∗
Massachusetts Institute of Technology, Cambridge, MA, USA
Abstract
Collimated X-ray emission near 1.5 keV in the Karabut experiment is an anomaly that cannot be explained by conventional solidstate, atomic, or nuclear physics. In order for the X-rays to be collimated, there must either be an X-ray laser present, or else aphased-array collimation effect produced by emitting dipoles that radiate in phase. Although there have been arguments made insupport of an X-ray laser origin of the effect, from our perspective this approach suffers from an absence of a plausible mechanism,short excited-state electronic lifetimes, high power requirements, and an incompatibility between the experimental geometry andthe need for an elongated laser medium for beam formation. In this work we consider a model for beam formation due to manyemitting dipoles randomly positioned within a circle on a mathematically flat surface. When the emitting dipole density is low, aspeckle pattern is produced. Above a critical emitting dipole density beam formation occurs. The average intensity of the speckleand beam is estimated from simple statistical models at low and high dipole density, and combined to develop an empirical intensityestimate over the full range of dipole densities which compares well with numerical simulations. Beam formation occurs above acritical number of emitting dipoles, which allows us to develop an estimate for the minimum number of emitting dipoles presentin the Karabut experiment. The effect of surface deformations is considered; constant offsets do not impact beam formation, andlocally linear offsets direct the beam slightly off of normal. Minor displacements quadratic in the surface coordinates can producefocusing and defocusing effects, leading to a natural explanation for intense spot and line formation observed in the experiments.c⃝ 2017 ISCMNS. All rights reserved. ISSN 2227-3123
Keywords: Beam formation, Collimated X-ray emission, Karabut experiment, Phase coherence, Up-conversion
1. Introduction
Karabut and his coworkers at the Luch Institute reported the observation of excess heat and other anomalies in glowdischarge experiments in the early 1990s [1]. In subsequent experiments Karabut noticed that soft X-rays near 1.5 keVwere emitted, and that they were collimated upward in his experiment normal to the cathode surface [2]. This effectwas studied for more than a decade [3–10], and was found to be independent of the cathode metal (the effect wasseen with Al, and with other metals through W), also to be independent of which discharge gas was used (collimatedemission was seen with H2, D2, He, Ne, Ar and Xe).
∗E-mail: [email protected]
c⃝ 2017 ISCMNS. All rights reserved. ISSN 2227-3123

54 P.L. Hagelstein / Journal of Condensed Matter Nuclear Science 22 (2017) 53–73
Collimated X-ray emission in this experiment is a striking anomaly for a variety of reasons. In order to arrangefor collimated X-ray emission, either you need an X-ray laser, or else you need coherence among the emitter phases;either option would have deep implications. Karabut was convinced, especially in his later years, that he had made anX-ray laser. In some recent articles Ivlev speculates about the possibility of an X-ray laser mechanism in connectionwith Karabut’s experiment [11,12].
In years past the author spent a decade modeling and designing X-ray lasers [13]; an experience that led to anunderstanding of just how difficult it is to create a relevant population inversion and to amplify X-rays. The notionof a population inversion at 1.5 keV involving electronic transitions in a solid state environment is unthinkable due tothe very short lifetime. And then even if somehow a population inversion could be generated, one would need enoughamplifier length to produce a collimated beam (the solid state medium is very lossy), as well as an amplifier geometryconsistent with the observed beam formation. The very broad line shape associated with the collimated emissionalso argues against an X-ray laser mechanism. All of these headaches combine to rule out an X-ray laser mechanismassociated with the solid. The primary headache associated with an X-ray laser in the gas phase is the absence ofrelevant electronic transitions in hydrogen, deuterium, helium and in neon gas. In this case one could contemplatethe possibility of a ubiquitous impurity in the discharge gas; however, this leads to an additional headache of comingup with enough inverted atoms, molecules or ions to provide many gain lengths. If somehow one has any optimismleft for the approach, a consideration of the relatively long (millisecond) duration of the collimated X-ray emissionfollowing the turning off of the discharge current should provide a cure. If the upper state radiative life time is longthen the gain is very low; and if the gain is high then the upper state radiative life time is very short and the powerrequirement becomes prohibitive.
All of these arguments have led us to consider collimated X-ray emission as a result of a phased array emissioneffect. In this case serious issues remain; such as how excitation is produced (which in this case is much easier sincea population inversion is not required); and how phase coherence might be established. From our perspective, bothexcitation and phase coherence could be developed via the up-conversion of vibrations to produce nuclear excitationin 201Hg, which is special because it has the lowest energy excited state (at 1565 eV) of any of the stable nuclei. Wehave reported on our earlier studies of models that describe up-conversion in the lossy spin-boson model, and variousextensions and generalizations [14–16].
In this work we consider models for beam formation of the collimated X-ray emission in Karabut’s experimentbased on the assumption of phase coherent emitting dipoles randomly positioned on a plane, in connection with the“diffuse” X-ray emission effect observed under “normal” high-current operating conditions. The collimated X-raysin this case were observed to be normal to the cathode in a beam essentially the same size as the cathode; we findthat beam formation in the high dipole density of the model (where the emission is produced from localized dipoles)works the same way. When the emitting dipole density is low then no beam forms, but a speckle pattern is produced.It might be proposed that the very intense spots seen in the experiments following the turning off of the discharge areconnected with the random constructive interference effects that lead to speckle. However, we find that individual spotsassociated with the speckle pattern are too small to account for this “sharp” emission effect, and that speckle cannotaccount for lines or curves. Instead we find that spot formation and line formation follow naturally from models thatdescribe surface deformations that are quadratic or higher-order in the transverse surface coordinates.
A weak speckle pattern is generated at low emitting dipole density, and a beam is produced when the emitting dipoledensity is high. A critical number or density of emitting dipoles can be estimated for the development of a beam. Sincebeam formation is reported in Karabut’s experiment, it is possible to develop a constraint on the number of emittingdipoles consistent with experiment. We have conjectured previously that a small amount of mercury contamination inthe chamber might result in some mercury sputtered onto the cathode surface, resulting in a relatively small number ofmercury nuclei that emit on a broadened version of the 1565 eV transition in 201Hg. It is possible to develop a lower
P.L. Hagelstein / Journal of Condensed Matter Nuclear Science 22 (2017) 53–73 55
bound on the number of mercury atoms present near the surface, to see whether it is consistent with the proposedpicture.
Key features of the model which allows for collimation of the emitted beam normal to the surface are the phasecoherence assumed, as well as the surface itself (which in the model is mathematically flat). There is no reason tothink that the cathode surface is flat at the atomic scale, since whatever the surface looked like initially is modifiedin the ion bombardment, and surface loss through sputtering, which occurs during discharge operation at high currentdensity. Mercury atoms in the discharge gas ionized above the cathode fall would be accelerated toward the cathodesurface in this picture with an energy of up to a few keV, which means that they would end up randomly positionedin the outer 5–10 nm of the cathode surface. If so, then one would not expect any alignment in a plane, as assumedin the model, unless there were an ordering of the crystal planes so that some fraction of them were aligned with thecathode surface. The expected randomization of the locations of the mercury atoms inside the cathode surface wouldmake beam formation to be impossible, except from the occasional crystal plane accidentally aligned with the surface.
However, it is well known in the literature that substantial deformation of a metal, as occurs during rolling, canresult in a substantial alignment of the local crystal planes with the surface [17–19]. It seems likely that the cathodesused by Karabut were from stock that was rolled, so that one would expect the cathodes themselves to provide a sourceof crystal planes oriented with the surface. During the discharge operation the cathodes undergo additional surfacedeformation due to local thermal effects and electrostatic forces, which provides a natural mechanism for intensespot and line formation. In this picture the crystal ordering built in during rolling is largely maintained during thedeformations that occuring during discharge operation.
2. Basic Model
We note that models for random arrays of emitting dipoles have been studied previously; in the case of random lineararrays, see [20–23]; a model for a random distribution of antennas in a two dimensional circle has been studied in [24];and for a random distribution in a triangle in [25]. Statistical models for the analysis of beam formation from randomantenna arrays have also been discussed in [26–28].
Following the discussion above, we turn our attention to a simple model for X-ray emission due to a collection ofidentical emitting dipoles that are randomly distributed in a plane. We can write for the vector potential in the case ofoscillating electric dipoles [29] the summation
A(r) = −i∑
j
kpj
|r− rj |exp
ik|r− rj |
→ −i
kp
|r|∑
j
exp
ik|r− rj |
, (1)
where we have assumed uniform phase, identical dipoles, and we focus on the field that results far away from theplane. The nuclear transition in 201Hg is a magnetic dipole transition, which provides the motivation to consider theanalogous approximation for a set of oscillating magnetic dipoles
A(r) = i∑
j
knj ×mj
|r− rj |exp
ik|r− rj |
→ i
kn×m
|r|∑
j
exp
ik|r− rj |
. (2)
In either case, the resulting intensity is proportional to
I(r) ∼
∣∣∣∣∣∣
∑
j
exp
ik|r− rj |
∣∣∣∣∣∣
2
=∑
j
∑
j′
exp
ik(|r− rj |− |r− rj′ |)
. (3)
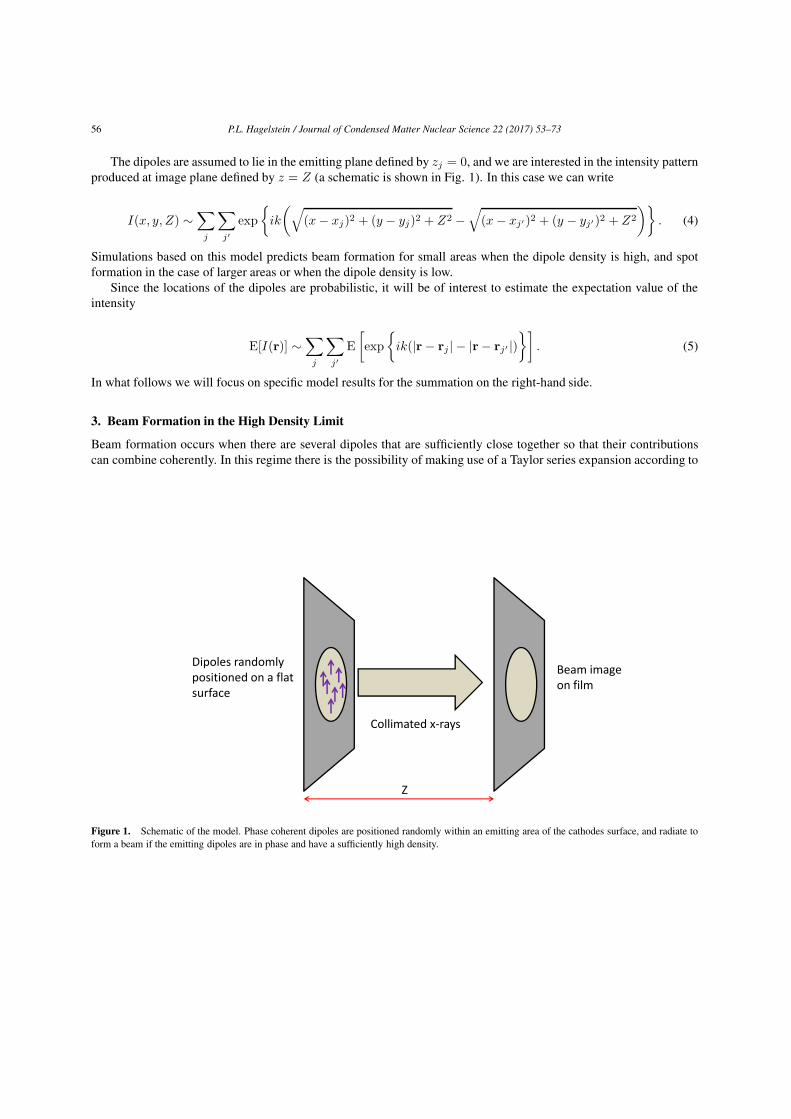
56 P.L. Hagelstein / Journal of Condensed Matter Nuclear Science 22 (2017) 53–73
The dipoles are assumed to lie in the emitting plane defined by zj = 0, and we are interested in the intensity patternproduced at image plane defined by z = Z (a schematic is shown in Fig. 1). In this case we can write
I(x, y, Z) ∼∑
j
∑
j′
exp
ik
(√(x− xj)2 + (y − yj)2 + Z2 −
√(x− xj′ )2 + (y − yj′)2 + Z2
). (4)
Simulations based on this model predicts beam formation for small areas when the dipole density is high, and spotformation in the case of larger areas or when the dipole density is low.
Since the locations of the dipoles are probabilistic, it will be of interest to estimate the expectation value of theintensity
E[I(r)] ∼∑
j
∑
j′
E
[exp
ik(|r− rj |− |r− rj′ |)
]. (5)
In what follows we will focus on specific model results for the summation on the right-hand side.
3. Beam Formation in the High Density Limit
Beam formation occurs when there are several dipoles that are sufficiently close together so that their contributionscan combine coherently. In this regime there is the possibility of making use of a Taylor series expansion according to
Dipoles randomly positioned on a flat surface
Collimated x-rays
Beam image on film
Z
Figure 1. Schematic of the model. Phase coherent dipoles are positioned randomly within an emitting area of the cathodes surface, and radiate toform a beam if the emitting dipoles are in phase and have a sufficiently high density.
P.L. Hagelstein / Journal of Condensed Matter Nuclear Science 22 (2017) 53–73 57
|r− rj | =√(x− xj)2 + (y − yj)2 + Z2
= Z
√1 +
(x− xj)2
Z2+
(y − yj)2
Z2
= Z
[1 +
(x − xj)2
2Z2+
(y − yj)2
2Z2+ · · ·
]. (6)
In this case we can write for the difference
|r− rj |− |r− rj′ | =(x− xj)2
2Z+
(y − yj)2
2Z− (x− xj′ )2
2Z− (y − yj′)2
2Z+ · · ·
=(xj′ − xj)x+ (yj′ − yj)y
Z+
x2j − x2
j′ + y2j − y2j′
2Z+ · · · (7)
If we assume that beam formation is dominated by contributions from the lowest order terms in the Taylor seriesexpansion, then we can write
I(x, y, Z) ∼∑
j
∑
j′
exp
ik
((xj′ − xj)x+ (yj′ − yj)y
Z+
x2j − x2
j′ + y2j − y2j′
2Z
). (8)
The locations of the emitting dipoles are random variables, so that the intensity will be random as well. It will beof interest to estimate the expectation value of the intensity which we can write as
E[I(x, y, Z)] ∼∑
j
∑
j′
E
[exp
ik
((xj′ − xj)x+ (yj′ − yj)y
Z+
x2j − x2
j′ + y2j − y2j′
2Z
)]. (9)
If we assume that the various xj and yj values are independent, then this becomes
E[I(x, y, Z)] ∼∑
j
∑
j′
E
[exp
ik
(−2xjx+ x2
j
2Z
)]E
[exp
− ik
(2xj′x+ x2
j′
2Z
)],
E
[exp
ik
(−2yjy + y2j
2Z
)]E
[exp
− ik
(2yj′y + y2j′
2Z
)]
= N2
∣∣∣∣∣E[exp
ik
(−2xjx+ x2
j
2Z
)]E
[exp
ik
(−2yjy + y2j
2Z
)]∣∣∣∣∣
2
. (10)
For simplicity, let us assume uniform probability distributions for a square emitting region defined by
fX(xj) =1
L(−L/2 < x < L/2),
fY (yj) =1
L(−L/2 < x < L/2). (11)
58 P.L. Hagelstein / Journal of Condensed Matter Nuclear Science 22 (2017) 53–73
Also for simplicity let us focus on the origin at the image, so that
E[I(0, 0, Z)] ∼ N2
∣∣∣∣∣E[exp
ik
(x2j
2Z
)]E
[exp
ik
(y2j2Z
)]∣∣∣∣∣
2
. (12)
We can approximate
E
[exp
ik
(x2j
2Z
)]=
∫ L/2
−L/2fX(x′) exp
ik
(x2j
2Z
)dx′
→ 1
L
∫ ∞
−∞exp
ik
(x2j
2Z
)dx′ =
1
L
√i2πZ
k
=1
L
√iλZ. (13)
We end up with
E[I(0, 0, Z)] ∼ (λZ)2
L4N2. (14)
We have verified that the numerical are consistent with this estimate in the limit of high dipole density for a squareemitting region. Adapting this formula to emission from a circular area by simply modifying the area appears to workwell in comparison with numerical results.
4. Average Intensity in the Low Density Limit
We recall that the expectation value of the intensity is proportional to
E[I(r)] ∼∑
j
∑
j′
E
[exp
ik(|r− rj |− |r− rj′ |)
]. (15)
In the high density limit we took advantage of a Taylor series approximation, as well the separability of the sums in jand in j′, to develop an estimate for the expectation value. In the low density limit it is possible to develop an estimatefor the expectation value of the intensity by neglecting contributions from dipoles at different locations; at low densitythere are not nearby emitting dipoles for local phase coherence to contribute significantly. In this case we can write
E[I(r)] ∼∑
j
E
[exp
ik(|r− rj |− |r− rj |)
]+∑
j
∑
j′ =j
E
[exp
ik(|r− rj |− |r− rj′ |)
]
= N +∑
j
∑
j′ =j
E
[exp
ik(|r− rj |− |r− rj′ |)
]→ N. (16)
When the dipole density is low then the expectation value of the complex terms can be thought of as involving randomphases so that

P.L. Hagelstein / Journal of Condensed Matter Nuclear Science 22 (2017) 53–73 59
E
[exp
ik(|r− rj |− |r− rj′ |)
]→ E
[eiθ]=
1
2π
∫ 2π
0eiθdθ = 0.
In this limit there is no beam formation; instead there is a speckle pattern with average intensity proportional to N , inthe vicinity of where a beam might have formed if N were higher, and also away from where the beam might haveformed.
It is possible to develop an empirical approximation that includes both the contribution from the low density limitand from the high density limit according to
E[I(r)] ∼
∣∣∣∣∣∣
∑
j
exp
ik|r− rj |
∣∣∣∣∣∣
2
=
⎧⎪⎪⎨
⎪⎪⎩
N +
(λZ
L2
)2
N2, within beam pattern,
N, outside of beam.
(17)
This result is closely related to the exact formal result for the expectation value in [27,31].
5. Numerical Results
We have carried out simulations with randomly located dipoles in a square corresponding to the models describedabove, and have found good agreement with the simple probabilistic models outlined above. The exposed surface ofthe cathodes in the Karabut experiment are circular, which motivates us to consider the generalization
E[I(r)] ∼ E
⎡
⎢⎣
∣∣∣∣∣∣
∑
j
exp
ik|r− rj |
∣∣∣∣∣∣
2⎤
⎥⎦ =
⎧⎪⎪⎨
⎪⎪⎩
N +
(λZ
πR2
)2
N2, within beam pattern,
N, outside of beam
(18)
appropriate to emitting dipoles within a circular region of radius R.An example of beam formation is illustrated in Fig. 2, where we see that dipoles randomly localized on a plane
within a circle of radius 100 µm results in a circular beam with a radius 100 µm. Diffraction rings are apparent in theimage which are a result of the discontinuity in the dipole density near the edge of the circular emitting area. One alsosees a speckle pattern which results from the limited number of dipoles present in the calculation.
In Fig. 3 is shown the average intensity (from many simulations) in the case of a 100 µm radius circle containingrandom emitting dipoles and a 100 µm radius circle on the image plane displaced 25 cm in z. One can see that atlow dipole density the average intensity is that of a spot pattern, and at high intensity the average intensity matchesthe analytic estimate. The empirical formula of Eq. (18) is seen to be a good match over the whole range of dipoledensities.
6. Beam Formation in the Karabut Experiment
Although we have no published photographic record of beam formation in Karabut’s experiment, there are two pho-tographs that show the damage done to a Be window and a plastic window in [30]. It might have been possible todiscern the amount of speckle present from an X-ray photographic image of the beam, which based on the analysisabove would have provided us with information about how many emitting dipoles are present. In some of the photo-graphic spectra taken in the bent mica crystal spectrometer configuration of Ref. [8] there is obvious speckle present,

60 P.L. Hagelstein / Journal of Condensed Matter Nuclear Science 22 (2017) 53–73
x (cm)-0.015 -0.010 -0.005 0.000 0.005 0.010 0.015
y (c
m)
-0.015
-0.010
-0.005
0.000
0.005
0.010
0.015
0.0 2.0e+6 4.0e+6 6.0e+6 8.0e+6 1.0e+7 1.2e+7 1.4e+7
Figure 2. Beam at image plane located at Z = 25 cm in the case of a dipole density of 109 cm−2 localized in a circle of radius 100 µm. Markedin yellow is a circle of radius 100 µm.
which tells us that the quadratic beam contribution to the intensity is not so many orders of magnitude greater than thelinear speckle contribution.
From the empirical model described above we can define a critical number of dipoles N0 at which the linear andquadratic contributions match
N0 =
(λZ
πR2
)2
N20 . (19)
We can evaluate
N0 =
(πR2
λZ
)2
. (20)
If we assume that phase coherence among the emitting dipoles is established over the entire surface of the cathode,then we can develop a numerical estimate for the critical number of dipoles. For this estimate we take
R = 0.5 cm, λ = 8 nm, Z = 25 cm. (21)
The corresponding critical number in this case is
N0 = 1.5× 10¹¹. (22)

P.L. Hagelstein / Journal of Condensed Matter Nuclear Science 22 (2017) 53–73 61
dipoles/cm2
106 107 108 109
E[ |Σ
|2 ]
102
103
104
105
106
107
Figure 3. Expectation value E
!""""#
j exp
$ik|r− rj |
%""""2&
as a function of dipole density (red circles); low density limit (blue line); high density
limit (dark green line); empirical estimate (dark green line).
In this picture we would good expect beam formation when the number of dipoles is larger than N0 by an order ofmagnitude or more.
Another possibility is that phase coherence is established over only a part of the cathode surface, in which case thecritical number of dipoles would be smaller by the square of the ratio of the coherence area to the cathode area.
7. Spot Formation
When the dipole density is low we see speckle formation in the image plane, which is a consequence of fluctuations inthe intensity. We are interested in the development of a model that we can use to estimate the intensity of a spot giventhe number of emitting dipoles in a given area.
We recall that the intensity is determined from the random locations of the dipoles according to
I(r) ∼
∣∣∣∣∣∣
∑
j
exp
ik|r− rj |
∣∣∣∣∣∣
2
. (23)
To form a spot we need for the phases associated with the different dipoles to be nearly the same. In this model we arespecifically not interested the phase coherence associated with beam formation, in which the contribution from many

62 P.L. Hagelstein / Journal of Condensed Matter Nuclear Science 22 (2017) 53–73
dipoles near a point add coherently. Instead we are interested in spot formation where the contribution from dipolesthat are well separated combine randomly.
Since the contribution from each dipole is assumed to be equal in this model, the only difference in the contributioncomes from the phase factor. If the dipole positions are random, then we might presume that the associated phases arerandom as well. Consequently, we might consider the simpler model defined by
θ =
∣∣∣∣∣∣
N∑
j=1
exp
iφj
∣∣∣∣∣∣
2
=N∑
j=1
N∑
k=1
exp
i(φj − φk)
. (24)
From numerical simulations, the associated probability distribution is exponential in θ according to
fΘ(θ) →1
Nexp
− θ
N
. (25)
This result is consistent with a random walk model in two dimensions, and is well known in the literature in the contextof speckle [32]. In the event that fewer than the critical number of dipoles emit in this model, then there is little or nobeam apparent, but instead individual randomly positioned spots associated with speckle.
According to this model the average intensity will be proportional to N
E[I] ∼ E[θ] = N (26)
with spots at higher intensity being rarer exponentially in the intensity. This result is consistent with the low dipoledensity model discussed briefly above, where
E[I(r)] ∼ E
⎡
⎢⎣
∣∣∣∣∣∣
∑
j
exp
ik|r− rj |
∣∣∣∣∣∣
2⎤
⎥⎦ = N. (27)
In Fig. 4 we show a calculated image of the weak beam and spots under conditions where the density of dipolesis lower, so that the total number of emitting dipoles is a bit less than the critical number. In this case the dipoledensity is 5 × 107 cm−2, and the critical density needed for beam formation is about 7.4 × 107 cm−2. A histogramof intensities for the speckle pattern and weak beam inside of the indicated circle is shown in Fig. 5, and is seen to beclose to exponential consistent with the discussion above, and in this case the number of match dipoles in the circle isa reasonable match to the exponential fall off.
Karabut reported that the “diffuse” spectra that he observed appears when the discharge is running, and that thevery intense “sharp” emission could be seen when the discharge was turned off suddenly [8]. In this case there is alarge current spike (short in time) which accompanies the turning off of the current. Of interest is how this “sharp”emission might be interpreted. We previously proposed that this effect could be a result of Dicke superradiance fromemitting dipoles in a localized region, where the emitting region was thought to be on the order of a square millimeter[33]. In the following section surface deformations will be considered, which will provide a superior interpretation.
We might have conjectured that the very intense spots might be a speckle effect under conditions where the indi-vidual dipole emission is stronger than in the case of beam formation. One argument against such a proposal is thatindividual speckles in this calculation are quite small, with a peak intensity only over a few microns by a few microns.The intense features in Karabut’s data are much larger.

P.L. Hagelstein / Journal of Condensed Matter Nuclear Science 22 (2017) 53–73 63
x (cm)-0.015 -0.010 -0.005 0.000 0.005 0.010 0.015
y (c
m)
-0.015
-0.010
-0.005
0.000
0.005
0.010
0.015
0.0 2.0e+4 4.0e+4 6.0e+4 8.0e+4 1.0e+5 1.2e+5 1.4e+5 1.6e+5
Figure 4. Beam at image plane (located at Z = 25 cm in the case of a dipole density of 5 × 107 cm−2 localized in a circle of radius 100 µm.Marked in yellow is a circle of radius 100 µm).
It is of interest to examine the intensity distribution in the case of beam formation. In Fig. 6 we show a histogramof the intensities when the emitting dipole density is 109 cm−2. This intensity distribution corresponds to the beamillustrated in Fig. 2, which shows some diffraction rings inside near the boundary of the circle. The brightest specklesare seen to be associated with the outermost diffraction ring which is on average brightest. Once again the individualspeckles in this calculation are very small, and we would not expect them to account for the intense spots seen inKarabut’s experiment.
8. Surface Deformation Effects
After a number of runs in the glow discharge, the cathode has undergone plastic deformations (as was clear in experi-ments done at MIT with a copy of Karabut’s system in the 1990s prior to the discovery of the collimated X-ray emissioneffect). Consequently, we would not expect there to be a mathematically flat surface present, even if the cathode some-how started out mathematically flat. There are also transient effects associated with compressional, transverse, anddrum head mode excitation. We would expect the largest dynamic effects to be due to excitation of the drum headmodes.
It is possible to include these effects in our description by working with a displacement field u(x, y, t) which keepstrack of the amount of displacement in the different directions. The intensity pattern including surface displacementcan be written as
I(r, t) ∼
∣∣∣∣∣∣
∑
j
exp
ik|r− rj − u(rj , t)|
∣∣∣∣∣∣
2
. (28)

64 P.L. Hagelstein / Journal of Condensed Matter Nuclear Science 22 (2017) 53–73
The idea here is that the dipole positions rj are specified in the case of a mathematically flat surface. When the surfaceis displaced, the (slowly varying) displacement is added systematically to the initial positions of the dipoles in thecontribution to the phase factors.
Since we expect the largest effect to come from drum head mode displacements and plastic deformations, we canrestrict the surface displacement to be normal to the surface
u(r, t) = izu(x, y, t). (29)
It will be informative to consider the impact of low-order variations in the displacement; consequently, we work witha Taylor series expansion around the origin given by
u(x, y, t) = u(0, 0, t) + x∂u
∂x+ y
∂u
∂y+
1
2x2 ∂
2u
∂x2+ xy
∂2u
∂x∂y+
1
2y2∂2u
∂y2+ · · · , (30)
where the various derivatives are evaluated at x = 0 and y = 0, and may be oscillatory in time.
8.1. Uniform displacement
We consider first the impact of a uniform displacement
u(x, y, t) = u(0, 0, t) = u0(t). (31)
|Σ|20.0 2.0e+4 4.0e+4 6.0e+4 8.0e+4 1.0e+5 1.2e+5 1.4e+5 1.6e+5 1.8e+5
num
ber/b
in
1
10
100
1000
Figure 5. Histogram of intensity for speckle pattern with weak beam of Fig. 4.

P.L. Hagelstein / Journal of Condensed Matter Nuclear Science 22 (2017) 53–73 65
|Σ|20.0 2.0e+6 4.0e+6 6.0e+6 8.0e+6 1.0e+7 1.2e+7 1.4e+7
num
ber/b
in
1
10
100
1000
Figure 6. Histogram of intensity for speckle pattern with beam of Fig. 2 formed at an emitting dipole density of 109 dipoles/cm2 .
In this case we can write for the intensity
I(r, t) ∼
∣∣∣∣∣∣
∑
j
exp
ik|r− rj − izu0(t)|
∣∣∣∣∣∣
2
=
∣∣∣∣∣∣
∑
j
exp
ik√(x− xj)2 + (y − yj)2 + (Z − u0(t))2
∣∣∣∣∣∣
2
. (32)
Since we expect the largest displacement to be very small compared to the distance between the cathode and imageplane
|u0(t)| ≪ Z, (33)
we do not anticipate observable effects from uniform surface displacements.
8.2. Linear displacements
Next we consider linear displacements of the form
u(x, y, t) = a(t)x+ b(t)y. (34)
In this case we can write
66 P.L. Hagelstein / Journal of Condensed Matter Nuclear Science 22 (2017) 53–73
I(r, t) ∼
∣∣∣∣∣∣
∑
j
exp
ik√(x− xj)2 + (y − yj)2 + [Z − a(t)xj − b(t)yj ]2
∣∣∣∣∣∣
2
. (35)
We would expect the beam to be offset (in the high dipole density limit) depending on the surface gradient. We caninclude this effect by writing
I(r′(t), t) = I(r+ ixδx(t) + iyδy(t), t)
∼
∣∣∣∣∣∣
∑
j
exp
ik√[x+ δx(t)− xj ]2 + [y + δy(t)− yj ]2 + [Z − a(t)xj − b(t)yj ]2
∣∣∣∣∣∣
2
. (36)
We can eliminate some of the low-order terms in the phase by choosing
δx(t) = −Za(t), δy(t) = −Za(t). (37)
If we focus on the beam originally at the origin of the image plane then we can write
I (ixδx(t) + iyδy(t), t) ∼
∣∣∣∣∣∣
∑
j
exp
ik√[δx(t)− xj ]2 + [δy(t)− yj ]2 + [Z − a(t)xj − b(t)yj ]2
∣∣∣∣∣∣
2
=
∣∣∣∣∣∣
∑
j
exp
ik√x2j + y2j + Z2 + δx(t)2 + δy(t)2 + [a(t)xj + b(t)yj ]2
∣∣∣∣∣∣
2
. (38)
If the displacements are small, then the higher-order terms can be neglected, and we have the approximate result
I (ixδx(t) + iyδy(t), t) ∼
∣∣∣∣∣∣
∑
j
exp
ik√x2j + y2j + Z2
∣∣∣∣∣∣
2
. (39)
In this approximation the beam is collimated normal to the displaced surface, which is mathematically flat but not inthe x − y plane. The neglected phase factors in this case are present since the image plane is not collinear with thedisplaced flat surface.
8.3. Surface curvature
If the surface is curved, there is the possibility of increasing or reducing the beam intensity, since it may be thatphase coherence can be maintained for more emitting dipoles. In general we can describe a curved surface throughdisplacements of the form
u(x, y) = c(t)x2 + d(t)y2 + f(t)xy. (40)
In this case we can write

P.L. Hagelstein / Journal of Condensed Matter Nuclear Science 22 (2017) 53–73 67
I(r, t) ∼
∣∣∣∣∣∣
∑
j
exp
ik
∣∣∣∣r− rj − iz[c(t)x2j + d(t)y2j + f(t)xjyj ]
∣∣∣∣
∣∣∣∣∣∣
2
=
∣∣∣∣∣∣
∑
j
exp
ik√(x − xj)2 + (y − yj)2 + [Z − c(t)x2
j − d(t)y2j − f(t)xjyj]2∣∣∣∣∣∣
2
. (41)
The intensity at the origin reduces to
I(0, 0, Z, t) ∼
∣∣∣∣∣∣
∑
j
expik√x2j + y2j + [Z − c(t)x2
j − d(t)y2j − f(t)xjyj ]2∣∣∣∣∣∣
2
. (42)
Note that it is possible to arrange for cancellation if
2Zc(t) = 1, 2Zd(t) = 1, f(t) = 0. (43)
In this case we can write
I(0, 0, Z, t) ∼
∣∣∣∣∣∣
∑
j
exp
⎧⎨
⎩ik
√
Z2 +(x2
j + y2j )2
4Z2
⎫⎬
⎭
∣∣∣∣∣∣
2
=∑
j
∑
j′
exp
⎧⎨
⎩ik
⎛
⎝
√
Z2 +(x2
j + y2j )2
4Z2−
√
Z2 +(x2
j′ + y2j′)2
4Z2
⎞
⎠
⎫⎬
⎭ . (44)
We can make use of a Taylor series expansion in this case to write
√
Z2 +ρ4j4Z2
−
√
Z2 +ρ4j′
4Z2=ρ4j − ρ4j′
8Z3+ · · · (45)
The intensity in this limit is approximately
I(0, 0, Z, t) ∼∑
j
∑
j′
exp
ik
((x2
j + y2j )2 − (x2
j′ + y2j′ )2
8Z3
). (46)
It is probably simplest to evaluate the expectation value assuming N emitting dipoles in a circular area with radius ρ0around the origin, in which case the expectation value of the intensity is

68 P.L. Hagelstein / Journal of Condensed Matter Nuclear Science 22 (2017) 53–73
E[I(0, 0, Z, t)] ∼ E
⎡
⎣∑
j
∑
j′
exp
ik
((x2
j + y2j )2 − (x2
j′ + y2j′)2
8Z3
)⎤
⎦
= N2
∣∣∣∣∣E[exp
ik
(ρ4j8Z3
)]∣∣∣∣∣
2
. (47)
To evaluate the expectation value we make use of a radial probability distribution given by
f(ρ) =
⎧⎪⎪⎨
⎪⎪⎩
2ρ
ρ20, 0 ≤ ρ ≤ ρ0,
0, otherwise.
(48)
We can compute
E
[exp
ik
(ρ4j8Z3
)]=
2
ρ20
∫ ρ0
0ρ exp
ik
(ρ4
8Z3
)dρ. (49)
If the circle is sufficiently large, so that
kρ408Z3
=πρ404λZ3
≫ 1 (50)
(the characteristic value of ρ0 for the numbers under consideration is about 2.5 mm) then we obtain
E
[exp
ik
(ρ4j8Z3
)]→ 1√
−i
√2πZ3
kρ40. (51)
In the end we can write
E
⎡
⎣∑
j
∑
j′
exp
ik
((x2
j + y2j )2 − (x2
j′ + y2j′)2
8Z3
)⎤
⎦ =
(2πZ3
kρ40
)N2 =
(λZ3
ρ40
)N2. (52)
This is a much greater intensity that we obtained with earlier models. Collimated X-ray emission under conditionswhere the surface is distorted in this way can result in a very intense beam with a corresponding small spot size at theimage plane.
We note that surface displacement in this case is a focusing effect, with no enhancement in the area integral of theintensity at the image plane. An example of a focused beam with parameters
c(t) = 0.801
2Z, d(t) = 0.80
1
2Z, f(t) = 0 (53)
is illustrated in Fig. 7. A beam in the shape of a line longer than the size of the circle containing the emitting dipolesis shown in Fig. 8. In this case the distorted surface parameters are

P.L. Hagelstein / Journal of Condensed Matter Nuclear Science 22 (2017) 53–73 69
x (cm)-0.015 -0.010 -0.005 0.000 0.005 0.010 0.015
y (c
m)
-0.015
-0.010
-0.005
0.000
0.005
0.010
0.015
0.0 2.0e+7 4.0e+7 6.0e+7 8.0e+7 1.0e+8 1.2e+8 1.4e+8 1.6e+8
Figure 7. Partially focused beam at image plane located at Z = 25 cm in the case of a dipole density of 109 cm−2. Marked in yellow is a circleof radius 100 µm.
c(t) = −0.301
2Z, d(t) = 0.90
1
2Z, f(t) = 0. (54)
9. Discussion and Conclusions
Collimated X-ray emission in the Karabut experiment is an anomaly that cannot be understood based on currentlyaccepted solid state and nuclear physics, which provides motivation for seeking an understanding of the effect. Thereare two possible origins of a collimation effect: either an X-ray laser has been created; or else beam formation is dueto phased array emission. We have argued many times against the proposal that an X-ray laser has been created, in partdue to the absence of any compelling mechanism to produce a population inversion, in part due to the associated highpower density requirement, and in part due to the mismatch between the geometry needed for beam formation and thegeometry of the experiment.
Instead we have conjectured that the collimation is a consequence of phased array emission, a proposal which onthe one hand is free of the strong objections against an X-ray laser mechanism, but which on the other hand brings newissues to resolve. The two most significant mechanistic issues are how excitation in the keV range can be produced, andhow phase coherence might be established. These problems are very serious; however, in our view there are plausiblemechanisms for both of these issues.
Independent of Karabut’s experiment we have for many years been interested in mechanisms that might down-convert a large nuclear quantum in the Fleischmann–Pons experiment, to account for excess heat as due to nuclear re-actions without commensurate energetic nuclear radiation. The big headache in understanding the mechanism throughwhich excess heat is produced is that in a successful experiment one has the possibility of measuring thermal energyand 4He in the gas phase, neither of which at this point shed much light on whatever physical mechanism is involved.

70 P.L. Hagelstein / Journal of Condensed Matter Nuclear Science 22 (2017) 53–73
x (cm)-0.015 -0.010 -0.005 0.000 0.005 0.010 0.015
y (c
m)
-0.015
-0.010
-0.005
0.000
0.005
0.010
0.015
0 1e+7 2e+7 3e+7 4e+7 5e+7 6e+7 7e+7
Figure 8. Beam partially focused in x and defocused in y at image plane located at Z = 25 cm in the case of a dipole density of 109 cm−2.Marked in yellow is a circle of radius 100 µm.
If the large nuclear quantum is being down-converted, then we would want to study the down-conversion mechanismin a different kind of experiment more easily diagnosed and interpreted. Because of the intimate theoretical connectionbetween up-conversion and down-conversion, we have the possibility of understanding how down-conversion worksby studying up-conversion. Initially we contemplated a theory-based experiment in which THz vibrations would beup-converted to produce excitation at 1565 eV in 201Hg nuclei, which has the lowest energy excited state of all thestable nuclei, and which would decay primarily by internal conversion but also in part via X-ray emission. In thisproposed theory-based experiment we recognized that the up-conversion of vibrational energy would result in phasecoherence, with the possibility of phased array beam formation. The claim of collimated X-ray emission near 1.5 keVin the Karabut experiment drew our attention since it seemed that the up-conversion experiment that we were interestedmight have already been implemented. From this perspective collimation in the Karabut experiment could be inter-preted as an experimental confirmation of the up-conversion mechanism, primarily since there seems to be no otherplausible interpretation. Collimated X-ray emission claimed in some cases near 1.5 keV in the water jet experimentsof Kornilova, Vysotskii and coworkers [34–37] seems to us to be closely related, and to provide another experimentwhere up-conversion is observed (a point of view we note that is at odds with the theoretical explanation put forth byVysotskii in these references).
One motivation for the modeling described in this paper was to see whether we might develop constraints on thenumber of emitting dipoles involved, which according to our picture would shed light on the number of mercury atomspresent on the surface. We had thought initially that low levels of mercury as an impurity in the cathodes or in thegas might be responsible for the collimated emission; however, the spectra published by Karabut shows no indicationof edge absorption which favors implantation from mercury contamination in the discharge gas. For example, theK-edge absorption in aluminum starts at 1562 eV, which should be readily apparent if the emission originates in thebulk. The transmission for a 1 µm Al layer is close to 90% below the K-edge, and near 30% above the K-edge (see

P.L. Hagelstein / Journal of Condensed Matter Nuclear Science 22 (2017) 53–73 71
E (eV)0 500 1000 1500 2000
trans
mis
sion
0.0
0.2
0.4
0.6
0.8
1.0
Figure 9. Transmission through 1 µm of Al as a function of the X-ray energy from Henke’s online x-ray transmission calculator.
Fig. 9); this difference would be readily apparent in the spectra if the emission was due to bulk radiators. The absenceof an observable K-edge absorption feature in the spectrum suggests that the emission is localized to within 0.1 µmor less from the surface, which is consistent with implantation from the mercury as an impurity in the discharge gas.Beam formation requires a dipole density above a threshold value, and we have estimated the threshold to correspondto about 1.5 × 10¹¹ emitting dipoles in the Karabut experiment. Probably the total number of dipoles is on the orderof 1.5 × 10¹² or higher, to be consistent with unambiguous beam formation. Since the natural abundance of 201Hg is13.18%, this puts the total number of mercury atoms at or above 1013.
For beam formation we made use of a model based on emitting dipoles randomly positioned on a mathematicalplane within a circle, to match the cathode geometry in Karabut’s experiment. Beam formation in this case requiresboth uniform phase, and for there to be a mathematical plane to restrict random variations in position normal to thesurface. In previous work presented at ICCF17 we assumed that the dipoles were randomly spaced in a volume nearthe surface, which could produce speckles, but we did not appreciate at the time that this model does not produce abeam of about the same size as the cathode. The orientation of the crystal planes aligned with the surface produced bythe rolling process used in the fabrication of the foils from which the cathodes are taken is critical for beam formation,based on the model studied in this paper.
We have speculated previously about the origin of the very intense spots and lines that appear on the film (andwhich produces film damage), including proposals that small fraction of the surface produces a collimated beam toform a spot, and that a line might be produced by a steering effect. Here we have shown that surface deformation canproduce a focusing of the beam, both in one dimension to produce a line, and in two dimensions to produce a spot.This new picture provides in our view a much stronger argument than the earlier speculation.
We have previously speculated at ICCF17 that the bursts in emission following the turning off of the dischargewas due to nonlinear Rabi oscillations in the donor and receiver model, a proposal strongly criticized by Vysotskii[38] on the grounds that the strong coupling needed to produce such rapid nonlinear Rabi oscillations was unlikely. In

72 P.L. Hagelstein / Journal of Condensed Matter Nuclear Science 22 (2017) 53–73
retrospect Vysotskii’s argument seems right, and we have subsequently been thinking about new models for the up-conversion which will be discussed elsewhere. However, in these models the burst effect comes about from the basictime dependence of the phonon–nuclear coupling matrix element, which in this case involves two photon exchangesince the transition is M1 and the phonon-nuclear interaction is E1, to produce a cos4 ω0t time-dependence whichis sharpened by a nonlinearity associated with local up-conversion effects. In this picture the excitation of the 201Hgtransition is from excitation transfer from much more strongly coupled transitions in the cathode holder and steel targetchamber, and drum head mode excitation of the cathode mediates this excitation transfer.
References
[1] A.B. Karabut, Ya.R. Kucherov and I. B. Savvatimova, Nuclear product ratio for glow discharge in deuterium, Phys. Lett. A.170 (1992) 265–272.
[2] A.B. Karabut, Research into powerful solid X-ray laser (wave length is 0.8–1.2 nm) with excitation of high current glowdischarge ions, Proc. 11th Int. Conf. on Emerging Nuclear Energy Systems, 29 September–4 October 2002, Albuquerque,New Mexico, USA, pp. 374–381.
[3] A.B. Karabut, Experimental research into characteristics of X-ray emission from solid-state cathode medium of high-currentglow discharge, Proc. 10th Int. Conf. on Cold Fusion, August 24–29, 2003, Cambridge, MA, USA.
[4] A.B. Karabut, Research into characteristics of X-ray emission laser beams from solid-state cathode medium of high currentglow discharge, Proc. 11th Int. Conf. on Cold Fusion, 31 October–5 November, 2004, France, pp. 253–257.
[5] A.B. Karabut, Study of energetic and temporal characteristics of X-ray emission from solid state cathode medium of highcurrent glow discharge, Proc. 12th Int. Conf. on Cold Fusion, December 2–7, 2006, Japan, pp. 344–350.
[6] A.B. Karabut and E.A. Karabut, Research into energy spectra of X-ray emission from solid cathode medium during thehigh current glow discharge operation and after the glow discharge current switch off, Proc. 14th Int. Conf. on Cold Fusion,August 10–15, 2008, USA.
[7] A.B. Karabut and E.A. Karabut, Study of deuterium loading into Pd cathode samples of glow discharge, Proc. 9th Int.Workshop on Anomalies in Hydrogen/Deuterium Gas Loaded Metals, 6–11 September 2010, Siena, Italy.
[8] A.B. Karabut, E.A. Karabut and P.L. Hagelstein, Spectral and temporal characteristics of X-ray emission from metal elec-trodes in a high-current glow discharge, J. Condensed Matter Nucl. Sci. 6 (2012) 217.
[9] A.B. Karabut and E.A. Karabut, Research into excited 0.6–6.0 keV energy levels in the cathode solid medium of glowdischarge by X-ray spectra emission, J. Condensed Matter Nucl. Sci. 8 (2012) 159.
[10] A.B. Karabut, Research into excited long lived 0.6–6.0 keV energy levels in the cathode solid medium of glow discharge byX-ray spectra emission, J. Materials Sci. Eng. B 3 (2013) 298.
[11] B.I. Ivlev, X-ray laser pulses from solids, arXiv preprint arXiv:1512.08504 (2015).[12] B.I. Ivlev, Conversion of zero point energy into high-energy photons, Revista Mexicana de Física 62 (2016) 83–88.[13] P.L. Hagelstein, Physics of short-wavelength-laser design, Ph.D. Thesis, MIT, 1981.[14] P.L. Hagelstein and I.U. Chaudhary. Phonon models for anomalies in condensed matter nuclear science, Current Sci. 108
(2015) 507.[15] P.L. Hagelstein, Directional X-ray and gamma emission in experiments in condensed matter nuclear science, Current Sci.
108 (2015) 601.[16] P.L. Hagelstein, Current status of the theory and modeling effort based on fractionation, J. Condensed Matter Nucl. Sci. 19
(2016) 98–109.[17] I.L. Dillamore and W.T. Roberts, Preferred orientation in wrought and annealed metals, Metallurgical Rev. 10 (1965) 271–
380.[18] R. Gotthardt, G. Hoschek, O. Reimold and F. Haessner, Topographic arrangement of crystallite orientations in rolled copper,
Texture 1 (1972) 99–109.[19] H. Hu, Texture of metals, Texture 1 (1974) 233–258.[20] Y. Lo, A mathematical theory of antenna arrays with randomly spaced elements, IEEE Trans. Antennas and Propagation 12
(1964) 257–268.

P.L. Hagelstein / Journal of Condensed Matter Nuclear Science 22 (2017) 53–73 73
[21] V.D. Agrawal and Y.T. Lo, Distribution of sidelobe level in random arrays, Proc. IEEE 57 (1969) 1764–1765.[22] B. Steinberg, The peak sidelobe of the phased array having randomly located elements, IEEE Trans. Antennas and Propa-
gation 20 (1972) 129–136.[23] M. Donvito and S. Kassam, Characterization of the random array peak sidelobe, IEEE Trans. Antennas and Propagation 27
(1979) 379–385.[24] H. Ochiai, P. Mitran, H.V. Poor and V. Tarokh, Collaborative beamforming in ad hoc networks, Information Theory Workshop
IEEE (2004) 396–401.[25] N.N. Ma, K. Buchanan, J. Jensen and G. Huff, Distributed beamforming from triangular planar random antenna arrays,
Military Commun. Conf. MILCOM, IEEE (2015) 553–558.[26] J.V. Thorn, N.O. Booth and J.C. Lockwood, Random and partially random acoustic arrays, J. Acoustical Soc. Amer. 67
(1980) 1277–1286.[27] W.S. Hodgkiss, Random acoustic arrays, Underwater Acoustics and Signal Processing, Springer Netherlands, 1981, pp.
327–338.[28] K.R. Buchanan, Theory and applications of aperiodic (random) phased arrays, Ph.D. dissertation, Texas A&M University,
2014.[29] J.D. Jackson, Classical Electrodynamics, Wiley, New York, 1975.[30] A.B. Karabut, X-ray emission in the high current density glow discharge experiments, Proc. ICCF9 (2002) 155–158.[31] D.H. Johnson and D.E. Dudgeon, Array Signal Processing, Prentice-Hall, Upper Saddle River, NJ, 1993. See Section 3.3.6
on Random Arrays.[32] J.W. Goodman, Some fundamental properties of speckle, J. Optical Soc. Amer. 66 (1976) 1145–1150.[33] P.L. Hagelstein and I.U. Chaudhary, A model for collimated X-ray emission in the Karabut experiment, Proc. ICCF17
(2013).[34] A.A. Kornilovaa, V.I. Vysotskii, N.N. Sysoev, N.K. Litvin, V.I. Tomak and A.A. Barzov, Shock cavitational mechanism of
X-ray generation during fast water stream cavitation, Moscow University Physics Bulletin 65 (2010) 46.[35] A.A. Kornilova, V.I. Vysotskii, N. N. Sysoev, N.K. Litvin, V.I. Tomak and A.A. Barzov, Generation of intense X-rays during
ejection of a fast water jet from a metal channel to atmosphere, J. Surface Investigation. X-ray, Synchrotron and NeutronTechniques 4 (2010)1008.
[36] V.I. Vysotskii, A.A. Kornilova, A.O. Vasilenko and V.I. Tomak, Detection and investigation of undamped temperature wavesexcited under water jet cavitation, J. Surface Investigation. X-ray, Synchrotron and Neutron Techniques 8 (2014) 1186–1192.
[37] V.I. Vysotskii, A.A. Kornilova and A.O. Vasilenko, Observation and investigation of anomalous X-ray and thermal effectsof cavitation, Current Sci. 108 (2015) 608.
[38] V.I. Vysotskii, private communication.