jordan sands, llc – mankato, mn overall strategy for assessing ambient impacts from operations at...
TRANSCRIPT
www.pca.state.mn.us
Minnesota Pollution Control Agency 651-296-6300 | 800-657-3864 or use your preferred relay service | [email protected]
January 2018 | g-7-01 Available in alternative formats
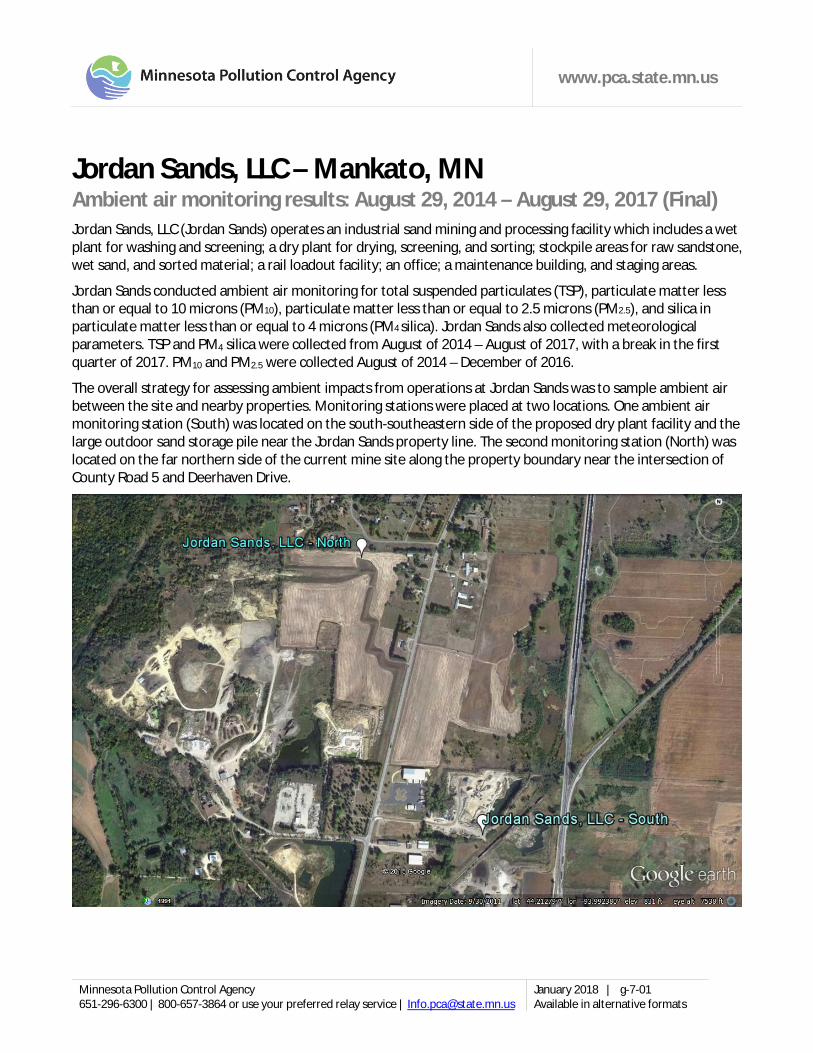
Jordan Sands, LLC – Mankato, MN Ambient air monitoring results: August 29, 2014 – August 29, 2017 (Final) Jordan Sands, LLC (Jordan Sands) operates an industrial sand mining and processing facility which includes a wet plant for washing and screening; a dry plant for drying, screening, and sorting; stockpile areas for raw sandstone, wet sand, and sorted material; a rail loadout facility; an office; a maintenance building, and staging areas.
Jordan Sands conducted ambient air monitoring for total suspended particulates (TSP), particulate matter less than or equal to 10 microns (PM10), particulate matter less than or equal to 2.5 microns (PM2.5), and silica in particulate matter less than or equal to 4 microns (PM4 silica). Jordan Sands also collected meteorological parameters. TSP and PM4 silica were collected from August of 2014 – August of 2017, with a break in the first quarter of 2017. PM10 and PM2.5 were collected August of 2014 – December of 2016.
The overall strategy for assessing ambient impacts from operations at Jordan Sands was to sample ambient air between the site and nearby properties. Monitoring stations were placed at two locations. One ambient air monitoring station (South) was located on the south-southeastern side of the proposed dry plant facility and the large outdoor sand storage pile near the Jordan Sands property line. The second monitoring station (North) was located on the far northern side of the current mine site along the property boundary near the intersection of County Road 5 and Deerhaven Drive.
Page 2 of 14 January 2018 | g-7-01
Important dates to note for interpretation of this data report · Jordan Sands received an air permit on October 4, 2013. · Jordan Sands started their sand dryer and the final leg of processing on December 5, 2014. · Jordan Sands placed a sample saver on the air samplers to reduce passive loading on August 1, 2015. · Jordan Sands agreed to six additional months of ambient air sampling on their fenceline commencing on
March 1, 2017. · Jordan Sands completed their monitoring requirement on August 29, 2017.
Total suspended particulates In Minnesota, TSP levels in the air are regulated through the Minnesota Ambient Air Quality Standards (MAAQS), which are defined in Minnesota Administrative Rules 7009.0010 to 7009.0080. The MAAQS includes four distinct standards for TSP. These standards include:
Minnesota Ambient Air Quality Standards for TSP
Standard Type Time Interval Level of Standard A monitoring site meets the standard if…
Primary1 Daily (24-hour) 260 micrograms per cubic
meter ...the annual 2nd highest daily TSP concentration is less than or equal to 260 µg/m3
Annual 75 micrograms per cubic meter
...the annual geometric mean is less than or equal to 75 µg/m3
Secondary2 Daily (24-hour) 150 micrograms per cubic
meter ...the annual 2nd highest daily TSP concentration is less than or equal to 150 µg/m3
Annual 60 micrograms per cubic meter
...the annual geometric mean is less than or equal to 60 µg/m3
1A primary standard is set to protect against human health effects associated with exposure to an air pollutant. 2A secondary standard is set to protect against environmental or public welfare effects associated with exposure to an air pollutant.
Comparisons to the annual TSP standards A complete calendar year of data is required to compare monitoring results to the annual TSP standards. A monitoring site violates the annual TSP standards if the annual geometric mean TSP concentration is greater than 60 µg/m3 (secondary standard) or 75 µg/m3 (primary standard). With data currently available from August 29, 2014 – August 29, 2017, there was only sufficient data to assess compliance for the 2015 and 2016 data years. In 2015 and 2016, the annual geometric mean TSP concentration at the North monitor was 23.2 µg/m3 and 19.3 µg/m3 respectively. The annual geometric mean TSP concentration at the south monitor was 40.3 µg/m3 in 2015 and 29.1 µg/m3 in 2016. The North and South monitors met the annual TSP standards in 2015 and 2016.
TSP results compared to the annual TSP standards at the North monitor
Annual Geometric Mean (µg/m3)
Primary Standard Secondary Standard
2014 Insufficient data to determine compliance with standards.
2015 23.2 75 µg/m3 60 µg/m3
2016 19.3* 75 µg/m3 60 µg/m3
Page 3 of 14 January 2018 | g-7-01
TSP results compared to the annual TSP standards at the South monitor
Annual Geometric Mean (µg/m3)
Primary Standard Secondary Standard
2014 Insufficient data to determine compliance with standards.
2015 40.3 75 µg/m3 60 µg/m3
2016 29.1* 75 µg/m3 75 µg/m3 *Sampling was terminated on December 14, 2016. Two additional samples are needed for a complete year of air data; however, since the data set as a whole met a 75% completeness level and draft design value (annual geometric mean) was calculated for TSP at these two sites.
Comparisons to the daily TSP standards Incomplete annual data sets can be used to identify exceedances and violations of the daily TSP standards, but cannot be used to demonstrate annual compliance with the daily standards. A monitoring site violates the daily TSP standard if the annual second highest 24-hour average TSP concentration is greater than 150 µg/m3 (secondary standard) or 260 µg/m3 (primary standard).
North monitor From August 29, 2014 – August 29, 2017 there was one exceedance of the secondary daily TSP standard at the North monitor (April 12, 2015). There were no exceedances of the primary daily TSP standard.
TSP results compared to the daily TSP standards at the North monitor
2nd Highest 24-Hour TSP Concentration (µg/m3)
Primary Standard (260 µg/m3) Secondary Standard (150 µg/m3)
2014 71.51 Does not violate, but insufficient data to determine compliance with standards
2015 92.29 Meets Meets
2016 83.66* Meets Meets
South monitor From August 29, 2014 – August 29, 2017, were four exceedances of the secondary TSP standard. Two of these exceedances occurred in 2014, one occurred in 2015, and one in 2016. As a result, in 2014 the South monitor violated the secondary daily TSP standard. In 2015, the South monitor met both daily TSP standards. Based on data currently available, the South monitor did not violate the secondary daily TSP standard in 2016.
TSP results compared to the daily TSP standards at the South monitor
2nd Highest 24-Hour TSP Concentration (µg/m3)
Primary Standard (260 µg/m3) Secondary Standard (150 µg/m3)
2014 171.35 Does not violate, but insufficient data to determine compliance with
standards
Violates
2015 113.35 Meets Meets
2016 133.00* Meets Meets
*Sampling was terminated on December 14, 2016. Two additional samples are needed for a complete year of air data, however, since the data set as a whole met a 75% completeness level and draft design value (annual 2nd highest daily value) was calculated for TSP at these two sites.
Page 4 of 14 January 2018 | g-7-01
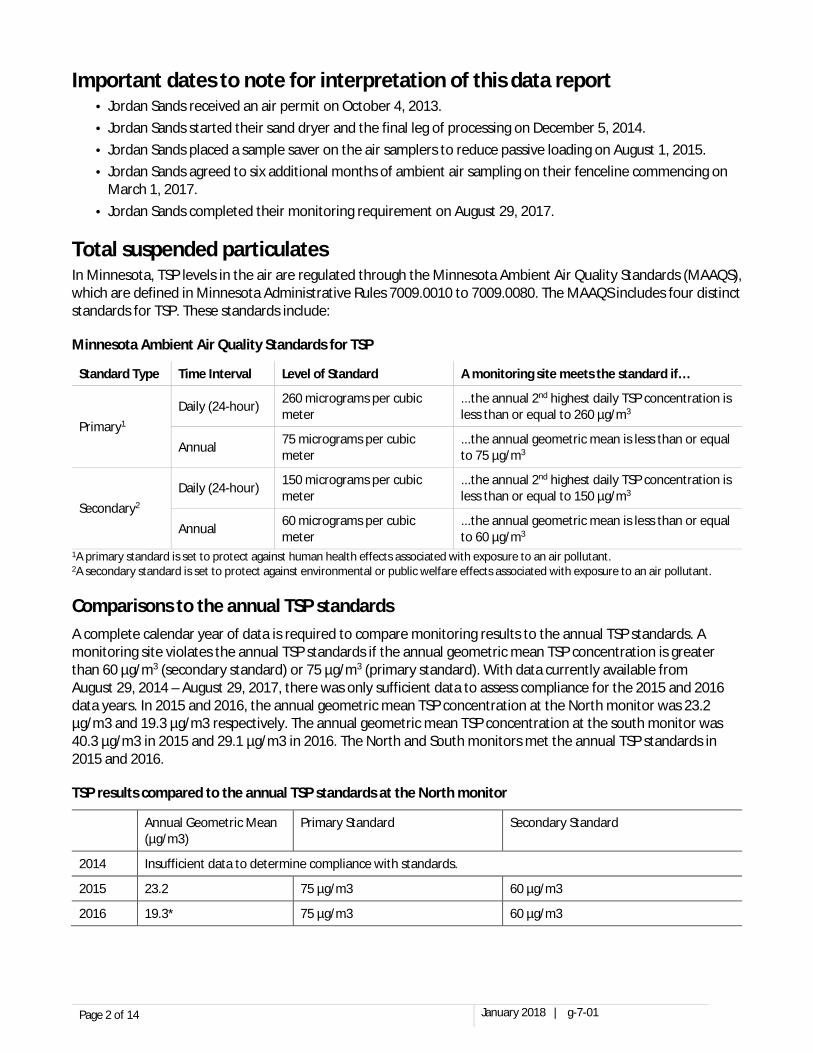
TSP monitoring results: Jordan Sands, LLC - North monitor
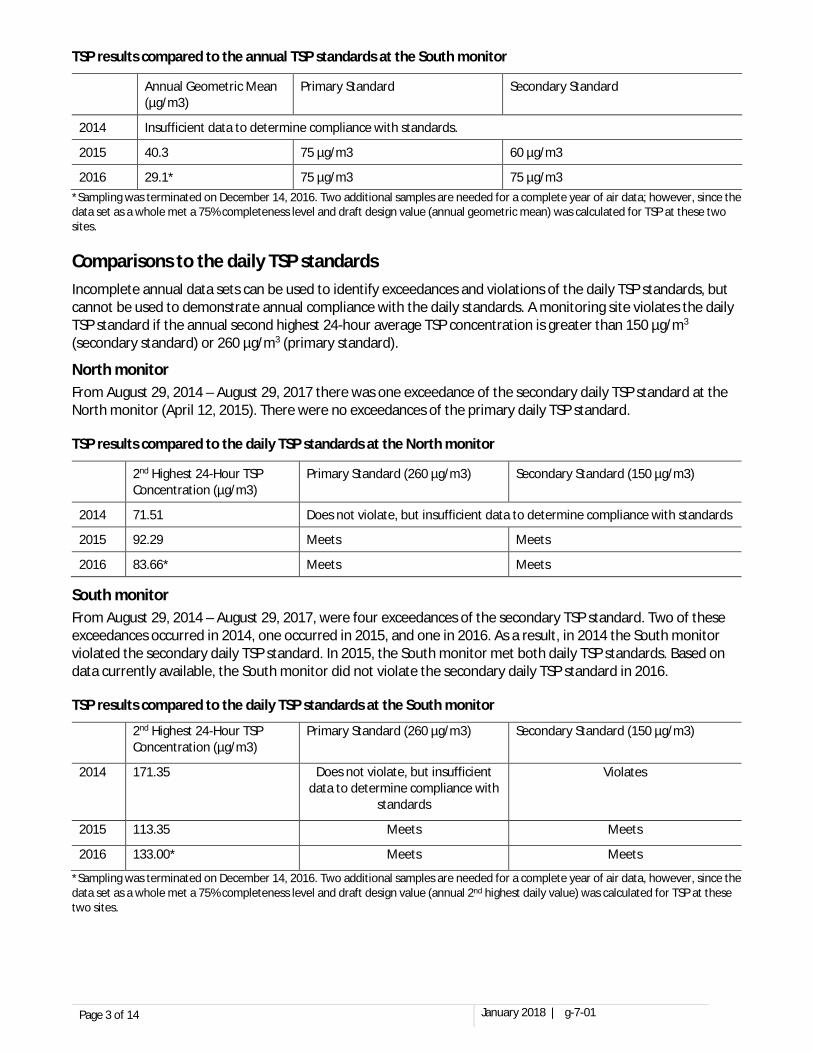
TSP monitoring results: Jordan Sands, LLC - South monitor
Daily average TSP pollution rose: Jordan Sands, LLC – North and South monitors1 A pollution rose is used to describe pollutant concentrations and associated wind directions visually. A pollution rose analysis is useful for identifying potential sources associated with air monitoring results. The location of the wedges on the plot indicates the direction the wind is blowing from and their length describes how frequently the wind came from that direction. The colors of the wedges describe the pollutant concentration.
The pollution roses below reflect higher TSP concentrations captured at the North monitor when the wind blows from the south, which is the direction of the Jordan Sands facility. The higher TSP concentrations captured by the South monitor occurred when the winds blow from the northwest, which is the direction of the Jordan Sands facility.
1 Note: Wind direction data (8.2014 – 8.2017), provided by Jordan Sands, was reported in cardinal directions. To produce the wind and pollution rose plots, the reported cardinal directions were converted to compass degrees at the midpoint.

Page 5 of 14 January 2018 | g-7-01
Evaluation of TSP exceedance days
October 8, 2014 – TSP concentration = 171.3 µg/m3 The first recorded exceedance of the secondary daily TSP standard at Jordan Sands, LLC occurred on October 8, 2014. The TSP exceedance was recorded at the South monitor. The TSP concentration at the South monitor was more than three-times higher than TSP concentrations measured at the North monitor. Available meteorological data indicate that on October 8, 2014, winds near the monitoring site were predominately from the west-northwest.
TSP monitoring results: October 8, 2014
Wind rose analysis: October 8, 2014 A wind rose is used to describe wind direction and speed visually. A wind rose analysis is useful for identifying potential sources associated with air monitoring results. The location of the wedges on the plot indicates the direction the wind is blowing from and their length describes how frequently the wind came from that direction. The colors of the wedges describe wind speeds. The monitor located on the north boundary of this facility captures facility-related air emissions coming from the south. The monitor located on the southeastern boundary of this facility captures facility-related air emissions coming from the northwest. The predominant wind direction on October 8, 2014, was from the northwest, therefore the South monitor would have captured facility-related air emissions on this date.

Page 6 of 14 January 2018 | g-7-01
October 20, 2014 - TSP concentration = 193.2 µg/m3 The second exceedance of the secondary daily TSP standard at Jordan Sands, LLC occurred on October 20, 2014. The TSP exceedance was recorded at the South monitor. The TSP concentration at the South monitor was more than three-times higher than TSP concentrations measured at the North monitor. Available meteorological data indicate that on October 20, 2014, winds near the monitoring site were predominately from the north-northwest. Because this exceedance was the second exceedance of the secondary daily TSP standard in 2014, this exceedance resulted in a violation of the secondary daily TSP standard.
TSP monitoring results: October 20, 2014
Wind rose analysis: October 20, 2014 A wind rose is used to describe wind direction and speed visually. A wind rose analysis is useful for identifying potential sources associated with air monitoring results. The location of the wedges on the plot indicates the direction the wind is blowing from and their length describes how frequently the wind came from that direction. The colors of the wedges describe wind speeds. The monitor located on the north boundary of this facility captures facility-related air emissions coming from the south. The monitor located on the southeastern boundary of this facility captures facility-related air emissions coming from the northwest. The predominant wind direction on October 20, 2014, was from the northwest, therefore the South monitor would have captured facility-related air emissions on this date.

Page 7 of 14 January 2018 | g-7-01
February 17, 2015 - TSP concentration = 194.8 µg/m3 The third exceedance of the secondary daily TSP standard at Jordan Sands, LLC occurred on February 17, 2015. The TSP exceedance was recorded at the South monitor. The TSP concentration at the South monitor was more than six-times higher than TSP concentrations measured at the North monitor. Available meteorological data indicate that on February 17, 2015, winds near the monitoring site were predominately from the west-northwest. Because this exceedance was the first exceedance of the secondary daily TSP standard in 2015, this exceedance does not result in a violation of the secondary daily TSP standard. If an additional TSP exceedance was measured at the South monitor in 2015, the secondary daily TSP standard would have been violated.
TSP monitoring results: February 17, 2015
Wind rose analysis: February 17, 2015 A wind rose is used to describe wind direction and speed visually. A wind rose analysis is useful for identifying potential sources associated with air monitoring results. The location of the wedges on the plot indicates the direction the wind is blowing from and their length describes how frequently the wind came from that direction. The colors of the wedges describe wind speeds. The monitor located on the north boundary of this facility captures facility-related air emissions coming from the south. The monitor located on the southeastern boundary of this facility captures facility-related air emissions coming from the northwest. The predominant wind direction on February 17, 2015, was from the northwest; therefore, the South monitor would have captured facility-related air emissions on this date.
Page 8 of 14 January 2018 | g-7-01
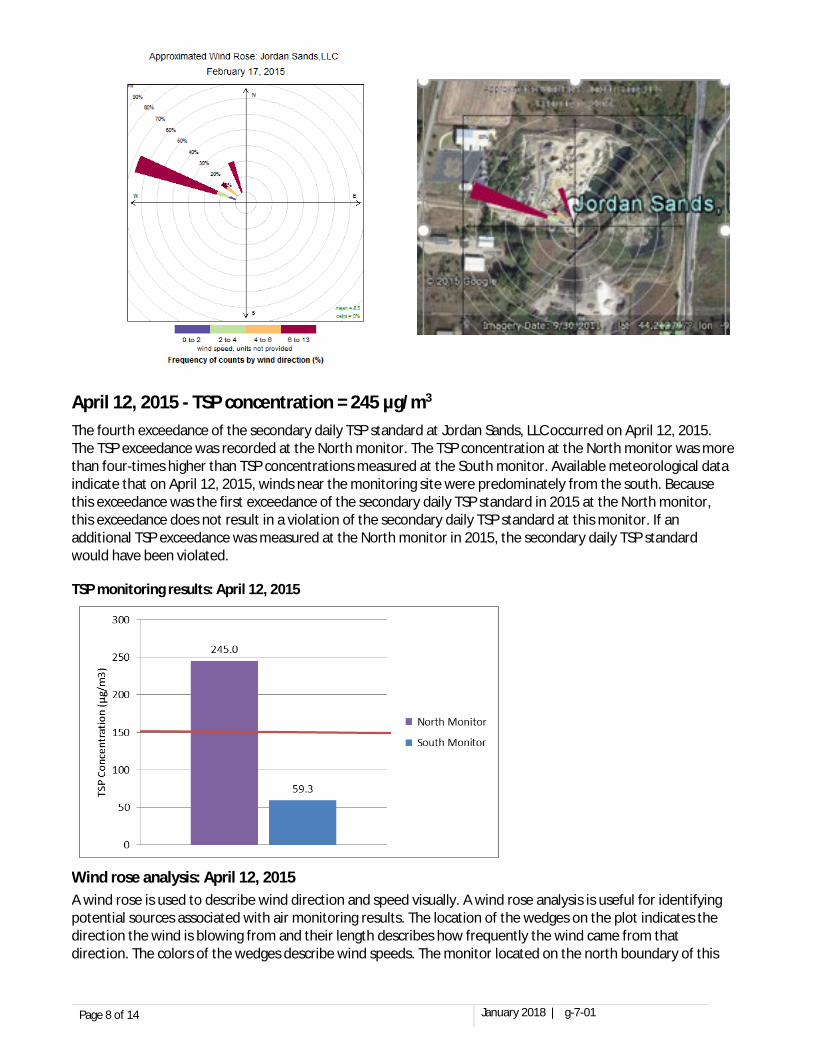
April 12, 2015 - TSP concentration = 245 µg/m3 The fourth exceedance of the secondary daily TSP standard at Jordan Sands, LLC occurred on April 12, 2015. The TSP exceedance was recorded at the North monitor. The TSP concentration at the North monitor was more than four-times higher than TSP concentrations measured at the South monitor. Available meteorological data indicate that on April 12, 2015, winds near the monitoring site were predominately from the south. Because this exceedance was the first exceedance of the secondary daily TSP standard in 2015 at the North monitor, this exceedance does not result in a violation of the secondary daily TSP standard at this monitor. If an additional TSP exceedance was measured at the North monitor in 2015, the secondary daily TSP standard would have been violated.
TSP monitoring results: April 12, 2015
Wind rose analysis: April 12, 2015 A wind rose is used to describe wind direction and speed visually. A wind rose analysis is useful for identifying potential sources associated with air monitoring results. The location of the wedges on the plot indicates the direction the wind is blowing from and their length describes how frequently the wind came from that direction. The colors of the wedges describe wind speeds. The monitor located on the north boundary of this

Page 9 of 14 January 2018 | g-7-01
facility captures facility-related air emissions coming from the south. The monitor located on the southeastern boundary of this facility captures facility-related air emissions coming from the northwest. The predominant wind direction on April 12, 2015, was from the south, therefore the North monitor would have captured facility-related air emissions on this date.
May 6, 2016 - TSP concentration = 167.1 µg/m3 The fifth exceedance of the secondary daily TSP standard at Jordan Sands, LLC occurred on May 6, 2016. The TSP exceedance was recorded at the South monitor. The TSP concentration at the South monitor was approximately 30% higher than TSP concentrations measured at the North monitor. Available meteorological data indicate that on May 6, 2016, winds near the monitoring site were predominately from the southeast and the southwest. Because this exceedance was the only measured exceedance of the secondary daily TSP standard in 2016, this exceedance does not result in a violation of the secondary daily TSP standard.
TSP monitoring results: May 6, 2016
Wind rose analysis: May 6, 2016 A wind rose is used to describe wind direction and speed visually. A wind rose analysis is useful for identifying potential sources associated with air monitoring results. The location of the wedges on the plot indicates the direction the wind is blowing from and their length describes how frequently the wind came from that direction. The colors of the wedges describe wind speeds. On May 6, 2016, the predominant winds were

Page 10 of 14 January 2018 | g-7-01
coming from the south, with higher winds from the southwest, and some higher winds from the northwest. The monitor located on the north boundary of this facility captures facility-related air emissions coming from the south. The monitor located on the southeastern boundary of this facility captures facility-related air emissions coming from the northwest. The predominant wind direction on May 6, 2016, was from the south; therefore, the North monitor would have captured facility-related air emissions on this date.
PM10 In Minnesota, PM10 levels in the air are regulated through the National Ambient Air Quality Standards (NAAQS) and the Minnesota Ambient Air Quality Standards (MAAQS). The national standards are defined in Title 40 of the Code of Federal Regulations at Part 50, and the state standards are defined in Minnesota Administrative Rules 7009.0010 to 7009.0080. The PM10 NAAQS and MAAQS include a daily standard of 150 µg/m3. A monitoring site meets the daily PM10 standard if the average number of expected exceedance days over a three-year period is less than one.
Comparisons to the daily PM10 standard A monitoring site meets the daily PM10 standard if the average number of expected exceedance days over a three-year period is less than one. No exceedances of the daily PM10 standard of 150 µg/m3 were measured at the North and South monitors at Jordan Sands.
PM10 monitoring results: Jordan Sands, LLC - North monitor

Page 11 of 14 January 2018 | g-7-01
PM10 monitoring results: Jordan Sands, LLC - South monitor
Daily average PM10 pollution rose: Jordan Sands, LLC – North and South monitors A pollution rose is used to describe pollutant concentrations and associated wind directions visually. A pollution rose analysis is useful for identifying potential sources associated with air monitoring results. The location of the wedges on the plot indicates the direction the wind is blowing from and their length describes how frequently the wind came from that direction. The colors of the wedges describe the pollutant concentration.
The pollution roses below reflect higher PM10 concentrations captured at the North monitor when the wind blows from the south, which is the direction of the Jordan Sands facility. The higher PM10 concentrations captured by the South monitor occurred when the winds blow from the northwest and the southeast, which is in part the direction of the Jordan Sands facility but also reflects the dominant wind directions.
Page 12 of 14 January 2018 | g-7-01
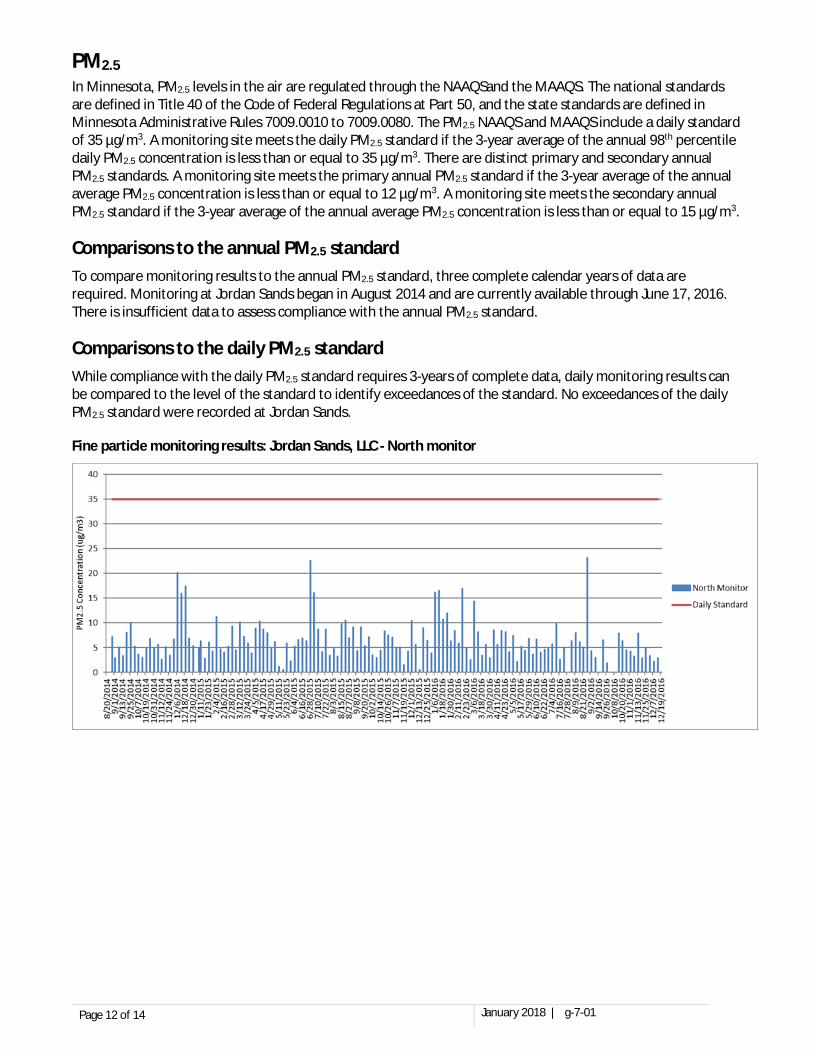
PM2.5 In Minnesota, PM2.5 levels in the air are regulated through the NAAQSand the MAAQS. The national standards are defined in Title 40 of the Code of Federal Regulations at Part 50, and the state standards are defined in Minnesota Administrative Rules 7009.0010 to 7009.0080. The PM2.5 NAAQS and MAAQS include a daily standard of 35 µg/m3. A monitoring site meets the daily PM2.5 standard if the 3-year average of the annual 98th percentile daily PM2.5 concentration is less than or equal to 35 µg/m3. There are distinct primary and secondary annual PM2.5 standards. A monitoring site meets the primary annual PM2.5 standard if the 3-year average of the annual average PM2.5 concentration is less than or equal to 12 µg/m3. A monitoring site meets the secondary annual PM2.5 standard if the 3-year average of the annual average PM2.5 concentration is less than or equal to 15 µg/m3.
Comparisons to the annual PM2.5 standard To compare monitoring results to the annual PM2.5 standard, three complete calendar years of data are required. Monitoring at Jordan Sands began in August 2014 and are currently available through June 17, 2016. There is insufficient data to assess compliance with the annual PM2.5 standard.
Comparisons to the daily PM2.5 standard While compliance with the daily PM2.5 standard requires 3-years of complete data, daily monitoring results can be compared to the level of the standard to identify exceedances of the standard. No exceedances of the daily PM2.5 standard were recorded at Jordan Sands.
Fine particle monitoring results: Jordan Sands, LLC - North monitor
Page 13 of 14 January 2018 | g-7-01
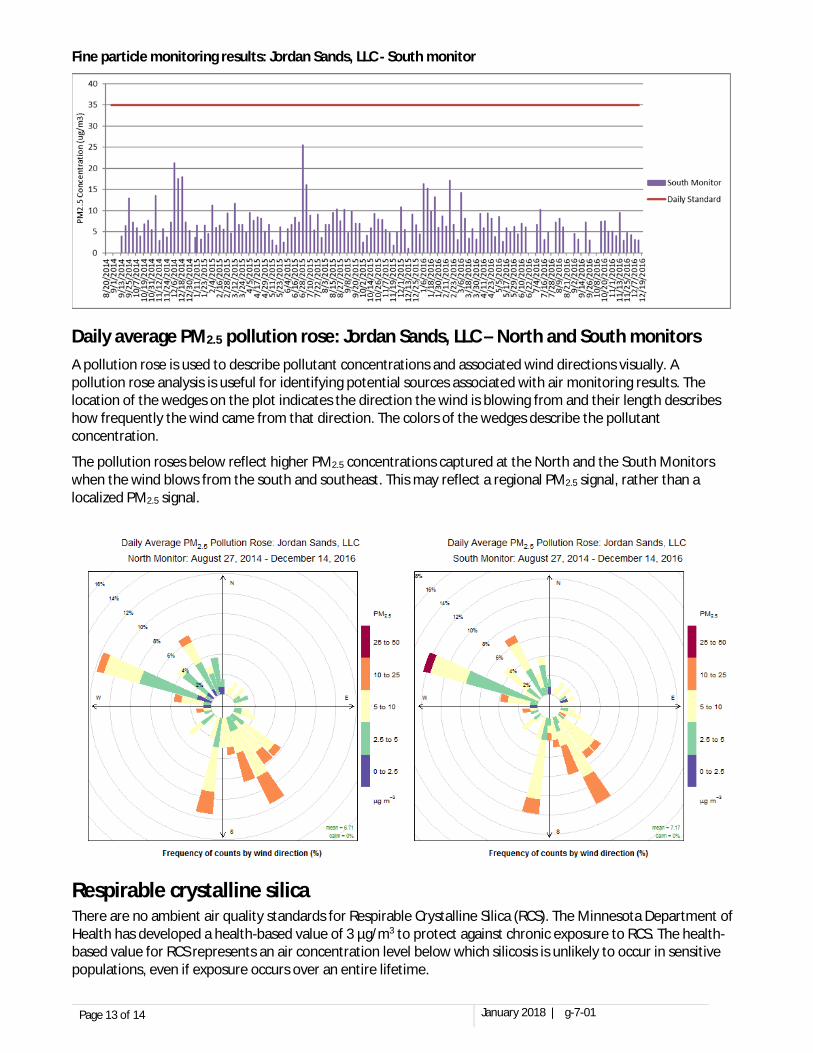
Fine particle monitoring results: Jordan Sands, LLC - South monitor
Daily average PM2.5 pollution rose: Jordan Sands, LLC – North and South monitors A pollution rose is used to describe pollutant concentrations and associated wind directions visually. A pollution rose analysis is useful for identifying potential sources associated with air monitoring results. The location of the wedges on the plot indicates the direction the wind is blowing from and their length describes how frequently the wind came from that direction. The colors of the wedges describe the pollutant concentration.
The pollution roses below reflect higher PM2.5 concentrations captured at the North and the South Monitors when the wind blows from the south and southeast. This may reflect a regional PM2.5 signal, rather than a localized PM2.5 signal.
Respirable crystalline silica There are no ambient air quality standards for Respirable Crystalline Silica (RCS). The Minnesota Department of Health has developed a health-based value of 3 µg/m3 to protect against chronic exposure to RCS. The health-based value for RCS represents an air concentration level below which silicosis is unlikely to occur in sensitive populations, even if exposure occurs over an entire lifetime.

Page 14 of 14 January 2018 | g-7-01
The majority of the RCS monitoring results at Jordan Sands were below the method detection limit. The detected RCS levels at Jordan Sands were below the chronic health benchmark of 3 µg/m3.
RCS monitoring results: Jordan Sands, LLC - North monitor
RCS monitoring results: Jordan Sands, LLC - South monitor
Note: BDL indicates a sample was collected but the result was below the detection limit