joint time frequency vibration diagnostics of main …€¦ · application of joint time-frequency...
TRANSCRIPT

AIAC14 Fourteenth Australian International Aerospace Congress
7th DSTO International Conference on Health & Usage Monitoring (HUMS 2011)
Joint Time Frequency Vibration Diagnostics of Main and Engine Accessory Gearboxes
Carl S. Byington, P.E., Matthew J. Watson, Jeremy S. Sheldon, Hyungdae Lee, Ph.D., and
Genna Mott
Impact Technologies, LLC, 200 Canal View Blvd, Rochester, NY 14623, USA
Abstract Vibration diagnostics that assume a “stationary” monitored signal are not effective for main and engine accessory gearboxes because the operating conditions (speed and/or load) of these components are often non-stationary, which leads to spectral smearing and erroneous analysis. Traditionally, this is avoided by defining steady state operating conditions in which to perform the analysis. However, most engine accessories are only highly loaded during transients and, in the case of rotorcraft gearboxes, non-stationary loading is often prevalent due to rotor effects. In addition, the progression of certain faults can lead to non-stationary vibration signals. Therefore, the authors have developed a novel health monitoring methodology that is applicable during non-stationary operation through application of Joint Time-Frequency Analysis (JTFA). This paper highlights the results obtained from applying JTFA techniques to very high frequency (VHF) vibration data collected from healthy and damaged components. When the accuracy of these approaches is compared with conventional techniques, the JTFA approaches significantly outperform the conventional methods. Key Words: Engine Accessories, Vibration Diagnostics, Joint Time-Frequency Analysis, Non-Stationary, Very High Frequency, Wavelets, Health Management
Introduction Main and engine accessory gearboxes are commonly replaced either upon failure or after they have served a predetermined amount of time that is produced from statistical estimates of component reliability. This maintenance approach has the potential to compromise readiness and safety (in-flight failure) or, alternatively, results in significant useful life remaining in some units. Premature component removal equates to increased cost (maintenance time and material), decreased mission readiness, and increased maintenance-induced faults. This situation is typified in numerous studies and media reports [1,2,3]. Specifically, according to an FAA report [4], “Diagnostic troubleshooting procedures for controls and accessories…have not been effective.” Clearly, there are enormous economic (maintenance & logistics), safety, and operational readiness benefits to advancing the state of accessory gearbox health management systems. A practical system for failure prognosis would therefore have a significant benefit on readiness and safety. Early fault detection and effective prognostics would reduce unplanned failures, which will in-turn reduce life cycle cost and increase readiness and mission assurance. In the case of major gas turbine turbo machinery components, vibration analysis has proven to provide some of the most quantitative and reliable indicators of rotating member fatigue detection and diagnosis. Furthermore, the utility of using high frequency measurements for diagnostics and prognostics of these components is well documented in

AIAC14 Fourteenth Australian International Aerospace Congress
7th DSTO International Conference on Health & Usage Monitoring (HUMS 2011)
numerous studies [5,6,7]. As such, the authors are developing a comprehensive fault prediction capability, utilizing high frequency vibration data, with an objective of providing the earliest possible warning of an impending failure. Although many signal processing techniques can be used to extract useful information from a vibration signal, the focus of the authors’ diagnostic algorithm effort was the development of efficient Joint Time Frequency Analysis (JTFA) techniques. Although JTFA is used for high frequency signal analysis in many other disciplines, including speech analysis, radar processing, telecommunications, underwater acoustics, bioacoustics, geophysics, and structural analysis, their use for gearbox component diagnostics in this work is novel. JTFA methods use various methods to transform the two dimensional time domain signal into a three dimensional time-frequency domain signal to facilitate more accurate signal processing and feature extraction. In this paper, the authors evaluated and developed several JTFA methods for use in gearbox diagnostics that are less susceptible to signal non-stationarity. Spectral smearing, in which energy from an evolving characteristic frequency (i.e., shaft frequency, bearing fault frequency, gear mesh frequency, etc) gets spread across multiple frequency bins, can reduce the efficacy of traditional frequency domain analysis, including Fourier Transforms. Any frequency-domain based diagnostic features derived from a smeared spectrum would be adversely affected by this smearing, potentially leading to missed detections and false alarms. The developed JTFA techniques, on the other hand, allow analysis of time varying frequency content of vibration signals collected during transient conditions (speeds or loads), thus reducing the effects of smearing. Application of these JTFA techniques can therefore increase PHM coverage and its associated benefits by allowing accessory health monitoring during the most life influencing regimes, regardless of operating speed.
Joint Time-Frequency Analysis and Feature Extraction Methods As mentioned above, the authors evaluated and developed a number of joint time-frequency analysis methods for use in gearbox diagnostics. The following sections provide a brief description of the methods considered. Short-Time Fourier Transform The Short-Time Fourier Transform (STFT) method is a commonly used time-frequency analysis approach. It splits a time domain signal into overlapping small segments, applies a weighting window to each segment, and computes the discrete-time Fourier transform of each segment. This process produces an estimate of the short-term frequency content of the signal by looking at sufficiently short time spans during which it is assumed the signal is stationary. Since it still utilizes a typical Fourier transform, the STFT requires a stationary signal over each small segment. In order to facilitate semi-transient analysis, the required segment lengths can be specified based on the target system’s shaft acceleration and error tolerance. The segment sizes are thereby set such that any shaft acceleration over the small time slice is negligible. This approach is illustrated in Fig. 1. An additional consideration when developing a STFT technique is the balance between frequency and time resolution. Small time slices give high time resolution but low frequency resolution. A balance needs to be struck between the two as necessitated by the targeted component’s specific fault detection/isolation needs. An advantage of the STFT technique is that it is based on performing Fast Fourier Transform (FFT) analysis on small data sets (small time slice of vibration data). Therefore onboard implementation would be

AIAC14 Fourteenth Australian International Aerospace Congress
7th DSTO International Conference on Health & Usage Monitoring (HUMS 2011)
( )
more straightforward since it is likely that an efficient and proven FFT algorithm already exists for the embedded system on the targeted platform. In addition, the small amount of data needed for the algorithm reduces computational time and aircraft data bus traffic since there are many efficient and proven FFT algorithms. This form of the Fourier transform has numerous applications in speech, sonar, and radar processing.
Fig. 1 – Example Short-time Fourier Transform Analysis
Cohen's Class Distribution Function The Cohen’s Class Distribution Function (CCDF) is a generalized time-frequency analysis method that utilizes bilinear transformations through the use of a kernel function [8]. There are many available kernel functions, including Choi-Williams (commonly used in speech analysis and ultra wideband signal analysis [9]), Wigner-Ville (commonly used in biometrics), and Zhao-Atlas-Marks (evaluated for bearing diagnostics [10] and motor diagnostics [11]). CCDF offers two primary advantages. First, a CCDF approach can inherently be applied to non-stationary vibration data. That is, the Cohen Class Distribution analysis can be used to analyze vibration data collected during transient conditions. Second, a CCDF approach can result in both good frequency resolution and good time resolution, as opposed to the STFT approach that trades time resolution for frequency resolution. However, one of the commonly cited drawbacks of CCDF approach is the influence of so called cross term artifacts [11]. These cross terms are interferences caused by the linear combination of both auto and cross terms resulting in increased signal redundancy [9, 11]. The resulting artifacts often obfuscate fault frequencies necessary for fault isolation. To reduce the cross term effects, multiple methods having been implemented, including: changing parameters of the kernel, utilizing different kernels, applying a filter, and using the analytic signal. In this paper, the authors chose a well-known kernel function, Choi-Williams, as described next. Choi-Williams Distribution The Choi-Williams Distribution (CWD), also called the Exponential Distribution, is a derivative of the Cohen’s class distribution function and uses an exponential kernel (Eqn 1) to suppress the cross terms being induced by Wigner-Ville Distribution (WVD). However it also reduces the time-frequency resolution. This tradeoff can be adjusted using the factor σ in Eqn 1 to provide the optimal time-frequency resolution needed for a particular application [8, 9]. Note that, as σ approaches ∞, the Choi-Williams Distribution becomes the Wigner-Ville Distribution. It was determined that the CWD requires fewer computational resources and also allows more flexibility by the σ parameter.
στξ , = eCWDτξ 22−
(1)
AIAC14 Fourteenth Australian International Aerospace Congress
7th DSTO International Conference on Health & Usage Monitoring (HUMS 2011)
Wavelet Analysis Wavelets are uniquely designed to localize the exact time of specific vibration events and their application has been widely discussed in many other papers [15,16,17]. In this paper, the authors employed a Continuous Wavelet Transform (CWT) for decomposing the time domain signal into time-frequency space. Wavelets can reveal amplitude and phase modulation within the frequency band defined by the wavelet. Each type of modulation can be used to identify specific fault signatures. For a signal x(t), the CWT of the signal is defined as:
Wx(a,b)=∫g*(a,b)(t)x(t)dt (2) where * denotes complex conjugate, g(t) represents the mother wavelet, and g(a,b)(t) is a baby wavelet, defined in Eqn 3 with g(t)=-g(t) [t<0], g(a,b)(t)=(1/√a)g((t-b)/a).
g(t)=exp(-σt)sin(ω0t) [t≥0] (3) in which, a and b represent the scale (dilation factor) and position (translation factor) at which the wavelet coefficient is calculated. The pseudo frequency (Fa) corresponding to the scale (a) can be defined as in Eqn 4
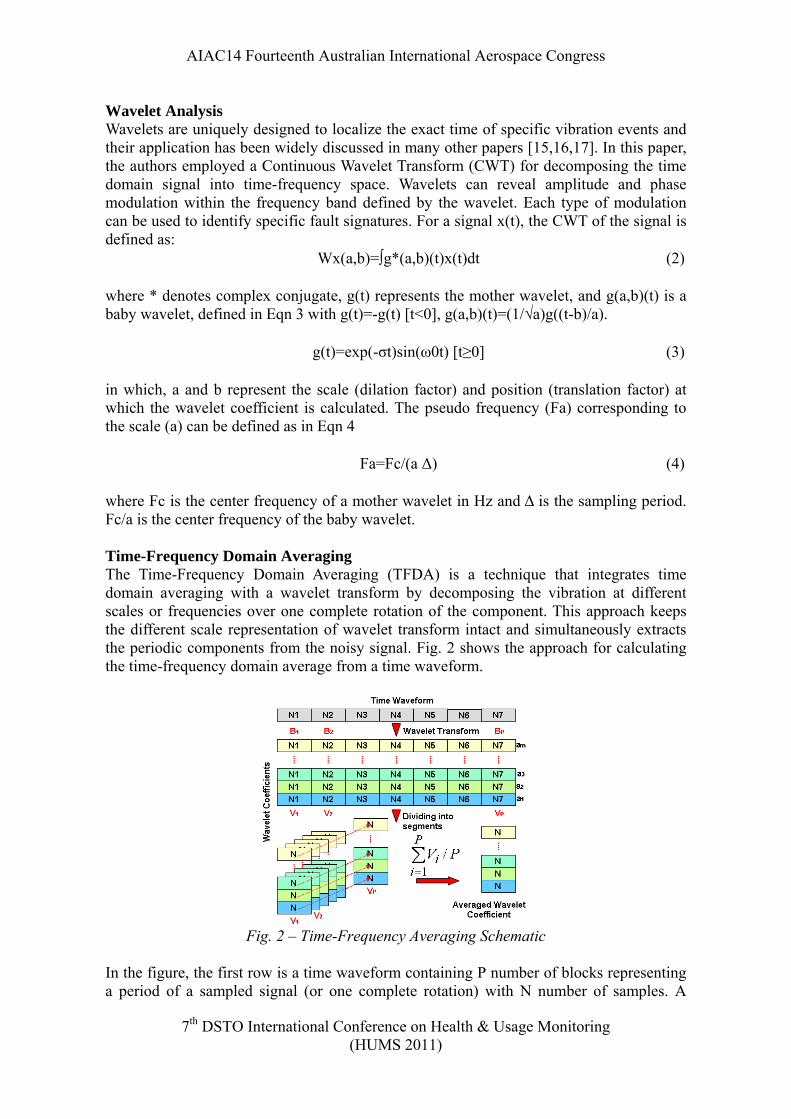
Fa=Fc/(a Δ) (4) where Fc is the center frequency of a mother wavelet in Hz and Δ is the sampling period. Fc/a is the center frequency of the baby wavelet. Time-Frequency Domain Averaging The Time-Frequency Domain Averaging (TFDA) is a technique that integrates time domain averaging with a wavelet transform by decomposing the vibration at different scales or frequencies over one complete rotation of the component. This approach keeps the different scale representation of wavelet transform intact and simultaneously extracts the periodic components from the noisy signal. Fig. 2 shows the approach for calculating the time-frequency domain average from a time waveform.
Fig. 2 – Time-Frequency Averaging Schematic
In the figure, the first row is a time waveform containing P number of blocks representing a period of a sampled signal (or one complete rotation) with N number of samples. A

AIAC14 Fourteenth Australian International Aerospace Congress
7th DSTO International Conference on Health & Usage Monitoring (HUMS 2011)
wavelet transform of the time waveform generates wavelet coefficients (P×N×m) at different scales (a1,…,am). The resulting column (Averaged Wavelet Coefficient) represents the averaged wavelet coefficients and each row contains one complete rotation of samples (N) at the various scales.
Analysis Results The authors evaluated the performance of the JTFA algorithms using three different data sets. The primary objective was to evaluate the speed and torque dependence of the various JTFA approaches when compared to traditional vibration diagnostic algorithms. The results are summarized next. Scaled Gearbox Test Data The first data set evaluated was from a run-to-failure test collected by a large university on a scaled gear box test rig. During testing, high speed accelerometer data was collected. Although this rig does not contain all of the components of an actual engine gearbox, it was used to generate ideal transitional gear fault progression data (from healthy to fault) in about 50 minutes. The authors used this data to benchmark the performance of the developed algorithms. The test was conducted at a steady speed, but varying torque, as shown in Fig. 4. The resulting gear failure is also shown.
0200
10 20 30 40 50 60
400
600
800
1000
1200
1400
1600
1800
Fig. 3 – Scaled Gearbox Speed and Torque Profile
Test Time (mins)
Mag
nitu
de
Scaled Gear Box Operating Conditions
Shaft Speed (RPM)Torque (in-lbf)
As seen, this was a run to failure test in which a healthy gear was run until it failed (multiple teeth broke off). Although there were no intermediate inspections to provide ground truth damage measurements, it is assumed based on test observations that before 45 minutes the gear was healthy (or had only very minor damage) and after 45 minutes the gear was degraded/damaged. The authors applied both traditional vibration analysis approaches and the developed JTFA methods to the test data. Since the traditional vibration analysis approaches are not the focus of this paper, the equations are omitted here but can be found in the referenced papers [5,7]. However, it is sufficient to say that the features are commonly used in gearbox diagnostics. Feature Dependence on Operating Conditions Many of the traditional gear diagnostic features evaluated, such as the Sideband Index (shown in Fig. 5, left) calculated from the Time Synchronous Averaged (TSA) signal, were very sensitive to changes in operating condition (in this case, torque). This characteristic would either increase probability of false alarm or reduce probability of detection, and is therefore not attractive.

AIAC14 Fourteenth Australian International Aerospace Congress
0 10 20
7 DSTO International Conference on Health & Usage Monitoring (HUMS 2011)
th
A snapshot of the results extracted from the Joint Time Frequency Analysis (JTFA) can be seen in
Fig. 4 –Scaled Gearbox Test (SGBT): TSA SI Results (left) and Various JTFA Feature
Results (right) The authors then extracted several features using the JTFA approaches. Fig. 5 (right) shows the torque and a normalized kurtosis feature that was extracted using the Choi-Williams (green) and STFT (red) approaches. As seen, the JTFA features are insensitive to changes in torque, as evident by the relatively flat response from ~28 minutes to ~45 minutes when torque is changing but the system is healthy. Furthermore, the JTFA features are very sensitive to the changing health of the system, as evident by the relatively large increases from ~45 minutes (when the fault is believed to occur) until the end of the test. This sensitivity to changing health, coupled with the insensitivity to changing operating condition, demonstrates the advantage of the JTFA approach and makes application of these features attractive. In addition, the feature variance of the healthy data during changing torque (roughly ~28 min. to ~45 min.) was compared to the feature variance of healthy data during steady torque (roughly 0 to ~28 min.) to quantify the torque dependency of each feature. As seen in Fig. 7, JTFA features (in blue) represented 8 of the top 10 performing features.
Fig. 5 – Feature Torque Dependency Results for SGBT
Fault Detection Performance
Fig. 8, which represents the surface plots for the Choi-Williams Distribution. The top plot represents the JTFA response of the gear when it was healthy (at time = 1.5 minutes) and the bottom plot represents the JTFA response of the gear when it was faulted (at time = 50.2 minutes). As seen, the gear fault is clearly evident. This result is significant
30 40 50 600
10
20
30
40
Test Time (mins)
Mag
nitu
de
Scaled Gear Box Test, JTFA Results
JTFA Feature 1JTFA Feature 2Torque/100 [in-lb]
Fault Detected(t=45 min)
0 10 20 30 40 50 600
0.005
0.01
0.015
0.02
0.025
0.03
0.035
Test Time (mins)
Mag
nitu
de
Scaled Gear Box Traditional Feature
TSA SITorque/50e3 (in-lbf)
Torque Oscillations Begin But Features
Remain Stable
Features Become Unstable As Torque
Oscillations Begin

AIAC14 Fourteenth Australian International Aerospace Congress
7th DSTO International Conference on Health & Usage Monitoring (HUMS 2011)
because there is a clear time dependency in the frequency response in the 0-1000 Hz frequency band. Although a general increase is evident throughout the duration of the sample, the fault is most evident during the 0.01 – 0.05 sec interval (circled in the figure). This shows a clear advantage of the JTFA approaches during constant speed but varying load conditions. It is worth noting that the torque is changing for the faulted case (see Fig. 5) but this fluctuation does not explain the differences between the two plots.
Fig. 6 – Choi-Williams Surface Plot
Faulted Gear Response (t=50.2 minutes)Healthy Gear Response (t=1.5 minutes)
To better quantify the performance of the various algorithms, the authors applied a statistical analysis of the features. First, probability density functions (PDFs) were established for each set of healthy features (using presumed healthy data from the first 45 minutes of the test) using best fit techniques to optimally fit the underlying healthy distributions. Next, a threshold was calculated from each feature’s PDF to achieve a target false alarm rate, in this case 2%. Finally, the probability of miss detection was calculated using the defined thresholds and PDFs of features from the damaged gearbox (determined using the same method as the healthy PDFs). For the purposes of this analysis, it was assumed all features calculated after 45 minutes were from a faulty system. The results of the probability of miss detection (P(MD)) analysis are shown in Fig. 9.
Fig. 7 – P(MD) Results for SGBT data
The traditional TSA features (RMS, SI, NA4, Kurtosis, and FM4) are considered the “baseline” accepted results that would be expected from current vibration diagnostics (shown in red). Ideally, an accurate diagnostic feature should have a low P(MD), and the lower the number the less likely the system will miss a fault. As seen, JTFA features (shown in blue) represented 7 of the top 9 performing features. Because these features are

AIAC14 Fourteenth Australian International Aerospace Congress
7th DSTO International Conference on Health & Usage Monitoring (HUMS 2011)
1: 0: 0: 0:1
( | ) ( ) ( )t t t t t ti
p x y w x x x=∑ %
less affected by changing operating condition, the threshold can be lowered (without increasing Probability of False Alarm) and improvements in P(MD) are realized. As seen above, the new JTFA features outperformed most of the traditional gear features. It should also be noted that this is only one of the many diagnostics metrics that should be evaluated when comparing algorithm results and the results of these other metrics (including detection horizon) will be considered in future work. Fault Prognostics An ideal system would provide a smooth transition from diagnostics to prognostics in order to fully realize the benefits of health monitoring. This section illustrates one example of how these JTFA approaches, by providing more reliable diagnostic results, can lead to enhanced prognostic results as well. Particle Filtering Based Prognostics Particle filters are Bayesian estimation algorithms for approximating the state of a system when a limited number of measurements and a model of the system behaviour are available [18]. Particle filtering algorithms offer a solid theoretical framework to handle model nonlinearities and non-Gaussian noise. Furthermore, their use in diagnostics and prognostics is appropriate because they are well suited to solve the problem of real-time state estimation by incorporating data from sequential observations (measurements) into system state estimates. A nonlinear dynamic state-space model may be used to represent the behaviour of a system at fault and predict the evolution of a damage state as a probability density function (PDF), which in turn can be updated sequentially in an attempt to increase accuracy as more observations or measurements become available. To perform diagnostics, the particle filtering implementation estimates system states using available measurements and the process model to establish if the system is considered to be at fault. In this case, the current value of a fault dimension can also be estimated from the model. To perform prognostics, this is used as an a priori state estimate that is fed back into the model recursively to generate future state predictions. Each a priori state calculation is also utilized to update model parameters to ensure the model represents the system and its operating conditions accurately according to all available measurements. The particle filter describes and approximates a state of a system with a PDF by using state estimate samples or "particles" having associated discrete probability masses, known as “weights.” The current state PDF p(xt) is calculated as
Ni iδ≈ ⋅ − (5)
where x0:t is the past state trajectory and y1:t are the measurements up to time t; δ is a Markov model-like functional relationship, and w represents the weight given to each particle. In one of the original implementations of particle filtering, the sequential importance resampling (SIR) particle filter, the measurement data is used to update the weights using Bayes’ rule of conditional probability as
),|( 1:1:01
1++
+kkk
kk yxxq)|()|( 111 +++= kkkk xxpxypww (6)

AIAC14 Fourteenth Australian International Aerospace Congress
7th DSTO International Conference on Health & Usage Monitoring (HUMS 2011)
Hence, particles, together with their weights, represent a sampled version of the system state PDF and provide not only state values, but likelihood (probability) as well.
In the case of prognostics, long-term predictions are generated describing the evolution of a fault size indicator, which is represented by the state PDF, using a fault progression model. To accomplish state prediction, the state value associated with each particle is considered as an initial condition. Then, the evolution of each particle is computed by successively taking the expectation of the model given all previous system states. The process is illustrated in Fig. 10. The discrepancies between the predictions and the updated state estimates are used to update model parameters so that it can better represent actual system behaviours and operating conditions, offering increasing accuracy with more observations.
Fig. 8 - Representation of State Prediction Using the Fault Progression Model and
Recursive Weight Calculation
k
Past system behavior (previous
states)
Particle Filtering Applied to Scaled Gearbox Data The particle filtering approach was applied to four of the JTFA features shown above. The aim was to trend the feature data up to a particular instant of time, and extrapolate the trend to predict the time at which the feature value would exceed the failure threshold, or end of life (EOL). The time remaining until the EOL was then used to quantify the remaining useful life (RUL). The particle filter operates on the data incrementally. An initial estimate of the trajectory of the feature evolution is produced with the first few feature values as input. This yields an initial estimate of the RUL. The particle filter constantly updates its predictions of the feature trajectory with additional data, one data point at a time. This simulates the operation of the system real-time, when sensor data are incrementally provided to the diagnostics, and the resulting feature values are trended and used to update the RUL estimates at each time step. Fig. 11 illustrates the results of running this process on one of the JTFA features.
Timek+1
Syst
em st
ate
/ dam
age Damage
progression (one curve for each particle) PDF of
current system state
Predicted state PDF
AIAC14 Fourteenth Australian International Aerospace Congress
7th DSTO International Conference on Health & Usage Monitoring (HUMS 2011)
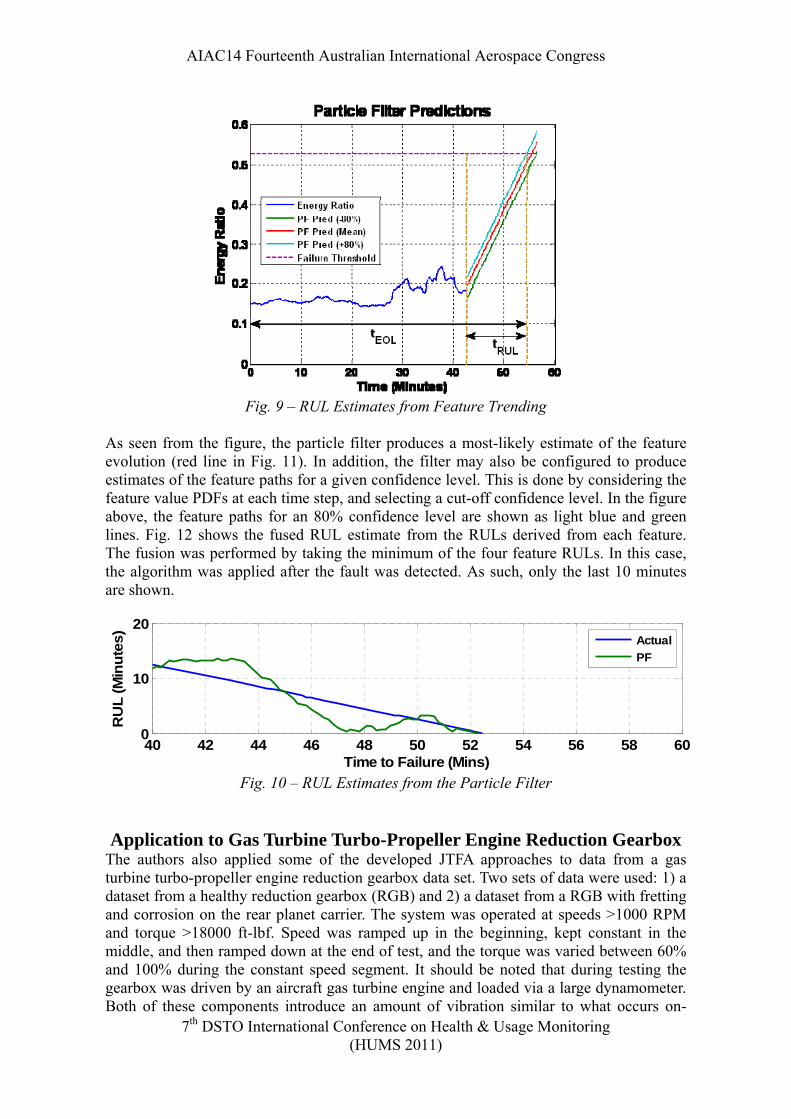
Fig. 9 – RUL Estimates from Feature Trending
As seen from the figure, the particle filter produces a most-likely estimate of the feature evolution (red line in Fig. 11). In addition, the filter may also be configured to produce estimates of the feature paths for a given confidence level. This is done by considering the feature value PDFs at each time step, and selecting a cut-off confidence level. In the figure above, the feature paths for an 80% confidence level are shown as light blue and green lines. Fig. 12 shows the fused RUL estimate from the RULs derived from each feature. The fusion was performed by taking the minimum of the four feature RULs. In this case, the algorithm was applied after the fault was detected. As such, only the last 10 minutes are shown.
40 42 44 46 48 50 52 54 56 58 600
10
20
Fig. 10 – RUL Estimates from the Particle Filter
Time to Failure (Mins)
RU
L (M
inut
es)
ActualPF
Application to Gas Turbine Turbo-Propeller Engine Reduction Gearbox
The authors also applied some of the developed JTFA approaches to data from a gas turbine turbo-propeller engine reduction gearbox data set. Two sets of data were used: 1) a dataset from a healthy reduction gearbox (RGB) and 2) a dataset from a RGB with fretting and corrosion on the rear planet carrier. The system was operated at speeds >1000 RPM and torque >18000 ft-lbf. Speed was ramped up in the beginning, kept constant in the middle, and then ramped down at the end of test, and the torque was varied between 60% and 100% during the constant speed segment. It should be noted that during testing the gearbox was driven by an aircraft gas turbine engine and loaded via a large dynamometer. Both of these components introduce an amount of vibration similar to what occurs on-

AIAC14 Fourteenth Australian International Aerospace Congress
7th DSTO International Conference on Health & Usage Monitoring (HUMS 2011)
wing, making the detection of any faulted components more difficult but much more realistic. In addition, detection of planetary gear faults has traditionally been difficult due to the moving frame of reference of each planet gear with respect to a fixed sensor. As such, the authors evaluated the detection capability of the JTFA features using the performance metrics previously described. For this analysis, a 2% False Alarm Threshold (FAT) was used to calculate the detection and missed detection rates. This was calculated by fitting an appropriate statistical distribution to both the healthy and faulted features. Then the probability of detection (P(D) or PoD) and probability of missed detection (P(MD) or PoMD) where calculated from the 2% threshold. As seen in Fig. 13, the JTFA features clearly separated the test cases with >99% detection rate.
0 50 100 150 2000
0.2
0.4
0.6
Resonant Feature
PoD=99.98% and PoMD=0.02%
← FAT(2%)=13.87 HealthyDamaged
0 200 400 600 8000
0.02
0.04
0.06
0.08
Matrix Norm 1
PoD=100% and PoMD=0%
← FAT(2%)=42.5 HealthyDamaged
Fig. 11 – Matrix Norm 1 and Resonant Feature Results and Statistical Analysis
Table 1 summarizes the complete findings from the JTFA and traditional gear diagnostic features. As seen, most of JTFA features clearly detected the planetary gear fault with a 98-100% detection rate. The features are quite consistent during the healthy and damaged RGB tests and are comparatively less sensitive to the speed and torque variations. Of the traditional gear diagnostic features, only the Sideband Index could reliably detect the fault.
Table 1 – Performance Metrics of JTFA and Traditional Gear Diagnostic Features Feature Type Feature P(D)
JTFA Features
Resonant Feature 63 Matrix Norm 1 100 Matrix Norm 2 99 TFDA RMS 98
Traditional Gear Diagnostic Features
TSA Kurtosis 6 TSA Sideband Index 98 TSA NA4 4 TSA FM4 4

AIAC14 Fourteenth Australian International Aerospace Congress
7th DSTO International Conference on Health & Usage Monitoring (HUMS 2011)
Evaluation of JTFA Algorithms with Aircraft Accessory Bearing Fault Progression Data
The authors also applied the developed algorithms to a bearing fault progression dataset and evaluated their fault detection and classification performance. Specifically, data was evaluated from a run-to-fail test that was previously conducted on a rotorcraft oil cooler ball bearing at variable operating conditions for a cumulative time of 1,419 min (23.65 hours). As seen in Fig. 14, bearing shaft speed (blue line) was nominally constant at max speed (with a deviation of approximately 1%) and the applied radial load (dotted red line) was periodically ramped up and down during the test. A constant 300 lb axial load was also applied. During the test, two accelerometers (PCB 352A60) were installed on a bearing housing at radial and axial directions and a force sensor was used to measure the radial load. Data was sampled periodically at 102,400 samples/second for 5 seconds during testing. During this testing, a spall initiated on the outer raceway at the operating time of 754 minutes. Visual confirmations of the spall progression (via borescope pictures taken in situ) were also taken to quantify the ground truth of the bearing fault.
Fig. 12 – Operating Conditions for Bearing Fault Progression Test
Fault Detection Performance The authors applied the developed algorithms to the vibration data described above. Fig. 15 shows a trend of one of the JTFA features from the radial accelerometer, as well as a number of pictures that quantify ground truth. It can clearly be seen that the feature increases as the condition worsens.
0 500 1000 150099
99.5
100
Spee
d (%
)
Time (min)0 500 1000 15000
500
1000
1500
2000
2500
Rad
ial L
oad
(lb)
Time (min)
Operating Conditions: Shaft Speed and Applied Load
AIAC14 Fourteenth Australian International Aerospace Congress
7th DSTO International Conference on Health & Usage Monitoring (HUMS 2011)
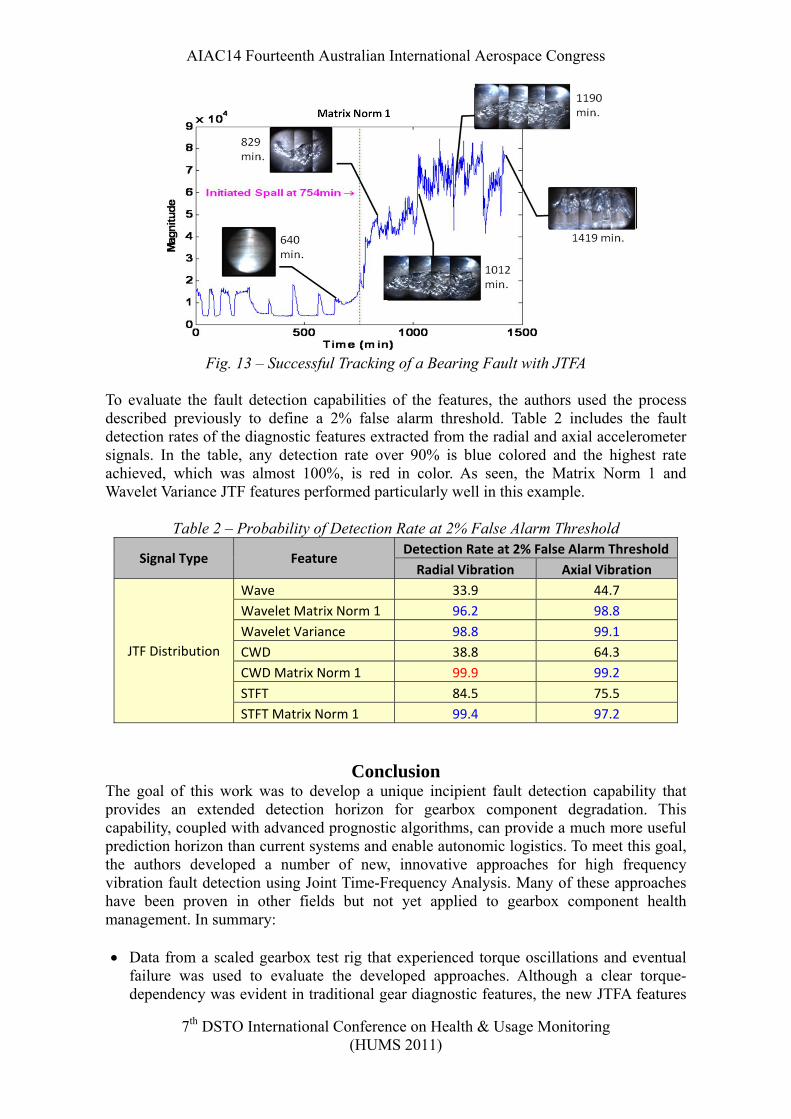
Fig. 13 – Successful Tracking of a Bearing Fault with JTFA
To evaluate the fault detection capabilities of the features, the authors used the process described previously to define a 2% false alarm threshold. Table 2 includes the fault detection rates of the diagnostic features extracted from the radial and axial accelerometer signals. In the table, any detection rate over 90% is blue colored and the highest rate achieved, which was almost 100%, is red in color. As seen, the Matrix Norm 1 and Wavelet Variance JTF features performed particularly well in this example.
Table 2 – Probability of Detection Rate at 2% False Alarm Threshold
Signal Type Feature Detection Rate at 2% False Alarm Threshold Radial Vibration Axial Vibration
JTF Distribution
Wave 33.9 44.7 Wavelet Matrix Norm 1 96.2 98.8 Wavelet Variance 98.8 99.1 CWD 38.8 64.3 CWD Matrix Norm 1 99.9 99.2 STFT 84.5 75.5 STFT Matrix Norm 1 99.4 97.2
Conclusion The goal of this work was to develop a unique incipient fault detection capability that provides an extended detection horizon for gearbox component degradation. This capability, coupled with advanced prognostic algorithms, can provide a much more useful prediction horizon than current systems and enable autonomic logistics. To meet this goal, the authors developed a number of new, innovative approaches for high frequency vibration fault detection using Joint Time-Frequency Analysis. Many of these approaches have been proven in other fields but not yet applied to gearbox component health management. In summary: • Data from a scaled gearbox test rig that experienced torque oscillations and eventual
failure was used to evaluate the developed approaches. Although a clear torque-dependency was evident in traditional gear diagnostic features, the new JTFA features

AIAC14 Fourteenth Australian International Aerospace Congress
7th DSTO International Conference on Health & Usage Monitoring (HUMS 2011)
were less affected by the torque oscillations and produced a much higher P(D). On average, the JTFA features produced a P(D) of 93.2, as compared to a P(D) of 53.2 for the traditional features.
• A particle filtering approach for prognostics was applied to JTFA feature results from the scaled gearbox test rig. The predictions from multiple features were then fused to produce promising results. This demonstrates the applicability of the JTFA features and particle filtering approach to a health monitoring routine that includes prognostics.
• Results from a gas turbine reduction gear box data set were also obtained to evaluate the ability to detect a planetary gear fault when compared to conventional approaches. The new JTFA features significantly outperformed the traditional gear features, and resulted in a P(D) of 98-100% on the best performing sensor. On average, the JTFA approach produced a P(D) of 90.0% and the traditional approaches produced a P(D) of only 28.0%. These results are significant since there were substantial torque and speed changes occurring throughout the test. It should also be noted that the gearbox was driven by an aircraft gas turbine engine and loaded via a large dynamometer. Both of these components introduce vibration and noise similar to what occurs on-wing, making the detection of the fault much more realistic.
• The developed techniques were also applied to an aircraft accessory bearing fault
progression dataset. In this example, the JTFA features showed pleasing results, producing a P(D) greater than 98% in most cases. These results demonstrate the ability to accurately track the progression of a bearing spall.
• In general, JTFA features performed better than traditional gear features, especially
under varying operating conditions. In particular, the TFDA and STFT features performed the best by exhibiting both higher probability of detection and lower variance due to speed or load changes. However, there is no single standout approach, highlighting the need for utilizing multiple diagnostic approaches to provide complete coverage.
• Although demonstrated here using high bandwidth vibration data, the approaches are
also applicable using legacy engine vibration sensors. In addition, initial analysis suggests that it is possible to run the algorithms on existing engine controllers (i.e., FADECs). As such, the authors expect the approaches to be readily implementable using existing instrumentation and processing hardware.
As demonstrated, JTFA signal processing can accentuate small time scale variances in vibration signals that are correlated to system health but would be missed by more traditional processing. The JTFA methods can also be applied to any time domain signal, including the “raw” vibration signal (the signal as collected with no additional signal processing applied). The ability to “mix and match” processing and feature extraction enables a more comprehensive suite of diagnostic algorithms. In addition, the flexible and modular design of the algorithms will facilitate the development of embedded software necessary for distributed and on-wing PHM. The often stringent process requirements of embedded hardware will be mitigated by the fact the user can select various combinations of modules, depending on their computational complexity. Finally historic data can be used to evaluate the chosen features’ performance during the design phase of the
AIAC14 Fourteenth Australian International Aerospace Congress
7th DSTO International Conference on Health & Usage Monitoring (HUMS 2011)
diagnostic system by calculating appropriate performance metrics, including probability of missed detection and false alarm.
Acknowledgments The authors would like to recognize the contributions of many current and prior colleagues at Impact Technologies.
References 1. Aviation Investigation Report A02P0261, Transportation Safety Board of Canada, 20
Oct. 2002. 2. “Accessory and Transfer Gearbox Replacement,” Commonwealth of Australia Civil
Aviation Safety Authority Schedule of Airworthiness Directives, Civil Aviation Regulations, 1998, Part 39-106.
3. Transfer Gearbox Vertical Bevel Gear Bearing, Inspection & Replacement, Airworthiness Directive Schedule, April 2005, pg 4.
4. Richter, Bruce A., Ridenour-Bender, Margaret, and Tsao, Mike, “Aircraft Turbine Engine Reliability and Inspection Investigations,” Report No. DOR/FAA/CT-92/29, October 1993.
5. Lebold, McClintic, Campbell, Byington, and Maynard, “Review of Vibration Analysis Methods for Gearbox Diagnostics and Prognostics,” 54th Meeting of the Society for MFPT, May 1-4, 2000.
6. Bagnoli, S., Capitani, R., and Citti, P., “Comparison of Accelerometer and Acoustic Emission signals as Diagnostic Tools in Assessing Bearing Damage,” Proceedings of the 2nd International Conference on Condition Monitoring, London, May 1988, pp. 117-125.
7. Campbell, Byington, and Lebold, “Generation of HUMS Diagnostic Estimates Using Transitional Data,” 13th International Congress and Exhibition on Condition Monitoring and Diagnostic Engineering Management, December 3-8, 2000.
8. Cohen, L., Time-Frequency Analysis, Prentice-Hall, New York, 1995. 9. Lazorenko, O.V., “Ultrawideband Signals and Choi-Williams Transform,”
Ultrawideband and Ultrashort Impulse Signals, The Third International Conference, Sept. 2006 Page(s):300 – 302.
10. Randall, R.B., Gao, Y., and Ford, R.A., “Comparison of Time-frequency Distributions Applied to Bearing Diagnostics,” [online].
11. Rajagopalan, S., Habetler, T.G., et al., “Non-Stationary Motor Fault Detection Using Recent Quadratic Time-Frequency Representations,” Industry Applications Conference, 2006, 41st IAS Annual Meeting, Conference Record of the 2006 IEEE, Volume 5, Oct. 8-12, 2006 Page(s):2333 – 2339.
12. Leonowicz, Z, and Lobos, T., “Time-Frequency Analysis of Non-Stationary Three Phase Signals,” 15th Triennial World Congress, Barcelona, Spain, 2002.
13. Polyshchuk, V.V., Choy, F.K., and Braun, M.J., “Gear Fault Detection with Time-Frequency Based Parameter NP4,” International Journal of Rotating Machinery, Vol. 8, No. 1, 2002.
14. Saxena, A., Wu, B., and Vachtsevanos, G., “A Methodology for Analyzing Vibration Data from Planetary Gear Systems using Complex Morlet Wavelets,” American Control Conference, June 2005, Portland, Oregon.

AIAC14 Fourteenth Australian International Aerospace Congress
7th DSTO International Conference on Health & Usage Monitoring (HUMS 2011)
15. Li, C. J., and Ma, J., "Bearing Localized Defect Detection through Wavelet Decomposition of Vibrations," Proc. of 46th General Meeting of Mechanical Failures Prevention Group, Virginia Beach, Virginia, April 7-9, 1992.
16. Wang, W.J., and McFadden, P.D., “Application of Wavelets to Gearbox Vibration Signals for Fault Detection,” Journal of Sound and Vibration, Vol. 192, No. 5, 1996.
17. Ferlez, R., and Lang, D.C., “Gear-Tooth Fault Detection and Tracking Using the Wavelet Transform,” Proceedings of Prognosis of Residual Life of Machinery and Structures, MFPT, 1998.
18. Arulampalam, M. S., S. Maskell, N. Gordon, and T. Clapp (2002). “A Tutorial on Particle Filters for Online Nonlinear/Non-Gaussian Bayesian Tracking,” IEEE Transactions on Signal Processing, 50(2).