john m. azizian j1801csef.usc.edu/history/2007/projects/j18.pdfwill test the fastskin swimsuit in...
TRANSCRIPT

CALIFORNIA STATE SCIENCE FAIR2007 PROJECT SUMMARY
Ap2/07
Name(s) Project Number
Project Title
Abstract
Summary Statement
Help Received
John M. Azizian
Solutions and Medications: Analysis of Pill Coatings for DissolvingPurposes
J1801
Objectives/GoalsDetermine if coatings of pills containing the same main ingredients (such as Advil/Ibuprofen) affect thetime it takes to dissolve the medication in the human body.
Methods/MaterialsMixed carbonated water, water, carbonated sweet water, and white wine with simulated stomach acid.Tested solutions# pH with pH Microprocessor Tester. Timed it took to dissolve gelatin, colorless, sugar,no coating, and keratin coated Advil/Ibuprofen in these solutions (using magnetic stirrer).
ResultsKeratin coated pills took the longest to dissolve in all solutions. Gelatin pills took the second longest todissolve, but sugar and not coated Advil took the least amount of time to dissolve in all solutions.Colorless coated pills took average time to dissolve. In addition, all coated Advil dissolved in leastamount of time in the water solution, which had the lowest pH (acidity) levels and most amount of time incarbonated sweet water, which had the highest pH (alkaline) levels. Also, water mixed with simulatedstomach acid increased the pH level the least compared to the other solutions.
Conclusions/DiscussionThe pill coatings affect the time it takes for pills to dissolve in a body. Solutions with lower pH levels helpdissolve the pills in the human body most efficiently. Therefore, doctors advise to take medication withwater.
Determine the rates at which medicine with the same ingredients (Ibuprofen) covered with differentcoating dissolves in the human body.
I received help from my mother and father who proofread the report, bought materials, and helped mewith Excel Software.

CALIFORNIA STATE SCIENCE FAIR2007 PROJECT SUMMARY
Ap2/07
Name(s) Project Number
Project Title
Abstract
Summary Statement
Help Received
Samuel D. Birns
How Clean ARE Your Hands?
J1802
Objectives/GoalsMy objective was to determine which of five hand cleaning agents (water, bar soap, antibacterial soap,hand sanitizer, or isopropyl alcohol) would be the most effective at removing bacteria from human handsvia washing.
Methods/MaterialsFirst, a control group was established: the subject washed his hands with each of the five cleansers; aftereach washing, the subject touched the agar in a specifically labeled Petri dish. Within the control group,there was a control dish in which the subject touched the agar without washing his hands. Four othergroups were created in which common environmental bacteria was introduced; after each washing, butbefore touching the agar, the subject would, in turn, touch someone else#s hand, his eyes, a cell phone or asandwich. Again, each group had a control dish in which the subject did not wash hands but handled theobject then touched the Petri dish. After 7 days, the percentage of each Petri dish filled with bacteria wasdetermined based on the equation Area of a circle = Pi x r2. Then, the average percentage of the Petridishes covered by bacteria, grouped according to each hand cleanser, was calculated and compared.
ResultsAntibacterial soap was the most effective in removing bacteria, with an average of 20.21% of its Petridishes covered in bacteria. The least effective cleaner, hand sanitizer, had 23.97% coverage, 3.78% lessthan antibacterial soap. The control group, in which hands were NOT washed, had less bacterial coveragethan the water and hand sanitizer groups.
Conclusions/DiscussionThe data suggests that, when it comes to removing bacteria from hands, there is not a significantdifference between one cleanser and another, or even between washing or not washing hands. The formerconclusion indicates that the consumer needs to be aware of advertising hype. For example, as the handsanitizer seems to add rather than remove bacteria from one's hands, the consumer using this product willhave a false, even dangerous, sense of security. The latter conclusion, that washing or not washing one#shands makes little significant difference, seems counter-intuitive; more experimentation needs to be doneon this matter. Perhaps a study could be conducted with five families, who are each assigned a differenthand cleaner, and one 'control' family, who doesn't wash at all; these families could be tracked over aperiod of two months to see how often they get sick.
My project is about the bacteria-removing capabilities of water, bar soap, antibacterial soap, handsanitizer and isopropyl alcohol.
Father helped to convert hand-drawn graphs to computerized graphs and helped with formatting report.

CALIFORNIA STATE SCIENCE FAIR2007 PROJECT SUMMARY
Ap2/07
Name(s) Project Number
Project Title
Abstract
Summary Statement
Help Received
Bryar W. Brandvold
Should Soccer Players Wear Protective Headgear?
J1803
Objectives/GoalsTo determine whether soccer protective headgear prevents impact injury and if its underutilization is dueto poor performance, comfort or coaching bias.
Methods/MaterialsThree types of commercial protective headgear and an unprotected control were tested repeatedly for sideand front impacts. A cranial model was struck by a reproducible impact and the compression anddeformity to an applied clay slab was measured with a digital caliper. Competitive soccer playerscompared each product to their unprotected head for comfort and playability. Coaches were surveyed toassess their knowledge and biases.
ResultsProtective headgear decreased the measured impact compression and deformity of the clay. The Full 90Select had the best overall impact results and scored better than the unprotected head on the player survey.The coaches admitted little knowledge of headgear utility and one coach reported a negative bias.
Conclusions/DiscussionSoccer protective headgear consistently reduced the impact to the head and did not adversely affectreported player comfort and playability. Since athletes participating in football, skateboarding andcycling wear protective headgear, one has to question why not soccer players.
Soccer protective headgear reduces impact injuries and does not affect playability.

CALIFORNIA STATE SCIENCE FAIR2007 PROJECT SUMMARY
Ap2/07
Name(s) Project Number
Project Title
Abstract
Summary Statement
Help Received
Grace Chen; Carissa Lee
Fat Fries?
J1804
Objectives/GoalsTo find out which fast food chain store's French fries contains the greatest amount of calories.
Methods/MaterialsMethods: First, we constructed our calorimeter. Then we weighed each of the French fries in grams andrecorded its weight. After, we filled the glass beaker half full with distilled water (approximately 100mL), and measured the temperature of the water. We then impaled a French fry on the needle and lightedit on fire. Immediately after it caught on fire, we quickly placed the clay base with the impaled French fryunder the beaker. We allowed the food item to burn itself out before using the pliers to push the Frenchfry onto a plate. Then we stirred the water and measured the final temperature. Then we measured theremains of the burned French fry in grams on the scale. We repeated these steps for all of the French friesthat had come from different fast food chain stores, and recorded detailed measurements. We performedthese steps on three French fries from each fast food chain store, to ensure our precision.
Materials: For our materials, we used a homemade calorimeter, which required one glass beaker, claybase, a needle, and pliers. Our experiment also required French fries from the following fast food chainstores: McDonald's, Jack-in-the-Box, Wendy's, In-N-Out Burger, Carl's Jr., and Burger King. Othermaterials that our experiment required were: a graduated cylinder, distilled water, a Celsius thermometer(with a 20-100 range or greater), safety glasses, a lighter, and a scale (to measure in grams).
ResultsBased on our calculations, Jack-in-the-Box's French fries contained the greatest amount of calories. Carl'sJr.#s French fries had the least amount of calories. However, our results differed slightly compared to theresults of the manufacturing companies because of a few uncontrollable circumstances such as wind andheating of the beaker from the lighter.
Conclusions/DiscussionAccording to the data that we collected from our experiment, our results agreed with our hypothesis thatJack-in-the-Box's French fries contained the most calories. Unfortunately, we had some uncontrollablecircumstances that affected the outcome of our results and how accurate our results were. Overall, ourexperiment concluded that out of selected fast food chain stores, Jack-in-the-Box's fries contained thegreatest amount of calories.
To find out which fast food chain store's French fries contains the greatest amount of calories.
Father supervised experimental procedures. Parents purchased fries.

CALIFORNIA STATE SCIENCE FAIR2007 PROJECT SUMMARY
Ap2/07
Name(s) Project Number
Project Title
Abstract
Summary Statement
Help Received
Cayley A. Cruickshank
A Comparison of Swim Times with Speedo Fastskin and StandardLycra Swimsuits
J1805
Objectives/GoalsThe primary objectives of this study are to determine if Fastskin suits have superior water resistanceproperties compared to standard Lycra, and to determine the degree of difference (if any) between the twoswimsuit materials. Improved knowledge of the degree of faster swim times will permit more informedpurchasing decisions between Fastskin and Lycra swim suits.
Methods/MaterialsProcedures:1. Randomly assign swimmers into one of two equally sized groups. Swimmers assigned to Sequence 1will test the Fastskin swimsuit in the first period followed by the Lycra swimsuit in the second period. Swimmers assigned to Sequence 2 will test the swimsuits in reverse order (i.e., Lycra in the first periodfollowed by Fastskin in the second period).2. Measure body weight and height of each swimmer. Calculate body mass index (BMI) of each subject askg/m2.3. For Period 1, record the 50-meter freestyle swim time of each swimmer wearing swimsuit assigned instep 1.4. For Period 1, swimmer will repeat step 3 three times. The swim time for each test will be recorded on adatasheet. Note: The swimmer will rest for approximately 5 minutes between tests to ensure recovery.5. Upon completion of Period 1, swimmer will switch suits and rest for 15 minutes before start of Period2.6. For Period 2, repeat steps 3 and 4.
ResultsThe mean swim time for the Fastskin swimsuit was statistically significantly faster compared to Lycra(p=0.01). For a 50-meter freestyle event, the Fastskin suit decreased the time by a mean of 1.1 seconds(95% confidence interval 0.6 to 1.6 seconds). The faster swim times can be attributed to its unique waterrepellant coating properties that decrease water absorption and remains lightweight when wet.
Conclusions/DiscussionSwimmers who learn about the outcome of this study will be able to know how a suit can affect theirswim times, and which materials will be the most beneficial to them while competing.The next step in my research is to test the swimsuit materials on a larger test group to confirm the study#sfindings and to see if the results vary for different swim strokes and event distances.
The goal of my project is to determine if swim times are faster when wearing a swimsuit made of Fastskinmaterial compared to standard lycra material.
My father helped me set up the study and with the data analysis.
CALIFORNIA STATE SCIENCE FAIR2007 PROJECT SUMMARY
Ap2/07
Name(s) Project Number
Project Title
Abstract
Summary Statement
Help Received
Kathryn R. Dern
Calories: Do They Add Up?
J1806
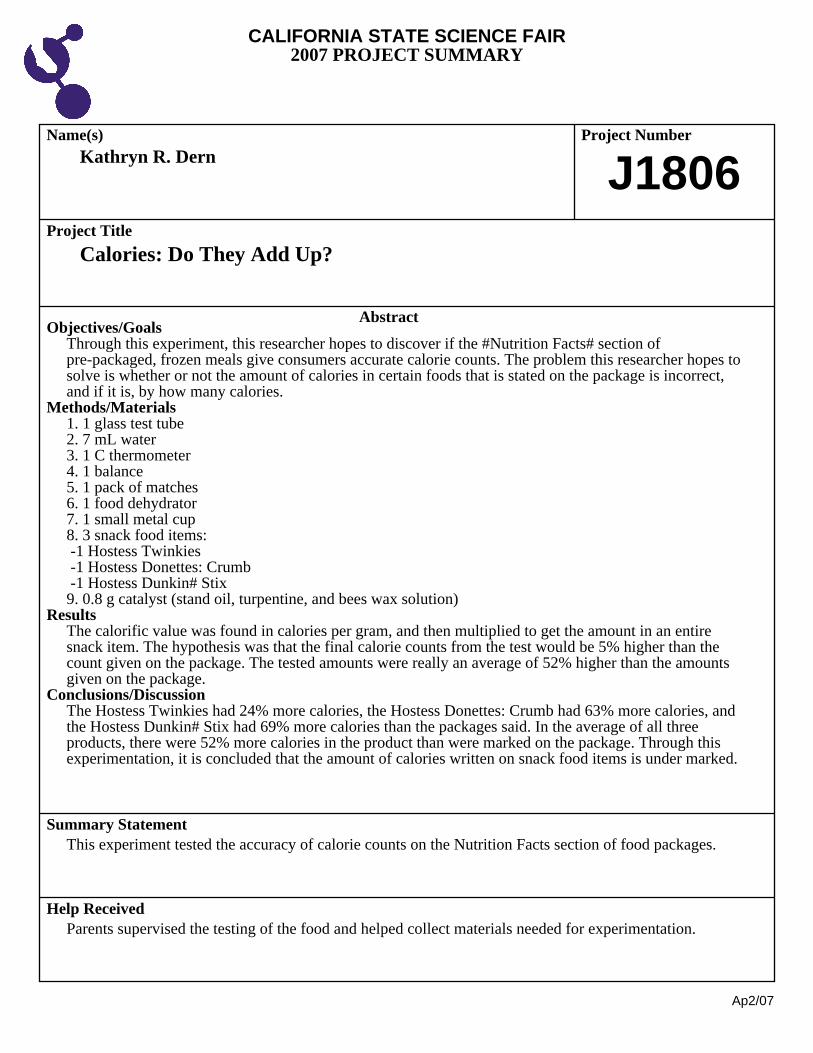
Objectives/GoalsThrough this experiment, this researcher hopes to discover if the #Nutrition Facts# section ofpre-packaged, frozen meals give consumers accurate calorie counts. The problem this researcher hopes tosolve is whether or not the amount of calories in certain foods that is stated on the package is incorrect,and if it is, by how many calories.
Methods/Materials1. 1 glass test tube2. 7 mL water3. 1 C thermometer4. 1 balance5. 1 pack of matches6. 1 food dehydrator7. 1 small metal cup8. 3 snack food items: -1 Hostess Twinkies-1 Hostess Donettes: Crumb-1 Hostess Dunkin# Stix9. 0.8 g catalyst (stand oil, turpentine, and bees wax solution)
ResultsThe calorific value was found in calories per gram, and then multiplied to get the amount in an entiresnack item. The hypothesis was that the final calorie counts from the test would be 5% higher than thecount given on the package. The tested amounts were really an average of 52% higher than the amountsgiven on the package.
Conclusions/DiscussionThe Hostess Twinkies had 24% more calories, the Hostess Donettes: Crumb had 63% more calories, andthe Hostess Dunkin# Stix had 69% more calories than the packages said. In the average of all threeproducts, there were 52% more calories in the product than were marked on the package. Through thisexperimentation, it is concluded that the amount of calories written on snack food items is under marked.
This experiment tested the accuracy of calorie counts on the Nutrition Facts section of food packages.
Parents supervised the testing of the food and helped collect materials needed for experimentation.
CALIFORNIA STATE SCIENCE FAIR2007 PROJECT SUMMARY
Ap2/07
Name(s) Project Number
Project Title
Abstract
Summary Statement
Help Received
Luka C. Douridas
Soapy Dilemma
J1807
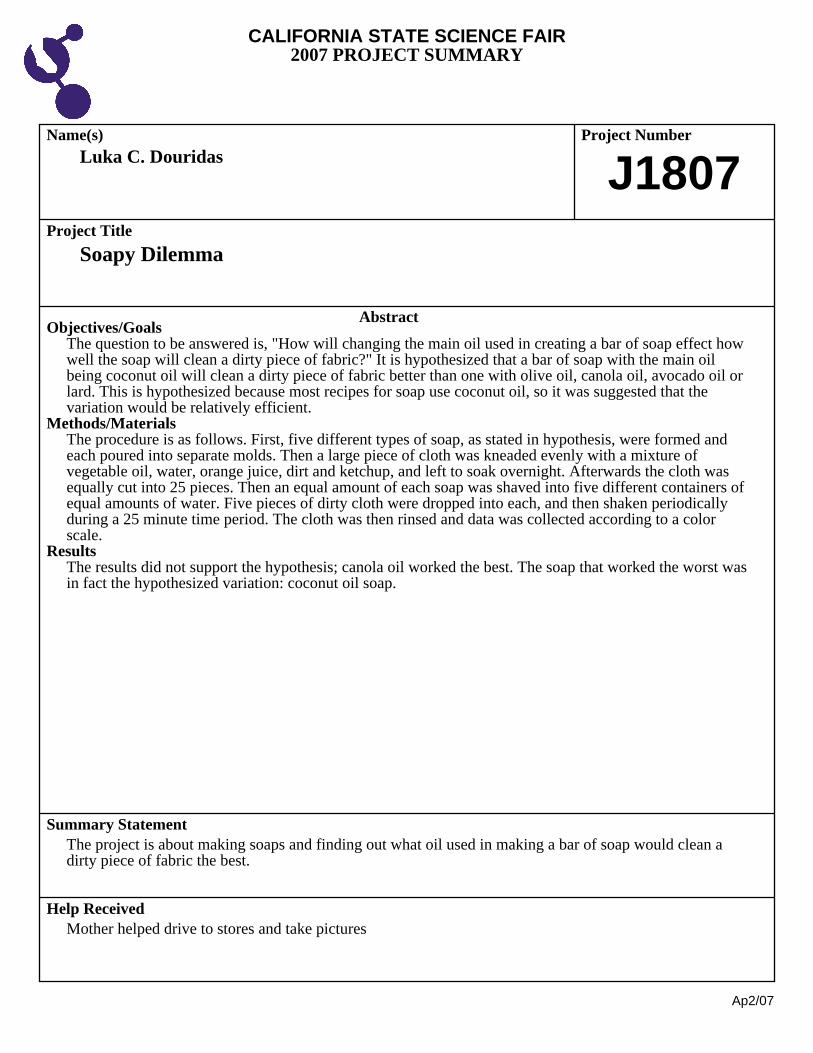
Objectives/GoalsThe question to be answered is, "How will changing the main oil used in creating a bar of soap effect howwell the soap will clean a dirty piece of fabric?" It is hypothesized that a bar of soap with the main oilbeing coconut oil will clean a dirty piece of fabric better than one with olive oil, canola oil, avocado oil orlard. This is hypothesized because most recipes for soap use coconut oil, so it was suggested that thevariation would be relatively efficient.
Methods/MaterialsThe procedure is as follows. First, five different types of soap, as stated in hypothesis, were formed andeach poured into separate molds. Then a large piece of cloth was kneaded evenly with a mixture ofvegetable oil, water, orange juice, dirt and ketchup, and left to soak overnight. Afterwards the cloth wasequally cut into 25 pieces. Then an equal amount of each soap was shaved into five different containers ofequal amounts of water. Five pieces of dirty cloth were dropped into each, and then shaken periodicallyduring a 25 minute time period. The cloth was then rinsed and data was collected according to a colorscale.
ResultsThe results did not support the hypothesis; canola oil worked the best. The soap that worked the worst wasin fact the hypothesized variation: coconut oil soap.
The project is about making soaps and finding out what oil used in making a bar of soap would clean adirty piece of fabric the best.
Mother helped drive to stores and take pictures
CALIFORNIA STATE SCIENCE FAIR2007 PROJECT SUMMARY
Ap2/07
Name(s) Project Number
Project Title
Abstract
Summary Statement
Help Received
Wylie H. Drummond, IV
Sticky Fingers: Getting More Bond for the Buck
J1808
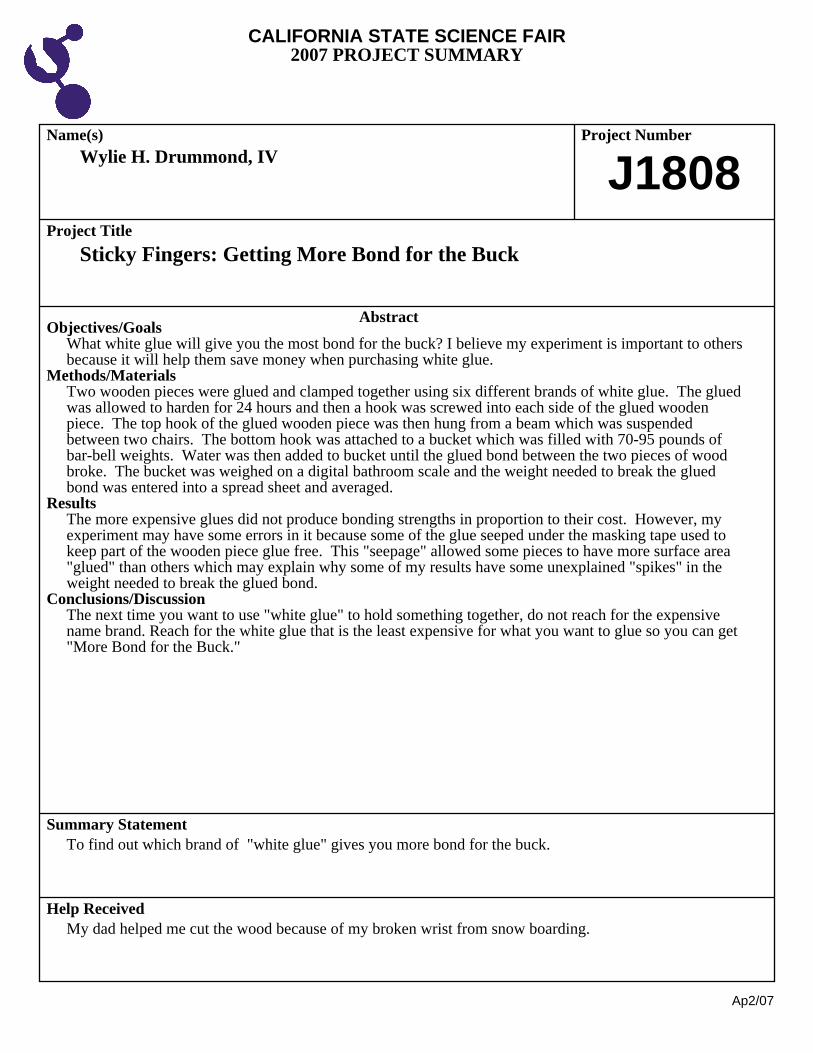
Objectives/GoalsWhat white glue will give you the most bond for the buck? I believe my experiment is important to othersbecause it will help them save money when purchasing white glue.
Methods/MaterialsTwo wooden pieces were glued and clamped together using six different brands of white glue. The gluedwas allowed to harden for 24 hours and then a hook was screwed into each side of the glued woodenpiece. The top hook of the glued wooden piece was then hung from a beam which was suspendedbetween two chairs. The bottom hook was attached to a bucket which was filled with 70-95 pounds ofbar-bell weights. Water was then added to bucket until the glued bond between the two pieces of woodbroke. The bucket was weighed on a digital bathroom scale and the weight needed to break the gluedbond was entered into a spread sheet and averaged.
ResultsThe more expensive glues did not produce bonding strengths in proportion to their cost. However, myexperiment may have some errors in it because some of the glue seeped under the masking tape used tokeep part of the wooden piece glue free. This "seepage" allowed some pieces to have more surface area"glued" than others which may explain why some of my results have some unexplained "spikes" in theweight needed to break the glued bond.
Conclusions/DiscussionThe next time you want to use "white glue" to hold something together, do not reach for the expensivename brand. Reach for the white glue that is the least expensive for what you want to glue so you can get"More Bond for the Buck."
To find out which brand of "white glue" gives you more bond for the buck.
My dad helped me cut the wood because of my broken wrist from snow boarding.

CALIFORNIA STATE SCIENCE FAIR2007 PROJECT SUMMARY
Ap2/07
Name(s) Project Number
Project Title
Abstract
Summary Statement
Help Received
Jessica M. DuBose
Dirty Mouth? Clean It Up!
J1809
Objectives/GoalsI hypothesized that the cinnamon gum would reduce the most microbes. My problem was which flavor ofgum reduced the most bacteria, though both flavors have an even chance to reduce the most bacteria. Thepeppermint gum has peppermint oil in it that has a numbing affect, and the cinnamon gum has cinnamonoil in it that helps prevent bad breath. I planned to solve this by having people chew two different flavorsof gum and measure how much bacteria it reduces. I will also need to get a control so I can figure outwhich flavor reduces the most bacteria.
Methods/MaterialsI tested my question by taking samples of bacteria. My independent variable was the sample before theychewed the gum. My dependent variable was the samples from the cinnamon and peppermint gum. Mymethod for testing was to swab their mouth before and after they chewed the gum. Then I put the sampleon the agar plates and looped them, taped them shut, and put them in the incubator for the bacteria togrow. The next day I would count the bacteria.
ResultsMy findings proved my hypothesis wrong. Peppermint gum reduced the most bacteria. The averagebacterium reduced by cinnamon gum was 79.1. The average bacterium reduced by peppermint gum was86.5. 549.4 was the average control people had. As you can see both flavors of gum reduced about thesame amount of bacteria. Also neither one reduced much of the bacteria, but they reduced some bacteria.
Conclusions/DiscussionI have learned many things from this project. For example, I learned a lot about bacteria and how to growthem. I had to grow them to see if my hypothesis, which was cinnamon would reduce the most, wascorrect or incorrect. My problem was which flavor of gum would reduce the most bacteria. Myindependent variable was the type of gum I had and my dependant variables was the amount of bacteriaeach type grew.In the end I proved my hypothesis incorrect. The average bacterium reduced by cinnamon gum was 79.1. The average bacterium reduced by peppermint gum was 86.5. As you can see peppermint gum reduced7.4 more bacteria than cinnamon gum.
My project is about finding out which flavor of gum, peppermint or cinnamon, can reduce the mostbacteria in your mouth.
Mother helped type up report and decorate board, Mrs. Marcarelli helped get materials I needed andsupervised my project.

CALIFORNIA STATE SCIENCE FAIR2007 PROJECT SUMMARY
Ap2/07
Name(s) Project Number
Project Title
Abstract
Summary Statement
Help Received
Helena Epps; Joe Raimondi
Efficiency Deficiency
J1810
Objectives/GoalsEstimates of the degree of fuel that is not combusted in a typical 4-stroke engine ranges from 5-20percent. With gas prices rising and oil supplies dwindling, the need for fuel efficiency rises. Our purposeis to determine whether any gas saving treatments actually have beneficial effects on fuel efficiency.Specifically, we asked how different types of gas saving treatments affect the mileage of a 4-strokeengine? We predict that compared to regular gasoline, additives will perform the best, a modified sparkplug next, followed by heated gasoline, and then fuel line magnets, which will perform the same asregular gasoline (the control).
Methods/MaterialsTo test our predictions, we built an apparatus consisting of a 6.5hp engine coupled to a wheel andodometer. We used 87 octane gasoline. We tested 5 gas saving treatments: fuel additive, fuel linemagnet, modified spark plug, fuel line heating pack, and control. For each trial, we used 50 milliliters ofgasoline and one of the five gas saving treatments. We ran five trials of each treatment in a series of thefive treatments in a row.
ResultsSome of the treatments improved fuel efficiency. Heated fuel was the most efficient (5% greater than thecontrol), followed by the modified spark plug (+4%), the gasoline additive (+1%), the control, and finallythe magnet (5% decrease).
Conclusions/DiscussionOur results did not support our hypothesis in the order of effectiveness, however they do suggest that thereare ways to increase fuel economy. Next time we would like to try combining the treatments to see if wecould get a better result. We would also try to find a way to use the heat from the engine to heat the gas inthe fuel line.
We investigated the effects of different gas saving treatments on the fuel effficiency of a 4-stroke engine.
Parent helped with spread sheet and graphs, science teacher edited and made comments on the report.

CALIFORNIA STATE SCIENCE FAIR2007 PROJECT SUMMARY
Ap2/07
Name(s) Project Number
Project Title
Abstract
Summary Statement
Help Received
Brian Fiser; Joshua Polich
Look Cool or Be Cool: Which Sports Material Cools Your BodyTemperature Down the Fastest?
J1811
Objectives/GoalsWe both play sports and spend a lot of money on sports apparel. We came up with this project to see whatsports material allows a body to cool down the fastest.
Methods/MaterialsWe manufactured a silicon block. Then we heated the silicon block to 110°F in a convection oven. Theambient temperature was controlled at 74°F. We measured the temperature of the silicon block with adigital thermometer. Then we monitored the temperature of the silicon every ten seconds from 105°Fdown to 97.5°F, while it was covered alternately with five different sports materials. We chose thistemperature range based on a marathon runner#s body temperature of 103.8°F, and a weight lifter#s bodytemperature of 101°F and a normal body temperature of 98.6°F.
ResultsOur results showed that the more synthetic materials there are in the active wear, the faster you will cooldown. It also shows that the most expensive shirts don#t always perform the best.
Conclusions/DiscussionThe polyester material of the Champion shirt performed the best because it cooled down the fastest. TheUnder Armour shirt was ranked better in manufacturer reviews because of its 82% Cationic Polyester and18% Elastane, but in our study it was beat by both Champion (100% Polyester) and Nike (56% Nylon,32% Polyester, 12% Spandex). The Speedo (100% Cotton) material took the longest to cool down, as thenatural material did not allow our test block to cool as rapid as synthetic materials. All the syntheticsports material, were the top performers in our experiment.
Our project is about the cooling rate of body temperature with sports materials covering them.
We would like to thank our parents for helping us put our board together and creating graphs on thecomputer. Allflex USA provided us with the highly accurate GLA thermometer.
CALIFORNIA STATE SCIENCE FAIR2007 PROJECT SUMMARY
Ap2/07
Name(s) Project Number
Project Title
Abstract
Summary Statement
Help Received
Claire E. Gorder
Your Fries Give Me Gas! The Viscosity of Various Bio-diesel Blends inCold Temperatures
J1812
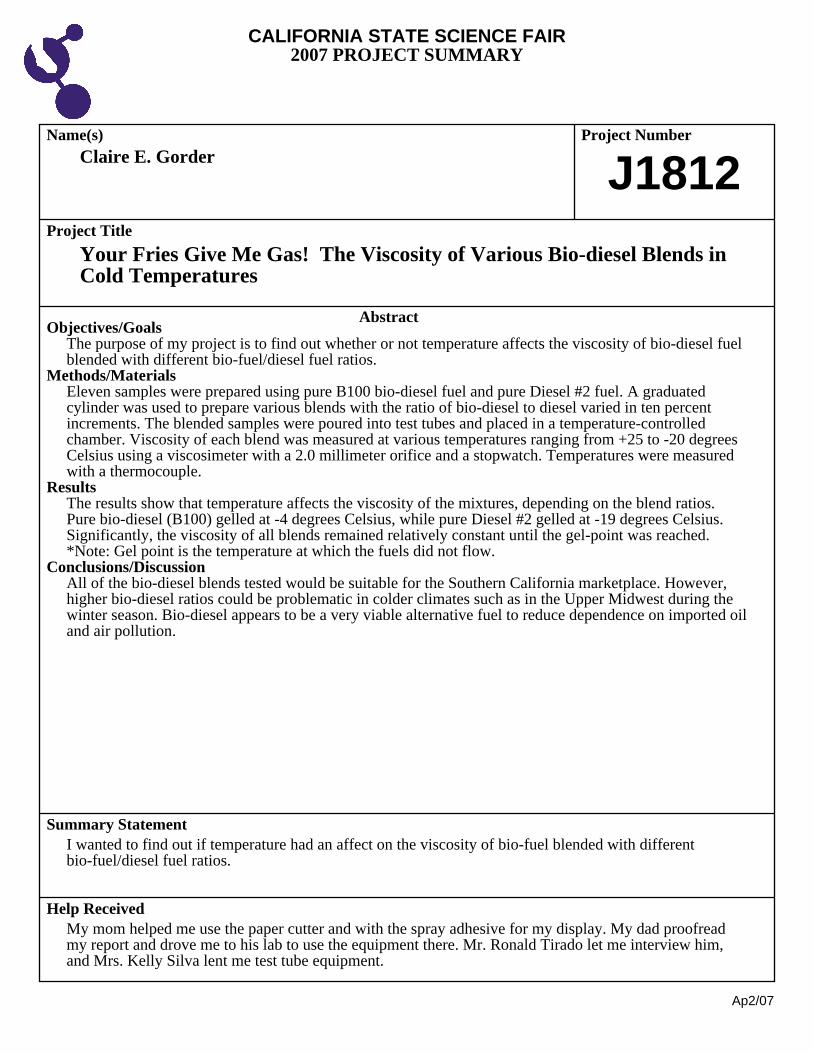
Objectives/GoalsThe purpose of my project is to find out whether or not temperature affects the viscosity of bio-diesel fuelblended with different bio-fuel/diesel fuel ratios.
Methods/MaterialsEleven samples were prepared using pure B100 bio-diesel fuel and pure Diesel #2 fuel. A graduatedcylinder was used to prepare various blends with the ratio of bio-diesel to diesel varied in ten percentincrements. The blended samples were poured into test tubes and placed in a temperature-controlledchamber. Viscosity of each blend was measured at various temperatures ranging from +25 to -20 degreesCelsius using a viscosimeter with a 2.0 millimeter orifice and a stopwatch. Temperatures were measuredwith a thermocouple.
ResultsThe results show that temperature affects the viscosity of the mixtures, depending on the blend ratios.Pure bio-diesel (B100) gelled at -4 degrees Celsius, while pure Diesel #2 gelled at -19 degrees Celsius.Significantly, the viscosity of all blends remained relatively constant until the gel-point was reached.*Note: Gel point is the temperature at which the fuels did not flow.
Conclusions/DiscussionAll of the bio-diesel blends tested would be suitable for the Southern California marketplace. However,higher bio-diesel ratios could be problematic in colder climates such as in the Upper Midwest during thewinter season. Bio-diesel appears to be a very viable alternative fuel to reduce dependence on imported oiland air pollution.
I wanted to find out if temperature had an affect on the viscosity of bio-fuel blended with differentbio-fuel/diesel fuel ratios.
My mom helped me use the paper cutter and with the spray adhesive for my display. My dad proofreadmy report and drove me to his lab to use the equipment there. Mr. Ronald Tirado let me interview him,and Mrs. Kelly Silva lent me test tube equipment.

CALIFORNIA STATE SCIENCE FAIR2007 PROJECT SUMMARY
Ap2/07
Name(s) Project Number
Project Title
Abstract
Summary Statement
Help Received
Jaena Han
Natural vs. Pharmaceutical Antibiotics
J1813
Objectives/GoalsI conducted this experiment to determine whether natural or pharmaceutical antibiotics would be better atpreventing antibiotic resistance from occurring within E. coli strain ATCC25922.
Methods/MaterialsA turbidity measurement was performed to guarantee that each antibiotic had an initial antimicrobialeffect against E. coli strain ATCC25922. Then, the E. coli was exposed to the two pharmaceuticalantibiotics (Ampicillin and Cyprofloxacin Hydrochloride) and two natural antibiotics (garlic and honey)that had been tested, for increasing lengths of time, beginning at 2 hours of exposure and concluding after12 hours of exposure. After each exposure, a susceptibility test was performed to determine how sensitivethe bacteria were to the effects of each antibiotic. The point at which the E. coli developed an antibioticresistance was determined when the diameter of the inhibition zone decreased below its standards forsusceptibility.
ResultsThe turbidity measurement indicated every antibiotic tested had some degree of growth inhibition. By theend of the susceptibility tests, garlic had no inhibition zone, and the inhibition zone of Ampicillin haddecreased about 3.3 mm from 17 mm to 13.7 mm, which is below its zone diameter standards forantibiotic susceptibility. The inhibition zone of honey, however, decreased by only 1mm from 13 mm to12 mm, the least significant decrease among all the antibiotics, and the inhibition zone of Cipro decreased3 mm from 35 mm to 32 mm: not enough for it to be considered ineffective. Therefore, the E. colideveloped resistance to garlic and Ampicillin but not to Honey or Cipro.
Conclusions/DiscussionThe results were inconclusive, as the E. coli developed resistance to one natural and one pharmaceuticalantibiotic and failed to develop resistance to one natural and one pharmaceutical antibiotic: an even split.Perhaps there is no correlation between whether an antibiotic is natural or pharmaceutical and its ability toprevent bacteria from developing resistances. However, it should be taken into consideration that thisexperiment encompassed a very limited number of antibiotics which may not accurately represent mostantibiotics, both natural and pharmaceutical. Moreover, there is a high possibility that Cipro, garlic andhoney did not have correct concentrations or were inadequately dosed, potentially skewing the results.
The purpose of this expiriment was to determine whether natural antibiotics would be more effective inpreventing antibiotic resistance from occuring in E. coli bacteria over longer durations thanpharmaceutical antibiotics.
Used lab equipment at The Scripps Research Institute under the supervision of Angela Baik; LindseyA.Miles allowed me to use lab equipment; Neill Gingles provided E. coli strain; Hongdong Bai gavetechnical advice on methods of culturing E. coli.

CALIFORNIA STATE SCIENCE FAIR2007 PROJECT SUMMARY
Ap2/07
Name(s) Project Number
Project Title
Abstract
Summary Statement
Help Received
Leah A. Hatayama
The Effects of Honey on Longevity of Fruits and Vegetables: Year 2
J1814
Objectives/GoalsTo determine the effects of a 1% honey solution on extending the shelf life and preserving fruits andvegetables.
Methods/MaterialsLast year I tested 3 different dilutions of honey (1%, 5%, and 10%) on strawberries and tomatoes, andfound out that my 1% honey solution kept fruits and vegetables fresh longer at room temperature. Iinvestigated further this year using my 1% honey solution. I purchased strawberries, tomatoes,and grapesand raw honey. I made my 1% solution using honey and sterile water. I labeled each fruit and separatedthem into 3 groups of 10 plus 3 control groups. I sprayed 30 of each berry, grape, and tomato with my 1%honey solution and made my 3 control groups that I didn't do anything to. I let everything dry overnightand stacked them in bowls. This year I took my groups of 10 and placed one outside, one at roomtemperature, and one in the refrigerator at 40 degrees. I also put a control group with each. The next day Ichecked for signs of soft or dark spots, or mold. I observed all my groups until they showed signs ofdecay.
ResultsThe 1% honey coated strawberries and grapes were preserved 50% more or twice as long as the controlgroups both at room temperature and in the refrigerator. My strawberries and grapes outside decayed atabout the same rate as my control groups. My 1% coated tomatoes did better in the refrigerator, none haddecayed by day 10 and in fact did not show any signs of decay for weeks after that. For my tomatoesoutside on day 10, 30% were decayed compared to 50% of the control and my room temperature tomatoesactually decayed faster than my control.
Conclusions/DiscussionAfter completing my investigation in more depth, I found that my hypothesis was correct and the 1%honey solution sprayed on strawberries, tomatoes, and grapes that are refrigerated will stay fresh muchlonger. It will also keep fruit longer at room temperature which I found again this year like last year. Thisis a great thing for farmers and fruit packers who store the fruits and vegetables before they send them offto the grocery stores to know and try. The fruit was much better looking too, the strawberries were brightred in color and people who are allergic to or affected by chemicals would not have to worry.
Investigating whether or not a 1% honey solution could be used to preserve and extend the shelf life offruits and vegetables.
My teacher read over my project and my mother helped type it and helped me with my board.

CALIFORNIA STATE SCIENCE FAIR2007 PROJECT SUMMARY
Ap2/07
Name(s) Project Number
Project Title
Abstract
Summary Statement
Help Received
Julia Hennrikus; Christina McKoane
Which Mouthwash and Ingredients Are Most Effective at InhibitingOral Bacteria?
J1815
Objectives/GoalsDetermine which mouthwash/ingredients and concentrations are the most effective at inhibiting oralbacteria.
Methods/MaterialsWe melted Nutrient Agar,collected our saliva and injected 0.25ml of saliva into each tube.The mixedagar/saliva was poured into sterile Petri dishs. Color-coded discs were dipped into 1 of 6 mouthwashesand placed on the surface of the agar plus a water control.The plates were observed at 24,48,72 hrs.At72hours the clear zone around each disc was measured.We performed 3 trials with newly boughtmouthwashes,a total of 30 experiments,and found the average zone of bacterial clearance for eachmouthwash.
ResultsPeroxyl is the most effective mouthwash at inhibiting oral bacteria,19.5 mm average zone of bacterialclearance.Scope and Listerine tied for 2nd place with an average zone of 12.6mm and 12.8 mm.Crest was3rd with an average zone of 9.4mm.Act performed poorly with an average zone of 7.8mm and AntiPlaqueperformed the worst with an average zone4.2mm.Bacteria grew over the water disc 100% of the time.
Conclusions/DiscussionPeroxyl,the only mouthwash with H2O2 did not perform well in the 1st trial, zone of inhibition6.9mm,similar to antiplaque with a similar alcohol concentration but performed exceedingly well in the2nd and 3rd trials,28.3mm inhibition zone,when the expiration dates were 1½ yrs,rather than ½ yr.Weconclude that our 1st bottle of Peroxyl was old and spontaneously converted to H2O and only its alcohol6% was effective in the first trial.(H2O2)+light/heat-2H2O + O2.Scope and Listerine have the highestalcohol content,15% and 21.6%,Anti-Plaque 8.7%,so it appears that for alcohol to be effective,it must be15% or higher.Crest performed fair with only cetylpyridinium 0.07%.Scope and ACT also hadcetylpyridinium,but no conc.listed,so at a lower concentration than Crest. Cetylpyridinium0.07% is fair atinhibiting growth,but at higher concentrations it stains the teeth brown. The performance of Listerine isdue to the high alcohol content and possibly a minor contribution from Thymol.Sodium benzoate andbenzoic acid are major components in ACT and AntiPlaque which performed poorly. They do not appearto be major contributors to bacterial inhibition, perhaps because they need very acidic conditions,pH 3.6tobe effective,whereas our mouths'pH is 6.2-7.0.Sodium lauryl sulfate, found only in AntiPlaque also doesnot appear to be a very strong bacterial inhibitor.
We measured the diameters of bacterial clearance on nutrient agar around discs soaked in differentmouthwashes to determine which mouthwash and its ingredient is most effective at inhibiting oralbacteria.
mother helped type report and order nutrient agar supplies

CALIFORNIA STATE SCIENCE FAIR2007 PROJECT SUMMARY
Ap2/07
Name(s) Project Number
Project Title
Abstract
Summary Statement
Help Received
Jotthe Kannappan
Paper Chromatography
J1816
Objectives/GoalsMy objective is to determine which marker possesses the strongest bonding ink, a characteristic measuredby paper chromatography (strength indicated by the retention factor). In this process of experimentation, Iwanted to learn the basic principles of paper chromatography.
Methods/MaterialsMaterials:Water, vinegar, 15 strips of paper towel, ruler, pencil, sharpie permanent marker, crayola thin washablemarker, crayola block washable marker, tape and a wide mouth jar were used in this experiment. Method:A ruler was used to draw a horizontal line 2 cm, above the bottom edge of the already cut paper strips.After pouring a small amount of water into a glass, a dot of each marker was placed at center along theline on the paper. Each strip was labeled and the strips were taped to pencil and then hung across the glassjar so that the bottom of the strip was barely touching the water surface. After letting the water raise for 10minutes, the distance the solvent rose was measured and compared to the distance the dot (sample of ink)traveled. The test was repeated 5 times in water and then the solvent was changed to Vinegar and hotwater.
ResultsRetention factor (R.F) is the distant traveled by the sample (dot) over the distance traveled by the solvent.Average retention factors for Sharpie Permanent Marker were 0.022 in Water, 0.035 in Vinegar and 0.059in Hot Water. Average retention factors for Crayola Block Marker were 0.67 in Water, 0.737 in Vinegarand 0.743 in Hot Water. Average retention factors for Crayola Thin Marker were 0.625 in Water, 0.67 inVinegar and 0.713 in Hot Water. Basically, the block marker showed the highest retention factor.
Conclusions/DiscussionI thought that the crayola block marker in water would have the highest retention value. Experimentresults showed the retention factor value of the block marker the highest (0.67 # 0.743) irrespective of thesolvents used. The sharpie permanent marker had a very low (0.022 # 0.059) retention factor indicatingstrong adhesion of ink components which is needed for permanent marking. The thin marker had a R.F of0.625 to 0.713 which has a similar washable ink but because of its thin spread it showed slightly lowerR.F. I was correct about my hypothesis
My project is to identify the material composition (type of ink) using the principles of paperchromatography. .
Dad, sister and grandpa helped me put together the display board.

CALIFORNIA STATE SCIENCE FAIR2007 PROJECT SUMMARY
Ap2/07
Name(s) Project Number
Project Title
Abstract
Summary Statement
Help Received
Kevin R. Kaufmann
Antibacterial Soap vs. Antibacterial Gel: Cause for Concern?
J1817
Objectives/GoalsThe objective is to determine if antibacterial gel inhibits germ growth as effectively as antibacterial soap,even when the variables surrounding the growth of germs change.
Methods/MaterialsNutrient agars were prepared. A basketball containing bacteria from the hands of school children, (nochildren were used in experiments), was the source of germs. Germs were grown in the presence ofantibacterial gel, soap and a neutral environment for bacteria. All environments include an incubated area.
ResultsAntibacterial soap exhibited a minimal amount of growth. The antibacterial gel consistently grew bacteriain large amounts of colonies. The fluid friction applied method had no change of results in the bacterialgrowth in the antibacterial gel experiments. The control was not as heavy a growth of bacteria as theantibacterial gel.
Conclusions/DiscussionAntibacterial soap is more effective than antibacterial gel, even when friction is applied. Antibacterial geland friction may have killed some bacteria picked up by the original swabbing, but growth of some typeof bacteria can not be killed by gel alone. From these results, it is recommended to use an antibacterialsoap.
This project is to observe if antibacterial gel is as effective as antibacterial soap, or creating anantibacterial resistence in the bacteria domain.
Used lab facilites at Center for Advanced Research and Technology (CART), Under the supervision ofConstance Zeeb, Instructor; Forensic Research &Biotechnology, Photographs taken by mother, Diane M.Kaufmann

CALIFORNIA STATE SCIENCE FAIR2007 PROJECT SUMMARY
Ap2/07
Name(s) Project Number
Project Title
Abstract
Summary Statement
Help Received
Kelly M. Kosmo
Does a Fastskin II Swimsuit Really Make a Swimmer Faster?
J1818
Objectives/GoalsThe objective of my experimnet was to determine whether or not the friction-reducing design of theSpeedo Fastskin II full body suit is truly able to increase the speed in which a swimmer travels throughthe water, or if this is just a marketing gimmick. I tested the speed of four different swimsuits; the SpeedoFastskin II, a standard lycra swimsuit, a bikini, and board shorts and a t-shirt. In order for my results to beaccurate, I conducted an experiment which was able to eliminate all other variables besides friction; themain variable being propulsion.
Methods/Materials1) 50 meter pool; 2) Swimmer; 3) Three timers & someone to hold and release the swimmer; 4) SpeedoFastskin II full body swimsuit; 5) Standard lycra competition swimsuit; 6) Bikini; 7) Shorts and t-shirt; 8)Snorkel, goggles, pull buoy, swim cap; 9) Aqua scooter; 10) 3 stopwatches; 11) Rope.I did not want a swimmer's effort to affect my results. Instead I used an Aqua Scooter(a single-speedwater propulsion device used by scuba divers). Prior to the start, the swimmer was held horizontally in thewater with her feet on the wall and the Aqua Scooter running. By doing this I was able to eliminate anyvariance in the start which may have otherwise been caused by pushing off the wall with differentamounts of force. I am a Junior Olympic level swimmer and have good strength and balance in the water.I practiced before-hand to be sure to keep the aqua scooter at the same depth and straight for each timingrun. The pool was closed to all other users and there was no wind, so there were no currents or wakes. For each suit type I made five timing runs, each run with three stop watches.
ResultsThe Speedo Fastskin II full body swimsuit does indeed increase the speed in which a swimmer is able tomove through the water. My results showed that the Speedo Fastskin II is 3.1% faster than the standardlycra swimsuit, 4.1% faster than the bikini, and 4.6% faster than the shorts and t-shirt.
Conclusions/DiscussionOverall, the Speedo Fastskin II full body swimsuit was the fastest out of all the suits that I tested. This wasdue to its design, which is made to control the flow of water over a swimmer by reducing frictional drag.My hypothesis that the Fastskin II would reduce friction and increase the speed of the swimmer wassupported by these results. However, the percentage by which this occured was greater than I hadexpected.
A swim-suit made of specialized material and a design resembling shark#s skin is measurably moreefficient (less drag) than a regular competitive swim-suit or human skin.
My dad helped find and purchase the Aqua Scooter, he also held the swimmer at the start of each test. There were three helpers timing with stop watches. I received a generous donation of a Speedo FastSkinII from Competitive Aquatics Supplies and was given time to use the pool thatks to the City of Santa

CALIFORNIA STATE SCIENCE FAIR2007 PROJECT SUMMARY
Ap2/07
Name(s) Project Number
Project Title
Abstract
Summary Statement
Help Received
Nicole Kowtko
Fast Food Fuel Frenzy: How Effective Is Biofuel?
J1819
Objectives/GoalsI wanted to determine if biodiesel made from waste vegetable oil (WVO) is a comparable replacement fordiesel #2. I hypothesize that they both will burn approximately the same amount of fuel in approximatelythe same amount of time because they both burn at high temperatures.
Methods/MaterialsA homemade calorimeter composed of a 6 oz tin can containing 5 ml of the test fuel was clamped into atea kettle holding 1 pound of water. A digital thermometer was placed in the spout. After the wick in thefuel was lit, a timer was started, and there was continual stirring of the water (so the heat was evenlydistributed). When the water was raised 1 degree Fahrenheit (meaning the fuel generated 1 BritishThermal Unit or BTU), the wick was blown out, and the timer stopped. The amount of fuel burned off andthe elapsed time were recorded. This was repeated 10 times per fuel.
ResultsThe amount of fuel burned off during each test is the same as the amount of fuel needed to generate 1BTU. The biodiesel used an average of .25 ml to generate 1 BTU, while diesel #2 only needed .225 ml offuel to produce the same energy. The amount of time needed to generate 1 BTU is another factor that wasused to evaluate the efficiency of the test fuels. Biodiesel used an average of 99.375 seconds to generate 1BTU, while diesel only needed an average of 67.875 seconds. Interestingly enough, biodiesel requiredabout 50% more time than diesel, so diesel was clearly faster.
Conclusions/DiscussionThe evidence indicates that the diesel burned less fuel and burned quicker than the biodiesel, proving thehypothesis wrong. However, from observations based on the smell and byproduct of the fuels, biodieselseems to be the overall better choice.
This project tests if biodiesel made from waste vegetable oil is a comparable replacement for diesel #2 byexamining the fuel efficiency.
Two neighbors informed me about calorimeters and a way to test the fuels, which I later refined thru trialand error. My science teacher reviewed my ideas. My mother was my test assistant (dealing with thematches and safety measures), taught me how to use Excel graphs, and helped review my work.

CALIFORNIA STATE SCIENCE FAIR2007 PROJECT SUMMARY
Ap2/07
Name(s) Project Number
Project Title
Abstract
Summary Statement
Help Received
Andrew R. Kurzweil
Cereal Critters: A Study of Contaminants in Mass-Marketed andOrganic Breakfast Cereals
J1820
Objectives/GoalsI hypothesize that mass-marketed cereals contain fewer contaminants and microorganisms than organiccereals because pesticides are used in the growth of their key ingredients and chemical preservatives areused in their processing.
Methods/MaterialsI purchased 10 mass-marketed and 10 organic cereals, noting preservatives, country of origin andpackaging materials for each. I then measured ½ ounce of each sample and conducted a visualcontaminant study vs. a pre-determined rating scale. I crushed the sample with a pestle, made a slide, andobserved it under a microscope at a 4x magnification level, charting any observations. I added water to thespecimen slide and observed it at a 40x magnification level, again noting any activity/findings. I repeatedthe process for each sample, comparing and drawing conclusions from my findings.
ResultsThere was no difference in the amount of visible contaminants and debris between the mass-marketed andorganic cereal samples in a visual inspection. Contaminant levels observed at the 4x magnification levelwere also similar, with all debris in the minimal range. Organic cereals yielded contaminants in a greatermagnitude and severity than did mass-marketed cereal at the 40x magnification level, 70% vs. 20% ofsamples. Most mass-marketed cereals studied used the chemical BHT as a preservative, while all organiccereals sampled used a natural preservative. Cereals containing fruit and those manufactured outside ofthe U.S. correlated to a higher level of contamination.
Conclusions/DiscussionMass-marketed cereals contain fewer contaminants than organic cereals. While neither showedeasily-visible debris, organic cereals showed markedly heavier and more contamination undermicroscopic magnification, a 50 percentage point difference. The use of pesticides and chemicalpreservatives in mass-marketed cereals appear to be effective in limiting contamination. Cerealscontaining fruit and those manufactured outside the U.S. have a greater likelihood of containing unwantedmatter.
My project compared various mass-marketed and organic cereals under different levels of magnificationin order to determine if one type had a greater presence of contaminants and microorganisms than theother.
Mother drove me to the grocery stores & Father oversaw microscope viewing.

CALIFORNIA STATE SCIENCE FAIR2007 PROJECT SUMMARY
Ap2/07
Name(s) Project Number
Project Title
Abstract
Summary Statement
Help Received
Alexandra A. Lamoureux
What's Best for Washing People's Hands?
J1821
Objectives/GoalsThis experiment determined which type of substance was most effective at sanitizing people's hands afterhandling raw hamburger meat. The researcher hypothesized that if less bacteria grew after washing handswith anti-bacterial soap, then anti-bacterial soap kills the most bacteria.
Methods/MaterialsThe procedure involved a volunteer washing his hands with various substances after handling hamburgermeat that was placed out for two days (allowing it to spoil). The following substances for washing wereused to perform each of four trials: not washing (control group), water, regular soap, hand sanitizer, andanti-bacterial soap. After washing, the researcher swabbed the palm of the volunteer's hand with a Q-tipand smeared the Q-tip on the agar inside a petri dish. The bacterial growth in each petri dish wasmeasured over a nine-day experimentation period.
ResultsThe researcher found that a small amount of bacteria grew slowly after hands were washed withanti-bacterial soap. When washing with water, hand-sanitizer, and regular soap larger amounts of bacteriagrew quicker. When hands weren't washed, large amounts of bacteria grew the quickest.
Conclusions/DiscussionThe results show that anti-bacterial soap grew the least bacteria, which supports the researcher'shypothesis.
This experiment determined which type of substance was most effective at sanitizing people's hands afterhandling raw hamburger meat.
My father smeared hamburger meat on his hands and washed them in various substances in order for theresearcher to swab them. My mother purchased the petri dishes and agar.

CALIFORNIA STATE SCIENCE FAIR2007 PROJECT SUMMARY
Ap2/07
Name(s) Project Number
Project Title
Abstract
Summary Statement
Help Received
Joshua B. Larky
The NBA Takes a Bad Bounce: Evaluating Leather vs. SyntheticBasketballs
J1822
Objectives/GoalsMy objective was to test leather and synthetic basketballs in an effort to evaluate grip and bounceconsistency. My interest was ignited by the recent controversy in the National Basketball Association(NBA) over the introduction of the new synthetic ball, in place of the traditional leather basketball. Ihypothesized that since the players perspire during play, the balls might show greater differences whenwet versus when dry. I further hypothesized the dry leather basketball would bounce higher when dry,and not roll as far as a synthetic basketball. I expected the wet synthetic basketball would bounce higherthan the leather ball.
Methods/MaterialsI measured how high each basketball bounced and calculated the standard deviation to assess thevariability of the basketballs# performance. I bounced the basketballs from heights of 100cm (1 meter)and 200cm (2 meters). I set up a roll test to investigate the basketballs# ability to grip to the ground andthe friction associated with each basketball#s particular surface. This test was accomplished by rolling thebasketballs down a ramp and measuring the distance rolled. I performed all of these tests with both wetand dry basketballs, for a total of 480 tests. Bounce tests comprised 320 of the total, and roll testsaccounted for 160 tests.
ResultsWhen bounced from 200cm, both wet and dry, the synthetic basketballs had much higher standarddeviations than the leather balls. Results at 100cm, both wet and dry, showed similar standard deviationsfor leather and synthetic basketballs. Bounce heights were similar in all cases, wet and dry. When rolled,both wet and dry, the synthetic basketballs had much higher standard deviations and also rolled fartherthan the leather basketballs.
Conclusions/DiscussionThe greater standard deviations of the rolled synthetic basketballs may indicate a less consistent grip, andthe farther roll implies they are more slippery than leather balls. My test results seem to confirm the NBAplayers# complaints that synthetic basketballs are harder to grip and more inconsistent when compared toleather basketballs. The NBA acknowledged its mistake in switching to the new synthetic ball, and theleather basketball was put back in play.
I tested leather and synthetic basketballs by bouncing and rolling them, under both wet (to simulate sweat)and dry conditions, and found that the synthetic were more inconsistent, slippery, and unpredictable thanthe leather basketballs.
Thanks to my father for helping me set up my tests and teaching me how to work the video camera. Thanks to my parents for help with editing my report.

CALIFORNIA STATE SCIENCE FAIR2007 PROJECT SUMMARY
Ap2/07
Name(s) Project Number
Project Title
Abstract
Summary Statement
Help Received
Marie R. Laube
Do Different Household Substances Kill Whitefly on Hibiscus Plants?
J1823
Objectives/GoalsMy objective was to determine if different household substances would kill whitefly on hibiscus plants. Ithought that the canola oil, dish soap, and whitefly insecticide would work the best.
Methods/MaterialsThe household substances I tested were water, whitefly insecticide, dish soap, canola oil, rubbing alcohol,409, and bleach. I found two hibiscus plants with whitefly and used these for the experiments. At thebeginning of each experiment I first counted the white eggs on the leaves. Then for each of the sevenhousehold substances I sprayed two leaves with each substance and counted the white eggs every threedays for a total of nine days and recorded the results.
ResultsThere were three experiments conducted on two different hibiscus bushes. In the best experiment, numberthree, when the leaves on hibiscus bush number two were treated with water, 409, bleach, and rubbingalcohol, the number of whitefly eggs was reduced. However, the leaves treated with dish soap, canola oil,and whitefly insecticide had no live whitefly eggs on them after day three.
Conclusions/DiscussionThere was some confusion on which eggs to count in the first experiment. Both white eggs and yellowlarvae were counted, but in the next two experiments only the white eggs were counted. Also it took twoexperiments to determine the right concentration of dish soap to use. Although some of the householdsubstances (409, bleach, rubbing alcohol, and water) had just a small effect on the number of whiteflyeggs killed, the only substances that completely killed all the whitefly eggs on both tested leaves in atleast one experiment were canola oil, dish soap, and whitefly insecticide. The reasons that thesesubstances killed whitefly eggs are different. The dish soap disrupts the cell membrane which causes thecontents of the cell to leak out and the eggs die. The canola oil suffocates the eggs. The whiteflyinsecticide, which was used as a positive control, contains canola oil and pyrethrins. Pytrethrins kill adultinsects by disrupting the nervous system and causes paralysis. Therefore the hypothesis that dish soap,canola oil, and whitefly insecticide will kill the most whitefly eggs on hibiscus plants is correct.
Different household substances were tested to determine if they could kill whitefly on hibiscus plants.
Mother helped me choose project and gather data,brother helped me with the graphs, my teacher Mr.Pashkow helped me with editing.

CALIFORNIA STATE SCIENCE FAIR2007 PROJECT SUMMARY
Ap2/07
Name(s) Project Number
Project Title
Abstract
Summary Statement
Help Received
Joshua R. Lewicki
Sweet Relief?
J1824
Objectives/GoalsMy objective was to determine whether or not certain candies could neutralize a strong acid. Ihypothesized that candies with magnesium present as an ingredient would work towards neutralizing theacid.
Methods/MaterialsSeven different brand-name candies (Mentos, Wrigley's Doublemint Mints, Tic Tacs Freshmints,Peppermint Life Savers, Strawberry Pop-Rocks, Bubble Gum Pop-Rocks, and one generic antacid as thecontrol group) were crushed and dropped into 10 mL of cola, after which the mixture was tested withlitmus paper (in Phase 1). The number of candies was increased by threes (1, 3, 6...). In Phase 2, theprocedure was the same, but the mixtures were tested with a digital pH meter. The materials were: pencil,computer, SOLO plastic cups, paper towels, Diet Go2 Cola, notebook, the six aforementioned candies andthe aforementioned antacid, and red and blue litmus paper.
ResultsTic Tacs (which contained a form of magnesium, magnesium stearate) and the antacids were the onlycandies that reached a neutral pH or higher, the Tic Tacs after 27, the antacids after 2. My hypothesis wastherefore correct.
Conclusions/DiscussionMy hypothesis was correct in that magnesium neutralizes acid. I discovered that Tic Tacs can act as anantacid, because they contain magnesium. However, the anti-health factors of eating 27 Tic Tacsoverrules their benefits.
My project is about whether candies can provide a useful function by acitng as an antacid.
My mother drove me to the store to buy candies and other materials; she also helped with the typing.
CALIFORNIA STATE SCIENCE FAIR2007 PROJECT SUMMARY
Ap2/07
Name(s) Project Number
Project Title
Abstract
Summary Statement
Help Received
Timothy J. Okita
The Efficiency of the Fluorescent Light Bulb vs. the Incandescent LightBulb
J1825
Objectives/GoalsThe objective is to see how much more efficient the fluorescent light bulb is compared to the incandescentlight bulb.
Methods/MaterialsThree fluorescent light bulbs (10, 13 and 20 watts) and three equivalent incandescent light bulbs (40, 60and 75 watts) were tested. The heat given off by each bulb was measured by the rise in air temperature ina closed Styrofoam container. Each bulb was tested at one-minute intervals for 15 minutes and a total ofsix tests on each bulb were conducted. In addition, light and wattage were measured. The light given offby each bulb was measured at four different distances using a light meter. The wattage of each bulb wasmeasured using a watt meter.
ResultsThe fluorescent light bulbs are 75% more efficient than the equivalent incandescent light bulbs. Since thewattage measurements were consistent with the rated watts and the light output was approximately thesame for each equivalent bulb, incandescent light bulbs waste energy in the form of heating the air in theroom.
Conclusions/DiscussionThe fluorescent light bulbs are more efficient than predicted. The wattage and light output wasapproximately the same for the two types of bulb as expected. This experiment demonstrates that therecould be significant energy savings if people used fluorescent rather than incandescent light bulbs in theirhomes and businesses.
In this experiment, I am testing how much more efficient the fluorescent light bulb is than theincandescent light bulb.
My dad helped me record the results.

CALIFORNIA STATE SCIENCE FAIR2007 PROJECT SUMMARY
Ap2/07
Name(s) Project Number
Project Title
Abstract
Summary Statement
Help Received
Joseph L. Pagano
Swing Batter Batter!
J1826
Objectives/GoalsThe purpose of this project was to determine which of the four baseball bats hit a baseball the farthest. The four baseball bats were made of different materials that included: wood, aluminum, alloy andgraphite.
Methods/MaterialsThe experiment involved measuring the distance the ball traveled altogether. This was done by using aspring loaded batting device, a batting tee and a baseball. The bats retracted 180 degrees and released tostrike the baseball. I recorded measured distances in a journal. I compared distances that the ball traveledwhen hit by the different types of bats. The in-flight travel of the baseball was not very different amongthe four bats. The aluminum alloy bat hit the baseball the farthest because of the reflex effect that occurswhen the aluminum alloy strikes the ball. This effect propels the baseball farther than other bats.
ResultsAfter conducting the experiment I realized the graphite bat generated the same bat speed from the battingdevice as the other bats. Because of this controlled speed, the graphite bat did not hit the farthest. Ibelieve that a graphite bat would perform better with a real batter because he/she would be able to benefitfrom the lightweight feature that the graphite bat offers allowing the batter to swing faster and as a resulthit the ball farther.
Conclusions/DiscussionBased on my research I predicted that the graphite bat would hit the baseball farthest because of thespecial type of metal that it is made from. Graphite metal is lightweight and is used in different types ofsporting equipment such as golf clubs, tennis racquets and baseball bats.
Using baseball bats made of four different materials, which bat will hit the baseball the farthest.
Father and a friend helped design and build the batting device. Mother helped with the display board. Interviewed a pitching coach for the Detroit Tigers, Chuck Hernandez.

CALIFORNIA STATE SCIENCE FAIR2007 PROJECT SUMMARY
Ap2/07
Name(s) Project Number
Project Title
Abstract
Summary Statement
Help Received
Alaina R. Petlewski
"And the Reading Is...." The Effects of Antacids on Lemonade andOrange Juice
J1827
Objectives/GoalsMy project was to determine which antacid, of six tested, would reduce the acidity of lemonade andorange juice the most. I believed that Tums would be the most effective.
Methods/MaterialsInitial pH readings of six beakers of 250 ml of room temperature lemonade were taken with a pH meter.The minimum recommended dose of six different antacids, in tablet form, were crushed and added to thebeakers. The pH of the juice/antacid solution was measured at timed intervals up to one hour. Anadditional dose, if allowed and needed, was added at 30 minutes. The process was repeated with orangejuice.
ResultsIn both the lemonade and the orange juice, Alka Seltzer Gold worked the most quickly to reduce the acid,but stabilized at a lower pH. The Mylanta Ultra worked a little more slowly, but continued to reduce theacidity the most over the hour period and came closer to reaching neutral than the other antacids. Tumscame in second over the hour period.
Conclusions/DiscussionMy conclusion is that Alka-Seltzer Gold works the most quickly to reduce the acidity of lemonade andorange juice, but Mylanta Ultra reduces the acidity the most over the hour long period. My hypothesiswas disproved as Tums was the second most effective antacid over the hour long period.
My project determined which, of six antacids tested, would reduce the acidity of lemonade and orangejuice the most over an hour long period.
Mom helped with testing, typing Procedure and Bibliography, dictation. Teacher- format questions.

CALIFORNIA STATE SCIENCE FAIR2007 PROJECT SUMMARY
Ap2/07
Name(s) Project Number
Project Title
Abstract
Summary Statement
Help Received
Kayleen D. Ports
Help! My Data's All Wet
J1828
Objectives/GoalsTo find out out how different liquids affect the functionality of a flash drive.
Methods/MaterialsSix different flash drives, Diet Coke, Tide Laundry detergent, water, plastic cups. Soaked flash drives indifferent liquids to see at various intervals how they would function.
ResultsAll flash drives worked after soaking for five minutes, one hour and for ten hours.
Conclusions/DiscussionBy Testing, I found out that flash drives can withstand soaking in Diet Coke, water and laundry detergentfor a long period of time.
How do different liquids affect the functionality of a flash drive.
None
CALIFORNIA STATE SCIENCE FAIR2007 PROJECT SUMMARY
Ap2/07
Name(s) Project Number
Project Title
Abstract
Summary Statement
Help Received
Zachary C. Radovich
Germs
J1829
Objectives/GoalsThe objective of this experiment was to find which household cleaning products were most effective inkilling germs. Vinegar will be the most effective household cleaning product in killing germs. Water willbe the least effective.
Methods/MaterialsRaw hamburger was rubbed on nutrient agar in ten labeled petri dishes. 10 labeled disks were soaked ineach cleaning product and water, which was the constant. One of each disk was placed at equal intervalsin each petri dish. Petri dishes were incubated for several days in a dark, warm closet. The zone ofinhibition was measured and recorded. The values were added together to determine the average zone ofinhibition for each product.
ResultsClorox Clean Up was the most effective household cleaning product in killing germ, with an average zoneof inhibition of 13.5mm. Water was the least effective, with an average zone of inhibition of 0.7 mm.
Conclusions/DiscussionThe results from this experiment did not support my hypothesis. The household cleaning products usedwere not as effective at killing germs as the had claimed.
To determine which household cleaners are the most effective in killing germs.
Mrs. Parker supplied the nutrient agar. Bridget helped me keep organized and helped with the typing. Mymom for picking me up late after school when I stayed late to work on my project.

CALIFORNIA STATE SCIENCE FAIR2007 PROJECT SUMMARY
Ap2/07
Name(s) Project Number
Project Title
Abstract
Summary Statement
Help Received
Lior I. Schenk
Teeth Whitening with Natural Products
J1830
Objectives/GoalsThe purpose was to determine what foods can be used to effectively whiten teeth. What foods can be usedto effectively whiten teeth. It is hypothesized that certain foods can be effective, or even superior, in teethwhitening.
Methods/MaterialsGroups of eggs (representing teeth) were put into jars filed with stainers (tea, coffee, Coca-Cola, red wine,and a mix of the four). After ten days of being soaked, the eggs were taken out of the jars to dry. Thevariable would be sliced or crushed to get the juices flowing, and then it would be rubbed on a spot on theegg continuously for sixty seconds. (The variables were Lime, Apple, Orange, Strawberry, Carrot,Cauliflower, Celery, Jicama, Pear, Whitening Strips, 3% Peroxide, Baking Soda, and WhiteningToothpaste.)The colors and whiteness of the new spot were recorded and compared.
ResultsFrom least to greatest effect, the resulting order of variables was: carrot, cauliflower, whitening strips,orange, celery, jicama, pear, baking soda, peroxide, apple, whitening toothpaste, strawberry, peroxide +baking soda, peroxide + lime, and finally, lime. All in all, lime, pear, apple, and strawberry would be thebest foods to eat as substitutes for actual bleaching; they are just as effective, and in some cases, evenbetter. When the testing was repeated, the resulting order of variables was: baking soda, carrot,cauliflower, whitening strip, orange, celery, jicama, pear, peroxide, apple, whitening toothpaste,strawberry, baking soda + peroxide, peroxide + lime, and lime.
Conclusions/DiscussionWhat foods can be used to effectively whiten teeth? All of the variables managed to whiten teeth by somedegree, except for cauliflower and orange, which were worse than the control. The best foods were lime,followed by pear, apple, and strawberry. My hypothesis was that certain foods can be effective, or evensuperior, in teeth whitening. I was correct in stating that certain foods will be superior; however, not all ofthe variables were better than the leading products such as whitening toothpaste and whitening strips. Allin all, lime, pear, apple, and strawberry would be the best foods to eat as substitutes for actual bleaching.They are just as good, and in some cases, even more effective.
Instead of using risky commercial teeth whiteners, people can use natural products for a whole cleanerfeel.
Mother helped buy supplies and research; Dr. C (orthodontist) helped get tooth chart.

CALIFORNIA STATE SCIENCE FAIR2007 PROJECT SUMMARY
Ap2/07
Name(s) Project Number
Project Title
Abstract
Summary Statement
Help Received
Katelyn R. Serrano, II
The Hidden Strength of Paper Towels
J1831
Objectives/GoalsMy objetive for doing this project is to find out which paper towel brand has the strongest paper towels.
Methods/MaterialsTo test a paper towel brand, I place a paper towel over two layers of bricks (there were four bricks in eachlayer)and then I place a third layer of bricks over the sheet to weigh down the paper towel. Then I poureda 10 milliliter baby medicine spoon full of water into the center of the paper towel using a contraptionmade of tinker toys. Twenty seconds after the water is poured half ounce fishing weights would be rolleddown a ramp into the paper towel every five seconds until the sheet breaks. The weight that breaks thesheet is not included in the number of weights it held. Twenty-nine paper towel brands were tested threetimes each.
ResultsThe strongest paper towel was Bounty with Brawny coming in second. Third strongest was CVS BigQuilts and fourth was Thirsty. The two least strongest, which held zero weights in all three tests, wereEarthfirst and Mardi Gras.
Conclusions/DiscussionMy hypothesis was partially true. The more expensive paper towels, Brawny and Bounty, did teststronger overall. Although, the third strongest, CVS Big Quilts, wasn't very expensive and tested qitestrong. However it has less sheets. CVS Big Quilts has 60 sheets, while Brawny and bounty have 80. Inconclusion, I think the consumer needs to not only look at the price of the paper towels, but also at theinformation on the packaging.
My project's main purpose was to examine the many aspects the consumer should look at when buying apaper towel.
Dad helped in building the contraption made out of tinker toys; Mom helped in finding ways to control thevariables of my project; My sisters contributed ideas; My aunt Sherry came up with the idea of using thebricks.

CALIFORNIA STATE SCIENCE FAIR2007 PROJECT SUMMARY
Ap2/07
Name(s) Project Number
Project Title
Abstract
Summary Statement
Help Received
Shalin N. Shah
Regular - Super - Supreme
J1832
Objectives/GoalsMy goal was to find out: Does higher octane rating of unleaded gasoline provide better milage for a car,and is it worth spending more money on it if you're seking better milage?
Methods/MaterialsThe materials needed for my project were fuel from two different gas stations, two cars (suv, sedan);paper, pencil and a calculator. Fill up the tank of the 1st car at gas station A with 87 octane gasoline andrecord odometer reading as the begining odometer. next time fill up the tank and record odometer readingas ending odometer. Find the difference between the begining and ending odometer and record it as themiles. Also, record how many gallons you fill up, the price per gallon and the total price you pay. Next,divide the miles by the gallons filled to get the mileage and record it as the average miles per gallon.Follow these steps two more times using the same octane rating to conform the data. Repeat the samesteps for 89 and 91 octane rating at the same gas station. Then, repeat all of the previous steps at gasstation B with the same car. Follow the entire procedure again, but this time using the second car,remebering to do all three octanes three times at both gas stations.
ResultsFor the SUV at gas station A, I got the average of 13.8 miles per gallon on 87 octane, 13.9 miles pergallon on 89 octane, and 13.9 miles per gallon on 91 octane. At gas station B, I got the average of 14.8miles per gallon on 87 octane, 14.4 miles per gallon on 89 octane, and 14.8 miles per gallon on 91 octane.For the sedan at gas station A, I got the average of 22.1 miles per gallon on 87 octane, 22.1 miles pergallon on 89 octane, and 22.2 miles per gallon on 91 octane. At gas station B, I got the average of 24.1miles per gallon on 87 octane, 24.2 miles per gallon on 89 octane, and 24.2 miles per gallon on 91 octane.
Conclusions/DiscussionThe first part of my hypothesis was incorrect. Using a higher octane of unleaded gasoline will not providebetter milage for a car, and that's because it refers to how much energy it takes to ignite the gas, ratherthan how much energy the gas puts out. In other words, the octane rating determines the resist to engineknock. Also, because the higher octane does not provide better milage, it wouldn't be worth it if you areseeking better milage. An essential fact I learned from doing this project was that it matters more of whereyou get your gasoline rather than what octane used.
My project is mainly about finding if the higher octane of unleaded gasoline gives better mileage to acar.
Parents drove car, & took me along to the gas station needed & used octane needed next for the project.

CALIFORNIA STATE SCIENCE FAIR2007 PROJECT SUMMARY
Ap2/07
Name(s) Project Number
Project Title
Abstract
Summary Statement
Help Received
Sona N. Shah
Sun Specs
J1833
Objectives/GoalsMy goal was to find out whether the tint or shade of sunglasses determines the amount of protection itprovides against UV light, and whether it is worth paying higher prices for brand name sunglasses.
Methods/MaterialsThe materials I needed were twelve brand name sunglasses, nine generic sunglasses, and a UVmeter/monitor. First, label the generic sunglasses using the letters A-I. Then, take the equipment outsideon a sunny day, and hold the first pair of sunglasses up to the sun. Place the UV monitor in front of it, andthen behind it to retreive the UV indexes, and record the readings. Repeat the same steps with both thebrand name and generic sunglasses. Confirm the results by repeating the procedure five times on fivedifferent days, all at 4:00pm.
ResultsFor my results, all the brand name sunglasses had a hundred precent protection against ultraviolet light. The generic sunglasses, however, had varied results, one of them having no protection. Also, sunglasseswith the same tint didn't have similar protection.
Conclusions/DiscussionIn conclusion, the first half of my hypothesis was incorrect. The shade or tint of sunglasses doesn't affectthe amount of protection it provides against UV light. Since it doesn't make a difference, the tint is therefor personal preference, for different activities, and cosmetic purposes. However, the second part of myhypothesis was correct. It is worth paying more money for brand name sunglasses because they offerbetter protection against UV light. They contain both UV-A and UV-B protection, which is necessary foryour eye. If your eye isn't protected from UV-B light, it can gradulally lead to a variety of eye diseasesincluding arc eye, cataracts, vision loss, and blindness. Sunglasses reduce the risk of these eye diseases,which is why it is vital to purchase better quality sunglasses that fulfill the requirements of protecting youreyes.
My project is about sunglasses, both brand name and generic, protecting the eye against ultraviolet light.
Mom's help in buying materials, taking pictures, cutting science board in half to form board.
CALIFORNIA STATE SCIENCE FAIR2007 PROJECT SUMMARY
Ap2/07
Name(s) Project Number
Project Title
Abstract
Summary Statement
Help Received
Sanjay Siddhanti
Brand Name or Generic? Which Antacids Are Better at NeutralizingAcid?
J1834
Objectives/GoalsThe objective of the experiment is to find which antacid, Maalox, generic Maalox, Mylanta, or genericMylanta works better at neutralizing acid.
Methods/MaterialsMaterials: The materials included 50 ml and 15 ml tubes, disposable pipettes and droppers, vinegar,antacids (Mylanta and generic Mylanta, Maalox and generic Maalox), pH paper and acid base indicator(red cabbage extract). Experimental variable: Vinegar and different antacids Dependent variable: Amount of brand name or generic antacids required to neutralize vinegar.Methods: 1) Dispense 5 ml of vinegar in separate tubes. 2) Measure the pH of the vinegar using the pH paper strip and the indicator solution. 3) Add one ml of indicator solution to each of the tubes containing vinegar. 4) Add the liquid antacid drop wise to the tube containing vinegar plus indicator solution and observe thechange in color of the pH indicator and pH paper. 5) Measure the amount of antacid required to neutralize vinegar. 6) Repeat steps 4 and 5 using the different antacid solutions.
Results1) A greater volume of the generic antacid was required to neutralize vinegar than the respective brandname antacid.2) Approximately 8 ml of Maalox, 25 ml of generic Maalox, 5 ml of Mylanta and 20 ml of genericMylanta was required to change the pH of 5 ml of vinegar to 7.0.3) All antacids changed the pH of vinegar to 7.0 as measured by the pH strip. 4) The pH change was also observed with color indicator solution. The color changed from pink to bluewhen vinegar was neutralized with an antacid solution.
Conclusions/DiscussionIn this experiment I observed that brand or generic version of antacid were not equal in their ability toneutralize vinegar. A greater volume of the generic antacids was required to neutralize the same amountof vinegar than their respective brand name antacids. This was an experiment done in test tubes; however,I believe that the results could be applicable when people take antacids for relief of heartburn. I alsorecommend that people should read the label when choosing to use brand or generic antacid.
My project was designed to evaluate which antacid, Maalox, generic Maalox, Mylanta, or genericMylanta works better at neutralizing acid.
I would like to thank my family for their support.

CALIFORNIA STATE SCIENCE FAIR2007 PROJECT SUMMARY
Ap2/07
Name(s) Project Number
Project Title
Abstract
Summary Statement
Help Received
Sienna M. Silberkleit
Should Whitening Toothpastes Be Given the Brush Off?
J1835
Objectives/GoalsThe obejective is to determine if whitening toothpastes are effective and if so, are they equally effectiveon stains of coffee, tea, and grape juice? My hypothesis is that whitening toothpastes are effective, butnot all equally effective on stains.
Methods/MaterialsCeramic tiles were stained in 64 oz. solutions. One group was stained with coffee, one with grape juice,and one with tea. Five whitening toothpastes were tested:Mentadent Advance Whitening, Simply White,Crest Whitening Expressions Cinnamon, Aquafresh Extreme Clean, and Arm and Hammer AdvanceWhite. Each toothpaste was tested with a new toothbrush, applying 1/4t. of toothpaste to the brush, andthen brushing the tile for 60 seconds, then rinsing and drying. The brushed tiles were then taken to HomeDepot for a pigment match. Home Depot's reading told how many ounces or fractions of ounces ofpigment would be required to match the brushed tile. The pigment ounces and fractions were added, thenconverted to decimal form, and then compared to the control sample in each category to determine thepercentage of change in pigment.
ResultsThe whitening toothpastes were effective in reducing pigment. Colgate Simply White reduced teastaining by an average of 64%. Arm and Hammer Advance White and Crest Whitening Expressionsreduced coffee stains by 67%, and Mentadent lifted the pigment base to white from a secondary shade ongrape juice stains. Colgate Simply White reduced grape juice stain by 71%.
Conclusions/DiscussionMy hypothesis was correct. Whitening toothpastes are effective though the user should consider the natureof the staining as not all whitening toothpastes were equally effective on removal of different stains.
Whitening toothpastes work, but may not all be equally effective on coffee, tea, and grape juice stains.
My mother helped type the report and Home Depot helped in the paint center with pigment readings.

CALIFORNIA STATE SCIENCE FAIR2007 PROJECT SUMMARY
Ap2/07
Name(s) Project Number
Project Title
Abstract
Summary Statement
Help Received
Laurel M. Silberman
Chlorine vs. Saline Water Systems: Pool Water Quality
J1836
Objectives/GoalsThe purpose of this project is to determine whether new saline pool systems are as effective at eliminatingmicroorganisms as the conventional chlorine systems. I hypothesized that more bacteria would be foundin the water treated with salt-chlorination than in the water treated with conventional chlorination becauseof the difference in the water's chlorine levels.
Methods/MaterialsI collected samples from ten different pools, six of which used conventional chlorine and four that usedsalt-chlorination. Samples were collected in empty purified water bottles and placed in a refrigerator.After intervals of one and two days, I tested the samples for bacteria. I sterilized the work area andmaterials with alcohol. I labeled twenty Petri dishes in order to test two water samples from each pool. Ipipetted approximately three milliliters of the water from each pool into Coliscan Easygel, inverted themixture once, swirled it around, and then poured it into a Petri dish. The plates were sealed and incubated.I then observed the plates after 24 hours, 48 hours, and finally at 72 hours. I tested each water sample forpH, free available chlorine, total chlorine, total alkalinity, and total hardness stabilizer.
ResultsAfter a 72-hour incubation period, all samples still, to my astonishment, had no visible colonies! Inaddition, the free chlorine levels were all at or above the recommended one to three parts per million.
Conclusions/DiscussionThe results of this experiment indicate that both conventional chlorine and salt-chlorination are effectivein eliminating bacteria, with no significant difference in efficacy.
I tested for the difference in microorganisms in pool water treated with conventional chlorine versussaline pool systems and found no difference in bacteria level.
Step-mom drove me to different houses and took pictures of me while I was testing; Science teacherhelped me to acquire the Coliscan Easygel media and supervised me in her science lab; Mom and friendasisted with cutting out things for my board; Dad found an article that was relevant to my project.
CALIFORNIA STATE SCIENCE FAIR2007 PROJECT SUMMARY
Ap2/07
Name(s) Project Number
Project Title
Abstract
Summary Statement
Help Received
Andrew R. Silveira
Here Comes the Sun
J1837
Objectives/GoalsMy objective was to get an understanding of which sunscreens are most effective against ultravioletradiation.
Methods/MaterialsI used a UV detector to detect how many UV rays. First, i applied the suscreen on the detector to see howmany rays the sunscreen blocked. After I tested all the sunscreens without water submersion, I then testedall the sunscreens with water submersion to see how many rays they bocked after being in cotact withwater.
ResultsI found that most of the sunscrees blocked about thesame amount of UVA rays, while after watersubmersion all the sunscreens were less effective. After the water submersion I found that the sunsreensblocked ten less than without water submersion.
Conclusions/DiscussionI concluded most of the sunscreens were effective in blocking UVA rays. But, because most sunscreensblocked less with water submersion, I concluded that most sunscreens are not waterproof.
Which sunscreens block the most ultraviolet ?
My dad helped me reord some of the data in my logbook.

CALIFORNIA STATE SCIENCE FAIR2007 PROJECT SUMMARY
Ap2/07
Name(s) Project Number
Project Title
Abstract
Summary Statement
Help Received
Reba M. Smith
Hot or Not
J1838
Objectives/GoalsMy objective was to find out if chewing mint-flavored gum, cinnamon-flavored gum and simply chewingwith nothing in your mouth would effect the temperature of your mouth.
Methods/MaterialsMaterials: 1. Big Red gum 2. Winter Fresh gum 3. Five volunteers 4. An oral termometer 5. Disposablethermometer covers. Methods: I had my volunteers not talk eat or drink for 30 minutes. Then I had themchew cinnamon gum for 5 minutes. Next I took their temperatures, asked how their mouth felt whilechewing and repeated these steps with the mint gum and no gum at all.
ResultsI discovered that the temperature of the subjects that chewed the cinnamon gum raised a total of 1.2degrees. The subjects who chewed the mint-flavored gum raised a total of 9.4 degrees. The subjects whojust simply chewed raised a total of 3.2 degrees. So I learned that the mint gum raised the temperaturemore than simply chewing and the lowest temperature change was with the cinnamon gum.
Conclusions/DiscussionMy hypothisis was somewhat correct I thought the mint would raise the temperature the most which it did.But suprisingly chewing nothing raised the temperature of my volunteers more than the cinnamon (Ithought the oppisite). Im my conclusion I stated that I believe the physical movement of a persons mouthwhile chewing is what causes the temperature to raise rather than the gum in their mouth. So if I had themall chew at the same rate I think my results/conclusion would be different.
My project is about finding if chewing different types of gum and simply chewing nothing will affect thetemperature of a persons mouth.
My mother helped with croping and taking pictures. Mrs. Pealattere (science teacher) helped me decidewhat to look for in background research.

CALIFORNIA STATE SCIENCE FAIR2007 PROJECT SUMMARY
Ap2/07
Name(s) Project Number
Project Title
Abstract
Summary Statement
Help Received
Nicole L. Sorace
S.O.S. Save Our Skin: Will Sunscreens with Higher SPF RatingsProvide More Protection from Solar Radiation?
J1839
Objectives/GoalsMy objective was to determine if sunscreens with different SPF ratings actually provide varyingprotection from solar radiation. I believe that sunscreens with higher SPF ratings will provide moreprotection from solar radiation.
Methods/MaterialsFour different SPF rated sunscreens of the same brand, baby oil, clear sheet protectors, and photographicpaper were the primary materials. I spread an equal amount of different rated sunscreens on equallydivided sections of a clear sheet protector. I also provided a control section and one section with baby oil.I slid a piece of photographic paper inside, and placed it in direct sunlight for a specific time period. Iconducted 3 different tests for each of 3 different time periods.
ResultsThe sunscreen that was rated SPF 45 gave better protection than the lower rated SPF sunscreens and thebaby oil. I discovered these results after developing the photographic paper and scanning each sheet into acomputer. Using Adobe Photoshop I tested the luminosity of each section, recorded and compared thereadings.
Conclusions/DiscussionSunscreens with higher SPF ratings did provide more protection from solar radiation than sunscreens withlower SPF ratings.
This project was to determine if there was varying protection from solar radiation between different SPFrated sunscreens.
My parents helped me to gather materials. My Dad showed me how to scan the photo sheets into hiscomputer and how to use the Adobe Photoshop program to get luminosity readings from each of thedifferent sections of the photo sheets.

CALIFORNIA STATE SCIENCE FAIR2007 PROJECT SUMMARY
Ap2/07
Name(s) Project Number
Project Title
Abstract
Summary Statement
Help Received
Gianna G. Spinosa
Crazy Candles!
J1840
Objectives/GoalsThe objective of my project was to determine which type of candle out of beeswax, paraffin, and soywould burn for the longest amount of time and produce the most light.
Methods/MaterialsI lit each candle, 2 beeswax, 2 paraffin, and 2 soy, one at a time, placed it in a plastic experiment tube, andstarted the timer. I then took light measurements with a light meter at 2, 5, and 30 minute intervals. Burntime and brightness were recorded.
ResultsThe soy candles burned for the longest amount of time, followed by paraffin and then beeswax. Thebeeswax candles burned the brightest, followed by paraffin and then soy.
Conclusions/DiscussionI originally thought that the paraffin candles would burn the brightest, and the soy candles would burn forthe longest amount of time. However, this was incorrect. I learned that the candles that burned thebrightest (beeswax) also burned the fastest, and the candles that burned the longest (soy) were also theleast bright. Therefore, either of these candles would be good to have in an emergency.
My project tested beeswax, paraffin, and soy candles to determine which one would burn for the longestamount of time and produce the most light.
My dad helped me light the candles, and my mom helped me arrange the backboard.

CALIFORNIA STATE SCIENCE FAIR2007 PROJECT SUMMARY
Ap2/07
Name(s) Project Number
Project Title
Abstract
Summary Statement
Help Received
Ashley Su
Ashley's Secret Formula
J1841
Objectives/GoalsMy mom sprays herself with a little of perfume everyday and she smells great. I am wondering whyperfume smells so soothing and which ingredient in the perfume causes it to smell differently? Can I makea new kind of perfume with a variety of scents and perhaps could change different moods (happy, thirsty,relaxation, concentration, or others) for preteens like me?
Methods/MaterialsThe procedures of this experiment are to analyze the ingredients of each kind of perfume oil, mix differenttypes of fragrance oil or add new ingredients together with different alcohol density to create a newmixture that would smell differently. The results are then recorded and analyzed.
ResultsThe three scents that I think that will benefit to a teen are for concentration, refreshment, and relaxation.After analyzing essential oils and other ingredients in details, I chose 10 different educational guesses ofmixtures for each targeted scent that I want. The total mixtures that I tried in this project are 30. My secretformulas are:
Formula # 1 (1.59% of Lavender, 3.17% of Bergamot, 86.7% of Alcohol, and 8.6% of Water), with asmell of floral, sweet, pure and feminine scent that makes me happy, is great for relaxation.
Formula # 15 (10.53% of Lavender, 5.26% of Bergamot, 5.26% of Ylang Ylang, 26.32% of Lemon Soda,47.89% of Alcohol, and 4.74% of Water) cleanses and refreshes whole body, plus a hint of lemon thatmakes me feel like I am going to have a wonderful day.
Formula # 10 (5.88% of Lavender, 5.88% of Lemon, 29.41% of Lemon Soda, 53.53% of Alcohol, and5.29% of Water) helps me to concentrate with a whiff of lemon, mint, pine trees, and flowers.
Conclusions/DiscussionMy hypothesis was that the scent in perfume can be altered and a new scent can be created. Theexperimental results support my hypothesis by producing different kinds of perfumes with new scentsmade by mixing or changing ingredients in perfume. The experiment also suggests that different peoplemight have various results with each mixture due to differences of body chemistry.
To make new kind of perfumes with a variety of scents that perhaps could change different moods (happy,thirsty, relaxation, concentration, or others) for preteens like me.
My mom helped me get all materials needed in this project; my dad assisted me brainstorm the ideas andlet me use his computer and printer to illustrate the results.

CALIFORNIA STATE SCIENCE FAIR2007 PROJECT SUMMARY
Ap2/07
Name(s) Project Number
Project Title
Abstract
Summary Statement
Help Received
Nishant Surapaneni
Friction Frenzy
J1842
Objectives/GoalsThe objectives of my project were to test which type of synthetic oil best preformed the job of reducingtemperature or friction on the pistons of a cars engine, which in my project is represented by gear pairs.
Methods/MaterialsMy method was to build a set of 10 gears, 2 for each of the five oils and run the m for 10 minuites withgoil ande see which one reduced the temperature the most from the benchmark of 157 degrees.Mymaterials were:10 gears, a steel box, 5 oils, a 1500 rpm engine, tools, plexiglass, and 2 5/16th's rods.
ResultsMy results stated that the american made Lucas oil best reduced oil to around 27 degrees lower and itpreformed the best in all the tests of further testing and popular demand.
Conclusions/DiscussionMy conclusion is that Lucas Oil preformed the best, and it was rated number 1 in my science fairexperiment
My project is about the best type of synthetic oil in regards to temperature reduction.
Father helped build rig, Mother and older sister helped in board and pitcures

CALIFORNIA STATE SCIENCE FAIR2007 PROJECT SUMMARY
Ap2/07
Name(s) Project Number
Project Title
Abstract
Summary Statement
Help Received
Dominic J. Thomas
Nail That Wood
J1843
Objectives/GoalsI chose the science project that I did because I have always been interested in building with wood andusing it. I figured that if I started doing tests on wood that I might find a lot of interesting facts about howwood works and how it could help me when I build with different types of wood. I also chose this projectbecause I like using hammers and hitting things with a hammer such as nails.
Methods/MaterialsMethods: The first procedure that I had to do was build a uniform hammering device, which allowed meto produce standerdized measurement samples. Then I started the testings of my four samples of fourdifferent types of wood. The tests included pounding seven nails, one at a time, into each of the foursamples of each wood type. I measured the results of each test in millimeters by first marking a nail in apilot hole and then hammering it three times and putting another mark to measure where the nail was afterthe pounding. In oder for me to measure the nails I had to pull them out and measure them from thebottom of each mark.
Materials: White Pine from Frost Hardwood Lumber; Red Oak from Frost Hardwood Lumber; BirchPlywood from Frost Hardwood Lumber; Sugar Maple from Frost Hardwood Lumber; 0.9 kilogramdrilling hammer from Home Depot; 2 pieces of scrap wood from Home Depot; 1 miter box from HomeDepot; A box of 1# nails from Dixieline; Ryobi power drill.
ResultsMy data shows that softwoods are easier to nail into than hardwoods. White Pine and Birch Plywood,softwoods, had a nail depth average less than Sugar Maple and Red Oak, hardwoods. My data also showsthat hardwoods are more likely to break because one of the Red Oak samples split during testing.
Conclusions/DiscussionAccording to my test results I know that the Birch Plywood was the easiest wood to hammer into becauseit was the softest wood out of the four different types. The plywood was the wood with the deepest naildepth average because it was the least dense wood that was tested by me. Even though I thought thatBirch Plywood would be the hardest to hammer through, I was wrong. Red Oak was the hardest wood tonail into because it was the densest type of wood that I tested. Because the Red Oak was so dense it wouldneed to take more than three hits with a 0.9 kilogram drilling hammer. This is why the average nail depthwas only 4.8 millimeters. These are the main reasons why I know my results are true.
Do different woods work differently with a certain type of nail?
Dad helped with getting wood and the device for hammering

CALIFORNIA STATE SCIENCE FAIR2007 PROJECT SUMMARY
Ap2/07
Name(s) Project Number
Project Title
Abstract
Summary Statement
Help Received
Bradley L. Tradonsky
Does Specific Protein Content and Quality in Hot Dogs Affect Price? Analysis of Nine Types
J1844
Objectives/GoalsThis study was designed to evaluate what types of proteins make up the protein content in differenthotdogs, and to see if variations in protein content and quality affect price.
Methods/MaterialsHotdogs were sliced, processed in an automated tissue processor, cut into thin sections on a microtome,placed on glass slides, stained and examined under a microscope. All protein seen was marked on theslides by covering the protein with dots using Sharpie pens. Each protein type was dotted with a differentcolor pen. The total number of dots on each slide was counted to evaluate total protein content. Then eachof the different colored dots, representing each of the different types of protein, was tallied individually.The percentage of each protein type was calculated. The price per unit weight of each type of hotdogstudied was obtained from a major supermarket chain. Results were graphed and compared.
ResultsThe types and quality of proteins present varied in each of the nine types of hotdogs as did the percentageof each protein component. Six different types of protein were identified : skeletal muscle (pure beef),collagen, blood vessels, bone, cartilage and nerve. Skeletal muscle, collagen and blood vessel were foundin all nine hotdogs tested, bone and nerve in seven and cartilage in three. The price of the hotdogs variedfrom 21.8 to 39.9 cents per 30 grams. Price was not directly related to the types, quality or amounts ofprotein present.
Conclusions/DiscussionThere are two major aspects of protein quality - nutritional, which is objective, based on the amino-acidsequences present, and "eating quality" which is subjective, involving factors such as taste and texture asperceived by the consumer. Skeletal muscle is the highest quality of all six proteins in this study,objectively and subjectively. Bone and cartilage which are not well absorbed are the poorest. Sincemonetary value of a protein is determined by it's quality hotdogs with the most skeletal muscle and theleast bone and cartilage are expected to be more expensive than those with less muscle and more bone andcartilage. The results of this study show that the different proteins used in different hotdogs do not directlydetermine price. Factors such as marketing and brand recognition appear to play an additional role.
Nine different types of beef franks were examined microscopically to evaluate their protein content and todetermine wether variations in protein quality affect sales price.
Hotdogs were processed for microscopic evaluation in the anatomic/surgical pathology department ofGrossmont Hospital,La Mesa, CA, under the supervision of Dr. Sharon Mair.

CALIFORNIA STATE SCIENCE FAIR2007 PROJECT SUMMARY
Ap2/07
Name(s) Project Number
Project Title
Abstract
Summary Statement
Help Received
Cambria L. Ullrich
The Better Ball: A Comparison between the Titleist ProV1 and TitleistDT So-Lo Golf Balls
J1845
Objectives/GoalsMy project was to see if the repetitive impact of a 10 degree Titanium Driverwould knock the Titleist DT So-Lo golf ball out of balance more quickly thanthe Titleist Pro V1 golf ball. My hypothesis is that I believe that the Titleist DT So-Lo golf ball will go out of balance more quickly than the Titleist Pro V1 golf ball.
Methods/MaterialsI took ten Titleist Pro V1 and Titleist DT So-Lo golf balls. I then numbered the balls 1-10. Then I weighed and measured each ball and rolled them each ten times down a ramp onto an artificial putting green. I then hit ball number one10 times, I hit ball number two 20 times and each successive ball 10 more times than the preceding ball until I hit ball number ten 100 times. I then reweighed and remeasured each ball to see if there was a change in mass or diameter. I then rolled each ball ten times down a ramp onto an artificial putting green onto a chalk line to see if they would roll straight.
ResultsI found that after the repetitive striking of the golf balls, the Titleist Pro V1 golf balls stayed in balance longer than the Titleist DT So-Lo golf balls.
Conclusions/DiscussionI discovered that the Titleist Pro V1 golf balls would stay in balance longer than the Titleist DT So-Lo golf balls. This proves that my hypothesis was correct, and that pricemakes a difference in the performance of the golf balls. Titleist makes the Pro V1 balls $44.00 while theDT So-Lo balls are only $29.00, this states that it may be more useful to spend a little bit more on the golfball you use because you might get a better result.
I tested two popular Titlest golf balls to see if the repetitive impact of a 10 degree titanium driver wouldknock either ball out of balance.
Dad helped with the golf ball hitting machine and the greens.

CALIFORNIA STATE SCIENCE FAIR2007 PROJECT SUMMARY
Ap2/07
Name(s) Project Number
Project Title
Abstract
Summary Statement
Help Received
Luke D. Van Houten
Effectiveness of Moisturizers and Sunblocks in Filtering UVA Rays
J1846
Objectives/GoalsIt is widely agreed that sunblocks do a relatively effective job of blocking UVB rays which are ultravioletrays that cause sunburn as well as skin damage, and potentially, skin cancer. UVA rays also contribute tothe development of skin cancer and play a larger role than UVB rays in the creation of wrinkles andpremature aging. The FDA has no accepted test for measuring UVA protection. The SPF (sun protectionfactor) does not correlate to UVA ray exposure. As a result, there may be a wide variance in theeffectiveness of sunblocks and moisturizers in protection against UVA rays. The goal of my experimentwas to determine the range of effectiveness in filtering UVA rays for various moisturizers and sunblocks.My hypothesis was that there would be significant differences in the range of UVA protection provided bymoisturizers and sunblocks with the same SPF ratings.
Methods/MaterialsI constructed a device from a box for the purpose of viewing results. I used UVA detecting beads whose"colors" become visible to the human eye when exposed to UVA light, especially at about 365 nm. Icoated one side of a sheet of acrylic plastic evenly with 15ml of the moisturizer/sunblock substance thatwas being tested. I placed the acrylic with sunblock on the top of the box and took it outside. I started theminute timer, and then recorded results. I preformed six repetitions of the entire experiment for all testmoisturizers/ sunblock. I assigned ranking numbers 1-10 to the bead colors, since I noted the beadsrequired different amounts of UVA exposure to "change" color.
ResultsThe most protective moisturizer I tested, "Anthelios", was even more effective in filtering UVA rays thanthe SPF 15 sunblock. Olay SPF 15 moisturizer was not as effective, but appeared to also be a good UVAfilter. L'Oreal and Purpose however, were far less protective than the other products.
Conclusions/DiscussionThe amount of UVA protection offered by products with the same SPF rating varied widely. The publicassumes since the SPF ratings are the same, the total sun protection offered will be the same in theseproducts. Unfortunately, the amount of protection provided is not equal.
This Project investigated whether products with the same SPF (UVB) rating were also equally UVAprotective and found UVA protection varied widely.
Thanks to my parents who helped me purchase supplies and my science teacher who helped edit myreport.

CALIFORNIA STATE SCIENCE FAIR2007 PROJECT SUMMARY
Ap2/07
Name(s) Project Number
Project Title
Abstract
Summary Statement
Help Received
Laura M. Van Voorhis
Proof of Waterproof: Quantifying UVA Penetration of Water-ExposedSunscreen
J1847
Objectives/GoalsI have noticed that after I go swimming I sometimes get sunburned. I wear sunscreen whenever I swim. Iwondered if the types of sunscreens I wore made a difference in how my skin burned. I wanted to know ifwaterproof sunscreens would still be protective after being soaked in water for 30 minutes. I wonderedhow waterproof sunscreens would compare to ordinary sunscreens. My hypothesis was that after waterexposure, waterproof sunscreens would be more effective in blocking UVA rays than ordinary sunscreens.
Methods/MaterialsI obtained bead containers 3.2 centimeters in diameter. I spread 0.5 grams of sunscreen on each case. Itested Aveeno waterproof sunscreen SPF 30, Banana Boat waterproof sunscreen SPF 30, Neutrogenasunscreen SPF 30, Coppertone sunscreen SPF 30, and a container with no sunscreen (the control). I placedred UVA sensitive beads inside each container. I used three different bead containers for each sunscreentype. Each container stayed under a black light (which I switched on and off remotely), for time intervalsof one minute, 3 minutes, and 5 minutes. I placed the bead containers in a plastic tub filled with water for30 minutes. I removed the containers and placed them under the black light for each time interval: oneminute, 3 minutes, and 5 minutes. I took images both before and after water exposure. I uploaded thepictures onto my computer. Using a formula I created based on RGB color values, I evaluated how redeach bead was (how far away its color was from white). I repeated the entire experiment. I performed atotal of 60 tests and assessed 240 bead values which I scored according to the formula I created usingRGB color ratings.
ResultsI found Aveeno waterproof sunscreen most effective in blocking UVA rays. Consistently, the beadsremained nearly white. In contrast, the Banana Boat waterproof sunscreen produced the reddest (darkest)beads in nearly all the trials. Coppertone and Neutrogena sunscreens "chipped" while underwater, andUVA light was able to reach the beads.
Conclusions/DiscussionAccording to my results, "Aveeno" waterproof sunscreen was most effective in blocking UVA rays.Although the sunscreens were tested on an acrylic surface rather than skin, in this experiment, ordinarysunscreens were more protective than the other brand of waterproof sunscreen tested, "Banana Boat".
My project compared the protectiveness of ordinary sunscreens to waterproof sunscreens through the useof UVA sensitive beads and a formula I created using RGB color value.
Father took bead containers out from under UVA light source.

CALIFORNIA STATE SCIENCE FAIR2007 PROJECT SUMMARY
Ap2/07
Name(s) Project Number
Project Title
Abstract
Summary Statement
Help Received
Patti R. Wassem
How Does the Brand of Popcorn Affect the Amount of PopcornPopped?
J1848
Objectives/GoalsMy goal with my project was to find out which microwaveable popcorn brandsproduced the highest percentage of popped kernals.
Methods/MaterialsI popped thirty varying brands and types(buttered and unbuttered) of microwaveable popcorn and thencounted the number of popped kernals and unpopped kernals in each bag. I used a Sharp CarouselMicrowave Oven on the Popcorn Setting for each bag. I used 5 Orville Redenbacher buttered and 5unbuttered bags; 5 ACT II buttered and 5 unbuttered bags; and 5 Ralph's Brandbuttered and 5 unbuttered bags.
ResultsOverall, the buttered popcorn produced a higher percentage of popped kernals for most of thebrands(except for Orville Redenbacher's where the average for the buttered(88.5%) andunbuttered(89.5%) was very close). The highest average of popped kernals among the buttered popcornwas the ACT II(95.2%) followed by Orville Redencbacher's(88.52%) and Ralphs(79.3%). The highestaverage of popped kernals for the unbuttered popcorn was the Orville Redenbacher's(89.5%) followed byRalphs(75.5%) and ACT II(67.6%).
Conclusions/DiscussionThe data I found shows that the buttered popcorn bags produced the higher percentage of popped kernals. I think that the oil from the butter produced heat, so more kernals popped with it. If I could continue thisexperiment, I would investigate how the butter affects how the popcorn pops.
My project evaluates differing brands and types of microwaveable popcorn as to theirpopability(percentage of kernals popped).
My Father took the photographs for my project.

CALIFORNIA STATE SCIENCE FAIR2007 PROJECT SUMMARY
Ap2/07
Name(s) Project Number
Project Title
Abstract
Summary Statement
Help Received
Christopher W. Weddington
Drip Emitter Performance
J1849
Objectives/GoalsThe objective is to determine if the 2004 field emitters used on our farm still perform well in water outputand uniformity. New emitters from 2005 and 2006 were also tested. All three sets of emitters werecompared against industry standards for water output in gallons per hour (gph) and uniformity (coefficientof variation, CV).
Methods/Materials25 in-line emitters in 4 inch segments from each of 2004, 2005,and 2006 years were connected in seriesand attached to a water supply system. Individual emitter water output was collected in graduatedcylinders for 4 minutes, at a pressure of 20 pounds per square inch. The gph and CV were calculated.Results were compared to industry standards.
ResultsAll emitters delivered water output less than the manufacturer published standard. Used 2004 emitters hadthe lowest gph. New 2006 emitters, and used 2004 emitters, were uniform. New 2005 emitters were notuniform. None of the emitters rated excellent according to the industry standard CV rating system.
Conclusions/DiscussionThe used emitters had the lowest water output, but it is still acceptable and the farmer can irrigate longerto compensate. The used emitters had good uniformity and did not need to be replaced. Results showedthere is too much variability in the new emitters, indicating a need for better quality control in themanufacturing process.
Used and new drip emitter performance is evaluated and compared to industry standards.
Used university lab equipment under supervision of parents. Mother reviewed mathematical calculations.

CALIFORNIA STATE SCIENCE FAIR2007 PROJECT SUMMARY
Ap2/07
Name(s) Project Number
Project Title
Abstract
Summary Statement
Help Received
Ruth Wong
Comparison of Vegetables' Shelf Life in Different Kinds of Bags
J1850
Objectives/GoalsThe objective is to investigate which grocery storage bags have the best shelf life of vegetable inrefrigerator.
Methods/MaterialsA stalk of broccoli was cut into five crowns. Each crown was placed in the Ziploc Freezer bag, GladStorage Double Lock Zipper Bag, brown paper bag and plastic produced bag. The control has no bag.Repeat the same thing with baby bok choy, except that each stalk was taken from the bundle and placedinto each different storage bag. Weigh all the samples before storing them in the refrigerator crisper at40F. Observed the samples and weigh each of the samples. Record my observations to see how thevegetables begin to change color or wilt over time. Repeat this experiment the second time.
ResultsAll the samples A and B of the broccoli and the baby bok choy in the brown paper bags and all thecontrols started to wilt on Day 3 in both set of experiments, but the samples in the grocery plastic bagsstarted to wilt on Day 16. The broccoli in the Ziploc Freezer bags began to wilt on Day 24, and in GladStorage bags on Day 22 in both sets of the experiments. The baby bok choy in the Ziploc Freezer Bagsand the Glad Storage bags started to wilt on Day 17. Both broccoli and baby bok choy in Ziploc Freezerbag didn't lost much moisture because there wasn't much weight lost as compared to the other samples.
Conclusions/DiscussionZiploc Freezer Bag is the most effective in extending the shelf life of broccoli and has the least moisturelost.
Vegetable shelf life varied greatly in different kinds of storage bags, and Ziploc Freezer yields the bestresult at 40F.
Mother guided in recording journal and buying the products used in the experiment.