job skill requirements: levels and trends
TRANSCRIPT

WORKING PAPER SERIES
400 Main Street, E19-733, Cambridge, MA 02139
Job Skill Requirements: Levels and Trends
Michael J. [email protected]
MIT Work of the Future Working Paper 02-2020
April 1, 2020

Job Skill Requirements: Levels and Trends
Michael J. Handel1 January 15, 2020
High levels of inequality accompanied by changes in technology, employment relations, and the
global division of labor have raised significant concerns regarding the future of work. The most
extreme scenarios argue that explosive growth in the power and scope of artificial intelligence
(AI) and automation imply fundamental occupational change and possible mass unemployment
in the near- or medium-term (Frey and Osborn 2017). Even those who do not believe
technological change will be so rapid or sweeping are concerned that job skill requirements are
increasing so quickly or poised to do so that many people are at risk of being shut out of the
workforce. The prospect of unusually rapid skill-biased technological change (SBTC) in the
future has generated such interest that research is no longer confined to academics and policy
analysts, as various consulting and business-related think tanks regularly weigh in with reports
on the implications of artificial intelligence for work in the future. The subject is now a staple of
media coverage, public polling, and popular conversation, as well as academic research.
In fact, this is the most recent iteration of a longstanding concern regarding the pace of change
in skill demand that began nearly forty years ago when the emerging technology was
microcomputers, whose introduction coincided with a deep recession, growing wage inequality,
and concerns over educational quality. An earlier wave of concern in the late 1950s-early 1960s
coincided with the introduction of mainframe computers, electronic data processing, factory
automation, and the launch of Sputnik, and framed the discussion in often surprisingly similar
terms, including fears of mass unemployment especially among the less-skilled. A presidential
commission on automation chaired by economist Robert Solow concluded in its report issued in
1965 concluding that slow economic growth had a far a more powerful influence on the
unemployment rate than technological change. However, concern over automation was already
receding by the time the report appeared, as robust economic growth resumed. A few years later
the acceleration of growth in the late 1960s brought the rise in employment predicted by the

2
report, which effectively ended that wave of the debate over technological unemployment
(Handel 2003b, p.6). An even earlier wave of concern with joblessness during the late 1920s and
into the Great Depression, prompted by new technology, mass production, and unprecedented
productivity growth, also ended with the recovery of the macroeconomy.2 None of these cases
are proof that current concerns are ill-founded, but they do provide perspective and cautionary
lessons.
The past ten years are notable because yet again there was a combination of significant
technological advance and poor macroeconomic conditions, in this case caused by the most
severe financial crisis since the Great Depression. Again, some economists argued that
subsequent weak employment growth reflected rising structural unemployment, as job skill
requirements raced ahead of worker capacities. This skills mismatch view was dispelled in favor
of cyclical explanations after research identified weak economic growth as the culprit, as in the
past (Lazear and Spletzer 2012; Rothstein 2012, 2017; Levine 2013; Abraham 2015; Cappelli
2015). Indeed, as the economy continued to grow, albeit slowly, total employment increased to
more than 152 million workers in November 2019, surpassing its pre-recession peak of 138
million (2007) by more than 10%.3 The employment-to-population ratio for workers age 25-54
also reached 80.3% in November 2019, matching the brief pre-recession maximum in January
2007 and exceeding all previous values since 1948 except for five years during the late 1990s
boom (July 1996-July 2001).4 Instead of mass unemployment, there are more jobs today than
ever. Likewise, slower productivity growth in the past ten years is at odds with the dominant
narrative regarding the rapidity of recent technological change.5 In short, history and recent
experience indicate a common tendency to overestimate the implications of new technologies
and to overinterpret cyclical movements as secular trends, which current views of the future may
risk repeating.
The record of aggregate job growth raises the question of whether there is cause for concern
regarding the kinds of jobs that are being created and may be available in the future. With
respect to job skill demands, while the future is unknowable in a literal sense, empirical research
on levels and changes in job skill requirements offers some perspective, including basic
information on magnitudes. It is commonly believed that the demand for skills at work has
recently been growing much more rapidly than in the past or soon will be, and that the rapid
diffusion of information and communication technologies (ICT) is a major reason for
accelerating change in the nature of work (e.g., Hassett and Strain 2016). However, the available
evidence tells a more complicated story.
2 A brief review of the history of automation debates can be found in Handel (2003b, pp.4ff.).
3 See Appendix 1, Figure A1.1 and Figure A1.2. For the equally notable trend in annual total hours worked, see
https://fred.stlouisfed.org/series/B4701C0A222NBEA. 4 See Appendix 1, Figure A1.3 and Figure A1.4.
5 See Appendix 1, Figure A1.5 and Figure A1.6.

3
Job skill requirements are numerous and varied, and measurement of their levels remains
unstandardized, so there is significant room for alternative approaches to understanding skill
change. While the direction of trends has been a focus of research, there is much less
understanding of the rate and magnitude of the changes and their timing. The notion that ICT
has led to an acceleration in the rate of change is much discussed but also has received little
systematic investigation.6 In fact, the research literature contains no discussion or consideration
of what would count as rapid or gradual skill change. The claim that change has been
accelerating in response to the ICT revolution since 1980 can only be evaluated with respect to
long historical time series, which can also offer some guidance regarding the plausibility of the
idea that the economy is poised for an even sharper acceleration with the maturation of AI
applications.
The first section of this paper discusses conceptual and data issues. The second section describes
current levels of job skill requirements, for which recent data is particularly rich. The third
section presents evidence on overall trends in job skill requirements, mostly from other advanced
economies, and evidence on trends related to changes in the occupational composition of the
workforce, mostly from the United States. A final section concludes. In this paper, existing
evidence is examined to provide an understanding of historical trends and current levels, and a
frame of reference for evaluating predictions regarding future changes in job skill requirements.
6 For an exception, see Mishel and Bernstein (1998).

4
I. Background
Despite decades of research, policy interest, and debate, and a certain amount of progress,
significant issues remain in the conceptualization and measurement of job skill requirements, and
sources of data remain relatively sparse. These issues are discussed briefly below to provide
context for the review of research results that follows.
A. Conceptual map of the skills domain
The concept of “skill” has been subject to varying definitions and specifications. For present
purposes, “skill” is used to refer to technical task requirements that are necessary for effective
performance of jobs. The focus here is the skills required by jobs, as opposed to the skills
possessed by workers, which may differ in quantity and kind from those required by jobs, i.e.,
the focus is on labor demand rather than supply-side issues. In the language of job analysis,
studies discussed in this review use data that “rate the job, not the person” that holds the job.
Concepts related to skills, such as knowledge and abilities, are included under the term “skills”
here for purposes of convenience.
The skills required by jobs are diverse and multidimensional, leading to various category
schemes to render them tractable. The Dictionary of Occupational Titles (DOT) (Miller et al.
1980) introduced an influential classification of skills according to their level of involvement
with Data, People, and Things, equivalently cognitive, interpersonal (or interactive), and manual
(or physical) skills. This scheme has been validated formally numerous times and has proved
very useful as a broad orienting device in thinking about the changing nature of work. Although
many other broad skill categories can be elaborated, such as management skills and technology
competencies, this three-fold scheme remains remarkably compact and effective, at least as an
initial step in specifying the substantive meaning of the concept of skill. Even research on
routine-biased technological change uses these categories bisected by the routine/non-routine
distinction (Autor, Levy, and Murnane 2003). Cognitive skills usually receive most attention,
have the most robust wage premiums in wage regressions, and are most closely related to
education, which has featured centrally in the skills debate. However, interpersonal skills have
received more attention recently, while manual skills continue to receive less attention than they
might deserve.
Interpersonal job requirements, often termed “soft skills,” have proven among the most difficult
to measure or even specify rigorously in any detail. Even at the most basic level, this domain is
weakly conceptualized. The literature on interpersonal skills includes various aspects of dealing
with the public, such as communication skills, courtesy and friendliness, service orientation,
caring, empathy, counselling, selling skills, persuasion and negotiation, and, less commonly,
assertiveness, aggressiveness, and even hostility, at least in adversarial dealings with
organizational outsiders (e.g. police, bill collectors, lawyers, businessmen). If managing others
and interacting with co-workers is included, the list would also include leadership, cooperation,
teamwork skills, and mentoring skills. These elements seem qualitatively diverse, rather than

5
different levels of a single, higher-order trait. Many could be considered ancillary job
characteristics, which, while often useful, are exercised at the discretion of the employee, rather
than job or employer requirements. Often it is not easy to separate interpersonal skills from more
purely attitudinal and motivational aspects of work orientations (Moss and Tilly 2001). Some
job requirements, such as the need for attention to detail, may even be considered a hybrid of
attitudinal/motivational and cognitive demands.
Everyone recognizes jobs vary in the extent to which they require involve interactive skills.
However, nearly all jobs involve getting along with others and some kind of behaviors that could
be called some kind of “teamwork.” Consequently, when workers or managers answer questions
posed in very general terms the vast majority affirm that interpersonal skills are very important,
almost regardless of the job. These near-uniformly high ratings of the importance of
interpersonal skills are probably artificial, in contrast to ratings of the same job characteristic by
trained analysts.
By contrast, the measurement of manual job skill requirements has tended to be neglected
altogether. One can make a broad distinction between simple and more complex physical tasks.
Simple tasks include gross physical exertion (e.g. carrying heavy loads), elementary movements
(e.g. sorting mail), use of simple tools or equipment, and machine tending. Tracking these kinds
of physical demands is important because declining prevalence could be taken as a sign of
progress, but also an indicator of declining opportunities for low-skilled workers. In addition,
declining intensity of physical effort within blue-collar occupations is one implication of theories
of technological change. If automation, or more advanced mechanization, were growing rapidly
one would expect this to be indicated by declining numbers of physically demanding jobs or
declining physical demands within jobs.
In contrast to physical effort, more complex physical tasks, associated most closely with skilled
trades, require more training, experience, and background knowledge regarding the properties of
physical materials, mechanical processes, and natural laws. SBTC theories contain no
unambiguous predictions regarding these tasks, but they are important to track because they are
important sources of good jobs for non-college educated workers.
This leaves cognitive skill requirements as the best-measured domain and the focus of greatest
attention. Cognitive skills can be distinguished according to three dimensions: (1) level of
complexity, which in some cases can be associated with curricula at different levels of schooling
in many cases; (2) type of skill, such as different fields of study, and (3) the extent to which the
skills are applicable to a wide range of jobs (transversal) or are more occupation-specific.
Finally, the major sources of skill acquisition (e.g., schooling, workplace, general life
experience) represent a fourth dimension for understanding the different kinds of cognitive skills.
Figure 1 provides a conceptual map of the cognitive skills domain that distinguishes between
three levels of complexity on axis 1, different categories of skills on axis 2, the generality vs.
specificity of skills on axis 3, and the predominant sources of skill formation on axis 4. The cell

6
entries illustrate the kinds of skills that are at the intersection of different categories.7 Note that
the vertical list of skills in the dark orange ovals is not meant to correspond to the hierarchy of
complexity indicated by axis 1. All or most of the skills listed (e.g., math, writing) may be
required at high, medium, and low levels of complexity in different jobs.
For example, column (a) shows general academic skills used on the job (reading, writing,
quantitative, general knowledge). These skills vary in complexity and may be acquired through
schooling at different levels, as well as through general life experience and performing job tasks
themselves. Another category of general skills, shown in column (b), include analytical skills,
problem solving, trainability, and learning how to learn, which are less strongly tied to specific
school curricula but are expected to be learned as a by-product of most specific subject-matter
instruction.
Figure 1: Conceptual map of cognitive skills
By contrast, column (c) presents a wide variety of more or less occupation-specific skills that
also vary in their type and level of complexity. These include high-level bodies of knowledge
that are associated almost exclusively with tertiary education, such as STEM skills or the
knowledge typically associated with other managerial, professional, and associate professional
7 This figure is reproduced from “Implications of ICTs for jobs, skills, and education,” Michael J. Handel,
unpublished background paper commissioned for the World Bank’s World Development Report 2018 (December
2017). An earlier version and discussion appeared in Accounting for Mismatch in Low- and Middle-Income
Countries (2016) by Michael J. Handel, Alexandria Valerio, and Maria Laura Sánchez Puerta (Washington, DC:
World Bank).

7
occupations.8 Less complex bodies of knowledge are associated with skilled trades, higher
clerical occupations, and some technical jobs, are often acquired outside four-year tertiary
institutions, such as two-year colleges, secondary schools, TVET9, apprenticeships, learning-by-
doing, and on-the-job training (OJT).
Finally, the fourth column contains other skills that may vary in their general applicability but do
not comprise formal bodies of knowledge, which includes discrete skills such as knowledge of
office procedures, specific tools and equipment, and particular kinds of computer software.
These narrow job skills may be learned in academic settings but are more frequently learned
through the workplace or TVET. Needless to say, both broad bodies of knowledge and most
narrow job skills presuppose a solid grasp of the foundation skills in the first two columns, such
as literacy, numeracy, and general reasoning ability. Indeed, an emerging research consensus
suggests that early success in acquiring foundation skills is essential for effective acquisition of
more job-focused knowledge and skills later in life (Heckman 2006). The OECD’s PIAAC
programme10
considers performance at Level 2 and above on their literacy assessments to be
necessary to take full advantage of opportunities for further learning and training. Foundation
skills will remain essential despite changes in the workplace that might affect the relevance of
certain narrow job skills. Although many believe workers’ use of computer technology alters job
skill requirements substantially, for most jobs outside ICT occupations themselves new
technology may well represent a relatively incremental change in narrow job skill demands.
However, ICT use on the job may contribute to the challenges faced by those with very weak
foundation skills, who may have difficulty with the literacy demands and the abstract
representation of files and functions, and even using a keyboard effectively.
These four categories represent a comprehensive map of the cognitive skills domain, which any
skills measurement strategy should aim to cover as fully as possible. Key facets of the full Data-
People-Things schema can be illustrated as below:
Cognitive skills: required level of education, reading, writing, math,
scientific/technical knowledge, general reasoning or problem-solving skills, ICT
skills
Interpersonal skills: managing people, team decision making, formal presentations,
teaching/training, customer service, caring labor
Manual skills: levels of physical effort, kinds of physical activities (e.g., standing,
lifting, carrying), using tools, materials, machinery, and equipment at varying levels
of technical complexity
8 STEM = science, technology, engineering, and mathematics occupations or educational curricula.
9 TVET = technical and vocational education and training
10 PIAAC = Programme for the International Assessment of Adult Competencies

8
A portrait of job skill requirements in the economy overall would aim for systematic coverage or
a rational sampling of facets from all of these constructs, rather than an ad hoc approach to
operationalizing skill requirements.
B. Measuring job skill requirements in practice
In practice, while a systematic approach to skill measurement covers all facets of this complex
concept, no survey or measurement instrument can capture “all” of the skills involved in any
particular job. In addition to the great diversity of job skill requirements, skills can be specified
in potentially infinite level of detail (Kusterer 1978). The O*NET skills database produced by
the U.S. Department of Labor contains over 19,500 task statements uniquely linked to nearly
1,000 occupations, in addition to the main body of worker survey data with several hundred
standardized variables. The number of task statements averages 20 per occupation (author’s
calculation), which is far fewer than found in task inventories used by industrial/organizations
psychologists to perform job analyses for individual jobs or found in the detailed competency
guidelines issued by sector skills standards boards.11
The database produced by Burning Glass
has identified and extracted over 16,000 skill keywords from its corpus of online job postings.
Many of the O*NET and Burning Glass tasks are a small sampling of key discrete job elements
represented in column 4 of Figure 1.
As will be discussed further, one challenge with this kind of granular information is that it tends
to be more occupation-specific and qualitative, which makes it difficult to construct a profile of
the economy’s skill requirements in terms of a tractable number of common scales. There are
myriad skills (e.g., administering intravenous drugs, calculating net present values, operating a
pneumatic jackhammer), each of which are applicable to small subgroups and are qualitatively
diverse. Nevertheless, even with respect to transversal job skills there is no standard
classification or coding scheme that is comparable to standard occupational and industrial
classification systems. Consequently, researchers have often relied on relatively coarse or
indirect measures of job skill requirements.
Occupational title is one of the most common and widely available indicators of job content. It
is a readily interpreted description of the kind of work performed, at least at a general level. It is
also available across various kinds of data sets and in probably the longest available time series.
A disadvantage is that occupation is a holistic concept because it refers to an indeterminate
bundle of different kinds of required job skills (e.g., required education level, reading, math),
rather than any particular skill(s) used on the job. Detailed occupation is essentially a nominal
variable, so any kind of scoring system must be derived from other sources. If occupation is to
be used on its own, without scoring, then detailed occupations must be collapsed, typically into
2-10 very broad occupations, to make analyses tractable, at the cost of losing information. Even
11
See Juan I. Sanchez and Edward L. Levine, “The Analysis of Work in the 20th
and 21st Centuries,” pp.80f., in
Handbook of Industrial, Work & Organizational Psychology: Volume 1, Neil Anderson et al., eds.(2001)
(Thousand Oaks, CA: SAGE).

9
at this high level of aggregation, changes in occupational coding schemes can create difficulties
for long time series analysis.
Detailed occupations can be scored using mean wage by occupation as a summary measure of
job skill but it is both holistic and indirect. Wages do not measure any specific skill
requirements and may pick up other sources of variation besides skill requirements, such as the
gender composition of occupations, wage norms, the macroeconomic environment, rent-sharing,
labor market segmentation, worker bargaining power, and institutions like unions and the
minimum wage. For example, if the pay for blue-collar operative jobs in manufacturing falls
near the middle of the wage distribution because the workers are unionized, one would conclude
that the jobs require middle-level skills. If wages fell due to deunionization but the number of
people performing the tasks remains unchanged, one might conclude that the number of middle-
skill jobs declined even when this was not the case. Finally, mean wages cannot be used as a
skill proxy in analyses of the effect of job skill requirements on wages because the predictor is
not defined independently from the response variable.
An alternative is to score detailed occupations using mean education. Like wages, workers
education by detailed occupation is available for a long time series, which is desirable for
understanding trends.12
However, mean education is also holistic because it does not measure
any specific skill requirements, and it is indirect because it measures worker characteristics
rather than the character of job tasks. Indeed, surveys indicate significant numbers of workers
consider their job requires a level of education different from their own (Quintini 2014). This
may be because education is used as a credential, signal, or screen that regulates access to jobs
on the basis of other characteristics, such as motivation or relative rank in the labor quality
queue. Economists increasingly recognize that workers’ education levels reflect personality
traits (e.g., grit, perseverance) and social and cultural capital in addition to technical skills or
human capital (Heckman and Rubinstein 2001). Finally, education levels have been rising
broadly over a long period for many reasons other than changing job demands. Even within
demonstrably less-skilled and slowly changing occupations, such as taxi driver, it has been
shown that mean education levels rose in tandem with general education levels (Handel 2000).
For these reasons, workers’ own education is not a clean proxy for the required education of jobs
or other skill requirements; it is worker-side, not a job-side measure.
Ultimately, the best measures of skill requirements are those that measure job task content
directly and in some detail. However, unlike occupation, wages, and education, direct measures
of job task content are quite scarce. There are no long time series of repeated measures for job
skill requirements for the United States and only a very small number for other countries.
The two most commonly used databases are the Dictionary of Occupational Titles and its
successor, the Occupational Information Network (O*NET), both produced by Employment and
Training Administration (ETA) of the U.S. Department of Labor to help state employment
12
This leaves aside the complications for trend analyses resulting from changes in occupation and education coding
over time.
10
services match unemployed workers to new jobs and provide career counselling to job-changers,
students, and other new entrants to the job market.
The DOT, which originated the Data-People-Things framework, used trained job analysts, who
observed and interviewed workers, supervisors, and managers during brief field visits to work
sites. They produced numerical skill scores, which academic researchers crosswalked to detailed
occupational codes in the Current Population Survey (CPS) and Decennial Census.13
The use of
expert raters and on-site observations avoided many of the problems associated with self-
reporting. Nevertheless, many DOT measures did not correspond to obvious, unambiguous, or
concrete concepts, and the different levels of some scales are not even clearly ordinal (Exhibit 1,
top panel) (U.S. Department of Labor 1991, pp.3-1). The costliness of the field visits precluded
replication, so DOT 1977 ratings only received a single, partial update in 1991. Consequently,
DOT scores are essentially cross-sectional, reflecting conditions in the late 1960s-mid-1970s;
there is no real time series. Nearly all trend analyses of changing job skill requirements using the
DOT reflect changes in the sizes of detailed occupations over time; they is little or no
information on changes in job content within detailed occupations.
After 2000, the DOT was officially replaced by O*NET, which relies heavily on worker surveys
and involves no site visits by trained raters. The O*NET database is very large, covers many
dimensions of job requirements, and has been used extensively in academic research. Like the
DOT, the O*NET database contains mean skill ratings by detailed occupation, which permits
scores to be matched to labor force survey data, but precludes analyses of within-occupation
variation.14
However, many O*NET survey items are idiosyncratic, complex or multi-barreled, abstract, and
vague, which make them more difficult to interpret than desirable (see Exhibit 1, bottom panel).
Although many items have moderately strong predictive validity when correlated with wages,
the use of rating scales with indefinite referents means one can never be quite sure what O*NET
scores actually mean in terms of specific real-world tasks. If an occupation requires “estimating
skills” at level 3 and another occupation requires them at level 4, one cannot really explain how
the jobs differ concretely beyond the difference in scores themselves because the scores have no
definite external meaning.15
This is also true for standardized factor analytic scores constructed
from rating scales and other unit-free measures (e.g., Miller et al. 1980, pp.176ff.; Spenner 1990,
p.403). Any effort to understand how much skills have changed using these kinds of measures is
limited by the fact that it is not clear what is being quantified or how. Highly abstract or fuzzy
measures will distinguish between different kinds of jobs but they are not easily interpretable in
terms of their correspondence to concrete job characteristics because the scores have no inherent,
external, or objective meaning. Differences between scores only have meaning in terms of the
13
See Miller et al. (1980) for extensive background on the DOT. 14
See National Research Council (2010) for extensive background on O*NET. 15
See Handel 2016a for a detailed evaluation of O*NET measures.

11
1 2 3 4 5
NotImportant* Important
VeryImportant
ExtremelyImportant
SomewhatImportant
Exhibit 1. Examples of Skill Measures from the DOT and O*NET
Level of Complexity of Jobs' Relationship to Data, People, and Things a
(Dictionary of Occupational Titles)
Data People Things
0 Synthesizing 0 Mentoring 0 Setting Up 1 Coordinating 1 Negotiating 1 Precision Working
2 Analyzing 2 Instructing 2 Operating-Controlling
3 Compiling 3 Supervising 3 Driving-Operating
4 Computing 4 Diverting 4 Manipulating
5 Copying 5 Persuading 5 Tending
6 Comparing 6 Speaking-Signaling 6 Feeding-Off Bearing
7 Serving 7 Handling
8 Taking Instructions-Helping
Occupational Information Network (O*NET) b
5. Estimating the Quantifiable Characteristics of Products, Events, or Information
Estimating sizes, distances, and quantities; or determining time, costs, resources, or materials needed to perform a work activity.
A. How important is ESTIMATING THE QUANTIFIABLE CHARACTERISTICS
OF PRODUCTS, EVENTS, OR INFORMATION to the performance of your
current job?
* If you marked Not Important, skip LEVEL below and go on to the next activity.
B. What level of ESTIMATING THE QUANTIFIABLE CHARACTERISTICS OF
PRODUCTS, EVENTS, OR INFORMATION is needed to perform your current
job?
a. DOT codes with higher values indicate lower levels of job complexity. b. This item is from O*NET’s Generalized Work Activities questionnaire
(https://www.onetcenter.org/questionnaires.html)
1 2
3 4
5
Not Important* Important
Very Important
Extremely Important
Somewhat Important
Estimate the size ofhousehold furnishings
to be crated
Estimate the time requiredto evacuate a city in the
event of a major disaster
Estimate the amount ofnatural resources that lie
beneath the world’s oceans
Highest Level
1 2 3 4 5 6 7

12
scoring system; they do not refer to anything specific in the external world, so it will be difficult
to understand the differences between jobs or the magnitudes of trends in any more explicit
fashion.
Unlike the various editions of the DOT, O*NET is intended to be updated using random
probability samples and repeated measures. However, the rerating process is conducted on a
somewhat ad hoc basis over a long time frame and the occupational coding scheme changes in
ways that make time series or panel analysis difficult; using O*NET data to understand change
within occupations over time is not straightforward. O*NET skill ratings are intended primarily
for use by job seekers in career exploration and guidance, and to assist the Employment Service
in making job placement advice, rather than for academic research. Therefore, the program is
oriented mainly to producing a stand-alone database for current use; historical continuity with
previous editions is not a priority. The program does not track change over time itself. Senior
O*NET staff state clearly that the program is designed to generate cross-sectional measures and
has no mandate to produce panel data (Phil Lewis, National Center for O*NET Development,
personal communication).16
Both the DOT and O*NET were designed by ETA for the practical
purpose of helping job-seekers find work that matches their skills, rather than to monitor the state
of the economy or to generate historical or time series data. The U.S. Bureau of Labor Statistics
has had no formal connection to either program and collects no systematic statistics on changes
in job skill requirements.17
A few other countries also have databases measuring job skill requirements. The Canadian
government’s Essential Skills project used trained interviewers to collect information from
workers on the level of reading, writing, numeracy, ICT skills, interpersonal requirements, and
other skills required by their jobs between 1987 and 2009. The results were used to construct
mean skill scores for detailed occupations representing somewhat more than 80% of the
workforce.18
Like the DOT, constructing the job profiles was relatively complex and expensive
and the project was discontinued on practical grounds.
The British Skills and Employment Survey (SES) conducted by sociologists and economists has
administered seven waves between 1986 and 2017, though an important series of skill items is
available for only five waves beginning in 1997.19
The German Qualification and Career
16
With significant effort, O*NET editions can be pooled and analyzed as a panel, which is the subject of current
work by the author in collaboration with Richard B. Freeman and Ina Ganguli. 17
While the National Compensation Survey (NCS) contains skill scores that can be merged with standard data sets,
the survey design is complex and has been altered repeatedly; BLS recommends against viewing the NCS as
repeated measures data. 18
See, “What are Essential Skills?” (Human Resources and Skills Development Canada, 2009) and
https://www.canada.ca/en/employment-social-development/programs/essential-skills/tools/what-aresential-
skills.html. 19
The SES questionnaire was developed by Alan Felstead, Duncan Gallie, Francis Green, and Golo Henseke. For
details, see “Skills Trends at Work in Britain: First Findings from the Skills and Employment Survey 2017,” by
Golo Henseke, Alan Felstead, Duncan Gallie, and Francis Green. See also, Richard Glendinning, Viv Young,
Alexandra Bogdan, GfK UK Social Research (2018), “Skills & Employment Survey 2017 Technical Report”

13
Survey conducted by the German Federal Institute for Vocational Training (Bundinstitut für
Berfusbilding or BIBB) and partner agencies in seven waves between 1979 and 2018 covers a
wide range of topics including job requirements and tasks, though there appear to have been
changes in the wording of questions and response options over time.20
The European Union’s European Working Conditions Survey (EWCS) is mainly a quality of
working life survey, but also includes questions on job skill requirements.21
Five waves of the
EWCS, spaced five years apart, have been conducted since 1995, and the pilot conducted in 1990
extends the time series for a small number of items even earlier, though country sample sizes are
much smaller than the other databases. The SES, BIBB, and EWCS are all representative sample
surveys of workers conducted at relatively regular intervals, providing relatively long and clean
time series of repeated measures for job skill requirements. No similar series is available for the
United States. Even some results from these periodic surveys may be affected by the impact of
business cycles and idiosyncratic sample fluctuations, as well as secular trends.
As with the DOT and O*NET, some measures used in these surveys are not necessarily optimal.
Each wave of the EWCS asks workers, “Does your main job involve complex tasks” (yes/no).
Australia’s leading panel survey, the Household, Income and Labour Dynamics (HILDA)
survey, asked respondents in the early 2000s to indicate their level of agreement with the
statement “My job is complex and difficult” using a 7-point scale (0=strongly disagree,
6=strongly agree) (Leach et al. 2010). Likewise, RAND’s 2015 American Working Conditions
Survey modeled itself directly on the EWCS, asking workers, “Generally, does your main paid
job involve complex tasks?” The query elicited affirmative responses from 70% of the sample,
including 67% from non-college men, 84% from college-educated men, 59% from non-college
women, and 79% from college-educated women.22
By this measure, one would conclude that
large majorities of all different groups have jobs involving complex tasks, though the exact
meaning of “complex” and whether it is relatively constant across groups is unknowable.
Similar questions from other surveys ask respondents to indicate level of agreement with the
statement, “My job requires a high level of skill” (Fields 2002, pp.72ff.). Other questions in
common use, such as whether a job involves “learning new things,” take a similar form.
While these kinds of questions are general enough to apply to all kinds of jobs, they lack
substantive content, which not only limits the conclusions researchers can draw but also means
workers have no common standard to use in responding to them. Everyone must decide for
themselves what the term “complex tasks” means and how to place their own job on the scale
20 Partner agencies were the Research Institute of the Federal Employment Service (Institut für Arbeitsmarkt-und
Berufsforschung; IAB) prior to 2000 and the Federal Institute for Occupational Safety and Health (Bundesanstalt für
Arbeitsschutz und Arbeitsmedizin; BAuA) since 1999 (see Rohrbach-Schmidt and Hall 2013). 21
For details, see Eurofound (2016), Sixth European Working Conditions Survey – Overview report, Publications
Office of the European Union, Luxembourg. 22
“Working Conditions in the United States: Results of the 2015 American Working Conditions Survey,” by Nicole
Maestas, Kathleen J. Mullen, David Powell, Till von Wachter, and Jeffrey B. Wenger (Santa Monica, CA: RAND),
p.42. (https://www.rand.org/pubs/research_reports/RR2014.html)
14
provided, so a great deal is open to the respondents’ subjective interpretations. Thus, the RAND
results exhibit the expected education gradient, as well as a clear gender disparity, but the
general level of “job complexity” may be inflated by the freedom that the question gives
respondents to interpret the meaning of the item in their own ways, which might result in some
groups claiming more desirable characteristics for their jobs than would be endorsed by expert
raters who are trained to take the entire spectrum of jobs as their frame of reference, rather than
the narrow segment within which a particular job is located. Questions framed in an overly
general manner may be vulnerable to self-enhancing response biases, which may attenuate group
differences, if workers in less complex jobs interpret questions and response options relatively
leniently compared to a job analyst. Thus, problems for researchers studying job skill
requirements include not only the scarcity of data, especially long and consistent time series, and
the need for more systematic conceptualization of the domain, but issues related to the quality of
survey questions and the operationalization of skill concepts.
In order to improve the objectivity and interpretability of measures, and gain greater leverage on
questions related to job skill requirements, the survey of Skills, Technology, and Management
Practices (STAMP) constructed behaviorally specific measures of job requirements (Handel
2016b, 2017). The “explicit scaling” approach pursued by STAMP frames questions in terms of
facts, events, and behaviors, rather than judgments and perceptions, wherever feasible.
Questions pitched at a mid-level of generality can avoid both the narrowness of occupation-
specific items and the low information content of highly general questions. They can be general
enough to encompass diverse work situations, but sufficiently concrete that they have stable
meanings across respondents. Response options use natural units (e.g., number, frequency, time
spent), rather than rating scales and vague quantifiers. These measures are more meaningful than
scales derived from principal components analysis and factor analysis, which have arbitrary
metrics and lack absolute meaning and objective referents. Ideally, measures of workplace
cognitive skill requirements can be calibrated to education levels, enabling indicators of math,
reading, and writing job demands to be linked roughly to grade equivalents, for example.23
By
contrast, O*NET’s measures of math, reading, and writing at work involve rating scales that do
not correspond clearly to different objective levels of complexity or easily understood levels of
educational achievement. Items from STAMP and the British SES are the core of the job
requirement’s section of the OECD’s PIAAC survey, administered in over 40 countries/regions.
STAMP is also the basis for the job requirements section of the World Bank’s Skills Towards
Employment and Productivity (STEP) survey, administered in seventeen countries/regions, and a
survey of manufacturing conducted as part of MIT’s Production in the Innovation Economy
(PIE) program.
A significant and exciting new development since 2010 has been the availability of databases of
online job postings, most notably Burning Glass (BG) in the United States. These massive text
databases have been processed to yield detailed information on job skill requirements requested
23
For more detailed discussion of methodological issues regarding job skill measurement, see Handel (2017).
15
by employers for open positions and made available to researchers. The level of detail is
unsurpassed by information available from surveys, but the underlying data were not generated
for research uses and repurposing them carries uncertainties and limitations. The
representativeness of the data is unknown and online job postings do not cover vacancies filled
internally or through word of mouth, whose numbers vary by occupation. A large sample of
postings for middle-skill jobs found “53% of job postings are for entry-level candidates”
(Burning Glass and CapitalOne 2017, p.5), so there are clearly many jobs that are not being filled
using online job notices.
The occupational distribution in Burning Glass is not representative of the workforce. In a U.S.
study, managers, professionals, and technical workers accounted for about 60% of postings from
2010-2015 (Deming and Kahn 2018, p.S341), while BLS data indicate those high-level
occupations comprised only 38% of workers in 2013, a difference of 22 percentage points.24
Likewise, these high white-collar jobs accounted for 64% of BG postings for the UK for 2012-
2014, while official statistics indicated they accounted for 43% of the workforce, a disparity of
21 percentage points. Under-covered jobs in the UK included elementary occupations (-7.1
points) and caring, leisure, and other services (-5.3 points) (Brown and Souto-Otero 2020,
p.103). The Burning Glass database of job vacancy announcements is very large but it is not
representative of employed workers, and it may be unrepresentative of vacancies, as well.
In the Burning Glass database, 65% of job postings for administrative assistants ask for a
university degree at a time when only 19% of administrative assistants currently employed had
one, and very similar figures were observed for supervisors of production workers (Burning
Glass 2014, pp.5,7). Burning Glass interprets these as examples of credential inflation, but they
may be merely aspirational, with little influence on the kind of people actually hired.
Because help wanted ads represent flows, it is not clear that vacancy postings are representative
of the current stock of employment with respect to skill requirements. Jobs with above-average
turnover will be over-represented relative to their share of employment. In addition, single posts
can represent multiple vacancies, or even no vacancy given the low cost of online job listing and
employers who may be passively scanning the labor market for suitable hires. Consequently,
prevalence rates for different job characteristics are difficult to determine.
There are also potential challenges with the skill information itself. Help wanted ads are free
text, rather than closed-coded survey responses. Machine learning algorithms and human-
directed programming can parse the massive corpus of text into categories that are sensible from
research and policy perspectives, but this is a significant task that may experience validity issues.
In any case, the data are not prestructured and do not organize themselves automatically. While
surveys ask common questions to all eligible respondents and score responses on a single scale,
help wanted ads may focus on occupation-specific skills rather than transversal skill concepts.
24
The BLS data is from the Current Population Survey (https://www.bls.gov/cps/aa2013/cpsaat09.pdf )

16
These skills can be quite specific and difficult to aggregate into a broadly applicable, common
scale because they are qualitatively diverse and usually not easily mapped into a level of
complexity framework. Solutions include indicator variables for the presence or absence of
specific skill requirements (e.g., commercial truck driver’s license, “strong problem-solving
skills,” biochemistry, “work with robots”), or variables consisting of a simple count of the
number of skills of a given class in the ad (e.g., number of computer programs required).
These methods assume that job advertisements specify all important skills and technologies
explicitly rather than omitting skills that are so commonly required for the particular job that
they can be left unmentioned. However, this assumption may not be justified. In a large sample
of 45 million ads for managerial, professional, and technical jobs, 41% did not specify a required
level of education, while only 37% specified at least one general cognitive skill keyword, 36%
specified an interpersonal skill keyword, and just 25% specified both. By contrast, nearly one-
third specified an advanced software requirement (Deming and Kahn 2018, p.S344, S348). By
contrast, any skill survey could easily collect information on required education, cognitive skills,
and interpersonal requirements using a common survey for all respondents, though the sample
would not remotely approach the size of job posting database. Unlike surveys, most job vacancy
databases also have little information on the characteristics of workers hired to fill jobs, which
may differ from employers’ stated preferences in the case of education, experience, and specific
skills.
Finally, the algorithms for scraping and processing online postings evolve, so trend studies will
need to distinguish real change from artifacts of methodological changes. By contrast, surveys
can be repeated following standard procedures. Very large databases of online job postings are a
rich source of information on job skill requirements that will be increasingly important in
research going forward. They are the best source for identifying new and emerging skill
requirements, notably the ever-changing popularity of different software (e.g., R, Python,
Tableau). However, job posting data will not eliminate the need for surveys designed to address
specific questions of interest to researchers and policy makers, such as the actual prevalence of
different job tasks and requirements.
As the preceding suggests, despite longstanding interest in understanding levels of and trends in
job skill requirements, there is no consensus on a conceptual framework or operational measures.
Indicators are mostly unstandardized, and repeated measures time series are scarce, certainly for
the U.S. Consequently, any review of existing research is necessarily an exercise in bricolage.
The frequent use of indefinite or abstract measures means there is little clarity on the precise
levels of job skill requirements, though there is general agreement that the broad direction of
changes in job requirements is towards greater education and more cognitively complex tasks.
There is less understanding regarding precise rates and timing of changes, or even whether
change has accelerated with the diffusion of new computer technologies, as many assume.
Indeed, there are no clear guidelines for what constitutes gradual or rapid change in job skill
demands, unlike established economic indicators with long historical series, such as

17
unemployment and productivity. Finally, because of data limitations, trend studies for the
United States have had few alternatives to merging DOT or O*NET skill scores from a single
year onto multiple years of occupational employment data from the CPS or Decennial Census.
Therefore, all measured changes in job skill requirements for the U.S. reflect changes in
occupational employment shares, not changes in job content within occupations, which are
largely unknown. The research results described below will necessarily reflect the potentials and
limitations of existing concepts and data.
18
II. Job skill requirements: Levels
This section presents cross-sectional data from conventional, representative surveys and from the
Burning Glass database of online job postings. In terms of understanding trends, it is worth
considering that the skill levels recorded by these data are the result of a long process in the
transformation of the nature of work. If the preceding decades of the computer era have brought
job requirements to a certain point visible in these data, one can have a rough sense of the rate of
change that was possible or plausible to have produced the prevalence rates observed currently.
A. Representative survey data
Academic skills like those in the first column of Figure 1 are at the center of debates over
whether the United States suffers from a general skills shortage and recommendations to raise
educational standards in order to meet the demands of the workplace. The STAMP survey was
designed to provide strong measures of the general academic skills that Americans use on their
jobs.
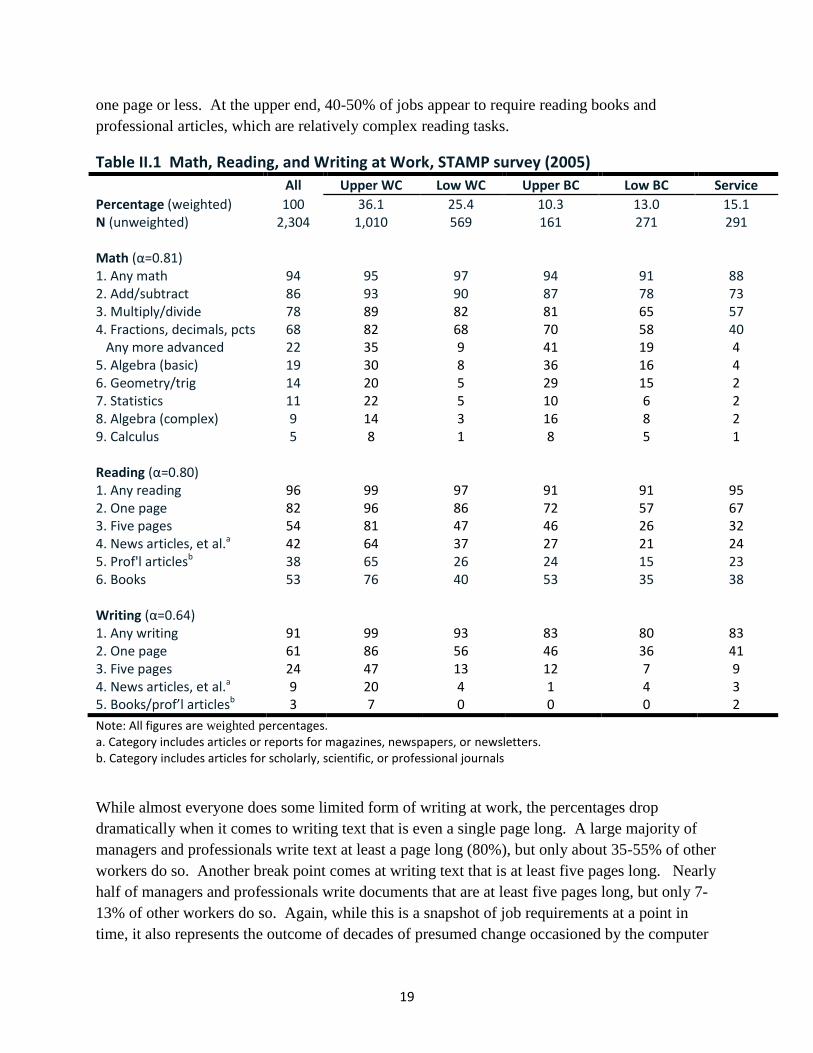
Table II.1 shows the percentage performing math, reading, and writing tasks on their jobs at
various levels of complexity for all workers and for broad occupation groups. 25
Because the
items were designed to have a difficulty gradient and the occupation groups form a rough skill
hierarchy, as well, the percentages are generally expected to decline as one moves down each
column and rightward across each row within panels of the table. The direction and magnitudes
of these two gradients, as well as Cronbach’s α, indicate the strength and consistency with which
the items measure the underlying trait. All percentages are weighted to be representative of the
U.S. workforce; the first row showing the occupational distribution matches the CPS.
Almost everyone uses some basic math skills on their job, but only two-thirds perform
calculations with fractions, decimals, and percentages, and only 22% use any math beyond
arithmetic on the job, usually simple algebra. About 5% use calculus and other higher math on
the job. The numbers decline markedly across the five broad occupation groups, except for the
skilled blue-collar group, which uses math relatively intensively.
Reading on the job seems more common than math, though the numbers begin to drop noticeably
for most occupational groups even when the task is reading continuous text that is one page long.
Other than managers and professionals, only about 25-45% of workers read text that is at least
five pages long as a regular part of their jobs. For the upper white-collar workers, this figure is
over 80%. The results suggest significant bifurcation in reading demands among U.S. jobs.
Nearly 20% of jobs have quite basic levels of reading demand, in which the longest document is
25
The occupation groups are Upper WC=upper white -collar (management, professional, technical occupations);
Lower WC = lower white -collar (clerical, sales); Upper BC = upper blue-collar (craft and repair workers, e.g.,
construction trades, mechanics); Lower BC = lower blue-collar (factory workers, truck drivers, laborers); Service =
e.g., food service workers, home health care aides, child care, janitors, police and fire fighters.
19
one page or less. At the upper end, 40-50% of jobs appear to require reading books and
professional articles, which are relatively complex reading tasks.
Table II.1 Math, Reading, and Writing at Work, STAMP survey (2005)
All Upper WC Low WC Upper BC Low BC Service
Percentage (weighted) 100 36.1 25.4 10.3 13.0 15.1 N (unweighted) 2,304 1,010 569 161 271 291 Math (α=0.81) 1. Any math 94 95 97 94 91 88 2. Add/subtract 86 93 90 87 78 73 3. Multiply/divide 78 89 82 81 65 57 4. Fractions, decimals, pcts 68 82 68 70 58 40 Any more advanced 22 35 9 41 19 4 5. Algebra (basic) 19 30 8 36 16 4 6. Geometry/trig 14 20 5 29 15 2 7. Statistics 11 22 5 10 6 2 8. Algebra (complex) 9 14 3 16 8 2 9. Calculus 5 8 1 8 5 1 Reading (α=0.80) 1. Any reading 96 99 97 91 91 95 2. One page 82 96 86 72 57 67 3. Five pages 54 81 47 46 26 32 4. News articles, et al.a 42 64 37 27 21 24 5. Prof'l articlesb 38 65 26 24 15 23 6. Books 53 76 40 53 35 38 Writing (α=0.64) 1. Any writing 91 99 93 83 80 83 2. One page 61 86 56 46 36 41 3. Five pages 24 47 13 12 7 9 4. News articles, et al.a 9 20 4 1 4 3 5. Books/prof’l articlesb 3 7 0 0 0 2
Note: All figures are weighted percentages. a. Category includes articles or reports for magazines, newspapers, or newsletters. b. Category includes articles for scholarly, scientific, or professional journals
While almost everyone does some limited form of writing at work, the percentages drop
dramatically when it comes to writing text that is even a single page long. A large majority of
managers and professionals write text at least a page long (80%), but only about 35-55% of other
workers do so. Another break point comes at writing text that is at least five pages long. Nearly
half of managers and professionals write documents that are at least five pages long, but only 7-
13% of other workers do so. Again, while this is a snapshot of job requirements at a point in
time, it also represents the outcome of decades of presumed change occasioned by the computer

20
revolution beginning around 1980. It is certainly possible that that the rate of change in the
future will represent a break with the past, but these job requirements already reflect
developments over a long period for which claims regarding rapid skill change were made, as
well. In viewing Table II.1 and the tables that follow it is important to recognize that these levels
of skill requirements were reached after twenty-five years of rapid computer diffusion, inequality
growth, and presumed changes in the nature of work. Although they are levels, they represent a
late data point in what is presumed to be a long-run trend. As such, these and subsequent figures
are informative as to how strong those trends could possibly have been.
In addition to skills taught explicitly in an academic context, general cognitive skills,
corresponding to the second column of Figure 1, represent another critical dimension of job skill
requirements. It is possible that some jobs require significant analytical and general reasoning
skills even though they do not require particularly high levels of math and writing, or even,
perhaps, reading. The innumerable and mostly unmeasurable occupation-specific skills in the
fourth column of Figure 1 will usually draw on general cognitive skills, as well.
Asking workers to report the general cognitive skills required by their jobs is challenging.
STAMP addressed this issue by asking about the prevalence of problem-solving on the job,
defined as “what happens when you are faced with anew or difficult situation and you have to
think for a while about what to do.” “Easy” problems were defined as that that “can be solved
right away or after getting a little help from others,” while a second question asked about
problems that are “hard to solve right away and require a lot of work to come up with a
solution.” Nearly two-thirds of U.S. workers reported that they often solved easy problems, but
only 22% often had to solve hard problems on their jobs and another 45% sometimes had to do
so (not shown). One-third of U.S. workers said they rarely or never had to solve hard problems
on their jobs.
Finally, three summary measures provide overall measures of general cognitive skills, especially
academic skills, and specific skills required by jobs. Level of education required to perform a
job, as distinct from the job-holder’s personal educational attainment, is an omnibus measure that
captures all education-related cognitive skills, not just numeracy and literacy. However, because
it is a rather holistic measure and lacks the specificity of other measures, required education’s
meaning is more open to interpretation. The numeracy and literacy items pass tests for
unidimensionality (Handel 2017), but required education captures not only diverse cognitive
demands but also various non-cognitive job requirements produced or signaled by a given
education level, i.e., it is vulnerable to “construct contamination.”26 An item on required field of
26
Possible non-cognitive dimensions captured by required education include requirements for certain kinds of
cultural capital, interpersonal and communication skills, and work habits and orientations (e.g., organization,
attention to detail).

21
study or vocational specialization would also capture academic skill requirements otherwise left
unspecified, but would only apply to a certain range of occupations. 27
Job-specific skills are captured by questions on the years of prior experience in related jobs
required by the current job and the time required to become proficient on the current job. In the
STAMP paradigm, these measures capture the diversity of innumerable specific job requirements
on a scale that uses required time as the common unit. Although these items reduce immense
qualitative diversity to scalars, there is no other obvious way to cope with the effectively infinite
variety of job tasks performed in a modern economy. In machine learning, this is known as the
“curse of dimensionality” and questions on job learning times are one of the few ways to capture
the full range of specific job skills, even though it leaves them unspecified. Versions of these
three items are also available in the DOT, O*NET, British SES, and PIAAC, though they are not
necessarily placed in the conceptual framework used here.
The top panel of Table II.2 shows the overall distribution of workers’ personal education
(column 1), job required education (column 2), and the difference between them (column 3).
Despite the general view that low-skill jobs are becoming scarce, slightly more than half of all
jobs require only a high school education or less, while 27% require a four-year college degree
or more. These aggregate figures indicate significant surplus of jobs requiring only a high school
education relative to the number of workers with that level of education. There is also a surplus
of workers with some college education relative to the number of jobs requiring that level of
education; many work in jobs they report require no more than high school. By contrast, the
shares of workers and jobs at the BA level are in balance at the aggregate level. Finally, 10% of
workers report having an advanced degree but only 6% say their jobs require that much
education. This may reflect some kind of credentialism on jobs requiring master’s degrees for
hiring or promotion, or mismatches between supply and demand that force people to work in
jobs outside their field of study.
Table II.2 Educational Attainment and Job Required Education, STAMP survey (2005)
Aggregate distribution Attained Required Attained – Required
<High school 9.0 7.6 1.4 High school 25.9 42.6 -16.7 High school+vocational 5.7 6.3 -0.6 <Bachelors 29.1 16.5 12.6 Bachelors 20.0 20.8 -0.8 Graduate 10.3 6.3 4.0 Individual matches All 30≤Age≤59
Under-educated 13.2 14.1 Matched 55.3 57.4 Over-educated 31.5 28.6
Note: All figures are weighted percentages.
27
These data are available in rather coarse categories in PIAAC.

22
The bottom panel of Table II.2 shows match and mismatch rates calculated at the individual
level. Over 30% of the work force is over-educated in the sense that they hold jobs which they
say require less education than they have attained, while less than 15% has less education than
they say is required for their jobs. The second column shows that over-education is not simply
an issue of young workers still searching for a good match, as the results are only slightly
different when the sample is restricted to workers aged 30-59. Nearly one-third of workers with
a four-year college degree hold jobs with lower educational requirements, and about one-half of
workers with postgraduate education work in jobs requiring less education (not shown).
However, the greatest source of mismatch at the individual level, as with imbalances in the
aggregate, is the large number of workers with some college working in jobs requiring only high
school (42%) or less than high school (5%) (not shown).
According to Table II.3, jobs require 2.7 years of previous experience in related jobs on average,
but the distribution is quite skewed, as the median is only 1.5 years. Over one-fifth of jobs
require no previous experience. Likewise, the average time required to learn one's job is a bit
over one year (12.5 months), but the median is only 3.5 months and nearly 27% of jobs require
less than one month to learn. In principle, prior experience and on-the-job learning may
substitute for general human capital requirements, but the correlations between educational
requirements and both required prior experience (0.35) and (ln) learning times (0.41) indicate
they are more often complements than substitutes in practice (not shown).
Table II.3 Job-specific skill levels: Required prior experience and job learning times
Percentage Prior experience None 21.8 < 1 year 14.8 1-2 years 27.1 3-5 years 20.3 >5 years 15.9
mean (median) in years 2.7 (1.5) Job learning times <1 week 5.3 1-4 weeks 21.6 1-6 months 27.3 6-12 months 23.9 > 1 year 21.8
mean (median) in months 12.5 (3.5)
Table II.4 shows the prevalence of different interpersonal and physical job requirements.
Pretests for STAMP confirmed suspicions that the interpersonal domain is subject to substantial

23
yea-saying bias among respondents; people are prone to affirm the importance of “people skills”
regardless of differences in the content of their jobs. The items have no obvious complexity
gradient, although for convenience they are presented in decreasing order of frequency, like
Table II.1. Perhaps the most notable result relates to giving formal presentations lasting at least
fifteen minutes as a regular part of the job. Nearly 60% of managers and professionals give
presentations, but only 10-20% of workers in the other occupational groups do so. As would be
expected, blue-collar workers were also much less likely to have contact with the public than
other groups (line 7) or to say that working with the public was an important part of their job
(line 8). By contrast, blue-collar jobs require more standing, heavy lifting, eye-hand
coordination, and overall physical demands than white-collar jobs, but service jobs are not far
behind on many of these measures of physical demands.
Table II.4. Interpersonal and physical job demands, STAMP survey
All Upper WC Low WC Upper BC Low BC Service
Interpersonal (α=0.72) 1. Give information 92 98 94 86 85 81 2. Teach or train people 75 86 69 75 67 67 3. Deal with tense situations 60 65 60 51 49 65 4. Counsel people 37 50 28 28 26 38 5. Presentations >15 mins. 32 57 20 17 11 17 6. Interview people 18 30 16 7 6 9
7. Public contact a 3.04 3.69 3.45 1. 94 1.60 2.79 8. Importance levelb 7.40 8.79 8.31 5.01 4.21 6.88 Physical (α=0.79) Stand ≥2 hours 67 52 58 90 80 90 Lift/pull ≥50 lbs. 36 19 27 73 60 48 Good coordination 57 43 42 89 78 75 Physical demandsc 4.59 3.46 3.67 6.67 5.98 6.23
Note: Figures are weighted percentages responding positively (1=yes) unless noted. a. Frequency of contact with people other than co-workers, such as customers, clients, students, or the public lasting 15 minutes or more (0=none, 1=<1 per week, 2=1 per week, 3=few times per week, 4=1 per day, 5=>1 per day). b. Self-rated importance of working well with customers, clients, students, or the public on respondent's job (0-11). c. Self-rated physical demands of job (0=not all physically demanding, 10=extremely physically demanding)
Computer-related skills represent a partial exception to the division of skills into general and
occupation-specific. Computer-related tasks have a moderate level of generality and they cut
across occupations in ways not necessarily obvious from occupation titles alone. About 70% of
workers reported using a computer at work at least a few times per week. An unexpectedly large
proportion of clerical and sales workers report spending most of their time doing data entry or
filling out forms (31%), which is suggestive of deskilling, but this is very atypical for the
workforce as a whole (line 1). A large proportion of all workers use spreadsheets (40%) (line 2),
but a much smaller group uses more complex functions like macros and equations (12%) (line

24
Table II.5 Computer use, STAMP survey
All Upper WC Low WC Upper BC Low BC Service
1. Data entry most of time 14 14 31 4 3 2. Spreadsheets 40 64 44 13 18 14 3. Spreadsheet macros, equations 12 21 11 2 6 3 4. Databases 19 32 20 7 7 3 5. SQL database queries 3 8 1 1 1 1 6. CAD 7 10 5 5 6 2 7. Science/engineering tasks 7 14 3 4 4 2 8. Programming 4 8 2 0 1 1 9. Special software 47 61 59 23 29 24 10. New software in last 3 yearsa 16 24 16 11 12 6 11. No. of applications (max=15) 4.02 6.06 4.68 1.68 1.91 1.41 12. Computer skill levelb 4.21 5.91 5.06 1.95 2.43 1.77 13. Inadequate skills (users only) 23 26 18 30 23 22 14. (if yes) Affected pay/promotion 8 3 5 10 18 13
Note: All statistics are percentages except lines 11 and 12. All calculation use full sample (computer users and non-users) except lines 13 and 14. SQL=structured query language, CAD=computer-aided design a. Respondents were asked whether they had to learn any new computer programs or functions that took more than a week to learn in the previous three years. b. Self-rated complexity of computer skills used on job (0=no computer use, 1=very basic, 11=very complex)
3); presumably, they function simply as electronic ledgers for most users. Similarly, while
nearly 20% use databases (line 4), only 3% perform the more sophisticated task of programming
or writing queries using the computer language SQL (line 5). Between 5-10% of the workforce
uses computers for CAD, high-level quantitative analysis (scientific or engineering calculations,
simulations, statistics), or programming using a computer language such as C++, Java, Perl, and
Visual Basic (lines 6-8). In general, these results suggest that sophisticated technology does not
necessarily imply great skill upgrading within jobs; most people use computers for fairly
ordinary office duties rather than more complex tasks.
Workers use an average of four out of the fifteen applications queried, and this includes a
catchall question asking whether they use a customized or special program found mostly in their
line of work (line 11). Not surprisingly, given that computers are most effective at processing
information and assisting white-collar work, managers/professionals and clerical/sales workers
use more applications (5-6) than blue-collar and service occupations (<2) (line 11). Both groups
of white collar workers are also more likely use software applications specific to their line of
work (~60%) compared to the other occupational groups (~25%) (line 9).
About one-quarter of computer users report that they do not have all the computer skills needed
to do their job well (line 13). However, only 8% of the total workforce (users and non-users)
report that a lack of computer skills has affected their chances of getting a job, promotion, or pay
raise, though the figure is somewhat larger for lower blue-collar workers (18%) (line 14). This is

25
roughly consistent with employers’ reports of the level of computer skill deficits they observe,
but lack of comparability among data sources prevents great certainty (Teixeira 1998, p.3).
A truism holds that nothing is constant except change in the information age and, relatedly, that
this will require continuous learning in the workplace. However, there are few direct estimates
of how the rate of technological change affects skill requirements. In fact, relatively few
workers have had to spend more than one week learning new software within the three years
prior to the survey (16%), though again, there is a slight occupational gradient, as somewhat
more upper white collar workers (24%) experienced new software introductions in this
timeframe (line 10). These results provide actual rates of skill change that are considerably more
moderate than the common view that change is occurring with unprecedented rapidity.
Finally, a large class of more traditional mechanical technology associated with blue-collar work
has been the subject of conflicting claims that it is the source of widespread deskilling or skill
upgrading, as it incorporates programmable microelectronics and is the focus of employee
involvement practices. STAMP’s questions on the use of heavy machines and industrial
equipment tried to capture the different faces of work with non-computer machinery: traditional
craft skills (e.g., machine set-up, maintenance, repair), newer high-tech skills (e.g.,
programmable automation technology), and deskilled tasks (e.g., machine tending, assembly line
work).
Table II.6 shows only 20% of the work force uses heavy machines and industrial equipment, not
surprisingly concentrated among blue-collar workers (line 1). Despite claims that employee
involvement has led to significant sharing of traditional craft tasks with less skilled blue-collar
workers, activities such as routine maintenance, repair, and machine set-up, remain significantly
more common among skilled blue-collar workers (lines 2-4). Likewise, despite the great
attention given to machining, few workers in any broad occupational group use machine tools
(lines 5-7).
Likewise, few use any kind of automated production equipment on their jobs (lines 8-13). It is
not necessarily surprising that few production workers use or interface with automated
equipment, as the elimination of labour is one goal of automation. Nevertheless, it is important
to recognize that most remaining production jobs do not have a high-tech character because they
are in jobs in which the introduction of computerized processes has made fewer inroads.
By the same token, despite the traditional attention given to assembly line work, only 12% of
less skilled blue-collar workers report working under those conditions (line 14). In general, the
task content of jobs involving machinery and heavy equipment conform to neither the extreme
deskilling nor the optimistic upgrading scenarios.
About one-third of skilled blue-collar workers and one-quarter of less skilled blue-collar workers
started using new equipment or machinery in the previous three years (line 15) and about 12-
13% had to spend more than a week learning the new technology (line 16). Like the previous,

26
parallel item for learning new software, this item provides an estimated rate at which new
technology introduction changes skill requirements at a given level of complexity. In neither
case do the absolute levels seem particularly high, but there is no historical data that can provide
a point of comparison for these results.
All workers were asked the level of mechanical knowledge needed for their jobs and whether
they need a good knowledge of electronics, which partly reflects the diffusion of microelectronic
technology. As expected, the average level of required mechanical knowledge was significantly
higher in blue-collar than white-collar occupations. In addition, less than 15% of the overall
workforce requires a good knowledge of electronics, but the figure is significantly higher for
skilled blue-collar workers (33%). Overall, microelectronic hardware seems not to have affected
skill requirements for most jobs, with the possible exception of skilled blue-collar jobs, though
further research is needed to understand the depth of knowledge required.
Table II.6 Mechanical and other technology, STAMP survey
All Upper WC Low WC Upper BC Low BC Service
Machine technology 1. Heavy Machinery 20 7 11 65 46 12 2. Maintenance 10 3 1 41 21 10 3. Repair 8 3 1 35 16 7 4. Machine set-up 12 4 4 41 29 8 5. Use machine tools 4 1 1 12 14 2 6. Use NC / CNC 2 3 9 7. Program NC / CNC 1 6 8. Operate robots 1 1 2 3 9. Program robots 1 1 10. Programmable Logic Ctrl 2 1 6 4 11. Computer Process Control 4 3 2 14 12 12. Program CPC 1 1 4 3 13. Automated equipment 5 2 2 9 19 1 14. Assembly line 2 1 5 12 15. New machinery in 3 yrs. 10 4 4 32 23 6 16. Learning time > 1 week 4 1 2 13 12 1 17. Mechanical Skill Levela 2.50 1.73 1.38 5.97 4.55 2.12 18. Electronics Skill (1=yes) 13 12 8 33 15 9
Note: All figures are weighted percentages except line 17. Blank cells have rounded values less than 1%. NC=numerically-controlled machine tool (1=yes) CNC=computer numerically-controlled machine tool (1=yes)
PLC=programmable logic controllers (1=yes) CPC=computer process control (1=yes) a. Mechanical skills: 0=very basic, 10=very complex
While STAMP data is based on worker reports, Weaver and Osterman (2017) gathered skill
requirements data from managers as part of MIT’s Production in the Innovation Economy (PIE)
project. The PIE Manufacturing Survey randomly sampled U.S. manufacturing establishments

27
with at least 10 employees and asked about skills required in “core” production jobs, which
accounted for 63% of establishment employment on average (Weaver and Osterman 2017,
p.284). The focal workers would be most comparable, though not identical, to the lower blue-
collar broad occupation in the STAMP tables.
Table II.7 shows results from a series of questions modeled on STAMP items. These results are
broadly similar to STAMP’s results for the overall economy, though somewhat elevated for math
and reading, and somewhat lower for writing tasks required on the job. The required levels of
computer use are generally higher than observed in STAMP. However, the two samples also
differ, insofar as the PIE results are representative of establishments rather than employees, and
the STAMP figures refer to workers in all sectors, not just core workers in manufacturing.
Table II.7 Academic and Computer Skill Demands,
Manufacturing Production Jobs, 2012-13
Academic skills
Basic reading (read basic instruction manuals) 75.6
Basic writing (short notes, memos, reports<1 page) 60.5
Basic math (all math categories below) 74.0
Addition and subtraction 94.4
Multiplication and division 85.6
Fractions, decimals, or percentages 77.9
Basic reading + writing + math 42.4
Extended reading (see note) 52.6
Extended writing (anything at least 1 page long) 22.1
Extended math (any of following math categories) 38.0
Algebra, geometry, or trigonometry 31.7
Probability or statistics 14.0
Calculus or other advanced mathematics 7.3
Computer skills
Computer use (≥ several times per week) 62.3
Word processing software or Internet search 41.7
Extended computer 41.9
Use CAD/CAM software 28.4
Use other engineering or manufacturing software 29.2
Write programs (e.g., program CNC machine) 18.6
Note: “Extended reading” includes any reading involving complex technical documents or manuals, documents longer than 5 pages, or articles in trade journals, magazines, or newspapers. From Weaver and Osterman (2017, p.286) analysis of MIT PIE Manufacturing Survey.
The PIE survey also asked about problem-solving, autonomy, and interpersonal skills, using
questions framed in more conventional terms and response options relating to “importance.” The

28
second column of Table II.8 combines responses reporting a skill to be either moderately
important or very important. The variance is low; over 88% of managers report these nine
qualities are moderately or very important on average. Differences between the top two response
options on the 4-point scale represent the main source of variation for these items. Based on the
first column, large majorities of managers expected core production workers to have good
interpersonal relations with co-workers and to be alert to production problems, but only 35-40%
reported it was very important for them to have higher-order problem-solving skills, like solving
unfamiliar problems, critically evaluating different options, or initiating new tasks on their own
without guidance from above. Weaver and Osterman conclude:
Requirements for extended reading and computer abilities, in particular, are common,
encompassing more than half of all manufacturing establishments. Cooperation and
teamwork are also skills on which large numbers of manufacturing establishments place
great value. At the same time, however, a substantial percentage of establishments have
relatively low skill demands. Even among the plants requiring higher skill levels, the skill
demands appear modest, particularly with regard to math. With regard to skills that are
generally perceived as critical for high-tech, flexible manufacturing systems, emphasis on
problem solving, initiative, self-management, and other similar skills appears surprisingly
muted (2017, p.287).
Table II.8 Problem-solving and Interpersonal Skill Demands, Manufacturing Production Jobs
very
important moderately +
very important
Problem-solving Ability to evaluate quality of output 71.0 95.8
Ability to take appropriate action if quality not acceptable 76.3 97.7
Ability to learn new skills 50.1 89.3
Ability to solve unfamiliar problems 38.8 83.0
Ability to critically evaluate different options 35.7 74.1
Autonomy Ability to independently organize time or prioritize tasks 45.6 84.4
Ability to initiate new tasks without guidance from mgt. 35.2 80.9
Interpersonal skills
Cooperation with other employees 81.2 99.3
Ability to work in teams 64.2 91.1
From Weaver and Osterman (2017, p.286) analysis of MIT PIE Manufacturing Survey
Finally, RAND’s 2015 American Working Conditions Survey has five items relating to job skill
demands. Over 80% of workers reported their job involved applying their own ideas, learning
new things, and problem solving, while 70% said their jobs involved complex tasks. Obviously,
these numbers are very high and convey a different impression than the previous two surveys.

29
Interestingly, 62% of workers say their jobs involve monotonous tasks, which means at least
32% must have jobs involving both complex and monotonous tasks. For complex tasks and
applying own ideas there is a 11-22 percentage point difference between education levels within
gender groups, and there is a similar education gap for problem solving among females (not
shown), so the items do distinguish between jobs in expected ways at least to some extent. There
is also a 5-14 percentage point gender gap within education groups for complex task and problem
solving (not shown).
A key point, however, is that these kinds of items are limited by their overly general nature and
correspondingly high rates of positive responses. This is more than a methodological side note;
it is also likely to affect measured trends. Indicators with prevalence rates around 85% are close
to a ceiling. These measures have a built-in bias toward relatively flat changes in future survey
waves, assuming the trend is in a positive direction, because they have little room to grow given
the high levels of endorsement these kinds of questions tend to elicit.
Table II.9 Job skill characteristics by gender and education, RAND survey 2015 (percentage)
Generally, does your main Non-college College
paid job involve…? All Male Female Male Female Male Female
1. Applying own ideas 85 84 86 80 82 92 93 2. Learning new things 84 84 84 82 81 87 88 3. Solving unforeseen problems 82 87 77 85 71 91 86 4. Complex tasks 70 73 67 67 59 84 79 5. Monotonous tasks 62 63 61 64 63 60 57 Note: Figures represent the percentage of respondents answering “yes” to each question. Source: Nicole Maestas, et al. (2017),
p.42.
B. Online job posting data
Burning Glass (BG) has constructed what most observers consider the most comprehensive
database of online job advertisements. The company’s internal research unit has produced a
series of papers, often in collaboration with technology companies, industry-sponsored think
tanks, trade associations, and academic partners. Given their deep level of detail and recency,
these data are particularly relevant for understanding emerging job skill requirements, such as
computer-related or digital skills. Traditional surveys do not have the space or the agility to
capture as many specific, emerging skills as BG’s web crawlers and text-processing algorithms
which work with a very large corpus of material. However, BG’s database generally does not
extend back farther than 2007 and many published reports work with shorter and more recent
time periods. In this sense the reports contribute to a picture of current conditions, rather than
long-run change, although this will change as data accumulates.
BG’s report with the Business-Higher Education Forum, “The New Foundational Skills of the
Digital Economy” (2019) identifies 14 “new foundational skills” that fall into three categories:
those that are distinctly human (e.g., critical thinking, creativity, communication, relationship

30
building), “business enabler skills” (e.g., project management), and “digital building block
skills,” which include both skills specific to IT jobs (e.g., software development, programming,
digital security) and more widely applicable (e.g., analysing data). One or more of the 14 new
foundational skills was requested in 53% of the 22.4 million job vacancy postings in the BG
database for 2017 (p.9). Many skills are associated with higher salary offers, but the largest
premiums are for skills found most commonly in IT specialist occupations, such as computer
programming and software development (pp.10f.,15). Indeed, the “human skills,” which include
many interpersonal skills, appear to receive no earnings premium (p.11).
The report argues that “skills trickle down over time” and that the “advanced skills of the past
become the foundational skills of the future” (p.18), such that skills currently restricted to IT
specialists are quickly becoming necessary for non-specialist jobs.
Long division, for example, was largely the province of mathematicians and scientists
until the 19th
century. Now it is taught in elementary schools. More recently, we have
seen a similar pattern with coding, data science, 21st century or “soft” skills, and other
on-the-job competencies (p.5).
However, there are reasons to question the breadth of this claim.
Not surprisingly, IT companies and IT departments are intensive users of online job posting sites
and most BG reports tend to overrepresent IT jobs and IT specialist skills relative to what is
known from representative survey data. For example, nearly 15% of postings requested software
development skills and nearly 12% requested computer programming skills for which “baseline
competencies” include JavaScript and Python (pp.46f.). These figures are quite high and suggest
significant sample selection bias at the level of individual tasks and skills in the BG database, as
well as tenure, occupation, and other dimensions discussed earlier.28
Likewise, while the report
finds demand for many of the 14 skills grew by double digit rates between 2012 and 2017 (p.25),
survey evidence presented below rarely shows such rapid rates of change.
While this report and others convey a “coding for all” message, the “digital building blocks”
were requested in only 16% of postings for high-level jobs, compared to 39% requesting
“business enablers,” and 62% requesting “human skills” (p.28). Indeed, a close reading of the
report suggests the authors are aware that the IT skills required by the largest group of workers
are more basic and “can be learned on the job or in introductory courses” (pp.29ff.). Even data
visualization, which one might expect to be one of the more common “new foundational skills,”
is requested in only 0.7% of postings (p.53).
28
An earlier report distinguishes between “digitally intensive” and “non-digital” middle-skill occupations and provides counts from both the BG database and the U.S. Bureau of Labor Statistics. Digitally intensive occupations are 2.6 times larger than non-intensive occupations in the BLS data, but 3.7 times larger in the BG database (Burning Glass and CapitalOne 2015, p.10), suggesting biased sampling with respect to ICT-related jobs.

31
Another report states that 20% of jobs paying a living wage were in occupations that demand
coding skills, defined as including programs such as JavaScript, HTML, R, SAS, AutoCAD,
Java, Python, and C++. Again, a closer reading indicates that aside from STEM jobs, the
occupations demanding these skills were those one would expect (e.g., business analyst, graphic
designer, web designer), rather than a truly broad spectrum of jobs. 29
However, another report
concluded that “efforts like ‘Computer Science for All’ may be even more critical than everyone
thinks.”30
By contrast, another report takes a much more nuanced stance, clearly distinguishing basic office
software competencies from more advanced and occupationally-specific digital skills, rather than
claiming that computer science skills are spreading to jobs in general (Burning Glass and
CapitalOne 2017).
Potentially more interesting is the possibility of tracking new and emerging occupations, like
data scientists, using the Burning Glass database. The Standard Occupational Classification
system lags in recognizing such jobs as distinct occupations, so standard data sources cannot be
used to gauge their prevalence. In 2012, Burning Glass found less than 1,100 postings for data
scientists, while the number rose to over 14,600 in 2016 (Burning Glass and U.S. Chamber of
Commerce Foundation 2018, p.15). Burning Glass projects 62,000 job openings for data
scientists in 2020, nearly 40% of which requiring at least a Master’s degree, concentrated mostly
in the finance and professional services industries (Burning Glass, IBM, and Business-Higher
Education Forum 2017, pp.3,7).
Interestingly, the most frequently requested analytical skill in the broader Data Science and
Analytics category was a “legacy” skill, SQL (339,000 postings). By contrast, cutting edge
skills, like machine learning, big data, R, Hadoop, data visualization, and Tableau, were the
fastest growing skills among those that were mentioned in at least 7,500 postings, but none made
the top ten most frequently requested skills (Burning Glass, IBM, and Business-Higher
Education Forum 2017, p.11). Unfortunately, the paper reports only projected growth rates, not
the absolute frequency with which the cutting edge skills are requested in job postings, so one
cannot know whether the rapid growth rate partly reflects the small numbers of jobs requiring
them.
Despite their limitations, databases like Burning Glass provide the only real clues regarding how
many jobs require the advanced digital skills that are receiving widespread attention. Hopefully,
survey data will become available in the near future that provides more reliably representative
information on the workplace prevalence of coding, data visualization, data analytics and data
science, and other emerging IT-related tasks, including whether the demand for these
competencies is moving beyond ICT specialist occupations. Given the increased support for
29
Burning Glass and Oracle Academy (2016), “Beyond Point and Click: The Expanding Demand for Coding Skills.” 30
Burning Glass and Oracle Academy (2017), “Rebooting Jobs: How Computer Science Skills Spread in the Job Market” (p.4).

32
more coding instruction in schools in recent years, it is remarkable that there is so little firm data
indicating how many jobs actually require these skills.
Deming and Kahn (2018) utilize a rich set of skill measures from the Burning Glass database in
their study of skill requirements for professional jobs. They created ten categories of transversal
skills from BG’s large corpus of keywords and phrases (Table II.8), but they focus on cognitive
and social skills (lines 1-2). The fact that the number of categories and the defining keywords
are relatively few given vast corpus of the free text database is a reminder of the challenges of
data reduction when a database with “everything” in it is actually available. The sample is
restricted to managers, professionals, and technical workers for 2010-2015, but even that
restriction yields an extraordinarily large sample of 45 million ads (Deming and Kahn 2018,
p.S342).31
Table II.9 shows the percentage of ads requesting each skill for the overall sample
and selected detailed occupations; values over 45% are highlighted. Again, there is no way to
know the extent to which they approximate the prevalence of skills used by the job-holders in
those occupations in the overall workforce.
Baseline wage models show small premiums associated with a one standard deviation difference
in cognitive requirements (2%) and social requirements (5%), controlling for education,
experience, and the other eight job skills. When both cognitive and social tasks are advertised as
needed for the job, the premium is much larger (14%) and the returns to the individual skills flip
inexplicably negative and significant. Final models controlling for detailed occupation reduce
the size of the dual-requirement premium by nearly half, while the dummy variable for cognitive
skills alone is now associated with a small, positive, and significant premium and the dummy for
social skills alone is very small and not significant. Again, the final models estimate premiums
within very detailed, 6-digit SOC codes (Deming and Kahn 2018, pp.S353f.).
The other eight skill variables included in all regressions have predictive power, but the
coefficients are not reported or described “because we do not have a general framework for
analyzing them” (Deming and Kahn 2018, p.S348), so it is possible that the analyses produced
further sign reversals or other anomalies. This would not be a surprising result given the detailed
level of controls included in the models. Nevertheless, the sample size is very large—this is
genuinely Big Data—which means that there is no shortage of degrees of freedom to disentangle
individual effects. Job posting databases hold out the potential to yield reliable estimates of
returns to a long list of particular job skill requirements that are uniquely identifiable in this kind
of data. Whether controlling for detailed occupation and all of the available skill variables
simultaneously produces sensible estimates of individual effects remains to be seen as research
using these kinds of databases accumulates.
31
The universe is major SOC groups 11 through 29 (Deming and Kahn 2018, p.S341).

33
Table II.8 Job Skill coding scheme from Deming and Kahn (2018, p.S347)
Variables Burning Glass database keywords and phrases
1. Cognitive Problem solving, research, analytical, critical thinking, math, statistics
2. Social Communication, teamwork, collaboration, negotiation, presentation
3. Character Organized, detail oriented, multitasking, time management, meeting deadlines, energetic
4. Writing Writing
5. Customer service Customer, sales, client, patient
6. Project management Project management
7. People management Supervisory, leadership, management (not project), mentoring, staff
8. Financial Budgeting, accounting, finance, cost
9. Computer (general) Computer, spreadsheets, common software (e.g., Microsoft Excel, PowerPoint)
10. Software (specific) Programming language or specialized software (e.g., Java, SQL, Python)
Note: First column contains variables created from open text fields containing keywords shown in the second column, among others. Table II.9 Percentage of ads requesting skill requirements for selected occupations (Deming and Kahn 2018, p.S366)
Cog. Social Character Writing Customer
Service Project
Mgt People
Mgt Financial Computer Software
All managers, professionals, technical 37 36 30 20 20 12 15 16 29 32
Accountants and auditors 46 33 35 22 8 7 15 84 44 31 Computer programmers 42 33 21 21 13 12 11 5 27 82 Computer user support specialists 37 38 31 20 33 7 9 4 57 45 Computer & info systems analysts 47 48 42 23 20 34 35 27 30 56 Financial analysts 88 45 44 22 9 9 8 84 58 37 Managers, financial 51 42 39 21 23 10 32 66 35 21 Managers, general operations 40 43 42 21 21 12 38 32 30 13 Managers, sales 33 49 39 19 70 7 25 18 30 11 Lawyers 31 29 21 25 7 4 9 12 12 5 Loan officers 32 42 36 30 41 1 10 28 38 6 Management analysts 83 47 41 30 14 27 16 24 38 40 Registered nurses 19 25 15 7 38 0 11 2 11 3

34
Finally, it is important to recognize in this context that although data science and other high-
skilled occupations capture the most attention, the information sector includes new, “knowledge
work” that requires relatively modest levels of cognitive skills or their application to very narrow
tasks. In addition to well-known job platforms like Mechanical Turk, the unseen work of
policing social media content, organizing online advertising markets, and developing artificial
intelligence algorithms requires large numbers of moderators, monitors, curators, taggers, low-
level analysts, and other “humans in the loop” performing “online piecework” (Gray and Suri
2019; Roberts 2019; Siciliano 2016). The size of this “digital proletariat” is just beginning to be
a focus of study.

35
III. Job skill requirements: Trends
With current data, trends can be examined with two approaches, each with different strengths
and limitations. One approach is to use repeated cross-sections of specialized surveys or survey
modules to capture overall trends in job requirements. However, sample sizes, level of
occupational coding, and presentation in the original sources generally do not permit meaningful
analyses by detailed occupation. Observed changes may be due to the pattern of growth among
different occupations, changes in job task content within occupations, or, most likely, some
combination of the two. These data capture total trends but do not permit decomposition into
between- and within-occupation components of change at the level of detailed occupations. In
addition, most such surveys cover other advanced OECD countries, but some include the U.S., as
well.
The second approach merges cross-sectional skill scores from the DOT or O*NET onto large-
sample labor force data from the CPS, Decennial Census, or similar sources. These time series
are much longer because they can use longstanding official data collection programs. Changes
in occupational composition are captured more reliably because of the large sample sizes.
However, unlike the first kind of data, changes in skill requirements within occupations are not
captured at all. Data for this kind of analysis are readily available for the U.S. Skill trends using
each approach are described in order below.
A. Total trends
There are several repeated surveys with data on job skill demands that can be used to track
overall trends. Unlike work using skill scores from the DOT or O*NET, which are occupational
averages, these time series are based on microdata from representative surveys of workers,
meaning they capture within- as well as between-occupation components of change, even if they
are not well-suited to disentangling them. However, such data are more available for other
advanced economies than the United States.
The European Working Conditions Survey (EWCS) contains measures relating to cognitive,
interpersonal, and physical job requirements. The EWCS includes self-employed workers, but
all figures in the tables below refer to wage and salary workers only. Country data are reported
here for the EU-15 only in order to maximize comparability with the United States.
Table III.1 presents trends for three questions in the EWCS regarding cognitive job
requirements. A series of yes-no questions asked workers whether their job involved complex
tasks, solving unforeseen problems on their own, and learning new things. Figures in the table
show the weighted percentage responding “yes.” Results for the EU-15 as a whole are sample
averages in which person weights were adjusted by the size of each country’s workforce in that
year, derived from the European Labour Force Surveys (Handel 2012). The figures for the EU-
15 and individual countries show no positive trend between 1995 and 2005. For problem solving

36
and learning new things trends appear to be negative. Some means for individual countries, such
as complex tasks in Sweden, show some implausibly large swings, while the patterns for others
are less erratic.
Table III.1 Trends in cognitive job skill requirements in the EU, 1995-2005
Complex tasks Problem solving Learning new things
1995 2000 2005 1995 2000 2005 1995 2000 2005
EU-15 59.6 60.3 59.2 80.0 81.1 78.2 74.5 71.6 67.0 Anglo-Saxon Ireland 52.9 51.5 54.9 75.0 72.1 76.4 75.2 68.3 76.7 UK 71.1 63.4 58.5 89.9 82.6 78.9 81.9 77.0 71.4 Continental Austria 74.2 76.8 77.8 78.1 78.4 77.3 74.3 69.6 71.7 Belgium 48.3 49.0 54.7 80.0 86.4 87.9 66.6 75.4 76.7 Germany 60.9 69.1 69.9 75.4 79.3 75.9 72.6 69.0 63.4 France 52.6 52.6 52.3 82.2 86.0 83.1 73.6 72.7 68.4 Luxembourg 60.2 53.5 63.6 77.6 74.3 85.0 73.4 76.2 75.0 Netherlands 63.3 62.3 62.6 91.7 93.9 93.7 80.5 80.2 82.4 Nordic Denmark 61.0 63.8 76.1 90.8 92.3 94.2 84.2 86.1 88.2 Finland 67.9 72.1 72.6 85.9 77.4 79.0 90.0 90.8 89.9 Sweden 72.0 56.5 67.9 93.2 92.2 96.4 86.3 81.5 89.4 Southern Europe Greece 46.1 46.4 54.0 67.0 62.7 68.7 52.1 48.6 63.0 Italy 46.5 40.6 46.2 73.8 73.9 72.4 74.3 70.3 68.2 Spain 37.6 41.0 39.3 84.2 81.2 77.9 62.0 63.9 60.0 Portugal 40.8 42.6 53.8 75.7 69.6 78.7 69.6 58.4 67.6
Note: Figures are percentages responding “yes” to questions on whether their main job involves “complex tasks,” “learning new things,” and “solving unforeseen problems on your own.” Wage and salary workers only. Country means use country- and year-specific post-stratification weights; EU-15 averages adjust those weights by the relative size of each country’s workforce for each year derived from the European Labour Force Survey. Source: Author’s tabulations from the European Working Conditions Survey.
from Handel (2012, p.51)
Interestingly, respondents are much less likely to say their work involves complex tasks than
problem-solving (+19 percentage points in 2005) or learning new things (+8 percentage points in
2005). Likewise, the gaps between complex tasks and the other items were 12-15 percentage
points in the RAND survey (Table II.9), which was modeled on EWCS. It is possible that many
jobs require problem solving and continuous learning at a sufficiently low level that they do not
contribute a great deal to job complexity. However, it is also possible that a key problem is the
greater vagueness of the questions on problem-solving and learning new things, which permits
more elastic interpretations on the part of respondents compared to the item on complexity,
which explicitly references the concept of difficulty level. The survey does not give respondents
standardized guidelines or objective benchmarks for what constitutes an “unforeseen problem”
or what constitutes a “new thing.” By contrast, the item on complexity contains an explicit
indication that a significant, albeit undefined, threshold must be cleared for an affirmative

37
response. This argues for caution in interpreting high rates of endorsement for these two
particular questions, but also reinforces the more general point that more attention and rigor
needs to be devoted to measuring job skill requirements to avoid these kinds of possible
problems.
The general pattern continued for the 2010 wave. The official report of top-line results for that
wave noted with some disappointment,
A fundamental aspect of developing in a job is having the opportunity to tackle cognitive
challenges at work—for instance, learning new things, solving unforeseen problems on
one’s own, or performing complex tasks. This is important both for workers’ own well-
being, and for companies to ensure that they continually upgrade their in-house capacity
to create and innovate. Broadly speaking, there has been no marked improvement over
time in this respect.32
Not all indicators in the EWCS that might be related to cognitive demands show such stability.
Table III.2 shows trends in the percentage of employees spending at least one-quarter of their
work time using a computer on the job. Both the question and the response options relating to
time spent are concrete. Computer use rose nearly one percentage point per year between 1990
and 2005 in the EU and is the strongest trend among all the EWCS measure examined here.33
Whereas 35.7% of employees in EU countries used computers in 1990, the share rose to 49.1%
in 2005. There is significant cross-sectional variation across countries, in generally expected
ways, as well. Obviously, the computer item differs from the others in referring to a specific,
material object and is unlikely to be open to the same degree of subjective interpretation as the
more general items in the previous table. Nevertheless, computers are considered one of the
main drivers of recent skill changes and it is notable that the strong growth in computer use in
these data is not accompanied by a similarly strong trend in cognitive job demands using the
previous measures.
Rather unexpectedly, the principal item on interpersonal demands in the EWCS—spending at
least one-quarter of their work time dealing directly with people who are not employees at their
workplace, such as customers, pupils, and patients—exhibits no obvious trend between 1995 and
2005.
32
“Changes over time – First findings from the fifth European Working Conditions Survey.” European Foundation
for the Improvement of Living and Working Conditions.
http://www.eurofound.europa.eu/pubdocs/2010/74/en/1/EF1074EN.pdf 33
Although the EU averages for 1990 and 1995-2005 refer to slightly different groups of countries, restricting the
latter to the EU-12 barely alters the results.

38
Table III.2 Trends in computer use and interpersonal job requirements in the EU, 1990-2005
Computer use Public contact
1990 1995 2000 2005 1995 2000 2005
EU 35.7 41.8 43.7 49.1 65.1 61.1 65.4 Anglo-Saxon Ireland 37.8 39.1 47.0 53.4 70.9 62.6 71.6 UK 43.4 57.7 56.0 53.4 77.7 71.1 69.1 Continental Austria -- 39.2 38.2 45.8 64.8 62.7 64.1 Belgium 33.8 39.5 48.1 63.0 61.0 63.5 63.4 Germany 33.7 39.6 39.8 49.4 59.7 54.7 62.9 France 35.1 35.5 42.1 46.9 70.7 65.0 67.2 Luxembourg 34.2 42.7 48.9 57.8 63.3 57.5 65.5 Netherlands 44.2 56.0 62.2 70.7 71.3 72.8 67.8 Nordic Denmark 39.9 42.1 45.1 63.1 70.2 69.4 77.8 Finland -- 49.8 54.9 60.4 69.9 73.1 71.9 Sweden -- 49.2 49.7 72.1 79.1 73.8 78.0 Southern Europe Greece 16.6 15.7 25.7 30.3 59.2 61.2 58.3 Italy 34.6 33.4 38.5 43.6 56.9 61.6 64.6 Spain 25.2 28.1 28.8 40.4 58.0 49.3 63.0 Portugal 22.7 26.8 29.1 34.9 55.2 41.0 60.8
Note: Figures are percentages saying they spend at least one-quarter of their time working with computers and dealing directly with people who are not employees at their workplace, such as customers, pupils, and patients. Wage and salary workers only. Country means use country- and year-specific post-stratification weights; EU-15 means adjust those weights by the relative size of each country’s workforce for each year derived from the European Labour Force Survey. Only EU-12 countries participated in the 1990 survey wave, so figures are unavailable for Austria, Finland, and Sweden for that year. Source: Author’s tabulations from the European Working Conditions Survey. from Handel (2012, p.52)
Table III.3 shows trends for five indicators of physical job requirements from the EWCS. These
questions are generally more concrete than the cognitive skill items, which may account for the
generally lower rates of positive responses. The first three are closely connected to blue-collar
jobs: (1) spending at least half of work time carrying or moving heavy loads, (2) machine-paced
work (1=yes), and (3) exposure to vibrations from tools and machinery for at least one-quarter of
work time. Although the failure to define “heavy loads” in terms of actual weight represents a
missed opportunity, the EWCS response options relating to time spent for the first and third
items are much better than other common alternatives that are less concrete (e.g., rarely,
sometimes, often, always).

39
Table III.3 indicates approximately 15-25% of EU workers carry heavy loads for at least half of
their work time, experience machine-paced work, and work with machinery exposing them to
vibrations for at least one-quarter of work time. Focusing specifically on changes rates, there
appears to be no trend for carrying heavy loads for 1990-2005. Jobs in the EU-15 that are
machine-paced and exposed to machine vibrations decreased modestly by 4.0 and 2.6 percentage
points for the ten-year period 1995-2005, respectively. Most likely this reflects the secular
decline in manufacturing employment.
The final two EWCS physical demand measures are less closely tied to blue-collar occupations,
(4) spending at least half of work time making repetitive hand or arm movements and (5)
whether the job involves monotonous tasks (1=yes). Approximately 40-50% of employees
report that their jobs require repetitive motions for at least half of their workday and that their
jobs involve monotonous tasks. Although one might expect the repetitive motion item is
particularly applicable to assembly-line and similar physical work, the item clearly elicits more
general assent. It is likely that computer users, clerical workers, and workers in retail, food
service, and other routine services responded positively to both of these items.34
Neither of these
measures shows clear trends for 1995-2005.
For all of the physical demand measures in Table III.3, top line results from the EWCS 2010
wave also showed trends that were either flat or moved in the opposite direction from what
would be expected from the automation and skills upgrading perspective, except for a slight
decline in the prevalence of machine-paced work.
In independent analyses, Greenan, Kalugina, and Walkowiak (2013) combined groups of EWCS
indicators using a form of factor analysis. Consistent with the preceding, they found “The
average EU-15 trends over 1995-2005 combine increased physical strain with increased work
intensity, and decreased work complexity” (p.406). It should be noted that their descriptive
trends were measured net of broad occupation and industry, i.e., they represent within-cell
shifts.35
In regression analyses, the trends persist after controlling for worker age and gender,
type of employment contract, supervisory status, computer use, and country-level
macroeconomic conditions and other variables (Greenan et al. 2013, pp.413ff.). Computer use is
associated with both decreased physical strain and increased work complexity, consistent with
expectations (Greenan et al. 2013, p.417). However, these results and the growth in the
prevalence of computer use shown in Table III.2 would lead one to expect the descriptive trends
would have moved in the opposite direction from what was actually observed, so the regression
34
The item on monotony may be better considered as a measure of cognitive job skill requirements and perhaps job
satisfaction, as well, given the inevitably subjective quality of the judgment it seeks from respondents. 35
The authors regressed factors on 1-digit occupation and industry and examined trends for the residuals (Greenan
et al. 2013, p.406).

40
Table III.3 Trends in physical and related job requirements in the EU, 1990-2005
Heavy loads Machine paced Vibrations Repetitive motions Monotonous tasks 1990 1995 2000 2005 1995 2000 2005 1995 2000 2005 1995 2000 2005 1995 2000 2005
EU 15.4 18.7 23.1 18.9 22.5 22.1 18.5 24.0 23.6 21.4 44.2 43.5 49.2 45.4 39.3 42.5 Anglo-Saxon Ireland 17.0 17.1 20.0 17.2 27.0 26.0 12.7 20.4 22.3 16.0 39.8 46.9 41.7 58.4 51.7 45.2 UK 16.2 18.3 24.8 18.1 27.0 22.8 20.8 15.8 16.9 14.4 52.3 44.5 46.9 68.0 57.5 57.5 Continental Belgium 14.7 20.0 20.3 14.6 16.9 19.0 15.6 19.7 20.2 13.6 44.1 40.9 39.0 36.8 31.4 31.7 Germany 14.7 17.6 21.3 16.1 20.2 21.7 17.7 28.2 27.0 26.8 37.3 34.5 42.7 33.9 26.5 29.3 France 20.4 25.0 28.5 27.9 23.1 21.3 19.2 22.8 22.7 22.4 53.1 57.3 60.2 49.6 42.6 44.7 Luxemburg 12.6 14.6 19.9 18.0 26.6 23.7 15.5 25.6 20.0 19.5 35.3 41.9 49.6 42.8 30.6 36.7 Netherland 11.4 14.4 15.0 10.8 21.6 16.8 12.1 13.0 13.4 13.1 50.7 53.3 46.1 32.9 27.3 23.2 Austria -- 22.7 21.7 22.9 20.5 18.4 21.1 26.4 25.0 22.9 42.6 40.1 51.8 31.7 27.8 3.00 Nordic Denmark 13.6 17.6 16.5 13.1 14.3 12.5 12.0 15.5 14.7 14.3 38.3 39.3 50.8 39.5 37.4 42.3 Finland -- 14.6 16.3 19.5 22.1 18.9 20.8 21.6 24.1 20.2 55.0 58.9 72.5 46.2 46.6 47.9 Sweden -- 18.0 23.4 15.6 12.0 9.0 6.5 13.9 17.5 11.8 29.0 50.0 50.1 26.6 26.8 18.7 Southern Europe Greece 18.6 19.8 23.9 27.1 28.8 22.3 18.7 32.0 24.9 28.7 62.2 57.7 69.8 63.2 53.2 57.5 Italy 8.2 12.8 15.4 12.5 24.4 22.7 17.7 20.5 24.7 18.2 43.8 42.7 53.4 48.0 36.2 43.5 Spain 18.8 21.7 29.9 24.1 25.2 29.0 17.6 30.0 32.4 19.5 54.2 62.8 55.4 63.5 60.7 64.2 Portugal 17.7 15.3 19.2 19.0 27.0 21.0 25.7 29.9 30.4 28.6 58.6 53.9 63.9 47.0 42.9 51.7
Note: Figures are percentages saying they spend at least one-half of their time working carrying or moving heavy loads and making repetitive hand or arm movements, at least one-quarter of their time “exposed to vibrations from hand tools, machinery, etc.,” and answered “yes” to questions asking whether their work pace is “dependent on the automatic speed of a machine or moving of a product” and whether their job involved “monotonous tasks” or not. Wage and salary workers only. Country means use country- and year-specific post-stratification weights; EU-15 means adjust those weights by the relative size of each country’s workforce for each year derived from the European Labour Force Survey.
Only EU-12 countries participated in the 1990 survey wave. Source: Author’s tabulations from the European Working Conditions Survey. from Handel (2012, p.55)

41
results only add to th e issue that must be explained. Institutional explanations face the difficulty
of accounting for the fact that the strongest declines in work complexity occurred in the UK,
Germany, Spain, and Italy (Greenan et al. 2013, p.421), which cross multiple country groupings
in the varieties of capitalism literature, for example. The authors conclude, “Our statistical
analysis identifies a complexity paradox and leaves it unresolved” (ibid.).
The preceding is also broadly supported by more recent work using on the EU-15 that includes
the latest EWCS wave for 2015. Bisello et al. combine indicators into scales that have been
normalized to 0-1 interval (2019, p.12). Table III.4 shows trends and the absolute and
percentage changes, as well as whether the trends accord with the expectations in most of the
research literature. (Because the variables are scales with transformed metrics, magnitudes are
not directly comparable to values in the preceding tables.) Again, cognitive complexity,
measured by the problem solving scale, shows no change over two decades, while both
interpersonal requirements and physical strength requirements declined.36
Contrary to
expectation, task repetitiveness and monotony increased. The largest changes, consistent with
expectation, are decreased engagement with machinery and increased computer use. In fact, the
growth in computer use is the biggest change over the past twenty years by a very wide margin.
This presents a difficulty for arguments that information technology has revolutionary effects on
jobs. The trend in IT diffusion is very strong but it seems to translate into modest or even
counter-intuitive trends in the job characteristics it is believed to influence.
Table III.4 Trends in job requirements in the EU, 1995-2015
1995 2015 20-year Δ Δ pct. Expected
Problem solving 0.722 0.721 -0.001 -0.1% No
Dealing with people 0.591 0.551 -0.040 -6.8% No
Physical strength 0.249 0.231 -0.018 -7.3% Yes
Repetitiveness 0.410 0.433 0.023 5.6% No
Machine use 0.183 0.145 -0.038 -20.8% Yes
Computer use 0.270 0.444 0.174 64.2% Yes
Source: All values are scale scores over 0-1 interval. The third column shows the absolute change over twenty years and the fourth column expresses changes as a percent of the initial value in 1995. All changes over time are significant except problem-solving (p<0.01). From Bisello et al. (2019, p.13).
Breakdowns of these trends by 1-digit occupation show few strong patterns; most trends are
rather similar across occupations. Notable exceptions include a concentration in the decline in
physical demands among farm workers, perhaps indicating more capital intensive methods,
while declines among operators and laborers are smaller, and skilled workers actually report
36
This physical strength scale uses different EWCS variables than Greenan et al.’s physical strain scale, which may
account for the different results.

42
greater physical demands over the period (Bisello et al., p.27). Obviously, automation, or
increased mechanization, may be relieving physical burdens in these jobs, and there is always the
problem of selection bias given that the most automated jobs will disappear from the sample.
Nevertheless, labor force statistics do not indicate accelerated declines in blue-collar jobs in
these countries since 2000 (Handel 2012), so it is notable that their task content has remained
relatively stable despite the presumed advance in computer-assisted equipment.
Computer use increased most in absolute terms among all groups of white-collar workers,
especially the more skilled. However, most of the same groups report the greatest increase in
repetitive and monotonous tasks, most of the large declines in dealing with people, and no
meaningful change in the level of problem solving (Bisello et al., pp.27f.). The authors conclude
that computers may be shifting the occupational distribution in the direction of jobs involving
more social interaction and less repetitiveness, as results in the next section illustrate, but that
these effects are more than offset by the decline of social tasks within jobs due to computer-
mediated communication and the increase in repetitive tasks due to computer-driven work
rationalization (Bisello et al., pp.33f.).
Although there are few similarly rich sources of microdata for the United States, one exception is
in the area of physical demands. Three waves of the International Social Survey Program (ISSP)
(1989, 1997, 2005) asked workers how often they performed “hard physical work” as part of
their job; responses were on a 5-point scale using vague quantifiers (1=never, 5=always). In
both the U.S. and most other advanced economies, about 20-25% of workers across years said
they perform hard physical work “often” or “always” on their jobs, consistent with the EWCS.
Aside from the high level in South Korea, there are no clear patterns by country, region, or
period. Anomalously, the United States shows a slight rise in the percentage of workers saying
their job involves hard physical work between 1997 and 2005. The general impression,
however, is relative stability. This is reinforced by the cross-country averages for eight- and
sixteen-year panels at the bottom of the table, which show pooled means for all countries for
which data are available in the given interval. The bottom line (“All countries”) shows pooled
means for all countries in each year for comparison.
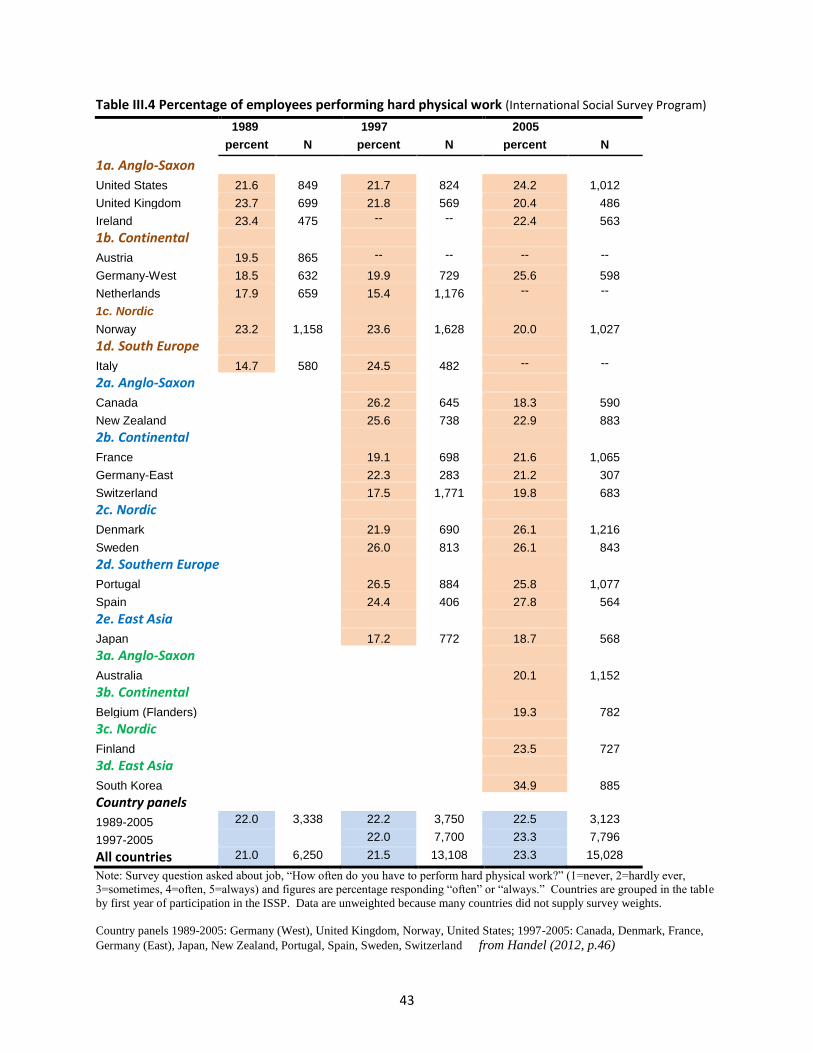
43
Table III.4 Percentage of employees performing hard physical work (International Social Survey Program)
1989 1997 2005
percent N percent N percent N
1a. Anglo-Saxon
United States 21.6 849 21.7 824 24.2 1,012
United Kingdom 23.7 699 21.8 569 20.4 486
Ireland 23.4 475 -- -- 22.4 563
1b. Continental
Austria 19.5 865 -- -- -- --
Germany-West 18.5 632 19.9 729 25.6 598
Netherlands 17.9 659 15.4 1,176 -- --
1c. Nordic
Norway 23.2 1,158 23.6 1,628 20.0 1,027
1d. South Europe
Italy 14.7 580 24.5 482 -- --
2a. Anglo-Saxon
Canada 26.2 645 18.3 590
New Zealand 25.6 738 22.9 883
2b. Continental
France 19.1 698 21.6 1,065
Germany-East 22.3 283 21.2 307
Switzerland 17.5 1,771 19.8 683
2c. Nordic
Denmark 21.9 690 26.1 1,216
Sweden 26.0 813 26.1 843
2d. Southern Europe
Portugal 26.5 884 25.8 1,077
Spain 24.4 406 27.8 564
2e. East Asia
Japan 17.2 772 18.7 568
3a. Anglo-Saxon
Australia 20.1 1,152
3b. Continental
Belgium (Flanders) 19.3 782
3c. Nordic
Finland 23.5 727
3d. East Asia
South Korea 34.9 885
Country panels
1989-2005 22.0 3,338 22.2 3,750 22.5 3,123
1997-2005 22.0 7,700 23.3 7,796
All countries 21.0 6,250 21.5 13,108 23.3 15,028
Note: Survey question asked about job, “How often do you have to perform hard physical work?” (1=never, 2=hardly ever,
3=sometimes, 4=often, 5=always) and figures are percentage responding “often” or “always.” Countries are grouped in the table
by first year of participation in the ISSP. Data are unweighted because many countries did not supply survey weights.
Country panels 1989-2005: Germany (West), United Kingdom, Norway, United States; 1997-2005: Canada, Denmark, France,
Germany (East), Japan, New Zealand, Portugal, Spain, Sweden, Switzerland from Handel (2012, p.46)

44
In more recent years the General Social Survey (GSS) modules on quality of work life asked
respondents to “rate the overall physical effort at the job you normally do.” About 20% of
workers in both 2010 and 2014 said their job involves “very hard” or “hard” physical effort and
about another quarter said their work is “somewhat hard” in terms of physical effort (Table
III.5). Interestingly, the proportions giving each of the polar responses declined and more
workers say the physical effort is “hard” or “somewhat hard” compared to the other options.
Nevertheless, both the observed change over the four years (column 3) and implied decadal rate
of change (column 4) suggest the net changes are relatively modest, reinforcing the conclusions
from the ISSP and EWCS. If the response options are assigned scores (1=very light, 5=very
hard), the average level of physical effort rises from 2.49 to 2.51 over four years (not shown).
Table III.5 Trends in Overall Physical Effort on the Job in the U.S. (2010-2014)
2010 2014 Δ 10-year Δ
Very hard 8.7 7.2 -1.5 -3.75
Hard 11.5 13.2 1.7 4.25
Somewhat hard 25.4 27.2 1.9 4.75
Fairly light 28.4 27.7 -0.7 -1.75
Very light 26.1 24.7 -1.4 -3.50
Total 100.0 100.0
N 1,159 1,241
Note: Author’s calculations from General Social Survey (Smith, Marsden, Hout 2016, p.1495).
In an indication of the influence of question and response formats, Table III.6 presents results
from the RAND survey that modeled itself on the EWCS. However, instead of using one-half or
more of worktime as the cutoff for defining physically demanding work, as in Table III.3, RAND
chose to use one-quarter or more of worktime as the line dividing physically demanding jobs
from those with low demands.37
Obviously, the more lenient cutoff yields rates of physically
demanding work that are much higher than those presented above, and are most comparable to
the total responding positively to the first three options in the GSS, rather than the first two.
Table III.6 Physical demands by gender and education in the U.S., 2015 (percentage)
Percentage whose main Non-college College
job involves: All Male Female Male Female Male Female
Moving heavy loads or people 45.1 53.7 34.7 67.9 42.9 27.2 22.3
Tiring or painful positions 40.9 46.1 34.8 56.6 42.9 26.3 22.2
Repetitive hand/arm movements 74.8 74.1 75.6 81.5 80.6 60.2 68.0
Note: Figures are percentages saying they spend at least one-quarter of their time on their job carrying or moving heavy loads, in tiring/painful positions, or making repetitive hand or arm movements. Source: Maestas, et al. (2017), p.29.
37
The response options in both the EWCS and the RAND survey permit either cutoff to be used; the choice is a
matter of judgment.

45
The EWCS, ISSP, and GSS results for trends in physical job demands are surprising given the
general belief that physical demands are declining due to both compositional shifts in the
occupational structure and to effort-saving technological changes within occupations, such as
automation (Zuboff 1988). Nevertheless, validation exercises indicate response patterns by
broad occupation and personal education are generally sensible (Handel 2012). In a simple OLS
model for the long panel of ISSP countries, 4-digit ISCO38
occupation dummies entered alone
accounted for a large share of the item’s variance (adj. R2 = 0.41), while a model with only
worker characteristics (education, experience, gender, marital status) accounted for a much
smaller proportion (adj. R2 = 0.13) (Handel 2012, p.47f.). The item seems to function sensibly
when cross-validated against broad occupation and personal education, showing a much stronger
relationship with occupation than personal education, as one would expect.
Trend analyses using ordinal logit models confirm self-reported physical job demands did not
decline over time for ISSP respondents in the United States and were either flat or trended
downward modestly for other countries (Handel 2012, p.47). Though unexpected, these weak
findings are within the range found in other studies for this period for the U.S. (Johnson, 2004;
Steuerle, Spiro, and Johnson 1999) and UK (Felstead et al. 2007, pp.87ff. and see below).
However, it is quite possible that there are methodological problems with the items in the ISSP
and EWCS, which appear rather vague, overly general, and consequently open to varying
interpretations by respondents.39 Survey items that are more concrete and carefully crafted might
show different temporal patterns, but there are few other repeated cross-sectional surveys in any
country with a consistent set of job measures.
Finally, the British Skills and Employment Survey (SES) has a very rich set of skill measures for
five waves (1997-2017), and data for a smaller set of measures from an additional two waves
(1986, 1992).40
Three key items are the job’s required level of education, whether and for how
long workers participated in job training for their line of work, and how long it took workers to
learn to do their job after they were hired (see exact text below).
Required education: “If they were applying today, what qualifications, if any, would
someone need to get the type of job you have now?” (coded into levels 0-4)
Training time: “Since completing full-time education, have you ever had or are you
currently undertaking, training for the type of work you currently do?” (coded into time
intervals)41
38
ISCO = International Standard Classification of Occupations 39
Some of these problems and other challenges of cross-national surveys are recognized within the EWCS project
(Parent-Thirion et al. 2007, p.97). 40
See Felstead et al. (2007) for extensive background on the SES. 41
Codes are none, < 1 month, < 3 months, 3-6 months, 6-12 months, one to two years, and >two years

46
Job learning time: “How long did it take for you after you first started doing this type of
job to learn to do it well?” (coded into similar time intervals)
The five levels of required education have been characterized as “no qualifications, poor lower
secondary, lower secondary, upper secondary, non-degree higher education and degree-level
higher education” (Gallie, Felstead, Green 2003, p.408). This is a simplified characterization of
what appears to be a relatively complicated set of coding decisions.42
Trends for these three variables for thirty-one years appear as Figure 2 below, reproduced from
Henseke, et al. (2018). The share of jobs requiring higher education rose strongly and relatively
consistently from 20% to 38%, or 5.9 percentage points per decade. Correspondingly, the share
of jobs not requiring any level of education declined from 37% to 23%, or -4.7 percentage points
per decade. The trends in the shares of the intermediate levels 1-3 show much narrower and less
systematic change. Appendix 2 contains figures showing trends for all values of this and most
other SES skill variables discussed here. The general pattern is clearly in the direction of
upgrading, more or less smooth, with no sign of acceleration over time.
Trends in job training and learning times are much more erratic, exhibiting a sawtooth pattern.
Values for both series fluctuate by two or three months for little apparent reason after 1992, and
moved consistently downward in the decade after 2006. By 2017 values had fallen back to their
initial levels from thirty-one years earlier in 1986. There is no obvious trend in these raw series,
though analyses may reveal patterns that are masked by compositional changes over time.
However, any such underlying trend is likely to be negative because the occupational structure
and the level of required education have both moved in the opposite direction toward more
cognitively complex jobs.
It is also possible that training times and on-the-job learning times are declining because more
job-relevant knowledge is acquired in formal education. However, the study authors report that
“the recent trend cannot be explained solely on the basis of compositional shifts that have
increased the proportion of more educated workers and jobs because the halting and reversals are
found within those groups, as well” (Felstead et al. 2013).
42
For a detailed mapping of British educational attainment into the different levels used in the survey, see Alan
Felstead, et al. (2007, p.38).

47
from Henseke, et al. (2018)
In 1997, the SES added a battery of 36 items asking the importance of job tasks covering
cognitive, interpersonal, and physical demands, among others. Workers responded on a 5-point
scale: not at all important/does not apply (0), not very important (1), fairly important (2), very
important (3), and essential (4). The study authors combined related indicators into scales and
scored workers as high-level users of skills if they said they were either “essential” or “very
important.” Figure 1, from Henseke, et al. (2018), shows trends for high-level use of literacy,
numeracy, problem solving, interpersonal skills, self-planning (autonomy), and computers over
the past twenty years. Again, computer use shows the strongest and most consistent growth,
while high-level literacy and numeracy have both the lowest prevalence and the weakest growth
in the past ten years. High-level use of social skills was among the most prevalent skill and grew
relatively consistently until 2012. The trend for complex problem solving has been relatively flat
since 2006. While the overall picture is mixed, it seems clear that most job demands have not
grown as robustly as technology use, and growth was generally weaker in the past ten years than
previously, rather than accelerating. The authors conclude,
“….these patterns indicate a slowdown in the demand for high level generic skills since
2012. This contrasts with an unbroken growth of high-level computer use since 1997…
This picture of a stagnating or even reversing demand for skills receives support from
trends in qualification requirements and learning and training times” (Henseke, et al.
2018, p.3).

48
The researchers also find the percentage of respondents saying they needed more computer skills
to perform their job more effectively fell by half from 25% (2001) to 12% (2017). “The skills
bias nature of ICT may thus have been transitory. As has been suggested in other research, the
maturing of ICT and its more widespread use, makes the adoption of new vintages of general
purpose ICT a familiar and less skills-intensive process” (Henseke, et al. 2018, p.5).
Because the previous figures represent a small selection of skill variables available in the SES
and they are presented in condensed scales, Table III.6 presents the complete distributions for 23
variables at ten-year intervals, as well as the total percentage point change over the period and
average ten-year growth rates. Appendix 2 graphs values for all available waves for a selection
of the variables in Table III.6 so that any patterns masked by the selection of time points in the
table are visible. The variables in the table are grouped into cognitive items (entries 1-12),
interpersonal items (entries 13-16), physical items (17-20), autonomy (21), and computer and
internet use (22-23).43
Because of the recency of the 2017 wave a number of these distributions
appear in this paper for the first time.44
Although there are no obvious criteria for deciding what rate of change is rapid rather than
gradual, the table highlights all ten-year growth rates that equal or exceed 3.5 percentage points
in absolute value as a reasonable cut point. By this standard, required education changed rather 43
Internet use is available only in the 2001 and 2006 waves. 44
I thank Alan Felstead, co-principal investigator of the Skills and Employment Survey, for kindly providing
tabulations of skill variables for all survey years, which were used to construct Table III.6 and figures in Appendix2.

49
rapidly over thirty-one years. There has been meaningful declines in the share of jobs for which
reading and writing are not at all important and in the lowest levels of math and problem solving.
The interpersonal and the physical tasks generally did not change very rapidly, though tool use
declined, while use of computers and the internet grew fastest of all by generally wide margins.
Thus, the SES presents another case of fast-growing technology and more gradual and uneven
change in the nature of work tasks that are believed to be influenced by these technologies.
Again, because the SES is worker-level data, the raw frequency distributions reflect both
components of change, shifts in task content within occupations and changes in occupational
shares of employment.
The SES also asked workers about technical change on their jobs, finding that “the incidence of
technical change has been falling continuously since 2001 in high-skilled occupations and since
2006 across all occupation groups” (Henseke, et al. 2018, p.5). This raises the possibility that
technological change is indeed linked to skill change but did not advance as rapidly since 2000
compared to the 1990s, possibly explaining the stagnation in skill demands, as well. While this
hypothesis deserves further research, it is not consistent with the more general belief that
technological change has accelerated over time and is driving ever more rapid changes in job
skill requirements.
Figures in Appendix 2 plot the full distribution of responses for key items across all waves. The
temporal patterns are diverse and there are both abrupt jumps and plateaus at points that are not
necessarily expected. Only the decline in essential tool use (20) and perhaps the growth in
essential people skills (13) show acceleration over time. Many lines are flat, fluctuate without
obvious trend, or show strong movement for 1997-2006 and then remain largely flat for 2006-
2017. The main exception is required education, which shows relatively smooth growth in the
highest level and decline in the lowest level, as noted. The technology items show the greatest
absolute change, though growth in the importance of computer use (22) does flatten after 2006,
as well. No figure suggests the kind of dramatic acceleration of trends associated with
invocations of Moore’s Law and exponential growth. At least in the area of job content and skill
requirements, it is not the case that “everything is changing faster and faster.”
One possible issue worth noting is that both the EWCS items and the SES questions framed in
terms of “importance” tend to be less concrete and may require more judgment from respondents
than the required education and learning and training times. As the SES researchers note, the
scale points on the “importance” questions are not anchored by examples, “so comparisons
between people rely on an assumption that there is a common understanding of the notion of
‘importance’ among respondents and between respondents and researchers” (Felstead 2007,
p.13). In fact, respondents appear to have a bias toward selecting high values on the importance
scales. The SES labels “stretch” the upper end of the response scale, distinguishing multiple
levels of high importance, because pilot testing showed “otherwise respondents tended to bunch
at the top of the scale” (ibid.).

50
Table III.6 Trends in job skill requirements, British Skills and Employment Survey (percentage distribution)
1986 1997 2017 total Δ
10-yr avg. Δ
1997 2017 total Δ
10-yr avg. Δ
1. Education required 4. Reading short documents
None 37 31 23 -14 -4.7 essential 35 40 5 2.6
Level 1 8 9 7 -1 -0.3 very important 29 29 0 0.2
Level 2 19 20 16 -3 -1.0 fairly important 17 17 0 0.0
Level 3 16 14 16 0 0.0 not very imp. 9 8 -1 -0.4
Level 4 20 26 38 18 5.9 not important 10 6 -5 -2.4
2. Job learning times
5. Reading long documents
< 1 month 27 21 22 -5 -1.5 essential 22 29 6 3.2
1-3 months 17 17 16 -1 -0.4 very important 21 22 1 0.5
3-6 months 12 11 13 1 0.3 fairly important 21 20 -1 -0.7
6 months-1 yr. 10 14 14 4 1.3 not very imp. 15 16 2 0.8
1-2 years 9 11 14 5 1.6 not important 20 12 -7 -3.7
>2 years 25 26 20 -4 -1.4
3. Job training times
6. Writing short documents
None 53 41 46 -7 -2.3 essential 24 31 7 3.3
< 1 month 7 9 15 7 2.3 very important 23 26 3 1.7
1-3 months 6 6 5 -1 -0.2 fairly important 19 18 0 -0.2
3-6 months 3 4 4 1 0.4 not very imp. 13 13 0 -0.2
6 months-1 yr. 4 4 5 1 0.4 not important 21 11 -9 -4.6
1-2 years 5 6 6 2 0.5
>2 years 23 30 19 -3 -1.1 7. Writing long documents
essential 15 23 8 4.1
The following items complete the question stem, “In your job, how important is….”
very important 14 20 6 2.9 fairly important 15 16 1 0.7 not very imp. 21 20 -1 -0.5
not important 35 20 -14 -7.2
Note: Total Δ = difference between percentage in 2017 and in 1987 or 1997. This value is converted into the average decadal change rates in the next column.

51
Table III.6 Trends in job skill requirements, British Skills and Employment Survey continued
1997 2017 total Δ
10-yr avg. Δ
1997 2017 total Δ
10-yr avg. Δ
8. Simple arithmetic 12. Specialist knowledge
essential 33 30 -3 -1.6 essential 41 51 10 5.1
very imp. 19 20 2 0.8 very imp. 29 28 0 -0.2
fairly imp. 18 20 2 1.2 fairly imp. 17 11 -6 -2.8
not very imp. 12 17 5 2.5 not very imp. 6 5 -1 -0.5
not imp. 18 12 -6 -2.9 not imp. 7 4 -3 -1.6
9. Decimals, pcts, fractions 13. Dealing with people
essential 25 25 0 0.2 essential 61 68 7 3.5
very imp. 13 17 4 2.0 very imp. 23 20 -3 -1.3
fairly imp. 15 17 2 1.1 fairly imp. 9 8 -2 -0.8
not very imp. 17 21 4 1.9 not very imp. 4 3 -1 -0.5
not imp. 30 19 -10 -5.1 not imp. 3 1 -2 -0.9
10. Advanced math 14. Working with a team
essential 10 13 3 1.4 essential 43 50 7 3.6
very imp. 7 12 5 2.6 very imp. 30 28 -2 -1.2
fairly imp. 12 15 3 1.4 fairly imp. 15 12 -2 -1.2
not very imp. 22 27 5 2.4 not very imp. 5 5 0 0.2
not imp. 48 33 -16 -7.8 not imp. 7 4 -3 -1.4
11. Analyzing complex problems 15. Persuading/influencing others
essential 20 28 7 3.7 essential 18 23 5 2.5
very imp. 25 29 4 2.0 very imp. 26 28 2 0.9
fairly imp. 20 19 -1 -0.4 fairly imp. 25 24 -1 -0.6
not very imp. 14 13 -1 -0.3 not very imp. 14 14 1 0.3
not imp. 21 11 -10 -5.0 not imp. 17 11 -6 -3.1

52
Table III.6 Trends in job skill requirements, British Skills and Employment Survey continued
1997 2017 total Δ
10-yr avg. Δ
1997 2017 total Δ
10-yr avg. Δ
16.Counseling/advising/caring 20. Knowledge of tools
essential 37 34 -3 -1.5 essential 35 27 -9 -4.3
very imp. 21 24 3 1.4 very imp. 18 19 0 0.2
fairly imp. 12 16 3 1.7 fairly imp. 15 13 -2 -1.2
not very imp. 7 10 2 1.1 not very imp. 11 16 5 2.6
not imp. 23 17 -5 -2.7 not imp. 21 26 5 2.7
17. Physical strength 21. Planning own activities
essential 16 16 0 -0.1 essential 34 39 4 2.1
very imp. 14 17 3 1.5 very imp. 32 32 -1 -0.4
fairly imp. 19 18 -1 -0.7 fairly imp. 18 17 -1 -0.4
not very imp. 20 21 1 0.3 not very imp. 9 8 -1 -0.3
not imp. 31 29 -2 -1.0 not imp. 6 4 -2 -1.1
18. Physical stamina 22. Using computer/computerized equipment
essential 17 20 3 1.4 essential 31 52 22 11.0
very imp. 19 20 1 0.7 very imp. 15 17 2 1.2
fairly imp. 23 19 -4 -2.1 fairly imp. 13 11 -1 -0.6
not very imp. 19 18 -1 -0.4 not very imp. 12 8 -3 -1.7
not imp. 22 23 1 0.4 not imp. 30 11 -20 -9.9
19. Skill/accuracy in using hands/fingers
2001 2006 total Δ 10-yr
avg. Δ
essential 26 22 -4 -2.2 23. Using the internet
very imp. 15 19 5 2.3 essential 13 28 15 29.3
fairly imp. 14 14 -1 -0.3 very imp. 11 15 5 9.2
not very imp. 17 20 3 1.6 fairly imp. 14 14 0 0.5
not imp. 28 25 -3 -1.4 not very imp. 16 14 -2 -4.9
not imp. 46 29 -17 -34.0

53
This may reflect the tendency of respondents to interpret less concrete and more general phrasing
in terms of their own personal frames of reference rather than using a common standard. This
may bias means upward in the cross-section if workers rate their jobs more generously than
would a job analyst or similar expert. Likewise, estimates of trends may be biased downward if
respondents tend to gravitate to certain response options on a consistent basis over time despite
changing objective conditions. This has long been recognized as a puzzle with measures of job
satisfaction, which have remained quite stable since the 1950s despite large changes in working
conditions (Handel 2005a). For example, respondents may lower their standard for what they
consider “hard physical work” over time as the most objectively demanding physical work
disappears. If the standard for what counts as hard physical work declines, then its measured
prevalence may remain unchanged over time even though jobs have become less physically
demanding in objective terms. In this way, self-reports in response to less explicit questions may
exhibit a bias toward stability over time, as responses hover around a fixed set-point.
Nevertheless, while concern over shifting standards of responding is important, it cannot account
for the patterns in the SES training time and job learning time items, which are quite concrete
items. Measurement issues are also unlikely to explain temporal patterns for many other items,
as well.
B. Trends due to changes in occupational employment shares
The U.S. does not have a data collection program like the EWCS or SES with microdata for skill
variables collected consistently over decades. However, one-digit occupation can be seen as a
coarse, ordinal measure of overall skill requirements. Specific skills are not identifiable and
there are no measures of distances between broad occupational groups, but the time series is long
and complete, though changes in occupational classification systems can present problems.
Nevertheless, changes in employment shares by broad occupation undoubtedly capture a
significant portion of the total change over time, albeit crudely.
Trend data on the sizes of detailed occupations provide much finer detail. However, detailed
occupation is a nominal variable that cannot be ranked reasonably well using informal methods,
unlike 1-digit occupation. The DOT and O*NET both represent essentially cross-sectional
databases that can be combined with time series data on employment shares for detailed
occupations to yield quantitative estimates of changing job skill requirements due to changes in
occupational composition.
1. Trends in the occupational composition of jobs
Occupational change is not new and historical data make clear the need to distinguish recent
developments from long-run, secular trends. Census studies using data for 1900-1950
documented the growth of white-collar occupations in the first half of the twentieth century
(Kaplan and Casey 1958). More detailed research showed the rising ratio of non-production

54
workers to production jobs within manufacturing (Melman 1951), the rise of a managerial cadre
(Bendix 1956, pp.211ff.; Chandler 1977), and growth of knowledge workers (Bell 1973; Reich
1991). Although there have always been dissenting voices (e.g., Mills 1953; Braverman 1974),
the notion that long-run trends have favored occupational upgrading is not new. The question is
whether recent developments show any acceleration or other breaks with longstanding patterns.
Table III.7 shows historical series for the occupational composition of the U.S., Japan, Germany,
and other advanced OECD economies for 1950-2010.45
To increase comparability among
countries and within counties over time, the groups are slightly more aggregated than the
standard 1-digit occupation categories and the categories are coded to ISCO standards, which
may differ from national practices. “Professionals” includes associate professionals and
technical workers, and “production” workers include skilled trades, transportation workers,
operators, and laborers in a single broad group. All data are from official government censuses
and household and labor force surveys. Occupation codes have been harmonized to the greatest
extent possible, but there is no way to completely eliminate all non-comparability within and
across countries. Most trend calculations in the right panel are unaffected by the particular years
used as end points, but there are some exceptions, partly due to changes in occupational coding
schemes, so the precision of these numbers should not be overstated.
The left panel shows changes over nearly fifty years, beginning in 1960 because data are not
available for Germany for 1950.46
The share of professionals and managers in the U.S. increased
from 20% to over 37%, service workers grew from 12% to nearly 18%, while agricultural
workers fell 9 percentage points and production workers fell 14.6 percentage points to 20.3% of
the workforce. Aside from Japan, which has a very distinctive occupational distribution, the
other OECD countries also witnessed substantial growth in the upper white-collar occupations
and very large declines in agricultural and production workers. Countries outside the U.S. also
experienced stronger growth in clerical occupations.
In the early post-war period, production and related jobs represented the largest category in most
developed economies, though farm jobs remained numerous in southern Europe, Japan, South
Korea, and elsewhere. For many OECD countries, particularly the most advanced economies,
the share of blue-collar workers peaked at 40-50% of the workforce in the 1950s or 1960s and
declined thereafter to reach 20-25% in 2009.
45
Values for 2010 are extrapolated using growth rates for 2000-2009. 46
For other countries, figures for 1950 can be recovered by using the decadal change figures for 1950-60 in the right
panel to adjust the values for 1960.

55
Table III.7 Trends in broad occupation shares in USA, Japan, Germany, and other OECD countries, 1950-2010
Occupational distribution Decadal change in percentage points
1960 2009
50-60 60-70 70-80 80-90 90-00 00-10
USA Professional 10.5 21.9
Professional 1.6 2.8 1.5 1.8 2.0 2.7
Managers 9.6 15.4
Managers 0.6 0.0 0.8 1.4 1.3 1.2
Clerks 13.4 13.0
Clerks 0.9 2.6 0.7 -0.2 -1.2 -2.2
Sales 10.1 11.2
Sales 3.0 -0.2 1.1 0.8 -0.1 -0.3
Services 11.8 17.6
Services 1.5 0.3 1.0 -0.1 -0.2 2.7
Agriculture 9.7 0.7
Agriculture -2.9 -4.7 -1.3 -0.1 -0.1 -0.2
Production 34.9 20.3
Production -4.7 -0.7 -3.7 -3.6 -1.8 -3.8
JAPAN Professional 5.0 15.6
Professional 0.7 0.8 2.1 3.2 2.3 2.4
Managers 2.1 2.7
Managers -0.5 0.6 1.3 -0.1 -0.6 -0.6
Clerks 11.2 20.8
Clerks 2.8 3.6 1.9 1.9 1.5 0.8
Sales 13.4 13.8
Sales 1.4 -0.4 1.4 0.7 -0.9 -0.5
Services 6.1 12.9
Services 3.5 0.9 1.3 0.2 2.0 2.6
Agriculture 29.8 4.1
Agriculture -13.3 -12.5 -7.0 -3.1 -2.2 -1.0
Production 32.4 30.1
Production 5.4 6.9 -1.1 -2.7 -2.0 -3.8
GERMANY Professional 7.9 25.6
Professional - 3.1 3.3 3.1 2.0 3.8
Managers 3.3 5.1
Managers - -0.9 0.6 0.4 1.9 0.0
Clerks 12.4 20.4
Clerks - 7.4 1.2 1.2 0.2 -1.1
Sales 7.8 8.5
Sales - 2.1 -0.9 0.5 -2.5 0.3
Services 7.9 12.7
Services - 2.7 0.8 0.4 -3.1 1.9
Agriculture 14.1 2.9
Agriculture - -6.0 -3.2 -1.6 0.7 -0.4
Production 46.6 24.8
Production - -8.3 -1.8 -4.0 0.7 -4.4
Other OECD Professional 6.9 23.9
Professional 1.9 3.1 3.8 3.0 3.7 3.5
Managers 2.8 7.2
Managers -1.9 0.6 0.2 1.6 2.0 0.0
Clerks 8.9 15.5
Clerks -1.0 3.1 1.9 1.1 0.7 -0.4
Sales 8.0 10.0
Sales 2.4 0.3 0.6 0.9 -0.3 0.5
Services 8.7 14.2
Services 1.1 -0.1 1.8 0.5 1.7 1.5
Agriculture 28.3 6.4
Agriculture -7.5 -7.2 -5.8 -3.6 -3.6 -1.7
Production 36.6 22.9
Production 2.6 0.9 -3.0 -3.9 -4.4 -3.3
Note: Professionals include technical workers and associate professionals, and production includes all blue-collar. From Handel (2012, p.34)
56
During this time, the employment share of professionals, technical, and associate professionals
grew rapidly in many, but not all, countries to the point where this group overtook production
workers as the largest of the seven broad occupational groups in most of the advanced OECD
countries. This reflected both employment growth in industries that make intensive use of
professionals (e.g., education, health, information, high tech, finance, professional and business
services) and increasing employment of professionals within industries more generally.
Managers grew less rapidly, but when the two groups are taken together, these high-skilled
white-collar jobs accounted for about 32-40% of all jobs in 2010 compared to 7-20% of jobs in
1960. This represents a large plurality but remains short of a majority, and includes jobs
spanning a range of the skill continuum, a point addressed in the next section.
In the United States, the share of the two upper white-collar groups grew by 2.40 percentage
points per decade prior to the computer revolution (1950-1980) and by 3.47 percentage points
per decade subsequently (1980-2010). How much significance to attribute to this difference is
unclear, as there are no obvious standards for judging changes of this magnitude, but they are
more modest than one might expect from discussions of discontinuity and qualitative breaks with
past experience.
In fact, the shift from blue-collar to upper white-collar occupations has been much more gradual
than the shift from agricultural to blue-collar jobs, to which it is often compared. The right panel
of Table III.7 highlights in bright yellow any decadal declines of at least 4 percentage points.
Decadal growth of at least 4 percentage points is highlighted in dark blue. Smaller shifts
between 3 and 4 percentage points are shown in light yellow for declines and light blue for
growth. The very largest declines are generally in agricultural jobs. For countries that began the
postwar period with agricultural occupations accounting for at least 20% of the workforce, the
share of jobs in this group shrank on average between 6.5 percentage points per decade (Norway)
and 16.1 percentage points (South Korea) per decade (Handel 2012, p.29). Overall, declines in
farm occupations in the transition to an industrial economy were much faster than the more
recent decline in blue-collar jobs in the transition to a post-industrial economy, even when
comparisons are restricted to starting points when they accounted initially for comparable shares
of employment. Despite popular impressions, the shift to a post-industrial or knowledge
economy has been more gradual than the transition from an agricultural to an industrial economy
in terms of the rate of labor reallocation by occupation.
Of course, the shift from farm to blue-collar work occurred in a different context that may have
facilitated greater occupational mobility than is the case today. Economic growth was generally
faster, manufacturing import competition less intense, and the difference in skill requirements
between agricultural and blue-collar jobs much narrower than the gap between blue-collar and
upper white-collar workers today. The last point raises the issue of the fate of lower white-collar
jobs, notably clerical and sales, which traditionally offered alternative employment opportunities

57
for less-educated workers. These occupations currently accounts for 23-30% of jobs in most
countries, compared to 10-25% in 1960. However, the share of clerical workers has been
declining in recent years, likely due to the spread of computers, and share of sales jobs has also
been softening, as well, possibly due in part to the growth of online retailing. Service
occupations, such as food service, hospitality, and care work, continue to grow but they tend to
have very low wages and benefits, which has led to longstanding concerns about a growing
“service proletariat” (Bluestone and Harrison 1982; Harrison and Bluestone 1988; Esping-
Andersen 1993; Bernardi and Garrido 2008).
Nevertheless, the dominant impression from Table III.7 is the continuity and generally gradual
nature of occupational trends. It is not the case that most of the shaded cells indicating rapid
growth or decline are concentrated in the most recent decades. There are few cases of dramatic
or abrupt change aside from agricultural occupations, and evidence of acceleration is tepid at
best. In most cases, broad occupations grow or decline by 1-4 percentage points per decade,
often by less, and even changes in the range of 3-4 percentage points are not particularly
common. The most dramatic instance of occupational change is the almost perfectly linear
decline in the share of farm jobs in South Korea, which plummeted from 80% of the workforce
(1952) to 12% of the workforce (1992), a remarkable drop of 17 percentage points per decade
sustained over four decades that remains unmatched by any other occupational series among
developed economies. However, this was a case of a very undeveloped country catching up to
the technological frontier with remarkable speed, not the result of technological innovations that
extended the boundaries of the frontier.
In fact, claims that nearly half of the workforce will have shifted broad occupations or made
redundant in the next twenty years (Frey and Osborn 2017) are completely at odds with the scale
of change in recent decades, which has been much more gradual and moderate. Advocates of
this position argue that the future will be radically different from the current era. Indeed, it will
have to be for this forecast to be accurate, and it is possible to calculate roughly how great a
departure from recent experience it implies. Table III.8 shows the index of dissimilarity based
on the right panel of Table III.7. This is a measure of the total reallocation of jobs across the
seven broad occupations for each decade, calculated by summing the absolute values in a given
decadal column for a given country and dividing by two. The figures for the years since 1970
average 6 percentage points and range from 3.4 to 8.6 percentage points. Therefore, claims that
the reallocation of work over the next twenty years will affect 47% of jobs imply a rate of change
that is about four times the average experienced since 1970.
Alternatively, adjustment may be made through permanent workforce reductions, but the time
series on employment in Appendix 1 are inconsistent with the notion of impending massive job
losses. Indeed, the forecast implies in its first decade new production technology will cause
permanent labor force contractions similar to the worst unemployment of the Great Depression,
followed by another, similar decline in the next decade. If the adjustment is equal parts

58
occupational reallocation and unemployment, then the former would be only twice as large as
previously experienced and the latter would be only “one Depression” large.
Table III.8 Index of dissimilarity of occupational distributions by decade, 1950-2010
50-60 60-70 70-80 80-90 90-00 00-10
U.S. 7.6 5.7 5.1 4.0 3.4 6.6
Japan 13.8 12.9 8.1 6.0 5.8 5.9
Germany 15.3 5.9 5.6 5.6 6.0
Other OECD 9.2 7.7 8.6 7.3 8.2 5.5
Note: Calculated from Table III.7
The preceding analyses can be carried forward to the present, as well. The figures below show
trends in occupation shares for 1992-2019 using the Annual Social and Economic (March)
supplement to the CPS. Occupation codes are harmonized to an aggregated 1990 Census code
standard, so results may diverge from the preceding, which were harmonized to ISCO.47
Vertical lines indicate the years marking a significant shift in occupational coding systems, so
some changes may be artefactual.
Figure III.1 shows trends in the shares of workers in the upper white-collar aggregated group and
a combined grouping of upper and lower blue-collar workers. There is a substantial divergence
in their trajectories. The upper white-collar group was already larger at the beginning of the
series, but the difference in size widens from 5.5 percentage points in 1992 to 20 percentage
points today, twenty-seven years later. Except for a flat period between 2002 and 2007, the
upper white collar group has grown fairly smoothly and continuously. The 9.5 percentage points
increase represents an average of 3.5 percentage points per decade over 27 years. The blue-
collar share declines more gradually by 4.5 percentage points from 1992-2009, or 2.6 percentage
points per decade, and has remained unchanged for the past ten years.
Figure III.2 shows trends for the other occupations and subdivides the blue-collar grouping into
upper and lower blue-collar occupations. The relative size of skilled blue-collar group is
unchanged for 1992-2005, after which it declines by 2 percentage points to the present. The
lower blue-collar group lost nearly 3 percentage points between 1995 and 2003, remained
unchanged from 2003-2008, and has been increasing since 2010. Although the process of
regaining ground lost during the recession years 2008-2010 was quite gradual, the process was
complete by 2018, such that this group shows essentially no long-term decline since 2003.
Clerical occupations have declined more consistently; even with a possible artefactual jump in
2003 their share is 5 percentage points lower in 2019 than 1992, a decline of about 1.9
percentage points per decade. Sales occupations began declining in 1999, falling by 1
percentage point per decade on average. Service occupations grew by one-half of one
percentage point between 2008 and 2019.
47
The data are from IPUMS (https://cps.ipums.org/). The occupation variable is OCC1990, which harmonized
1990 Census occupation codes (1992-2002), SOC 2000 codes (2003-2012), and SOC 2010 codes (2013-2019) to a
coarsened set of 1990 Census codes (Flood et al. 2018).

59

60

61
Figure III.3 summarizes the change in the seven broad occupational groups by periods defined
by the use of different occupational coding systems in the original data. Because the periods are
different length, implied ten-year rates of change were computed for all periods to ease
comparison. For upper white-collar and clerical workers, the period 2003-2012 represented a
deceleration of trends before a resumption of previous patterns. For upper blue-collar workers,
decline accelerated in the middle period before falling back to low levels similar to the first
period. The patterns for service and lower blue-collar occupations exhibit unexpected swings in
direction. Only the pattern for sales occupations shows evidence of acceleration, but the changes
for all periods are consistently among the smallest aside from agriculture.
Figure III.3 indicates there has been a long-run shift toward highly skilled jobs, as indicated by
the growth in upper white-collar occupations, most consistently at the expense of clerical
occupations. However, there is no evidence that the change is occurring much more rapidly than
in the past. In this context, it is important to emphasize that the values for 2013-2019 shown
here represent an extrapolation from six years of data to implied ten-year rates for purposes of
comparison. Actual changes for 2013-2019 were only 60% as large as those shown; whether
rates of change remain similar in the next four years is an open question.
Of course, in a sense, any claim that we are on the cusp of unprecedented change must reject on
principle evidence from even the recent past as irrelevant. However, in doing so it is not clear
that such forecasts are left with any positive foundation beyond speculation, as none of the
judgment-based assessments of technologists or extrapolations from them have received any
62
kind of external validation. Indeed, they seem like remote possibilities when benchmarked
against the empirical record.
2. Skill trends using DOT and O*NET scores and occupational employment shares
Broad occupation groups are limited compared to the skill ratings used in the previous section
because they may be internally heterogeneous, and there may be shifts in the distribution of skills
within them over time. In addition, the categories are holistic, lacking any kind of scoring on
specific dimensions or kinds of skills. In the absence of repeated measures of job skill
requirements for the U.S., researchers have merged cross-sectional information from the DOT
and O*NET at the detailed occupational level onto data with information on occupational
employment, such as the Decennial Census and the CPS.48
Thus, detailed occupational titles, an
otherwise a nominal variable, are assigned quantitative scores on multiple skill dimensions.
Unlike repeated measures, there is no issue of shifting standards of measurement with single
cross-sections of skill scores, but there is also no possibility of detecting changes within
occupations. In what follows, all changes in job skill requirements reflect only changes in the
occupational composition of employment.
Trends in job skill requirements using the DOT (1977) can be examined using six skill measures.
The DOT variable known as General Educational Development (GED) rates jobs’ formal
educational requirements (6-point scale). Specific Vocational Preparation (SVP) is the time
required to learn an occupation excluding schooling that lacks vocational content (9-point scale).
The three variables relating to the level of involvement with Data, People, and Things (6-8 point
scales) were described previously in Exhibit 1. Finally, a DOT variable called Intelligence is a
four-point scale indicating the segment of an aptitude test score distribution from which
members of the occupation were drawn.
Somewhat confusingly, the DOT codes all of these variables except GED and SVP in such a
manner that lower values indicate higher levels of the particular skill or quality. This requires
some care in interpreting the figures below.49
Figure III.4 merged these six measures onto
Decennial Census data for 1960-90. All values are indexed to the initial level (1960=100), so
values represent percentage differences relative to the base year.
The trend lines for GED and SVP slope upward, indicating increasing mean educational
requirements and training times. The trends for Data, People, and Intelligence slope downward,
which also signify increasing skill requirements due to the counter-intuitive scoring of these
variables. By contrast, the trend for Things slopes upward, indicating a declining share of jobs in
48
DOT and O*NET are not comparable in terms of methods and measures, so skill trends within occupations are not
recoverable by comparing information from the two sources. 49
The three figures discussed in this section are from Handel (2000a).

63
occupations with greater manual skill requirements. However, except for the trend for Things
after 1970, there is little indication of any acceleration in skill upgrading over time.
Figure III.5 and Figure III.6 show the same trends using the March CPS for 1968-1997, shifting
the observation window forward 7-8 years and also allowing for annual detail. Scaling is relative
to the initial year for this series (1968=100). The series for level of involvement with Things
shows more accelerated and sustained decline in manual skill requirements during the 1980s and
continuing in the 1990s than the corresponding Census series. However, almost all of the other
series indicate comparable or somewhat slower rates of upgrading for the period 1983-1997
compared to 1968-1979. The most distinctive feature of most of the series in these figures is the
notably rapid changes during the deep recession years 1979-1983, whose failure to reverse in
subsequent years suggests significant structural change resulting from that downturn. Otherwise
there is very little distinctive about the 1980s-90s despite expectations regarding the impacts of
information technologies. For GED, SVP, Data, and Intelligence, in particular, the sharpest
movements seem to be associated with recession years, not only 1979-83, but also 1972-74.
In all three figures the direction of trends is expected, but there is little evidence of acceleration
beyond the series for level of involvement with Things using the CPS. Temporal patterns
suggest secular trends predating or independent of the IT revolution. There is also the issue of
magnitudes. The scaling used here indicates that most series have trended from their original
value by roughly 5-10% at the end of each thirty-year period. Again, it is not obvious that this
represents either rapid or gradual change in an absolute sense, though it seems fairly clear that
there are no dramatic breaks. The ambiguity of using index values can be eliminated for SVP by
imputing midpoints to intervals and an estimated mean for the open-ended top code, and
something similar might be possible for GED and Intelligence. However, the values of the other
three variables are “pure ratings” whose meanings cannot be translated into an objective metric
for help in interpreting the size of the changes observed. Although there is no clear standard, it
seems reasonable to say that the magnitudes of the changes do not seem large on their face.

64
Figure III.4
Figure III.5
Trends in Mean DOT Skill Measures (1960=100), Decennial Census microdata
(Note: Declining scores for Data, People, Things, and Intelligence mean increasing skill)
0.87
0.89
0.91
0.93
0.95
0.97
0.99
1.01
1.03
1.05
1.07
1.09
1960 1970 1980 1990
Year
Ind
ex
Va
lue
ged
svp
data
people
things
intell
Trends in Mean DOT Skill Measures (1968=100), March CPS microdata
(Note: Declining scores indicate increasing skill)
0.91
0.92
0.93
0.94
0.95
0.96
0.97
0.98
0.99
1
1.01
1.02
1.03
1.04
1.05
1.06
1.07
1.08
68
70
72
74
76
78
80
82
84
86
88
90
92
94
96
Year
Ind
ex
Va
lue data
people
things
intell

65
Figure III.6
By the late 1990s the DOT was widely recognized as dated and O*NET was being prepared to
replace it. The first complete edition was published in 2008. The following tables apply O*NET
scores to data on the changing occupational composition of employment for the U.S., EU,
Canada, and Japan. A number of O*NET items were combined into scales, as described in Table
III.9. Exceptions are Required education, which is measured in years, and Repetitive motions, a
single item measured on a five-point scale. All other variables are additive scales, which were
standardized for the U.S. workforce using the CPS for 1992. Cases were assigned 3-digit
occupation codes using the ISCO-1988 coding scheme. 50
Mean O*NET scores by ISCO
occupation were assigned to labor force time series data from the other countries, which were
either already coded in terms of the ISCO system or could be converted into ISCO codes.51
This
means that aside from Required education and Repetitive motion, values for the O*NET scales
should be interpreted as measuring differences relative to the CPS 1992 sample in standard
deviation units. Again, all change reflects shifts in the occupation weights because the O*NET
means assigned to occupations do not vary.
50
Note that there are approximately 100 detailed occupations at the 3-digit level of the ISCO classification scheme. 51
An extensive series of validity checks confirmed the reasonableness of imputing O*NET skill scores to other countries (Handel 2012, Annex 2).
Trends in Mean GED and SVP Scores (1968=100), March CPS microdata
0.99
1
1.01
1.02
1.03
1.04
1.05
1.06
68
70
72
74
76
78
80
82
84
86
88
90
92
94
96
Year
Ind
ex
Va
lue
ged
svp

66
Table III.9 O*NET skill scales and measures
1 Required education (years)
2 Math requirements: (1) mathematics skills; (2) mathematics knowledge; (3) mathematical
reasoning; (4) number facility (α=0.92)
3 Verbal requirements: (1) reading comprehension; (2) writing skills; (3) writing
comprehension; (4) writing ability; (5) knowledge of English language rules (spelling,
grammar, composition); (6) frequency of using written letters and memos (α=0.95)
4 General cognitive demands: (1) analytical thinking; (2) critical thinking; (3) complex problem
solving; (4) active learning; (5) analyzing data or information; (6) processing information; (7)
thinking creatively; (8) updating and using relevant knowledge; (9) deductive reasoning; (10)
inductive reasoning; (11) fluency of ideas; (12) category flexibility (α=0.97)
5 People skills: (1) persuasion; (2) negotiation; (3) speaking skills; (4) frequency of face-to-
face discussions; (5) frequency of public speaking; (6) communicating with persons outside
organization; (7) dealing with external customers or public; (8) performing for or working
directly with the public; (9) customer and personal service knowledge; (10) service
orientation; (11) dealing with angry people; (12) dealing with physically aggressive people;
(13) frequency of conflict situations; (14) resolving conflicts and negotiating with others; (15)
instructing skills; (16) training and teaching others; (17) education and training knowledge;
(18) interpreting the meaning of information for others; (19) social orientation; (20) social
perceptiveness (α=0.94)
6 Craft skills: (1) controlling machines and processes; (2) repairing and maintaining
mechanical equipment; (3) repairing and maintaining electronic equipment; (4) equipment
maintenance; (5) repairing machines; (6) troubleshooting operating errors; (7) installing
equipment, machines, and wiring (α=0.95)
7 Gross physical requirements: (1) handling and moving objects; (2) general physical
activities; (3) static strength; (4) dynamic strength; (5) trunk strength; (6) stamina; and time
spent (7) sitting, (8) standing, (9) walking, (10) twisting body, (11) kneeling, crouching,
stooping, or crawling (α=0.98)
8 Repetitive motions (time spent making repetitive motions, 1=never, 2=less than half time,
3=about half time, 4=more than half time, 5=continually or almost continually)
Note: Cronbach’s α in parentheses. from Handel (2012)
Table III.10 shows the correlations among O*NET skill variables for the U.S. in 2009 to give a
sense of the structure of relationships among them. Because the units are 3-digit ISCO-88
occupations weighted by employment, most correlations are much higher than if skill scores
were available at the worker level. Correlations with absolute values greater than or equal to
0.75 are highlighted. The cognitive skills variables correlate strongly with one another.
Interpersonal skills correlate highly with all of the cognitive skills except math (0.75-0.85). This
means that models that seek to estimate returns to interpersonal skill demands need to be careful
about controlling effectively for cognitive skill demands to avoid coefficient bias. Craft skills

67
have relatively modest correlations with all other variables except gross physical requirements
(0.53). Repetitive motions is strongly and negatively correlated with all cognitive skills variables
(-0.65 to -0.84) and positively correlated with gross physical demands (0.56), but not strongly
correlated with craft skills (0.32). These relationships are consistent with expectations.
Table III.10 Correlations among O*NET skill measures, United States and Europe (2009)
1 2 3 4 5 6 7
1 Required educ. 2 Cognitive 0.87 3 Math 0.60 0.80
4 Verbal 0.88 0.93 0.74
5 People 0.75 0.77 0.55 0.85
6 Craft -0.26 -0.10 -0.04 -0.35 -0.47 7 Physical -0.61 -0.67 -0.67 -0.81 -0.56 0.53
8 Repetitive -0.71 -0.78 -0.65 -0.84 -0.86 0.32 0.56
Note: Data are occupation-level scale means based on O*NET variables merged onto Current Population Survey
data from Handel (2012, p.66)
Table III.11 presents O*NET skill means for the U.S. and other countries mostly beginning in
1997 due to constraints of data availability. Row 1 shows the level of general cognitive, verbal,
math, and interpersonal skill requirements for the U.S. in 1997 were already about 0.05 standard
deviations above their levels in 1992 as result of occupational shifts; craft and physical demands
were little changed. Row 3 shows that In the dozen years between 1997 and 2009, required
education rose by 0.15 years, cognitive, verbal, and interpersonal requirements rose by 0.07-0.11
standard deviations, math requirements were mostly flat, craft skill demands fell by 0.06
standard deviations, and gross physical requirements fell the least (-0.02 sd), consistent with
previous findings regarding the weak trends for workplace physical demands.
Repetitive physical motions fell 0.05 units on a 5-point scale. If the repetitiveness scale were
interpreted (perhaps too literally) as dividing the percentage scale into quarters, this would imply
that the percentage of work time spent on such activities fell from 52.3% to 51% in the twelve
years between 1997 and 2009.

68
Table III.11 Mean job skill demands using O*NET skill measures, 1997-2009
Education Cognitive Math Verbal People Craft Physical Repetitive
United States 1 1997 13.53 0.05 0.05 0.04 0.06 0.01 -0.00 3.09
2 2009 13.68 0.12 0.08 0.11 0.17 -0.05 -0.02 3.04
3 Δ 1997-2009 0.15 0.07 0.03 0.07 0.11 -0.06 -0.02 -0.05
Europe panel 4 1997 13.38 -0.06 -0.06 -0.09 -0.12 0.14 0.15 3.17
5 2009 13.59 0.05 -0.04 0.03 -0.01 0.00 0.04 3.13
6 Δ 1997-2009 0.21 0.11 0.02 0.12 0.11 -0.14 -0.11 -0.04
Canada
7 1997 13.55 0.02 -0.02 0.02 -0.00 -0.02 -0.01 3.15
8 2009 13.68 0.10 0.04 0.10 0.08 -0.09 -0.07 3.12
9 Δ 1997-2009 0.13 0.08 0.06 0.08 0.08 -0.07 -0.06 -0.03
Japan
10 1995 13.09 -0.17 -0.14 -0.22 -0.27 0.16 0.14 3.28
11 2005 13.10 -0.19 -0.20 -0.22 -0.24 0.07 0.15 3.28
12 Δ 1995-2005 0.01 -0.02 -0.06 0.00 0.03 -0.09 0.01 0.00
Note: Education is measured in years, the variables “cognitive” through “physical” are in standard deviation units with respect to U.S. means in 1992, and “repetitive” is measured on a 5-point frequency scale (see Table III.8 for details). European panel includes Austria, Belgium, Czech Republic, Denmark, Estonia, Finland, France, Germany, Greece, Hungary, Ireland, Iceland, Italy,
Luxembourg, Netherlands, Norway, Poland, Portugal, Slovenia, Spain, Switzerland, Sweden, and the UK. from Handel (2012, p.67)
The patterns for Europe and Canada are broadly similar to the U.S., with some slight exceptions,
such as stronger declines in craft and gross physical job demands. The pattern for Japan is
generally flatter. Consistent with other results, the demand for both cognitive and interpersonal
skills is rising, and the demand for both skilled and unskilled physical skills is declining, but
whether the magnitudes observed are large or small is not clear. However, the table implies that
at the observed rates for the U.S. it would take about 80 years for job education requirements to
rise by one year and for cognitive and verbal skill demands to rise by 0.5 standard deviations. If
skill changes within-occupation shifts, which are not captured here, were assumed to be in the
same direction and equal in size to the between-occupation effects, then it would take 40 years. If
within-occupation shifts were three times the size of between-occupation shifts, the time interval
would be about 20 years.52
52
To illustrate how these calculations were made, educational requirements grew 0.15 years in a twelve-year period (1997-2009), implying an annual growth rate of 0.0125. If between-occupation shifts were the sole driver of skill change, then growth equal to one year of education would take 1/0.0125=80 years’ time. If the (unobserved) within-occupation skill shifts were equal to the between-occupation shifts then the time interval would be 1/0.025=40 years and if they were double the size of the between-occupation shifts then the time required would be 1/0.0375=26.7 years. If the within-occupation component were 75% of the total, then the time required for required education to increase one year would be 1/0.05=20 years.

69
To assess the temporal pattern of trends, each skill score was regressed on a linear time trend by
country separately, usually for somewhat longer time periods than in the table and varying in
length. When quadratic terms were added in almost no case were both linear and quadratic
effects significant and similarly signed, as one would expect if certain skills were growing (e.g.,
cognitive) or declining (e.g., physical) at an accelerating rate (not shown).53
Although it is not possible with these data to measure within-occupation skill change at the
detailed occupation level, it is possible address the issue at a coarser level of aggregation. One
can examine whether the changing mix of detailed occupations within the seven broad
occupational groups alters the meaning of those groups, whose growth and declines were
presented previously, even if one cannot determine whether the skill distribution within detailed
occupations has changed.
Table III.12 presents mean job skill demands by broad occupational group and year (1997, 2009)
for the U.S. and the European panel. The table also includes additional breakdowns that could
not be presented in Table III.7 for reasons of long-run comparability. The table is useful for
understanding the properties of O*NET scores in general; patterns by 1-digit occupation are as
expected. The cognitive, verbal and interpersonal skill requirements of full professionals in 1997
were about 1.3 standard deviations above the U.S. average in 1992, while the corresponding
values for elementary workers were about 1.2 standard deviations below the average, even as this
group’s physical job requirements were 1.2 standard deviations above average. If the
repetitiveness scale were interpreted as dividing the percentage scale into quarters, European
managers performed repetitive tasks 37.5% of the time in 2009, while elementary workers did so
70% of the time. The O*NET measures also discriminate effectively within the production
worker group. Craft workers score higher than operators and elementary workers on all
cognitive skills variables. They also score significantly higher than any group on the machine
control, maintenance, and repair tasks that define the “craft” skill variable.
The result that is particularly relevant for the question of occupational dynamics is the near-total
constancy in skill means for 1-digit occupations between 1997 and 2009. Although there may be
skill changes within detailed occupations, it appears that there is no shift in the relative sizes of
differently skilled 3-digit occupations within these broad (1-digit) occupation groups. The
composition of the combined professional group did not shift away from associate
professional/technical workers toward more full professionals and the skill mix of occupations
within each of those component groups remained stable, as well. Likewise, there is no obvious
trend up or down in the skills of the production worker group and its components or in any of the
53
Exceptions are interpersonal skills in Luxembourg, Denmark, and the Czech Republic, math skills, craft and physical demands in Iceland, general cognitive and verbal skills in the Czech Republic, and craft skills in Finland. Many of Canada’s trends are best approximated by a cubic function, as there was a positive trend for the late 1980s through early 1990s and somewhat accelerated trend after 2004, while most trends showed virtually no change for the intervening ten to twelve years. This is confirmed below using scores from Canada’s own Essential Skills database.

70
Table III.12 Mean job skill demands by broad occupation in 1997 and 2009, USA and Europe
Education Cognitive Math Verbal People Craft Physical Repetitive
A. USA
Manager
1997 14.5 0.9 1.1 0.9 0.9 -0.5 -0.8 2.6
2009 14.5 0.9 1.1 0.9 0.9 -0.5 -0.8 2.6
Professional
1997 16.1 1.3 0.6 1.2 1.0 -0.1 -0.5 2.7
2009 16.1 1.3 0.6 1.2 1.1 -0.2 -0.5 2.7
Full prof’l
1997 16.4 1.3 0.7 1.3 1.2 -0.3 -0.6 2.6
2009 16.4 1.3 0.6 1.2 1.2 -0.3 -0.5 2.6
Tech/AP
1997 14.4 1.0 0.6 0.7 0.1 0.5 -0.3 3.1
2009 14.3 0.9 0.4 0.7 0.2 0.3 -0.2 3.2
Clerical
1997 13.1 -0.2 0.1 0.3 -0.1 -0.8 -1.0 3.3
2009 13.1 -0.2 0.1 0.3 0.0 -0.8 -0.9 3.2
Sales
1997 13.1 -0.1 0.4 0.1 0.3 -0.6 -0.4 3.0
2009 13.1 -0.1 0.5 0.1 0.3 -0.6 -0.4 2.9
Service
1997 12.4 -0.9 -1.4 -0.8 -0.3 -0.4 0.9 3.4
2009 12.5 -0.9 -1.3 -0.8 -0.2 -0.4 0.8 3.4
Farm
1997 12.4 -0.4 -0.3 -0.7 -0.5 1.5 1.0 3.2
2009 12.4 -0.4 -0.4 -0.7 -0.5 1.4 1.0 3.3
Production
1997 12.3 -0.5 -0.4 -0.9 -0.9 1.2 1.0 3.5
2009 12.4 -0.5 -0.3 -0.9 -0.9 1.2 1.0 3.4
Craft
1997 12.8 0.0 0.1 -0.6 -0.6 1.8 1.1 3.3
2009 12.8 0.0 0.1 -0.6 -0.6 1.8 1.2 3.3
Operator
1997 12.0 -0.8 -0.7 -1.1 -1.2 0.9 0.7 3.7
2009 12.0 -0.8 -0.7 -1.0 -1.1 0.9 0.7 3.6
Elementary
1997 12.1 -1.2 -0.9 -1.2 -1.1 0.3 1.2 3.5
2009 12.2 -1.2 -0.9 -1.2 -1.1 0.4 1.2 3.5
R
2 (2009)
Full 1-digit 0.66 0.63 0.61 0.68 0.60 0.66 0.66 0.50
Collapsed 0.62 0.59 0.58 0.66 0.56 0.59 0.65 0.45

71
Table III.12 Mean job skill demands by broad occupation in 1997 and 2009, USA and Europe
B. EUROPE Education Cognitive Math Verbal People Craft Physical Repetitive
Manager
1997 14.7 0.9 1.0 1.0 1.1 -0.6 -0.9 2.5
2009 14.8 0.9 1.0 1.0 1.1 -0.6 -0.9 2.5
Professional
1997 15.4 1.1 0.7 1.1 0.8 -0.2 -0.7 2.8
2009 15.4 1.1 0.7 1.1 0.7 -0.3 -0.8 2.8
Full prof’l
1997 16.8 1.5 1.0 1.5 1.3 -0.2 -0.8 2.5
2009 16.7 1.5 1.0 1.5 1.2 -0.2 -0.9 2.5
Tech/AP
1997 14.2 0.8 0.5 0.8 0.3 -0.3 -0.6 3.0
2009 14.2 0.8 0.4 0.8 0.4 -0.4 -0.6 3.0
Clerical
1997 12.9 -0.4 0.1 0.2 -0.3 -0.8 -0.9 3.4
2009 13.0 -0.3 0.0 0.2 -0.2 -0.8 -0.9 3.3
Sales
1997 12.5 -1.0 -0.1 -0.7 -0.2 -0.7 0.3 3.1
2009 12.5 -1.0 -0.1 -0.7 -0.2 -0.7 0.3 3.1
Service
1997 12.5 -0.6 -1.2 -0.6 0.1 -0.7 0.8 3.3
2009 12.5 -0.6 -1.2 -0.6 0.1 -0.6 0.8 3.3
Farm
1997 12.9 0.1 0.4 -0.1 0.1 1.8 0.8 2.8
2009 12.9 0.1 0.4 -0.1 0.1 1.8 0.8 2.8
Production
1997 12.2 -0.8 -0.8 -1.1 -1.1 0.9 1.1 3.6
2009 12.2 -0.7 -0.6 -1.1 -1.1 1.0 1.1 3.6
Craft
1997 12.5 -0.3 -0.0 -0.8 -0.9 1.7 1.2 3.5
2009 12.5 -0.3 -0.0 -0.8 -0.9 1.7 1.3 3.5
Operator
1997 11.9 -0.9 -0.7 -1.1 -1.2 1.0 0.7 3.6
2009 11.9 -0.9 -0.7 -1.1 -1.2 0.9 0.7 3.6
Elementary
1997 12.0 -1.5 -1.7 -1.4 -1.3 -0.0 1.1 3.7
2009 12.0 -1.6 -1.8 -1.4 -1.3 -0.1 1.1 3.8
R
2 (2009)
Full 1-digit 0.77 0.82 0.65 0.84 0.73 0.67 0.74 0.62
Collapsed 0.60 0.69 0.47 0.79 0.67 0.50 0.72 0.52
Note: Tech/AP refers to technicians and associate professionals. R2 values for “Full 1-digit” are the variance explained by standard
1-digit occupational groups and R2 values for collapsed codes are the variance explained by the seven-group version used
prevously. European panel includes Austria, Belgium, Czech Republic, Denmark, Estonia, Finland, France, Germany, Greece, Hungary, Ireland, Iceland, Italy, Luxembourg, Netherlands, Norway, Poland, Portugal, Slovenia, Spain, Switzerland, Sweden, and the UK.
from Handel (2012, p.76f.)

72
other major groups. This contradicts the dominant impression from SBTC studies that one finds
skill upgrading almost any way the data are sliced. These results provide no evidence of skill
change within 1-digit occupations due to shifting compositions of 3-digit occupations for either
the U.S. or the European countries for 1997-2009. This leaves open the possibility that skill
upgrading occurred within 3-digit occupations.
The preceding suggests that the trends in Table III.7, which assumed that broad occupational
groups meant the same things over time, were reasonably accurate in that regard, at least in terms
of the broad groups’ 3-digit occupation composition for the period 1997-2009. Indeed, the last
two rows of both panels of Table III.11 show that both the collapsed and full 1-digit occupation
dummies capture very large shares of the variance in scores across 3-digit occupations.
Autor and Price (2013) revisited Autor, Levy, and Murnane’s (ALM) (2003) early influential
study of the changing task composition of the U.S. economy and extended the time series by
eleven years to 2009. The tasks indices were constructed from the same DOT variables as ALM,
but results were also checked for robustness using analogous O*NET variables (Autor and Price
2013, p.15f.). The revised version of the key graph is reproduced below and the data values are
reproduced in the top panel of Table III.13 (Autor and Price 2013, p.5). Simple calculations of
the absolute decadal change have been added in the bottom panel, with the observed change for
the period 2000-2009 extrapolated one year to 2010.
All series are benchmarked to the median value in 1960, so 50 is the starting value for all
variables and means for all subsequent years are pegged to the percentile distribution for 1960.

73
For example, the first row of Table III.13 indicates that the mean of the non-routine analytical
task index in 2009 is equal to the value at the 64th
percentile in the 1960 distribution, i.e., the
mean shifted 14 percentile points in 49 years, or 2.9 percentiles per decade, using the initial
distribution as the yardstick. This is a very effective way to make an arbitrary scale metric
interpretable and may be preferable to index numbers or standard deviation metrics.
Autor and Price note that the average level of routine cognitive and routine manual tasks
continued to decline at similar rates after 2000 compared to the immediately preceding decades.
However, non-routine analytical and non-routine interpersonal tasks stop growing in any
meaningful way after 2000, which they acknowledge is a puzzle (Autor and Price 2013, p.12).
This would seem to be another instance, using very different measures, of a recent deceleration
in skill shifts, even as information technology progressed and Moore’s Law continued apace. Of
course, if the results were extended another ten years to the present, they may show a resumption
of growth.
Nevertheless, the bottom panel of Table III.13 suggests some concerns with the original
argument, insofar as the most rapid absolute growth in both non-routine analytical and non-
routine interpersonal tasks occurred between 1970 and 1980, before the microcomputer
revolution. Although one can undoubtedly find examples of IT that progressed rapidly in the
1970s and other IT that progressed relatively slowly in the 2000s, it would be counter-intuitive to
suggest that IT growth overall was a more powerful force for labor market change in the 1970s
than in the 2000s.
Table III.13 Levels of task inputs in the U.S. Economy and ten-year change rates, 1960-2009
1960 1970 1980 1990 2000 2009
Levels Non-Routine Analytical 50 51.5 57.5 60.8 64.2 63.9
Non-Routine Interpersonal 50 49.9 57.9 62.4 66.4 66.7
Routine Cognitive 50 53.2 51.2 46.9 42.6 39.5
Routine Manual 50 55.3 54.9 52.6 47.6 45.2
Non-Routine Manual 50 47.0 45.2 43.0 42.5 43.1
10-year changes
1960-1970 1970-1980 1980-1990 1990-2000 2000-2010
Non-Routine Analytical
1.5 6.0 3.3 3.4 -0.3
Non-Routine Interpersonal
-0.1 8.0 4.5 4.0 0.3
Routine Cognitive
3.2 -2.0 -4.3 -4.3 -3.4
Routine Manual
5.3 -0.4 -2.3 -5.0 -2.7
Non-Routine Manual
-3.0 -1.8 -2.2 -0.5 0.7
Note: Ten-year change for 2000-2010 extrapolates one year from the observed change from 2000 to 2009 (author’s calculations). From Autor and Price (2013, p.5).

74
One remarkable new dimension in Autor and Price (2013) is an examination of job skill trends
by gender. The most dramatic changes, reproduced below, show a large gender gap in
nonroutine cognitive tasks narrow to two centiles, most rapidly between 1970 and 1990, while an
even larger, 35-centile gap in nonroutine interpersonal tasks in 1970 narrows to a seven-point
gap (Autor and Price 2013, pp.7ff). The increases for men on both dimensions were much more
gradual.

75
David Deming (2017) uses an early version of the O*NET database to study trends in jobs
requiring interpersonal skills from 1980 to 2012. His scale uses the variables coordination,
negotiation, persuasion, and social perceptiveness, all of which except coordination are included
in the “People skills” scale defined in Table III.8. Cognitive (or “nonroutine analytical”) skill
requirements are represented by a scale using the first three math items listed in Table III.8
(Deming 2017, pp.614f.). The composition of these scales differs from ALM and Autor/Price,
but following their method of scaling. Thus, trends in the figure below from Deming (2017,
p.1626) are benchmarked to the median value in 1980, making 50 the starting value for all
variables. The figure shows that by 2012 the average level of math use on the job rose to a value
equal to the 55th
percentile of the 1980 distribution, while interpersonal job demands rose to a
level around the 60th
percentile of the 1980 distribution. Whether the 5- and 10-percentile shifts
over thirty-two years, 1.6 to 3.1 percentiles per decade, are to be considered gradual or rapid is
an open question. What is clear and noteworthy is that essentially all change occurred between
1980 and 2000, after which the two trends are flat. Clearly, these skill trends did not accelerate
over time; they have come to a halt in the most recent dozen years of the series.
Cross-classifying jobs by both levels of interpersonal job tasks and required math, changes the
picture in several respects. The figure below shows jobs that are high on both characteristics
increase their share of jobs by 7.2 percentage points between 1980 and 2000, before growth
stopped for the next dozen years. Jobs that combine high interpersonal tasks with low levels of
math grow at a stable and continuous rate, increasing their share of jobs by 4.6 percentage points
over the 32-year period, indicating that it is the more technical jobs that have contributed to the
slowdown in the growth of highly social jobs. By contrast, jobs with high math and low
interpersonal demands declined by 3.3 percentage points, while jobs involving low levels of both
qualities fared even worse (Deming 2017, pp.1626f.) The reasons for these patterns are not

76
clear, but, again, there is no evidence of sharp discontinuities; if anything, trends decelerated
after 2000.
Regressions using two waves of the NLSY indicate wages associated with a 10-percentile
difference in interpersonal requirements rose from near zero in 1979 to 2.1% in 1997, while the
returns to a similar difference in a job’s math intensity declined from 1.7% to 0.8% over the 18-
year period (Deming 2017, pp.1632ff.).
Trends for O*NET can also be extended to the present. The O*NET data used in Table III.11
were merged onto March CPS data at the detailed occupational level using the IPUMS OCC1990
harmonization for 1992-2019.54
Figure III.7 shows trends in mean required years of education,
which grew smoothly from 13.5 years in 1992 to 13.8 years in 2019, an average increase of 0.11
years per decade without variation or acceleration by period.
54
This is the same CPS series for which trends in broad occupational shares were shown in Figure III.1 and Figure III.2 above.

77
Trends in more specific cognitive measures and in interpersonal job requirements show greater
variation over time. All values are scaled to the mean and standard deviation in 1992. For
example, by 2018 the general cognitive requirements measure had increased 0.15 standard
deviations over the scale mean in 1992, using the standard deviation in 1992 as the unit.55
Figure III.8 shows all series grow consistently from 1994 to 2001, after which
1. the prevalence of math at work falls before recovering somewhat,
2. the growth in verbal and general cognitive demands is more variable, pausing for about
five years (2001-2005), then growing again (2006-2009), pausing again until about 2015,
and then growing again,
3. interpersonal demands grow most consistently and by the greatest amount, albeit not as
rapidly in the fifteen years after 2004 as previously
55
See Table III.9 for a description of this and other scales used in this section.

78
Figure III.9 shows trends in craft skills and gross physical requirements. The prevalence of jobs
requiring craft skills drops after 2005, then recovers somewhat after 2010, likely reflecting the
bursting of the housing bubble and deep recession more generally. Aside from these years, both
trends are fairly shallow in a downward direction, ending only 0.05-0.06 standard deviations
below their 1992 levels after twenty-seven years. Figure III.10 shows a steadier decline in the
time spent making repetitive motions. The mean declines from almost 3.12 to almost 3.03,
slightly less than 0.09 points. Recall that a value of 3 on the 5-point scale means “about half the
time” and 4 means “more than half the time.” If 3 is imputed a value of 50% and 4 is imputed a
value of 75%, then the implied percentage of the workday spent making repetitive motions
dropped from 53% to 50.8%, or about 2.2 percentage points, in the twenty-seven years from
1992 to 2019.

79

80
The results for the five scales with arbitrary metrics are summarized in Table III.14. The first
column shows total change for 1992-2019 using the standard deviations in 1992 as the units.
The second column calculates the average ten-year change rate. For example, verbal
requirements grew by 0.11 standard deviations over twenty-seven year, or 0.04 SD per decade
using the standard deviation in 1992. The third and fourth columns show the percentiles in 1992
that correspond to the means in 1992 and 2019. The means moved up or down the 1992
distribution by 1-4 percentiles between 1992 and 2019.
Table III.14 Changes in O*NET scales in standard deviations and percentiles, 1992-2019
Total Δ (SD) 10-year avg. Δ (SD) Percentile 1992 Percentile 2019
Cognitive 0.14 0.05 51 54 Math 0.04 0.01 54 55 Verbal 0.11 0.04 47 48 Interpersonal 0.18 0.07 55 59 Craft -0.06 -0.02 61 62 Physical -0.05 -0.02 42 42
Canada’s Essential Skills (ES) database consists of occupation-level scores across a number of
dimensions, which were assigned by expert raters based on open-format interviews with 3,000
workers across Canada.56
As with the DOT and O*NET, this cross-sectional database of skill
scores can be merged with time series information on occupational employment shares. The ES
database covers a large majority, but not all, Canadian occupations because managerial and some
professional occupations were not thought necessary to profile for new job-seekers and others
needing career guidance, the main target audience for this program. Tabulations below use the
Canadian Labour Force Survey for 1987-2009 as the source of employment weights. Because
the relative sizes of the omitted occupations grow over time, the share of the workforce covered
decreases slightly from 83.3% (1987) to 80.9% (2009) over the observation window, likely
exerting a slight negative bias for estimates of economy-wide trends shown here (author’s
calculation).57
For many dimensions, the ES database rates the complexity level of the “typical tasks for the
occupation” and tasks identified by interviewees as “the most complex tasks for the occupation.”
Most of the ratings ranged from 1 to 5 (highest complexity level). I combined ratings for
56
The program was a public-private partnership that included the Canadian labor ministry on the government side. For further detail, see “Readers' guide to essential skills profiles” https://www.canada.ca/en/employment-social-development/programs/essential-skills/profiles/readersguide.html. 57
The analyses from this point onward were conducted by the author as an unpublished supplement to Handel (2012). They do not represent the work of the Canadian labor ministry, Human Resources and Skills Development Canada, which I thank for making the ES scores available to me in convenient format and for providing important technical advice.

81
multiple variables to produce standardized scales for required Verbal skills58
, Math skills59
, and
general Cognitive skills.60
The differences between the highest- and lowest-rated 1-digit
occupations were 2.5 standard deviations for the Verbal scale, 2.3 SD for the Math scale, and 2.6
SD for the cognitive scale, indicating strong discriminating power (validity). The original
Complex Oral Communication rating is used in raw form as a single indicator for interpersonal
skills, and the scale ranges from 1 to 4 (highest).
The four figures below show that all three of the cognitive scales increased by about 0.12
standard deviations over 23 years, while the mean level of communication skills required
increased by 0.08 scale points or 2.8% over the same period. These magnitudes are consistent
with O*NET results presented above. However, again, all of these estimates reflect only the
impacts of changes in the occupational composition of the workforce, not any changes that may
have occurred within occupations. In addition, levels are biased downward somewhat due to
Essential Skills’ focus on less skilled occupations and, to a lesser extent, the trends are biased
downward by the slight decline in the size of those occupations relative to the overall workforce.
Aside from the modest size of the changes over time, what is striking about the figures is
unexpected temporal pattern of growth, which occurs in two segments, roughly 1987-1995 and
2004-2009, separated by a period of trendless fluctuation between 1995 and 2004. The reason
for this pattern of interruption is not obvious, but it must reflect some pause in the upgrading of
the Canadian occupational structure because the occupational skill scores remain constant.
Regardless, the similarity in the rates of change in the first and third periods argue against
viewing the Canadian experience as one of accelerated growth in job skill requirements.
Obviously, extending the series to more recent years may alter this impression and any complete
portrait would have to include the higher-skilled occupations that are out of the universe for this
database. Nevertheless, as a portrait of more than 80% of the workforce over nearly 25 years,
these figures reinforce the view that skill change is generally upward but gradual and relatively
smooth, rather than accelerating, abrupt, or discontinuous.
58
The Verbal scale was constructed from the ratings for Complex Reading and Complex Writing (α=0.80). 59
The Math scale was constructed from the ratings for Scheduling, Budgeting & Accounting, Measurement and Calculation, Data Analysis, and Numerical Estimation (α=0.65). 60
The Cognitive scale was constructed from the ratings for Typical Problem Solving, Typical Decision Making, Complex Critical Thinking, Typical Job Task Planning, Complex Finding Information tasks (α=0.78).

82
-0.07
-0.06
-0.05
-0.04
-0.03
-0.02
-0.01
0
0.01
0.02
0.03
0.04
0.05
0.06
0.07
87 88 89 90 91 92 93 94 95 96 97 98 99 00 01 02 03 04 05 06 07 08 09
Trends in required Verbal skills, Canada 1987-2009
-0.08-0.07-0.06-0.05-0.04-0.03-0.02-0.01
00.010.020.030.040.050.06
87 88 89 90 91 92 93 94 95 96 97 98 99 00 01 02 03 04 05 06 07 08 09
Trends in required Math skills, Canada 1987-2009

83
-0.07-0.06-0.05-0.04-0.03-0.02-0.01
00.010.020.030.040.050.060.070.08
87 88 89 90 91 92 93 94 95 96 97 98 99 00 01 02 03 04 05 06 07 08 09
Trends in Cognitive job requirements, Canada 1987-2009
2.800
2.810
2.820
2.830
2.840
2.850
2.860
2.870
2.880
2.890
2.900
87 88 89 90 91 92 93 94 95 96 97 98 99 00 01 02 03 04 05 06 07 08 09
Trends in Oral Communication demands, Canada 1987-2009

84
IV. Conclusion
As the preceding indicates, the concept of job skill requirements is a high-dimensional concept
that can usefully be considered to consist of (1) a tractable set of three to ten or so general
dimensions, (2) a number of technology-related competencies that are applicable across a wide
range of jobs, and (3) innumerable narrow skills that are each specific to a much smaller range of
jobs. The third category presents significant measurement challenges because the skills are very
important for effective job performance but qualitatively diverse and difficult to place on a small
number of common scales. Wherever possible, using concrete items and response scales will be
more informative than using more general questions and response options, which are commonly
used. Explicit scaling can provide a check on compressed response distributions across groups
due to the use of relative standards and any stability bias in trends due to shifting standards of
judgment among respondents over time.
This paper first reviewed information on levels of required job skills using numerous explicit
measures from STAMP, PIE, and Burning Glass. The figures from STAMP and PIE, spanning
the range of the three data types discussed above, provide the best and most detailed indicators of
the skills used to produce goods and services in recent years. The skill measures from the
Burning Glass database are much more detailed and better suited to capturing specialized and
emerging technical skills, but interpreting prevalence rates is complicated by issues relating to
the representativeness of the data. The data show current levels of skill demand that are at
variance with the more extreme views that emphasize the prevalence of high-tech jobs or other
kinds of “knowledge work.” Most jobs in the current economy still do not require four-year
college degrees or very complex math and writing skills. While coding and other IT-specific
skills are well-rewarded in the labor market and can be expected to become more common, the
level of current demand remains largely unknown.
While not trend data, measures of current or recent prevalence themselves reflect the outcome of
decades of technology-induced workplace changes. The cross-sectional data do not directly
answer questions of interest such as whether skill requirements might change substantially in the
near future or how much current output and employment might be increased if the skill content
of job tasks were to be upgraded now. While all trend data reviewed here suggest future change
will be gradual, there is a case to be made for the social benefits of job enrichment regardless of
the pace of technological change. Upgrading job content at any point in time can be expected to
improve job and life satisfaction and earnings in general. Likewise, even though skills used on
the job currently are not necessarily as high as might be inferred from the longstanding discourse
on skills, there are groups that are disadvantaged in the current labor market who could benefit
from more effective education and training. This paper has examined realized outcomes in the
overall labor market, focusing on job characteristics, and has not reviewed information on

85
workforce characteristics or performed sub-group analyses, which would be needed for a more
complete picture.
To understand recent trends, which more directly address the issue of likely rates of future
change, this paper reviewed existing research and performed new analyses using most data on
job skill requirements available for the U.S. and other advanced economies:
1. Official labor force statistics on the size of major occupational groups (1950-2019)
2. European Working Conditions Survey (EWCS) (1990-2015)
3. International Social Survey Program (ISSP) (1989-2005)
4. General Social Survey (GSS) (U.S.) (2010-2014)
5. British Skills and Employment Survey (SES) (1986-2017)
6. Dictionary of Occupational Titles (DOT) (1960-2009)
7. Occupational Information Network (O*NET) (1992-2019)
8. Canadian Essential Skills database (1987-2009)
The survey data in lines 2-5 capture changes due to both shifts in the occupational composition
of employment and changes in job content within occupations (total trends). However, they
cover the United States in limited fashion only. The other data sources can be used to understand
longer-run change in the U.S. and elsewhere, but capture only the component of change due to
shifts in occupational composition. RAND’s American Working Conditions Survey is modeled
on the EWCS, but lacks trend data. Although the RAND survey replicates existing practice in
Europe, skill measures are not standardized across databases, in general, and there is often no
consensus on best practice in terms of variable selection and scale construction for researchers
using the same database, all of which complicates efforts to summarize the state of knowledge.
Finally, many of these data and the research utilizing them employ items or scales whose
meanings are not concrete. Therefore, the direction of change is easily ascertained and one can
determine whether trends have accelerated or not if data are available for more than two periods.
However, understanding the absolute magnitudes of changes is more difficult if measures cannot
be related to concrete activities. Most studies measure trends in terms of absolute changes in
points on ordinal response scales (e.g., 1= not at all important, 5=very important), percentage
changes in factor scores or similar composites, changes in standard deviation units, or changes
on a percentile scale using the distribution for the first year of data as the baseline. All of these
metrics are sensible on their own terms, but the intuitive meaning or substantive importance of
quantities expressed in these units is not always clear.
With these provisos, it is reasonable to conclude that cognitive and interpersonal skill
requirements have grown over time and physical job demands have declined. However, rates of
change over several decades have also been quite gradual in general and often quite variable,
with fluctuations, reversals, and flat periods whose explanations are not immediately obvious.

86
The EWCS data are one of the longest and richest time series covering the largest number of
countries, and the trends it reveals are remarkably flat, sometimes moving in directions contrary
to expectations. Data from the ISSP and GSS also show flat trends for physical demands. The
British SES has a very rich set of measures, which show clearly the steadily growing importance
of higher education as a job requirement since 1986, increasing nearly 6 percentage points per
decade. Most other trends did not show such strong and consistent growth (or decline) and
trends for a number of key indicators, such as literacy, numeracy, and complex problem-solving
flattened in the period 2006-2017 relative to 1997-2006. Over the previous twenty years, the
prevalence of jobs requiring no formal education and for which literacy, numeracy, and problem-
solving were not at all important declined by 4-8 percentage points per decade. In some cases
the mass was distributed mostly to the top category and in other cases was more uniformly
distributed among the other response options. Job learning times and job training times changed
very little between 1986 and 2017, and both interpersonal and physical job demands showed
weaker or inconsistent patterns. Of the twenty-three indicators, computer use and internet use at
work grew most rapidly by a wide margin, but changes in job characteristics assumed to be
influenced by computer technology were more muted.
Long-run trends in the occupational composition of employment show the proportion of upper
white-collar jobs clearly increasing in almost all advanced economies since 1950, generally
increasing its share by 2.5 to 4.5 percentage points per decade. The other broad occupational
groups have followed a more varied pattern across time, but in the past ten years it appears that
blue-collar jobs have stopped declining, while clerical and sales jobs shrink. In no country have
changes in non-farm occupations been as rapid as the decline of agricultural occupations when
they accounted for 15% or more of employment, despite frequent comparisons pointing to the
parallel between the transitions to industrial and post-industrial economies. There are clearly
more complex patterns within the large occupational groupings, some of which are better
addressed with DOT or O*NET scores tapping multiple skill dimensions merged at the level of
detailed occupations.
Such analyses confirm that occupational shifts imply growing demand for education, cognitive
skills, and interpersonal skills since 1960, while demand for physical skills declined, but the
patterns and magnitudes of the changes deserve closer scrutiny. Taking a year in the 1960s as
the base (=100), one finds changes on the order of 4-12% over thirty years using the DOT and 4-
14% over twenty-seven year (1992-2019) using O*NET. Average required years of education
grew smoothly by 0.3 years over the same period. During periods when change is more rapid,
measures of central tendency for some cognitive and interpersonal scales increase by 3-5
percentiles per decade. When measured in terms of standard deviations, changes on the order of
0.05 to 0.15 standard deviations over a dozen or twenty years are to be expected. Different series
show various kinds of fluctuations in the rate of change, but there is no consistent evidence that
trends have accelerated markedly since 1980, and the dominant impression is continuity rather

87
than discontinuity. The growth of knowledge work has been gradual, and math requirements
appear to be growing more slowly than required education, verbal skills, and general cognitive
skills. Automation has not eliminated the need for many familiar kinds of jobs. The available
evidence provides no support for the common notion that that “everything is changing faster and
faster” due to Moore’s Law, nor do the observed fluctuations in rates of change fit easily into the
image evoked by stylized graphs of exponential curves.
Nevertheless, it is true that change has been progressive as well as gradual, such that the nature
of work today differs greatly from that prevailing in 1950 or 1960. However, what is notable is
the relative continuity between adjacent decades. Forecasts of extremely rapid change in the
next twenty years are not based on anything visible in the empirical record. It is difficult to
detect consistent acceleration in skill requirements resulting from the computer revolution
beginning in 1980. Even the previous decline of agricultural jobs, which was faster than the
more recent decline of blue-collar jobs, provides no precedent for change on the scale currently
predicted. Computer technology changes very rapidly, but it is not obvious that work roles
change at remotely comparable rates. The functions relating technology to skills and
employment remain elusive, but it is clear that if technological change is best described by
Moore’s Law then the transmission of IT’s effects to the workplace is governed by some kind of
dampening function. Computer technology changes rapidly but any belief that changes in the
workplace mirror those rates is fallacious. Chip density and microprocessor speed may grow
exponentially, job requirements change gradually.
At the same time, the direction of change toward more skilled work is clear, and upper white-
collar occupations now represent a large plurality of jobs. Less skilled work has always been les
rewarded, and occupations and industries that are declining have been subject to even greater
pressures, as political events across many advanced economies remind us. The focus on future
worst-case scenarios is in some sense a distraction from current problems and possible remedies.
For example, increasing the supply of workforce skills at middle and lower levels may increase
demand for them and their use in production, which might translate into greater economic
rewards. However, understanding any change in job skill requirements will require better data in
the future in the form of objective and standard survey measures administered consistently over a
long time frame.
88
References
Abraham, Katharine G. 2015. “Is Skill Mismatch Impeding U.S. Economic Recovery?”
Industrial and Labor Relations Review. 68:291-313.
Autor, David H. and Brendan Price. 2013. “The Changing Task Composition of the US Labor
Market: An Update of Autor, Levy, and Murnane (2003).” Unpublished ms.
(https://economics.mit.edu/files/9758)
Autor, David H., Frank Levy, and Richard J. Murnane. 2003. “The Skill Content of Recent
Technological Change: An Empirical Exploration.” Quarterly Journal of Economics.
118: 1279-1333
Bendix, Reinhard. 1956. Work and Authority in Industry. Berkeley, CA: University of
California.
Bernardi, Fabrizio and Luis Garrido. 2008. “Is There a New Service Proletariat? Post-industrial
Employment Growth and Social Inequality in Spain.” European Sociological Review.
24:299-313.
Bisello, Martina, Eleonora Peruffo, Enrique Fernández-Macías, Riccardo Rinaldi. 2019. “How
Computerisation is Transforming Jobs: Evidence from Eurofound's European Working
Conditions Survey.” JRC Working Papers Series on Labour, Education and Technology
JRC117167. Seville: European Commission.
Bluestone, Barry and Bennett Harrison. 1982. The Deindustrialization of America. New York:
Basic Books
Braverman, Harry. 1974. Labor and Monopoly Capital. New York: Monthly Review.
Burning Glass. 2014. “Moving the Goalposts: How Demand for a Bachelor’s Degree is
Reshaping the Workforce.” Boston, MA.
Burning Glass and the Business-Higher Education Forum. 2019. “The New Foundational Skills
of the Digital Economy.” Boston, MA.
Burning Glass and CapitalOne. 2015. “Crunched by the Numbers: The Digital Skills Gap in the
Workforce.” Boston, MA.
Burning Glass and CapitalOne. 2017. “The Digital Edge: Middle-Skill Workers and Careers.”
Boston, MA.
Burning Glass and U.S. Chamber of Commerce Foundation. 2018. “Different Skills, Different
Gaps: Measuring and Closing the Skills Gap.” Boston, MA.

89
Burning Glass, IBM, and Business-Higher Education Forum. 2017. “The Quant Crunch: How
the Demand for Data Science Skills is Disrupting the Job Market.” Boston, MA.
Cappelli, Peter H. 2015. “Skill Gaps, Skill Shortages, and Skill Mismatches: Evidence and
Arguments for the United States.” Industrial and Labor Relations Review. 68:251-290.
Chandler, Alfred D., Jr. 1977. The Visible Hand: The Managerial Revolution in American
Business. Cambridge, MA: Harvard University Press.
Deming, David J. 2017. “ The Growing Importance of Social Skills in the Labor Market.”
Quarterly Journal of Economics. 132:1593–1640.
Deming, David and Lisa B. Kahn. 2018. “Skill Requirements across Firms and Labor Markets:
Evidence from Job Postings for Professionals.” Journal of Labor Economics. 36: S337-
S369.
Esping-Andersen Gøsta, ed. 1993. Changing Classes. Stratification and Mobility in Post-
industrial Societies. London: Sage.
Felstead, Alan, Duncan Gallie, Francis Green, and Ying Zhou. 2007. “Skills at Work, 1986 to
2006.” ESRC Centre on Skills, Knowledge and Organisational Performance.
Universities of Oxford and Cardiff, UK.
Felstead, Alan, Duncan Gallie, Francis Green, and Hande Inanc. 2013. “Skills At Work In
Britain: First Findings from the Skills and Employment Survey 2012.” London: Centre
for Learning and Life Chances in Knowledge Economies and Societies, Institute of
Education.
Fields, Dail L. 2002. Taking the Measure of Work. Thousand Oaks, CA: SAGE.
Flood, Sarah, Miriam King, Renae Rodgers, Steven Ruggles and J. Robert Warren. Integrated
Public Use Microdata Series, Current Population Survey: Version 6.0 [dataset].
Minneapolis, MN: IPUMS, 2018. https://doi.org/10.18128/D030.V6.0
Frey, Carl Benedikt and Michael A. Osborne . 2017. “The Future of Employment: How
Susceptible are Jobs to Computerisation?” Technological Forecasting and Social
Change. 114:254–280.
Gallie, Duncan, Alan Felstead, and Francis Green. 2003. “Skill, task discretion and new
technology. Trends in Britain 1986-2001.” L'Année sociologique. 53:401-430.
Gray Mary L. and Siddharth Suri. 2019. Ghost Work: How to Stop Silicon Valley from
Building a New Global Underclass. Boston, MA: Houghton Mifflin Harcourt.
Green, Francis. 2012. “Employee Involvement, Technology and Evolution in Job Skills: A
Task-Based Analysis.” Industrial and Labor Relations Review. 65:36-67.

90
Greenan, Nathalie, Ekaterina Kalugina, Emmanuelle Walkowiak. 2013. “Has the quality of
working life improved in the EU-15 between 1995 and 2005?” Industrial and Corporate
Change. 23:399–428.
Handel, Michael J. 2000a. “Models of Economic Organization and the new Inequality in the
United States.” Unpublished PhD dissertation. Department of Sociology, Harvard
University.
Handel, Michael J. 2000b. “Is There a Skills Crisis? Trends in Job Skill Requirements,
Technology, and Wage Inequality in the United States.” Public Policy Brief 62. Levy
Economics Institute of Bard College. Annandale-on-Hudson, New York.
Handel, Michael J. 2003a. “Skills Mismatch in the Labor Market.” Annual of Review
Sociology. 2003. 29:135–165.
Handel, Michael J. 2003b. "Impacts of Information Technology on Employment and Work:
What Do the Data and Research Say?" SRI International. Arlington, VA.
Handel, Michael J. 2004. "Implications of Information Technology for Employment, Skills, and
Wages: Findings from Sectoral and Case Study Research." SRI International. Arlington,
VA. Commissioned by the National Science Foundation.
Handel, Michael J. 2005a. “Trends in Perceived Job Quality, 1989 to 1998.” Work and
Occupations. 32:66-94.
Handel, Michael J. 2005b. Worker Skills and Job Requirements: Is There a Mismatch?
Washington, DC: Economic Policy Institute.
Handel, Michael J. 2012. “Trends in Job Skill Demands in OECD Countries.” OECD Social,
Employment and Migration Working Papers, No. 143. OECD: Paris.
Handel, Michael J. 2016a. “The O*NET Content Model: Strengths and Limitations.” Journal
for Labour Market Research. 49:157-176.
Handel, Michael J. 2016b. “What Do People Do at Work? A Profile of U.S. Jobs from the
Survey of Workplace Skills, Technology, and Management Practices (STAMP)” Journal
for Labour Market Research. 49:177-197.
Handel, Michael J. 2017. “Measuring job content: Skills, technology, and management
practices.” The Oxford Handbook of Skills and Training, John Buchanan, David
Finegold, Kenneth Mayhew, and Chris Warhurst, eds. Oxford University Press.
Handel, Michael J. and David I. Levine. 2004. "The Effects of New Work Practices on
Workers.” Industrial Relations. 43:1-43.

91
Harrison, Bennett and Barry Bluestone. 1988. The Great U-Turn: Corporate Restructuring and
the Polarizing of America. New York: Basic Books.
Hassett, Kevin A. and Michael R. Strain. 2016. “Expect 25 years of rapid change.” Monthly
Labor Review. (March).
Henseke, Golo, Alan Felstead, Duncan Gallie, Francis Green. 2018. “Skills Trends at Work in
Britain – First Findings from the Skills and Employment Survey 2017.” London: Centre
for Learning and Life Chances in Knowledge Economies and Societies, UCL Institute of
Education.
Hogan, Andrew and Brian Roberts. 2015. “Occupational employment projections to 2024.”
Monthly Labor Review. December.
Johnson, Richard W. 2004. “Trends in Job Demands Among Older Workers, 1992-2002.”
Monthly Labor Review. July: 48-56.
Kaplan, David L. and M. Claire Casey. 1958. “Occupational Trends in the United States: 1900-
1950.” Washington DC: United States Department of Commerce. Bureau of the Census.
Working Paper Number 5.
Lazear, Edward P. and James R. Spletzer. 2012. “The United States Labor Market: Status Quo
or a New Normal?” manuscript.
Leach, Liana, Peter Butterworth, Bryan Rodgers, and Lyndall Strazdins. 2010. “Deriving an
Evidence-based Measure of Job Quality from the HILDA Survey.” Australian Social
Policy Journal. 9:67-86.
Levine, Linda. 2013. “The Increase in Unemployment Since 2007: Is It Cyclical or Structural?”
Congressional Research Service Report for Congress.
Maestas, Nicole, Kathleen J. Mullen, David Powell, Till von Wachter, and Jeffrey B. Wenger.
2017. “Working Conditions in the United States: Results of the 2015 American Working
Conditions Survey.” Santa Monica, CA: RAND Corporation.
https://www.rand.org/pubs/research_reports/RR2014.html.
Melman, Seymour. 1951. “The Rise of Administrative Overhead in the Manufacturing
Industries of the United States 1899-1947.” Oxford Economic Papers. (New Series) 3: 62-
112.
Miller, Ann R., Donald J. Treiman, Pamela S. Cain, and Patricia A. Roos. 1980. Work, Jobs, and
Occupations: A Critical Review of the Dictionary of Occupational Titles.
Mills, C. Wright. 1953. White Collar: The American Middle Classes. New York: Oxford
University Press.

92
Mishel, Lawrence and Jared Bernstein. 1998. "Technology and the Wage Structure: Has
Technology's Impact Accelerated Since the 1970s?" Research in Labor Economics.
17:305-355.
National Research Council. 2010. A Database for a Changing Economy: Review of the
Occupational Information Network (O*NET). Washington, DC: The National Academies
Press. https://doi.org/10.17226/12814.
OECD. 2016. “New Skills for the Digital Economy: Measuring the demand and supply of ICT
skills at work.” OECD Digital Economy Papers, No. 258. OECD:Paris.
Parent-Thirion, Agnès, Enrique Fernández Macías, John Hurley, and Greet Vermeylen. 2007.
“Fourth European Working Conditions Survey.” European Foundation for the
Improvement of Living and Working Conditions. Dublin, Ireland.
Quintini, Glenda. 2014. “Skills at Work: How Skills and their Use Matter in the Labour
Market.” OECD Social, Employment and Migration Working Papers, No. 158. OECD:
Paris.
Reich, Robert B. 1991. The Work of Nations. New York: Alfred A. Knopf.
Roberts, Sarah T. 2019. Behind the Screen: Content Moderation in the Shadows of Social
Media. New Haven: Yale University Press.
Rodriguez, Orlando. 1978. “Occupational Shifts and Educational Upgrading in the American
Labor Force Between 1950 and 1970.” Sociology of Education. 51:55-67.
Rohrbach-Schmidt, Daniela and Anja Hall. 2013. “BIBB-BAuA Employment Survey 2012.”
BIBB-FDZ Data and Methodological Reports. Federal Institute for Vocational Education
and Training. Bonn, Germany.
Rothstein, Jesse. 2012. “The Labor Market Four Years into the Crisis: Assessing Structural
Explanations.” Industrial and Labor Relations Review. 65:467-500.
Rothstein, Jesse. 2017. “The Great Recession and Its Aftermath: What Role for Structural
Changes?” Russell Sage Foundation Journal of the Social Sciences. 3:22-49.
Shaw, Kathryn. 2002. "By What Means Does Information Technology Affect Employment and
Wages? The Value of IT, HRM Practices, and Knowledge Capital." Pp.229-267 in
Information Technology, Employment, and Earnings, Nathalie Greenan and Jacques
Mairesse, eds. Cambridge: MIT Press.
Siciliano, Michael L. 2016. “Control from On High: Cloud Computing, Skill, and Acute
Frustration among Analytics Workers in the Digital Publishing Industry.” Research in the
Sociology of Work. 29:125-153.
Smith, Tom W., Peter V. Marsden, Michael Hout. 2016. General Social Surveys, 1972-2014:
Cumulative Codebook. Chicago: NORC.

93
Teixeira, Ruy. 1998. “Rural and Urban Manufacturing Workers: Similar Problems, Similar
Challenges: Results of the ERS Rural Manufacturing Survey.” United States Department
of Agriculture Economic Research Service Agriculture Information Bulletin Number 736-
02.
U.S. Department of Labor. Employment and Training Administration. 1991. Dictionary of
Occupational Titles: Volume 1. Fourth edition, revised. Washington, DC.
Weaver, Andrew and Paul Osterman. 2017. “Skill Demands and Mismatch in U.S.
Manufacturing.” Industrial and Labor Relations Review. 70: 275–307.
Zuboff, Shoshana. 1988. In the Age of the Smart Machine: The Future of Work and Power.
New York: Basic Books.

94
Appendix 1. Aggregate employment trends
Figure A1.1. Total non-farm employment, January 1939 – November 2019
Source: https://fred.stlouisfed.org/series/PAYEMS

95
Figure A1.2 Total non-farm employment, November 2009– November 2019
Source: https://fred.stlouisfed.org/series/PAYEMS

96
Figure A1.3 Employment-population ratio for persons age 25-54, February 1948– November 2019
Figure A1.4 Employment-population ratio for persons age 25-54, November 1989– November 2019
Source: https://fred.stlouisfed.org/series/LNS12300060

97
Figure A1.5 and Figure A1.6
Source: https://www.bls.gov/lpc/prodybar.htm (accessed12/23/2019)

98
Appendix 2. Trends for British Skill and Employment Survey indicators Source: Author’s charts from tabulations provided by Alan Felstead, co-PI Skills and Employment Survey
1. Required education
2. Job learning times
3. Job training times
0
5
10
15
20
25
30
35
40
45
1986 1992 1997 2001 2006 2012 2017
None
Level 1
Level 2
Level 3
Level 4
0
5
10
15
20
25
30
1986 1992 1997 2001 2006 2012 2017
< 1 mo
1-3 mos
3-6 mos
6 mos-1yr1-2 yrs
0
10
20
30
40
50
60
1986 1992 1997 2001 2006 2012 2017
None
< 1 mo
1-3 mos
3-6 mos
6 mos-1 yr
1-2 yrs
>2 years

99
5. Reading long documents
6. Writing short documents
8. Simple arithmetic
10. Advanced mathematics/ statistics
0
10
20
30
40
1997 2001 2006 2012 2017
essential
very imp
fairly imp
not very imp
not at all imp
0
10
20
30
40
1997 2001 2006 2012 2017
essential
very imp
fairly imp
not very imp
not at all imp
0
10
20
30
40
1997 2001 2006 2012 2017
essential
very imp
fairly imp
not very imp
not at all imp
0
10
20
30
40
50
60
1997 2001 2006 2012 2017
essential
very imp
fairly imp
not very imp
not at all imp
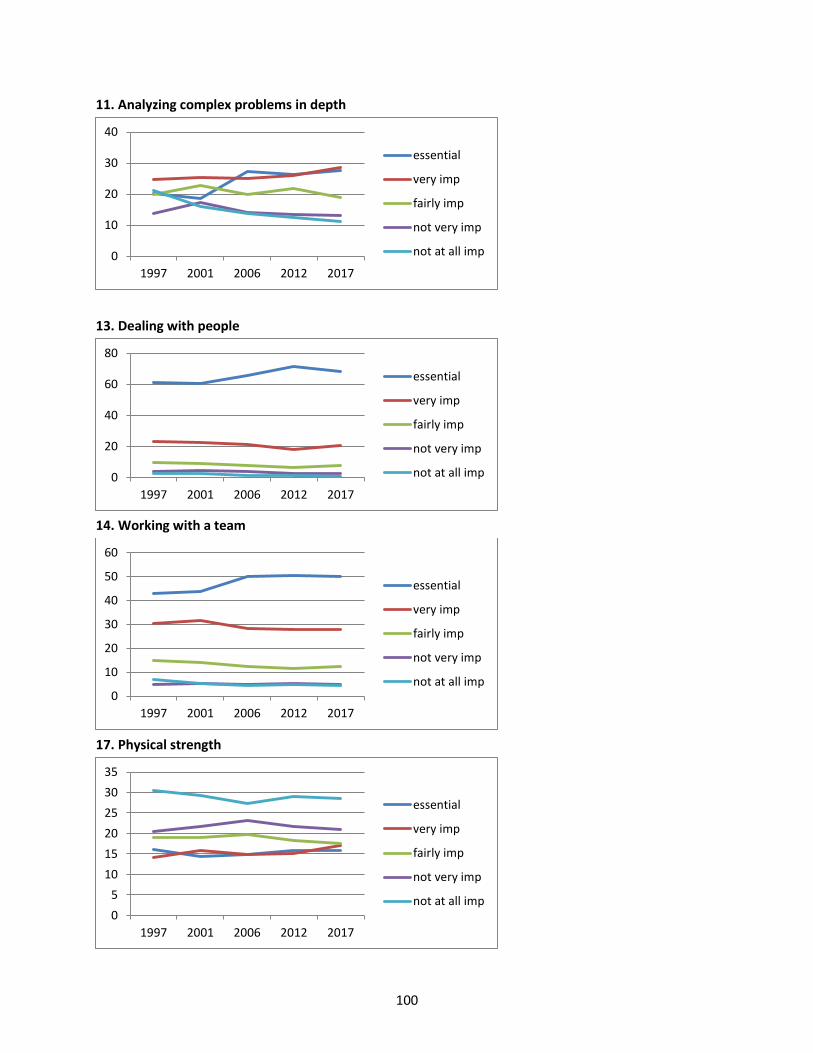
100
11. Analyzing complex problems in depth
13. Dealing with people
14. Working with a team
17. Physical strength
0
10
20
30
40
1997 2001 2006 2012 2017
essential
very imp
fairly imp
not very imp
not at all imp
0
20
40
60
80
1997 2001 2006 2012 2017
essential
very imp
fairly imp
not very imp
not at all imp
0
10
20
30
40
50
60
1997 2001 2006 2012 2017
essential
very imp
fairly imp
not very imp
not at all imp
0
5
10
15
20
25
30
35
1997 2001 2006 2012 2017
essential
very imp
fairly imp
not very imp
not at all imp

101
20. Knowledge of use or operation of tools
22. Using a computer or computerized equipment
23. Using the internet
0
10
20
30
40
1997 2001 2006 2012 2017
essential
very imp
fairly imp
not very imp
not at all imp
0
10
20
30
40
50
60
1997 2001 2006 2012 2017
essential
very imp
fairly imp
not very imp
not at all imp
0
10
20
30
40
50
2001 2006
essential
very imp
fairly imp
not very imp
not at all imp