joan costa-font, núria mas and patricia navarro globesity: is
TRANSCRIPT
Joan Costa-Font, Núria Mas and Patricia Navarro
Globesity: Is Globalization a Pathway to Obesity?
Working Paper No: 31/2013 March 2013 LSE Health
1
Globesity: Is Globalization a Pathway to Obesity?
Joan Costa-Fonta, Núria Masb, Patricia Navarroc
a London School of Economics and Political Science (LSE) bIESE Business School and PPSRC cIESE Business School and Columbia University Working Paper No.31/2013 First published in March 2013 by: LSE Health The London School of Economics and Political Science Houghton Street WC2A 2AE © Joan Costa-Font, Núria Mas, Patricia Navarro All rights reserved. No part of this paper may be reprinted or reproduced or utilised in any form or by any electronic, mechanical or other means, now known or hereafter invented, including photocopying and recording, or in any information storage or retrieve system, without permission in writing from the publishers. British Library Cataloguing in Publication Data. A catalogue record for this publication is available from the British Library. ISSN 2047-8879 Corresponding Author: Joan Costa-Font Department of Social Policy London School of Economics and Political Science Houghton Street London WC2A 2AE [email protected] We thank Pankaj Ghemawat and seminar participants at the PPSRC IESE, LSE Health and the HERU at Brunel University for great comments. We are grateful to Victor Burguete for invaluable research assistance. Núria Mas is grateful to PPSRC for research support and to the financial support from Ministerio de Educación y Ciencia ECO2009-13169 and ECO2012-38134.
2
Abstract Obesity has risen dramatically at the same time as globalization has surged, which poses the
question of whether the two are related. In this paper we analyze whether empirical evidence
confirms the association between the different types of globalization (economic, political or social)
and obesity using data from 15 up to 23 different countries for up to 15 years, as well as three
primary outcomes: obesity, caloric intake and grams of fat consumed and a set of controls for micro-
mechanisms that have been found to affect obesity in the economic and health literature. Our results
are suggestive of a robust association between globalization and obesity, caloric intake and grams
from fat consumed. Once we control for indirect micromechanisms associated with globalization
such as food prices, female labor market participation, as well as urbanization and income, the direct
impact of economic globalization is not significant, whilst ‘social globalization’ remains as a
having robust and strong effect on the three measures of obesity. A one standard deviation increase
in the index of social globalization from the Swiss federal institute of technology Zurich (KOF
index) implies a rise of 3 percentage points in the proportion of obese population. It leads to a rise of
217 kcal and of 23.1 grams of fat consumed, respectively. Urbanization has a negative impact on the
consumption of fat and caloric intake, while female labor force participation has a positive
relationship with the three obesity outcomes.
Keywords: globalization, obesity, calorie intake, health production, development, macro-mechanisms.
JEL: I18, F69,P46
3
Contents
1. Introduction 4
2. Globalization and Obesity 8
3. Methods and Data 11
3.1. Data …………………………………………………………………….11
3.2 Methods ………………………………………………………………... 15
4. Results 16
4.1. Baseline estimations……………………………………………………………16
4.2. Sensitivity Analysis ……………………………………………………. 20
5. Conclusions 23
References 25
Appendix 28
4
1. Introduction
Obesity is a major cause of excess morbidity and mortality (Rosenbaum et al., 1997), the fifth most
important risk factor contributing to morbidity in advanced economies (WHO, 2002), and currently
accounts from 5.0 to 5.7 % of national health expenditures in the United States and 2.0 to 3.5% in
other advanced economies (Thomson and Wolf, 2001). The prevalence of obesity has been
recognized as the source of several serious health complications, and risks later in life (Ebbeling et
al., 2002). Moreover, obesity is responsible for a very large proportion of healthcare costs in
developed countries (Cawley and Meyerhoefer, 2012) Knai et al., 2007 have estimated the burden of
obesity in Europe to represent about 6 percent of healthcare costs and another 6 percent in indirect
cost of lost productivity.
The rate of acceleration of body mass index (BMI) since World War II is of unprecedented
magnitude and it can be mostly explained by lifestyle changes (Komlos and Brabec, 2011). Obesity
today can be regarded as a global epidemic. Indeed, it is estimated that 500 million adults worldwide
are obese and 1.5 billion are overweight or obese (Finucane et al, 2011). For the first time in human
history, the world has a larger share of the population overweight than underweight (Popkin, 2007).
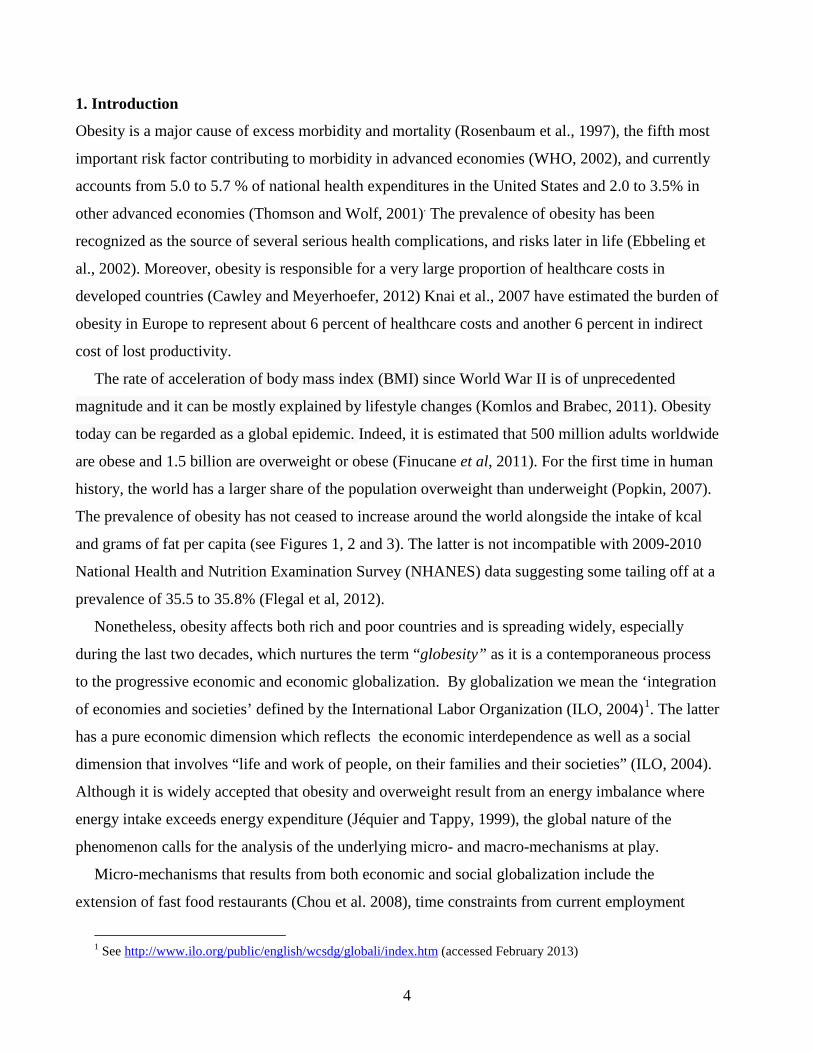
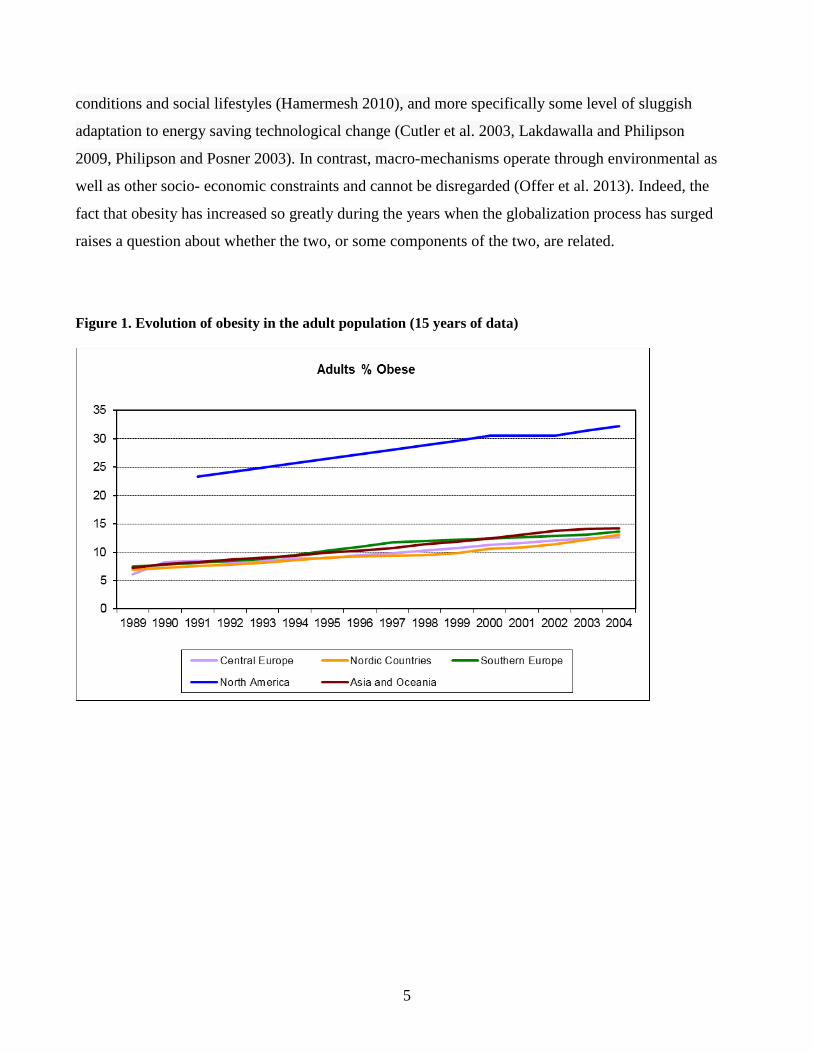
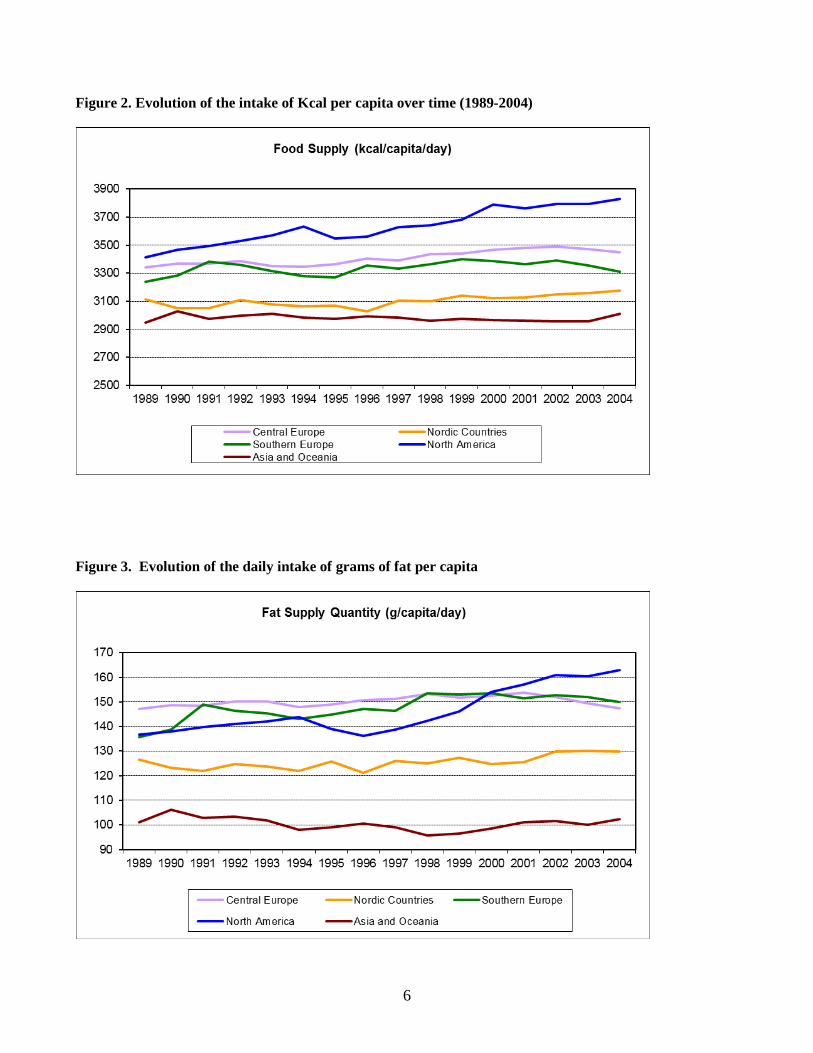
The prevalence of obesity has not ceased to increase around the world alongside the intake of kcal
and grams of fat per capita (see Figures 1, 2 and 3). The latter is not incompatible with 2009-2010
National Health and Nutrition Examination Survey (NHANES) data suggesting some tailing off at a
prevalence of 35.5 to 35.8% (Flegal et al, 2012).
Nonetheless, obesity affects both rich and poor countries and is spreading widely, especially
during the last two decades, which nurtures the term “globesity” as it is a contemporaneous process
to the progressive economic and economic globalization. By globalization we mean the ‘integration
of economies and societies’ defined by the International Labor Organization (ILO, 2004)1. The latter
has a pure economic dimension which reflects the economic interdependence as well as a social
dimension that involves “life and work of people, on their families and their societies” (ILO, 2004).
Although it is widely accepted that obesity and overweight result from an energy imbalance where
energy intake exceeds energy expenditure (Jéquier and Tappy, 1999), the global nature of the
phenomenon calls for the analysis of the underlying micro- and macro-mechanisms at play.
Micro-mechanisms that results from both economic and social globalization include the
extension of fast food restaurants (Chou et al. 2008), time constraints from current employment
1 See http://www.ilo.org/public/english/wcsdg/globali/index.htm (accessed February 2013)
5
conditions and social lifestyles (Hamermesh 2010), and more specifically some level of sluggish
adaptation to energy saving technological change (Cutler et al. 2003, Lakdawalla and Philipson
2009, Philipson and Posner 2003). In contrast, macro-mechanisms operate through environmental as
well as other socio- economic constraints and cannot be disregarded (Offer et al. 2013). Indeed, the
fact that obesity has increased so greatly during the years when the globalization process has surged
raises a question about whether the two, or some components of the two, are related.
Figure 1. Evolution of obesity in the adult population (15 years of data)
6
Figure 2. Evolution of the intake of Kcal per capita over time (1989-2004)
Figure 3. Evolution of the daily intake of grams of fat per capita
7
This paper empirically analyzes the association between globalization (and its several dimensions)
and obesity by exploring if the main mechanisms analyzed by the literature and related to
globalization could contribute to the recent explosion in obesity. We argue that the effect of
globalization can be through its indirect influence on some micro-mechanisms or remain instead as an
environmental (or residual) effect. In this paper we measure some of these micro-mechanisms
conveying the effects of social globalization (e.g., female labor market participation) or economic
globalization (e.g., a reduction in food prices due to trade liberalization) as well as macro mechanisms
capturing unobserved residual effects. We show in the paper that once those micro mechanisms were
controlled for the residual impact of economic globalization as a macro-mechanism is not significant
anymore, whilst the environmental effect of 'social globalization' remains as having a robust and
strong effect on the three measures of obesity once a rich set of micro-mechanisms are controlled for.
We interpret these results as reflecting a residual variation which reflects in the influence of social
environment in influencing individual’s health production.
More specifically, we control for some micro-mechanisms considered by the literature, and
compare the respective effects vis a vis a direct effect of such mechanisms on the consumption of
calories and of grams of fat. Some literature has examined the impact of different forms of
globalization on life expectancy, and has found some suggestive evidence that it is economic
globalization that appears to be correlated with life expectancy extension (Bergh and Nilsson, 2010).
However, what are the main mechanisms that trigger such a correlation? What are the main
components of globalization that could exert such an influence? This study provides the most
detailed investigation to date of the relationship between aggregate changes in a country’s
globalization and obesity. More specifically, we take advantage of a three-dimensional classification
of globalization that consists of social, economic and political characteristics (see Appendix), to
ascertain different macro-mechanisms that could underpin an association.
To contribute to this debate, we exploit the cross-country variability in a panel of countries for 15
years and 10 years. We draw upon aggregate data from a large number of countries through three
decades. The primary outcomes examined are obesity, caloric intake and grams of fat. Time and
country effects are controlled for and a rich list of controls and time trends are included to identify
the effect of our variable, and net out the influence of other confounding variables.
Based on the literature on the determinants of obesity, we consider different types of micro-
mechanisms some of which convey the effects of globalization. We include the impact of changes in
8
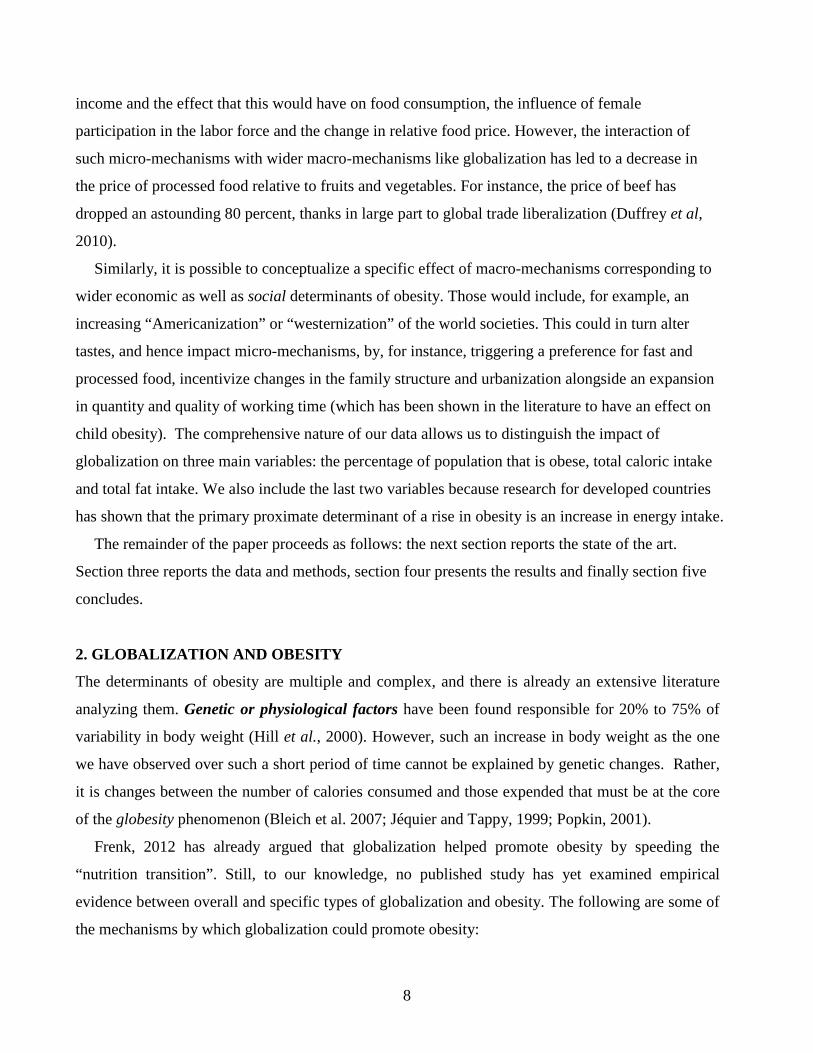
income and the effect that this would have on food consumption, the influence of female
participation in the labor force and the change in relative food price. However, the interaction of
such micro-mechanisms with wider macro-mechanisms like globalization has led to a decrease in
the price of processed food relative to fruits and vegetables. For instance, the price of beef has
dropped an astounding 80 percent, thanks in large part to global trade liberalization (Duffrey et al,
2010).
Similarly, it is possible to conceptualize a specific effect of macro-mechanisms corresponding to
wider economic as well as social determinants of obesity. Those would include, for example, an
increasing “Americanization” or “westernization” of the world societies. This could in turn alter
tastes, and hence impact micro-mechanisms, by, for instance, triggering a preference for fast and
processed food, incentivize changes in the family structure and urbanization alongside an expansion
in quantity and quality of working time (which has been shown in the literature to have an effect on
child obesity). The comprehensive nature of our data allows us to distinguish the impact of
globalization on three main variables: the percentage of population that is obese, total caloric intake
and total fat intake. We also include the last two variables because research for developed countries
has shown that the primary proximate determinant of a rise in obesity is an increase in energy intake.
The remainder of the paper proceeds as follows: the next section reports the state of the art.
Section three reports the data and methods, section four presents the results and finally section five
concludes.
2. GLOBALIZATION AND OBESITY
The determinants of obesity are multiple and complex, and there is already an extensive literature
analyzing them. Genetic or physiological factors have been found responsible for 20% to 75% of
variability in body weight (Hill et al., 2000). However, such an increase in body weight as the one
we have observed over such a short period of time cannot be explained by genetic changes. Rather,
it is changes between the number of calories consumed and those expended that must be at the core
of the globesity phenomenon (Bleich et al. 2007; Jéquier and Tappy, 1999; Popkin, 2001).
Frenk, 2012 has already argued that globalization helped promote obesity by speeding the
“nutrition transition”. Still, to our knowledge, no published study has yet examined empirical
evidence between overall and specific types of globalization and obesity. The following are some of
the mechanisms by which globalization could promote obesity:
9
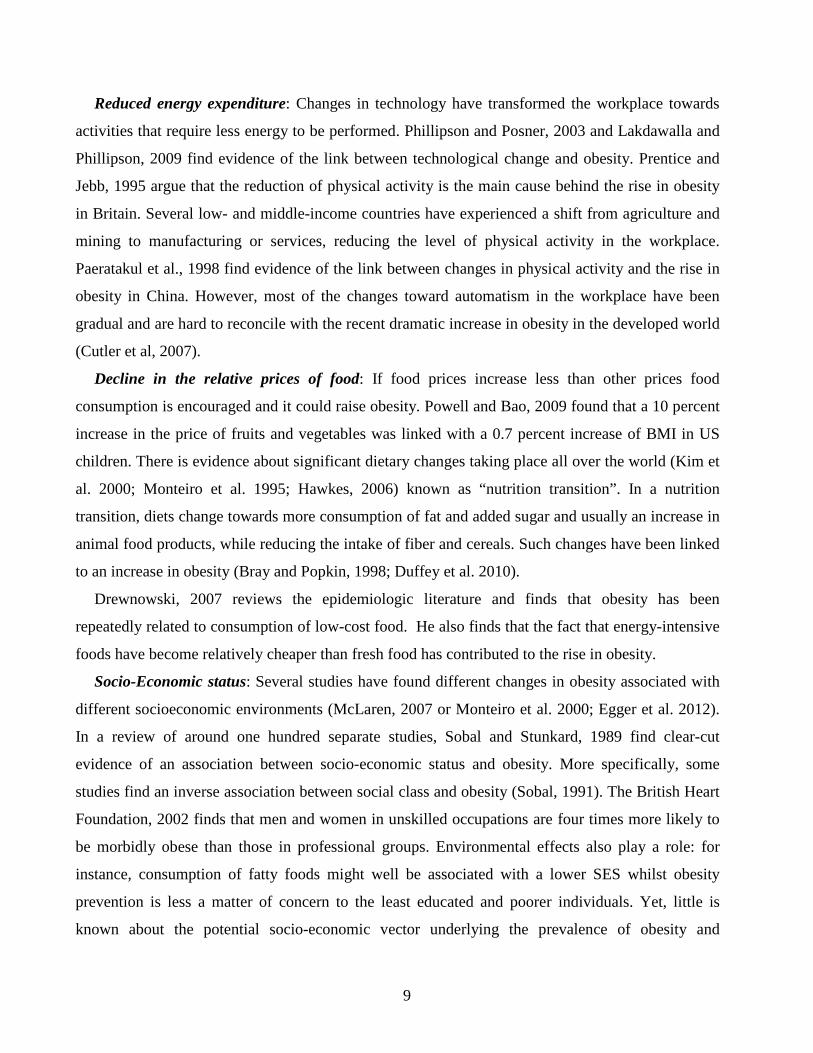
Reduced energy expenditure: Changes in technology have transformed the workplace towards
activities that require less energy to be performed. Phillipson and Posner, 2003 and Lakdawalla and
Phillipson, 2009 find evidence of the link between technological change and obesity. Prentice and
Jebb, 1995 argue that the reduction of physical activity is the main cause behind the rise in obesity
in Britain. Several low- and middle-income countries have experienced a shift from agriculture and
mining to manufacturing or services, reducing the level of physical activity in the workplace.
Paeratakul et al., 1998 find evidence of the link between changes in physical activity and the rise in
obesity in China. However, most of the changes toward automatism in the workplace have been
gradual and are hard to reconcile with the recent dramatic increase in obesity in the developed world
(Cutler et al, 2007).
Decline in the relative prices of food: If food prices increase less than other prices food
consumption is encouraged and it could raise obesity. Powell and Bao, 2009 found that a 10 percent
increase in the price of fruits and vegetables was linked with a 0.7 percent increase of BMI in US
children. There is evidence about significant dietary changes taking place all over the world (Kim et
al. 2000; Monteiro et al. 1995; Hawkes, 2006) known as “nutrition transition”. In a nutrition
transition, diets change towards more consumption of fat and added sugar and usually an increase in
animal food products, while reducing the intake of fiber and cereals. Such changes have been linked
to an increase in obesity (Bray and Popkin, 1998; Duffey et al. 2010).
Drewnowski, 2007 reviews the epidemiologic literature and finds that obesity has been
repeatedly related to consumption of low-cost food. He also finds that the fact that energy-intensive
foods have become relatively cheaper than fresh food has contributed to the rise in obesity.
Socio-Economic status: Several studies have found different changes in obesity associated with
different socioeconomic environments (McLaren, 2007 or Monteiro et al. 2000; Egger et al. 2012).
In a review of around one hundred separate studies, Sobal and Stunkard, 1989 find clear-cut
evidence of an association between socio-economic status and obesity. More specifically, some
studies find an inverse association between social class and obesity (Sobal, 1991). The British Heart
Foundation, 2002 finds that men and women in unskilled occupations are four times more likely to
be morbidly obese than those in professional groups. Environmental effects also play a role: for
instance, consumption of fatty foods might well be associated with a lower SES whilst obesity
prevention is less a matter of concern to the least educated and poorer individuals. Yet, little is
known about the potential socio-economic vector underlying the prevalence of obesity and
10
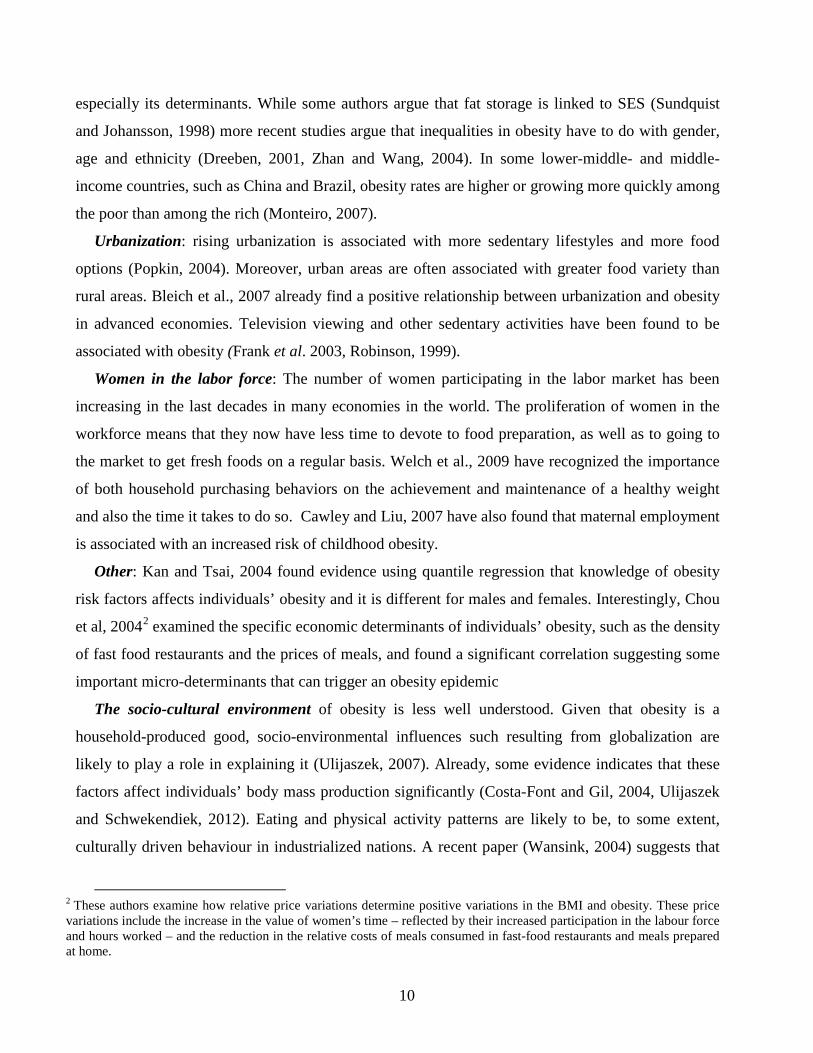
especially its determinants. While some authors argue that fat storage is linked to SES (Sundquist
and Johansson, 1998) more recent studies argue that inequalities in obesity have to do with gender,
age and ethnicity (Dreeben, 2001, Zhan and Wang, 2004). In some lower-middle- and middle-
income countries, such as China and Brazil, obesity rates are higher or growing more quickly among
the poor than among the rich (Monteiro, 2007).
Urbanization: rising urbanization is associated with more sedentary lifestyles and more food
options (Popkin, 2004). Moreover, urban areas are often associated with greater food variety than
rural areas. Bleich et al., 2007 already find a positive relationship between urbanization and obesity
in advanced economies. Television viewing and other sedentary activities have been found to be
associated with obesity (Frank et al. 2003, Robinson, 1999).
Women in the labor force: The number of women participating in the labor market has been
increasing in the last decades in many economies in the world. The proliferation of women in the
workforce means that they now have less time to devote to food preparation, as well as to going to
the market to get fresh foods on a regular basis. Welch et al., 2009 have recognized the importance
of both household purchasing behaviors on the achievement and maintenance of a healthy weight
and also the time it takes to do so. Cawley and Liu, 2007 have also found that maternal employment
is associated with an increased risk of childhood obesity.
Other: Kan and Tsai, 2004 found evidence using quantile regression that knowledge of obesity
risk factors affects individuals’ obesity and it is different for males and females. Interestingly, Chou
et al, 20042 examined the specific economic determinants of individuals’ obesity, such as the density
of fast food restaurants and the prices of meals, and found a significant correlation suggesting some
important micro-determinants that can trigger an obesity epidemic
The socio-cultural environment of obesity is less well understood. Given that obesity is a
household-produced good, socio-environmental influences such resulting from globalization are
likely to play a role in explaining it (Ulijaszek, 2007). Already, some evidence indicates that these
factors affect individuals’ body mass production significantly (Costa-Font and Gil, 2004, Ulijaszek
and Schwekendiek, 2012). Eating and physical activity patterns are likely to be, to some extent,
culturally driven behaviour in industrialized nations. A recent paper (Wansink, 2004) suggests that
2 These authors examine how relative price variations determine positive variations in the BMI and obesity. These price variations include the increase in the value of women’s time – reflected by their increased participation in the labour force and hours worked – and the reduction in the relative costs of meals consumed in fast-food restaurants and meals prepared at home.
11
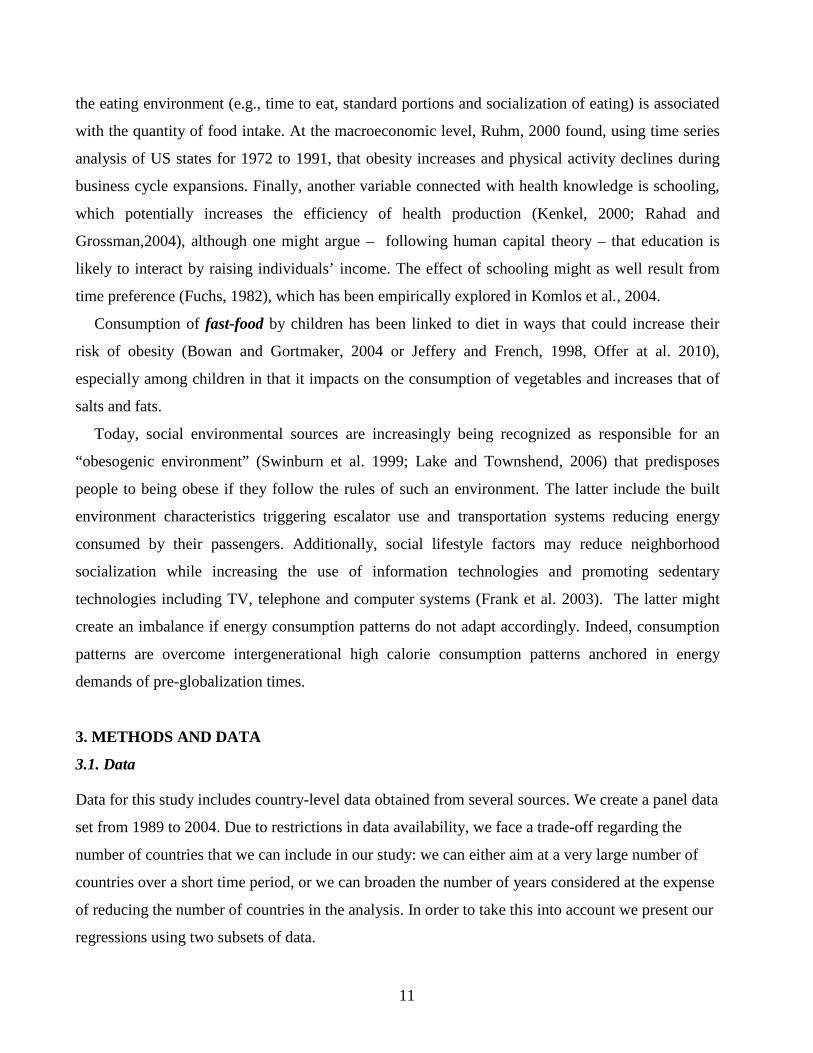
the eating environment (e.g., time to eat, standard portions and socialization of eating) is associated
with the quantity of food intake. At the macroeconomic level, Ruhm, 2000 found, using time series
analysis of US states for 1972 to 1991, that obesity increases and physical activity declines during
business cycle expansions. Finally, another variable connected with health knowledge is schooling,
which potentially increases the efficiency of health production (Kenkel, 2000; Rahad and
Grossman,2004), although one might argue – following human capital theory – that education is
likely to interact by raising individuals’ income. The effect of schooling might as well result from
time preference (Fuchs, 1982), which has been empirically explored in Komlos et al., 2004.
Consumption of fast-food by children has been linked to diet in ways that could increase their
risk of obesity (Bowan and Gortmaker, 2004 or Jeffery and French, 1998, Offer at al. 2010),
especially among children in that it impacts on the consumption of vegetables and increases that of
salts and fats.
Today, social environmental sources are increasingly being recognized as responsible for an
“obesogenic environment” (Swinburn et al. 1999; Lake and Townshend, 2006) that predisposes
people to being obese if they follow the rules of such an environment. The latter include the built
environment characteristics triggering escalator use and transportation systems reducing energy
consumed by their passengers. Additionally, social lifestyle factors may reduce neighborhood
socialization while increasing the use of information technologies and promoting sedentary
technologies including TV, telephone and computer systems (Frank et al. 2003). The latter might
create an imbalance if energy consumption patterns do not adapt accordingly. Indeed, consumption
patterns are overcome intergenerational high calorie consumption patterns anchored in energy
demands of pre-globalization times.
3. METHODS AND DATA
3.1. Data
Data for this study includes country-level data obtained from several sources. We create a panel data
set from 1989 to 2004. Due to restrictions in data availability, we face a trade-off regarding the
number of countries that we can include in our study: we can either aim at a very large number of
countries over a short time period, or we can broaden the number of years considered at the expense
of reducing the number of countries in the analysis. In order to take this into account we present our
regressions using two subsets of data.
12
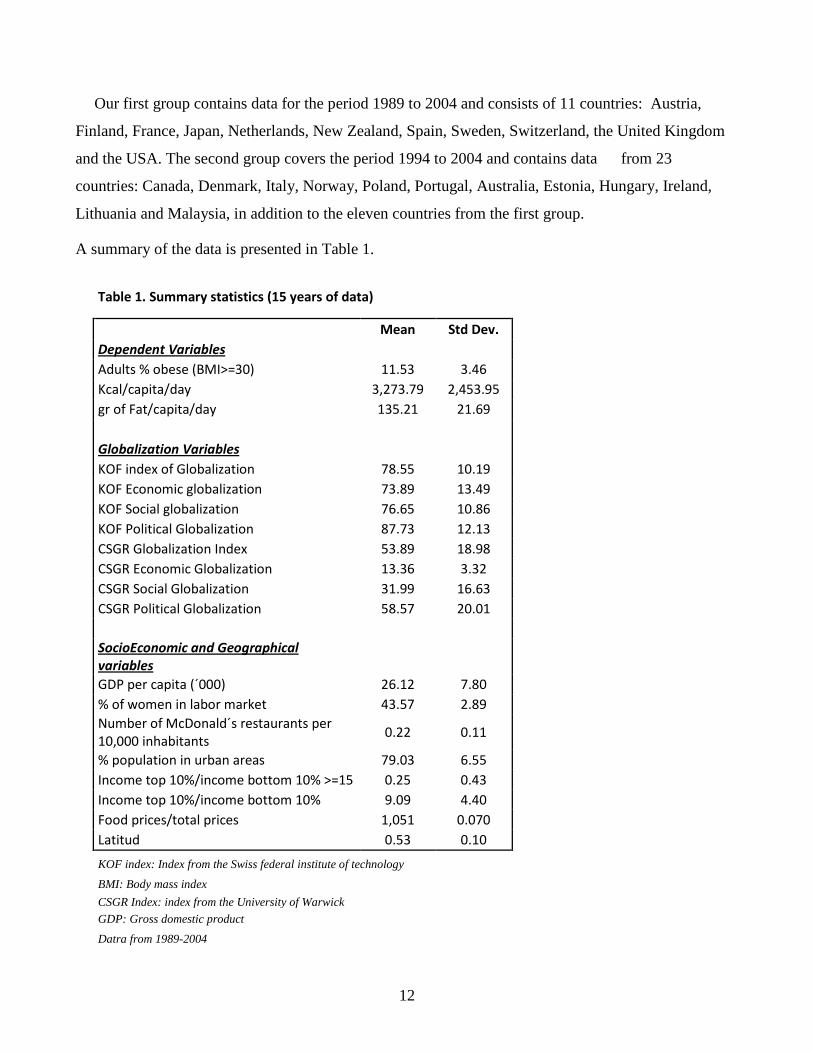
Our first group contains data for the period 1989 to 2004 and consists of 11 countries: Austria,
Finland, France, Japan, Netherlands, New Zealand, Spain, Sweden, Switzerland, the United Kingdom
and the USA. The second group covers the period 1994 to 2004 and contains data from 23
countries: Canada, Denmark, Italy, Norway, Poland, Portugal, Australia, Estonia, Hungary, Ireland,
Lithuania and Malaysia, in addition to the eleven countries from the first group.
A summary of the data is presented in Table 1.
Table 1. Summary statistics (15 years of data)
Mean Std Dev. Dependent Variables Adults % obese (BMI>=30) 11.53 3.46 Kcal/capita/day 3,273.79 2,453.95 gr of Fat/capita/day 135.21 21.69
Globalization Variables KOF index of Globalization 78.55 10.19 KOF Economic globalization 73.89 13.49 KOF Social globalization 76.65 10.86 KOF Political Globalization 87.73 12.13 CSGR Globalization Index 53.89 18.98 CSGR Economic Globalization 13.36 3.32 CSGR Social Globalization 31.99 16.63 CSGR Political Globalization 58.57 20.01
SocioEconomic and Geographical variables
GDP per capita (´000) 26.12 7.80 % of women in labor market 43.57 2.89 Number of McDonald´s restaurants per 10,000 inhabitants 0.22 0.11
% population in urban areas 79.03 6.55 Income top 10%/income bottom 10% >=15 0.25 0.43 Income top 10%/income bottom 10% 9.09 4.40 Food prices/total prices 1,051 0.070 Latitud 0.53 0.10
KOF index: Index from the Swiss federal institute of technology BMI: Body mass index CSGR Index: index from the University of Warwick GDP: Gross domestic product Datra from 1989-2004
13
Countries included: Austria, Finland, France, Japan, Netherlands, New Zealand,
Spain, Sweden, Switzerland, UK, USA.
Obesity Rates
One of our dependent variables is the percentage of population that is obese in a given country. We
have drawn upon data from the OECD Health Data alongside the Global Database on Body Mass
Index, World Health Organization3. A person is considered obese if her body mass index (kg/m2) is at
least 304.
Daily Intake of Calories and Grams of Fat
As an alternative approach, we are using two additional dependent variables. Previous literature
(Cutler et al. 2007) has found that it is mainly the increase in calorie intake rather that the reduction in
energy expended that has been the main driving force behind the increase in obesity. Using Russian
data, Huffman and Rizov, 2007 also found a strong positive effect of caloric intake on obesity. Taking
this into account we are also going to measure the effect of globalization on the grams from fat
consumed and caloric intake.
Data come from FAOSTAT; the Food and Agricultural Organization of the United Nations
FAOSTAT, (http://faostat.fao.org/site/610/default.aspx#ancor).
Globalization Measures
In order to disentangle the mechanisms by which more globalization could lead to a rise in obesity,
we consider three different types of globalization: economic, social and political globalization.
We use two alternative globalization indices that have already been broadly used in the literature
(Potrafke,2010; Dreher, 2006; Bergh and Nilsson, 2010, etc): the CSGR Globalization Index,
developed by the University of Warwick Globalization project (see Lockwood and Redoano, 2005 for
a detailed description) and the KOF Index5 (Dreher, 2006; Dreher and Gaston, 2008 and Dreher et al.
2008). Details about the indices and their components can be found in Appendix A. The description
3 For detailed information on OECD country surveys: http://www.irdes.fr/ecosante/OECD/814010.html. Data can be found at http://www.oecd.org/document/16/0,3343,en_2649_34631_2085200_1_1_1_1,00.html and
http://apps.who.int/bmi/index.jsp 4 In a few cases we were missing some data for a few years and we have infered the missing numbers by just
imputing the average between the year before and after the missing data 5 For a detailed description of the KOF index, see Dreher, 2006.
14
of their components as well as the correlation between the two indices already indicates that the
results obtained are expected to be very similar. The main differences appear between the CSGR and
the KOF Economic indices that present a correlation of only 0.45, while the social and political
indices present correlations of 0.87 and 0.91, respectively.
Other explanatory variables
GDP per capita at current prices (in US Dollars): Data extracted from the IMF’s World
Economic Outlook Database. To take into account the fact that in some countries obesity rates are
higher or growing more quickly among the poor than among the rich (Monteiro, 2007), we will
control for GDP per capita and we will also interact it with some variables such as inequality or
latitude.
Percentage of women in the active population: Data obtained from the World Bank’s Health,
Nutrition and Population (HNP) statistics.
Urbanization: the percentage of urban population in a country. The data has been obtained from the
United Nations (World Urbanization prospects. Revision 2011). The report contains data for every 5
years. We have imputed the changes corresponding to the remaining 4 years in between.
Dummy indicating high inequality: Dummy equal to one for those countries in which the income
share of the 10% richest population is more than 15 times higher than the income share of the 10%
poorest population in a specific year. In our sample, the 75th percentile of the distribution of the
income share of the 10% richest population over the income share of the 10% poorest population is
12.57. Therefore, we are considering just those countries with exceptional inequality compared to the
rest of the sample. The countries with high inequality are: New Zealand, Switzerland, Malaysia,
South Korea, Brazil and China. These data have been calculated based on data from the UNU-
WIDER World Income Inequality Database (WIID).
Number of McDonald’s restaurants per 10,000 persons: Data obtained from the KOF index
providers. We have data from 1994 to 2004. We will present two types of estimates: one that
corresponds to the actual data and another one where the number of restaurants has been calculated
assuming the same average annual growth from 1990 to 1993 then from 1994 to 1997.
Latitude (distance to the Equator): Using CIA’s The World Factbook 2009 data on latitude of the
countries, we normalized the latitude over 1, as is usual in the literature (see for example Acemoglu et
15
al 2000 or La Porta et al 1999). Therefore, latitude equal to zero means that the country is in the
Equator and the closer the latitude is to one, the further the country is from the Equator.
Trade: The value of imports and exports over the GDP in the country. It reflects the commercial
openness of a country. Data obtained from the World Bank’s World Development Indicators.
Food prices: Index of food prices over the consumer prices index in the country. The data comes
from the OECD and Eurostat for most of the countries except for Malaysia and Lithuania, where data
comes from FAO6, and for Spain, where data comes from the National Statistics Institute.
3.2 Methods
To examine the relationship of interest, we use a specification that relates overall globalization as well
as economic and social globalization to the variables of interest: obesity, daily calorie intake and daily
grams of fat consumed in different countries over time. The basic specification is:
Otj= α +Gtj β + Xjt δ+ γ Tt +uj + εtj (1)
Where refers to obesity rates in a year t and a country j (or, alternatively, to daily intake of
calories or grams of fat), G refers to a measure of globalization, X includes all the relevant
characteristics of the country that – according to the literature – could have an impact on obesity,
refers to a country fixed effect, T refers to a general time trend and finally we include in the
model a regression disturbance where ε is the error term.
In order to check for robustness we use several alternative specifications where we vary not only
the number of control variables or the Globalization index (KOF or CSGR) but also the econometric
approach. In this regard, all of our OLS specifications are estimated using robust standard errors to
correct for potential heteroscedasticity. We also present fixed effects estimators. However, since
globalization implies a greater integration between economies, it could very well be the case that
errors are correlated across countries. To allow for heteroscedasticity and contemporaneously
correlated errors across countries, we also use a panel-corrected standard error procedure (PCSE) as
recommended by Beck and Katz, 1995. 6 OECDstats http://stats.oecd.org/Index.aspx?DataSetCode=MEI_PRICES FAO http://faostat.fao.org/site/683/DesktopDefault.aspx?PageID=683#ancor INE http://www.ine.es/
16
4. RESULTS
4.1. Baseline estimations
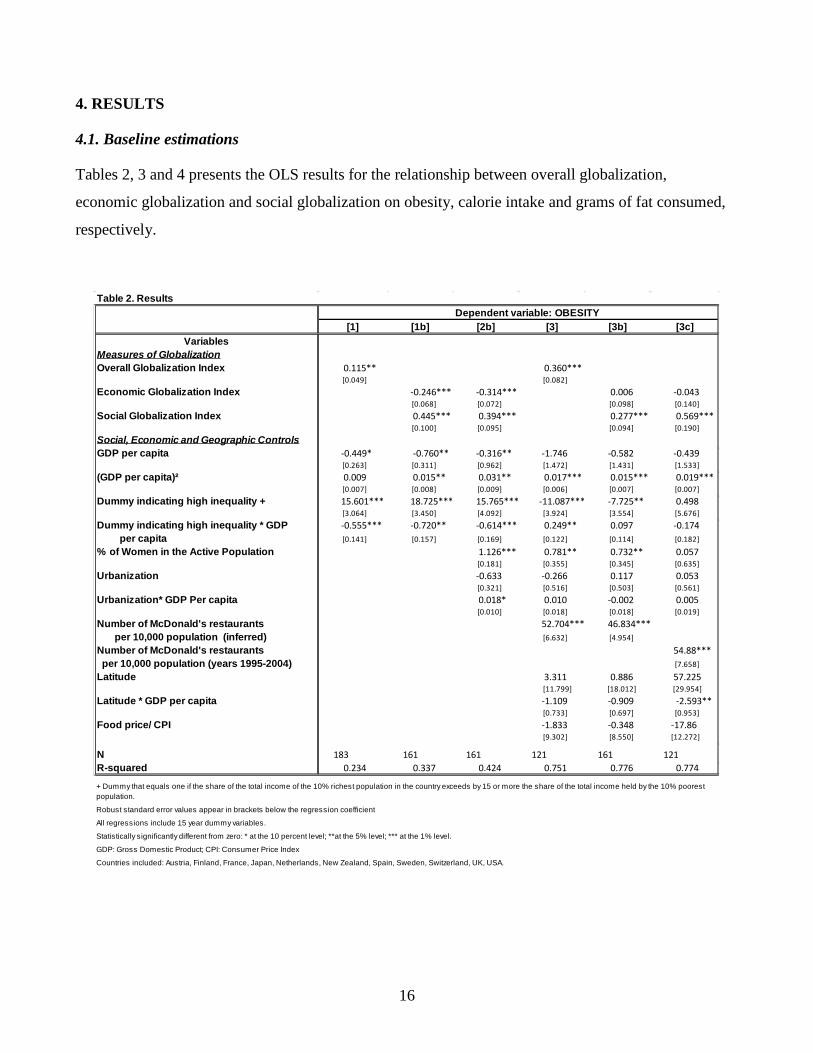
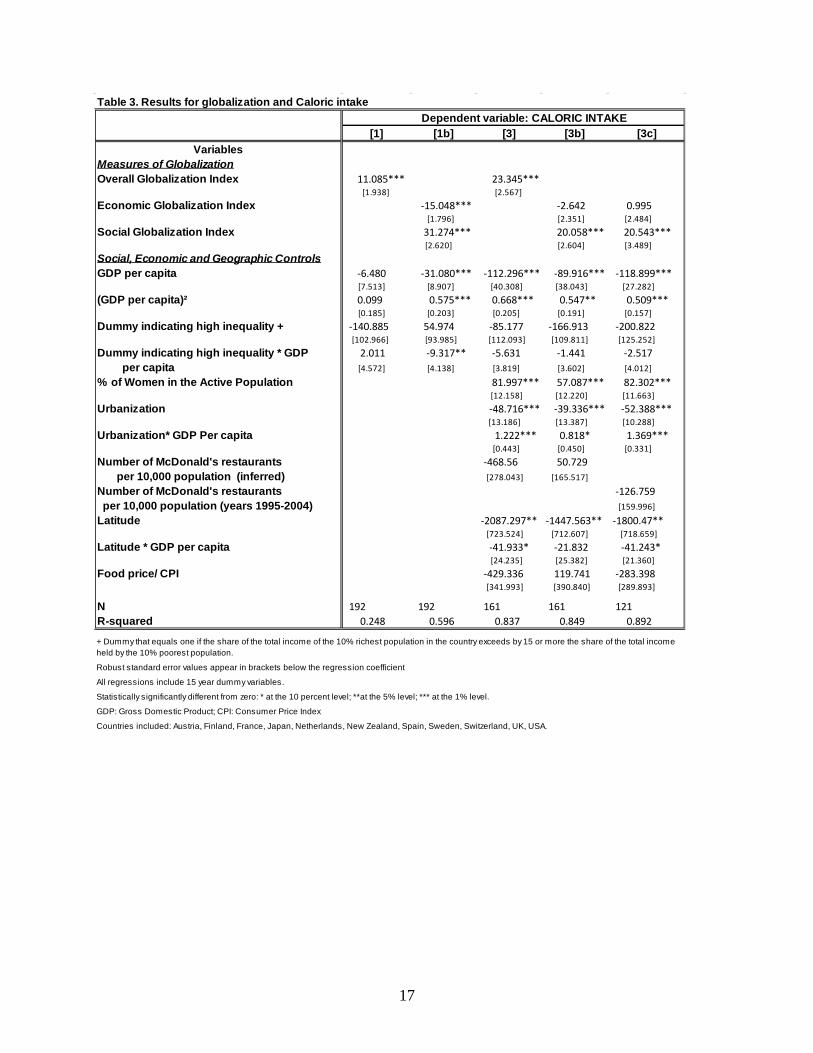
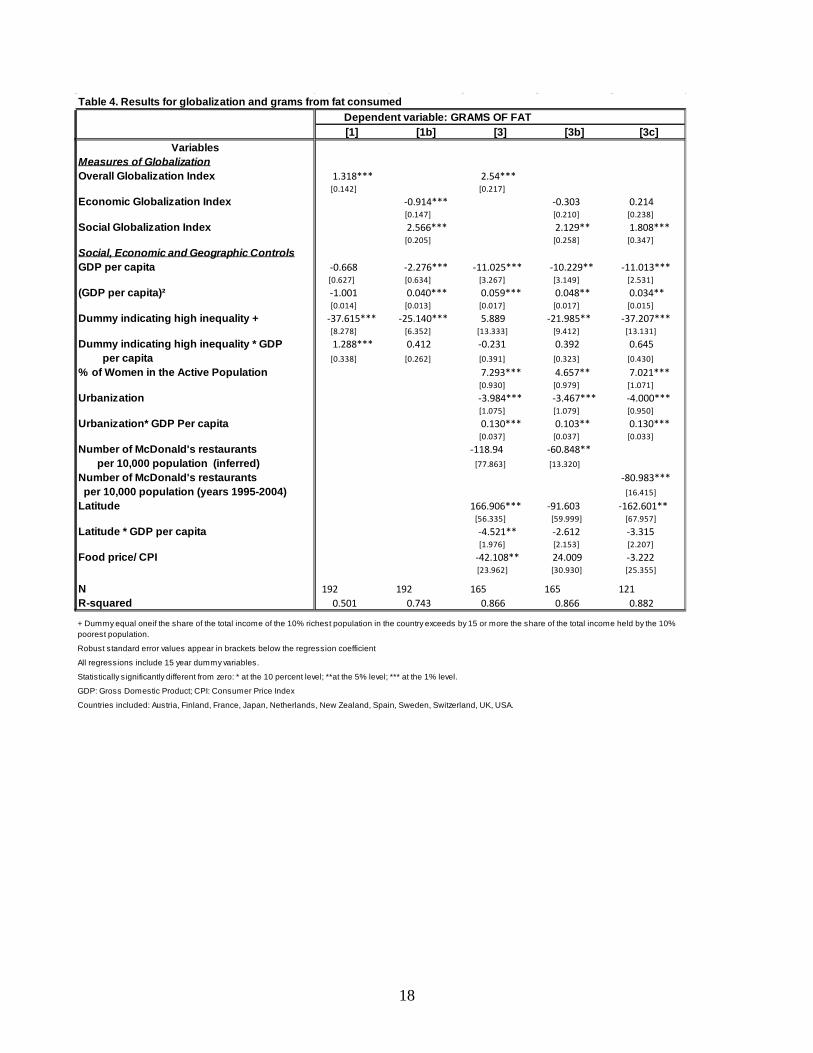
Tables 2, 3 and 4 presents the OLS results for the relationship between overall globalization,
economic globalization and social globalization on obesity, calorie intake and grams of fat consumed,
respectively.
Table 2. ResultsDependent variable: OBESITY
[1] [1b] [2b] [3] [3b] [3c]Variables
Measures of GlobalizationOverall Globalization Index 0.115** 0.360***
[0.049] [0.082]Economic Globalization Index -0.246*** -0.314*** 0.006 -0.043
[0.068] [0.072] [0.098] [0.140]Social Globalization Index 0.445*** 0.394*** 0.277*** 0.569***
[0.100] [0.095] [0.094] [0.190]Social, Economic and Geographic ControlsGDP per capita -0.449* -0.760** -0.316** -1.746 -0.582 -0.439
[0.263] [0.311] [0.962] [1.472] [1.431] [1.533](GDP per capita)² 0.009 0.015** 0.031** 0.017*** 0.015*** 0.019***
[0.007] [0.008] [0.009] [0.006] [0.007] [0.007]Dummy indicating high inequality + 15.601*** 18.725*** 15.765*** -11.087*** -7.725** 0.498
[3.064] [3.450] [4.092] [3.924] [3.554] [5.676]Dummy indicating high inequality * GDP -0.555*** -0.720** -0.614*** 0.249** 0.097 -0.174 per capita [0.141] [0.157] [0.169] [0.122] [0.114] [0.182]
% of Women in the Active Population 1.126*** 0.781** 0.732** 0.057 [0.181] [0.355] [0.345] [0.635]
Urbanization -0.633 -0.266 0.117 0.053 [0.321] [0.516] [0.503] [0.561]
Urbanization* GDP Per capita 0.018* 0.010 -0.002 0.005 [0.010] [0.018] [0.018] [0.019]
Number of McDonald's restaurants 52.704*** 46.834*** per 10,000 population (inferred) [6.632] [4.954]
Number of McDonald's restaurants 54.88*** per 10,000 population (years 1995-2004) [7.658]
Latitude 3.311 0.886 57.225 [11.799] [18.012] [29.954]
Latitude * GDP per capita -1.109 -0.909 -2.593** [0.733] [0.697] [0.953]
Food price/ CPI -1.833 -0.348 -17.86 [9.302] [8.550] [12.272]
N 183 161 161 121 161 121R-squared 0.234 0.337 0.424 0.751 0.776 0.774
Robust standard error values appear in brackets below the regression coefficient
All regressions include 15 year dummy variables.
Statistically significantly different from zero: * at the 10 percent level; **at the 5% level; *** at the 1% level.
GDP: Gross Domestic Product; CPI: Consumer Price Index
Countries included: Austria, Finland, France, Japan, Netherlands, New Zealand, Spain, Sweden, Switzerland, UK, USA.
+ Dummy that equals one if the share of the total income of the 10% richest population in the country exceeds by 15 or more the share of the total income held by the 10% poorest population.
17
Table 3. Results for globalization and Caloric intake Dependent variable: CALORIC INTAKE
[1] [1b] [3] [3b] [3c]Variables
Measures of GlobalizationOverall Globalization Index 11.085*** 23.345***
[1.938] [2.567]Economic Globalization Index -15.048*** -2.642 0.995
[1.796] [2.351] [2.484]Social Globalization Index 31.274*** 20.058*** 20.543***
[2.620] [2.604] [3.489]Social, Economic and Geographic ControlsGDP per capita -6.480 -31.080*** -112.296*** -89.916*** -118.899***
[7.513] [8.907] [40.308] [38.043] [27.282](GDP per capita)² 0.099 0.575*** 0.668*** 0.547** 0.509***
[0.185] [0.203] [0.205] [0.191] [0.157]Dummy indicating high inequality + -140.885 54.974 -85.177 -166.913 -200.822
[102.966] [93.985] [112.093] [109.811] [125.252]Dummy indicating high inequality * GDP 2.011 -9.317** -5.631 -1.441 -2.517 per capita [4.572] [4.138] [3.819] [3.602] [4.012]
% of Women in the Active Population 81.997*** 57.087*** 82.302*** [12.158] [12.220] [11.663]
Urbanization -48.716*** -39.336*** -52.388*** [13.186] [13.387] [10.288]
Urbanization* GDP Per capita 1.222*** 0.818* 1.369*** [0.443] [0.450] [0.331]
Number of McDonald's restaurants -468.56 50.729 per 10,000 population (inferred) [278.043] [165.517]
Number of McDonald's restaurants -126.759 per 10,000 population (years 1995-2004) [159.996]
Latitude -2087.297** -1447.563** -1800.47** [723.524] [712.607] [718.659]
Latitude * GDP per capita -41.933* -21.832 -41.243* [24.235] [25.382] [21.360]
Food price/ CPI -429.336 119.741 -283.398 [341.993] [390.840] [289.893]
N 192 192 161 161 121R-squared 0.248 0.596 0.837 0.849 0.892
Robust standard error values appear in brackets below the regression coefficient
All regressions include 15 year dummy variables.
Statistically significantly different from zero: * at the 10 percent level; **at the 5% level; *** at the 1% level.
GDP: Gross Domestic Product; CPI: Consumer Price Index
Countries included: Austria, Finland, France, Japan, Netherlands, New Zealand, Spain, Sweden, Switzerland, UK, USA.
+ Dummy that equals one if the share of the total income of the 10% richest population in the country exceeds by 15 or more the share of the total income held by the 10% poorest population.
18
Table 4. Results for globalization and grams from fat consumed Dependent variable: GRAMS OF FAT
[1] [1b] [3] [3b] [3c]Variables
Measures of GlobalizationOverall Globalization Index 1.318*** 2.54***
[0.142] [0.217]Economic Globalization Index -0.914*** -0.303 0.214
[0.147] [0.210] [0.238]Social Globalization Index 2.566*** 2.129** 1.808***
[0.205] [0.258] [0.347]Social, Economic and Geographic ControlsGDP per capita -0.668 -2.276*** -11.025*** -10.229** -11.013***
[0.627] [0.634] [3.267] [3.149] [2.531](GDP per capita)² -1.001 0.040*** 0.059*** 0.048** 0.034**
[0.014] [0.013] [0.017] [0.017] [0.015]Dummy indicating high inequality + -37.615*** -25.140*** 5.889 -21.985** -37.207***
[8.278] [6.352] [13.333] [9.412] [13.131]Dummy indicating high inequality * GDP 1.288*** 0.412 -0.231 0.392 0.645 per capita [0.338] [0.262] [0.391] [0.323] [0.430]
% of Women in the Active Population 7.293*** 4.657** 7.021*** [0.930] [0.979] [1.071]
Urbanization -3.984*** -3.467*** -4.000*** [1.075] [1.079] [0.950]
Urbanization* GDP Per capita 0.130*** 0.103** 0.130*** [0.037] [0.037] [0.033]
Number of McDonald's restaurants -118.94 -60.848** per 10,000 population (inferred) [77.863] [13.320]
Number of McDonald's restaurants -80.983*** per 10,000 population (years 1995-2004) [16.415]
Latitude 166.906*** -91.603 -162.601** [56.335] [59.999] [67.957]
Latitude * GDP per capita -4.521** -2.612 -3.315 [1.976] [2.153] [2.207]
Food price/ CPI -42.108** 24.009 -3.222 [23.962] [30.930] [25.355]
N 192 192 165 165 121R-squared 0.501 0.743 0.866 0.866 0.882
Robust standard error values appear in brackets below the regression coefficient
All regressions include 15 year dummy variables.
Statistically significantly different from zero: * at the 10 percent level; **at the 5% level; *** at the 1% level.
GDP: Gross Domestic Product; CPI: Consumer Price Index
Countries included: Austria, Finland, France, Japan, Netherlands, New Zealand, Spain, Sweden, Switzerland, UK, USA.
+ Dummy equal oneif the share of the total income of the 10% richest population in the country exceeds by 15 or more the share of the total income held by the 10% poorest population.
19
OLS regressions present a positive correlation between the KOF index of globalization and
obesity, calorie and grams of fat intake. What is interesting, however, is to distinguish between the
impact of different types of globalization on these variables.
In this respect, when we control only for GDP per capita and inequality measures (Expression 1b),
economic globalization is negatively related with the three dependent variables, indicating that
factors such as better diets or better access to food diversity (thanks to open markets) might prevail.
Social globalization, however, has a positive correlation with obesity and the amount of calories and
grams of fat consumed. This confirms that cultural aspects as well as information flows might play a
key role in diet and types of food consumed. A one standard deviation increase in social globalization
increases obesity by 20 percent and the consumption of calories and fat by 6 and 16 percent,
respectively.
However, as we include more variables that could have an effect on population obesity, such as
the ones presented in section 2, economic globalization is no longer significant. What truly matters is
not the economic globalization index per se, but the underlying mechanisms behind food
consumption. This is the case, for instance, of the percentage of women in the labor force, which has
a constantly positive and significant effect on obesity, calorie intake and grams of fat. In any case, the
impact of social globalization remains.
Looking at the overall impact of globalization –specification [3]- a one standard deviation increase
in the KOF globalization index leads to a rise of 3.66 percentage points in the proportion of obese
population and to a consumption increase of 237.8 kcal and of 25.8 grams of fat.
If we take as a benchmark expression [3b]-[3c] we can observe that, once we control for the
variables that the micro-mechanisms that the economic and health literature has found to explain
obesity, the impact of economic globalization does not appear to be statistically significant for any of
the three dependent variables. However, social globalization remains statistically significant and
positive. A one standard deviation increase in the KOF index of social globalization implies a rise of
3 percentage points in the proportion of obese population. It leads to a rise of 217 kcal and of 23.1
grams of fat consumed, respectively.
The percentage of women active in the labor market has, as expected, a consistent positive relation
with the percentage of obese population as well as with caloric intake and the grams of fat consumed.
A one standard deviation increase in the active female labor force leads to a rise of 2.1 percentage
20
points in the share of obese population. It also implies a rise of 165 in the intake of kcal and of 13.5
more grams of fat.
Also as expected, relative food prices have a negative impact on these variables, even though it is
only significant for the case of grams of fat consumed.
The percentage of urban population is not associated with the level of obesity. However, it has a
consistently negative impact on calorie and fat intake. This result indicates that, even though more
urbanization implies more sedentary lifestyles, it also relates to more food availability and this effect
prevails regarding the overall relationship between urbanization and obesity. Following the results of
Bleich et al. (2007), our regressions also find that this relationship is of a greater magnitude for richer
economies. The opposite is the case when we look at the number of McDonalds per capita. It has a
positive relationship with obesity; however, it is statistically significant and negative in the
consumption of grams of fat.
Finally, our findings show that a rise in income has a negative effect on the percentage of
population obesity. However, this impact is less important as countries get poorer.
4.2. Sensitivity Analysis
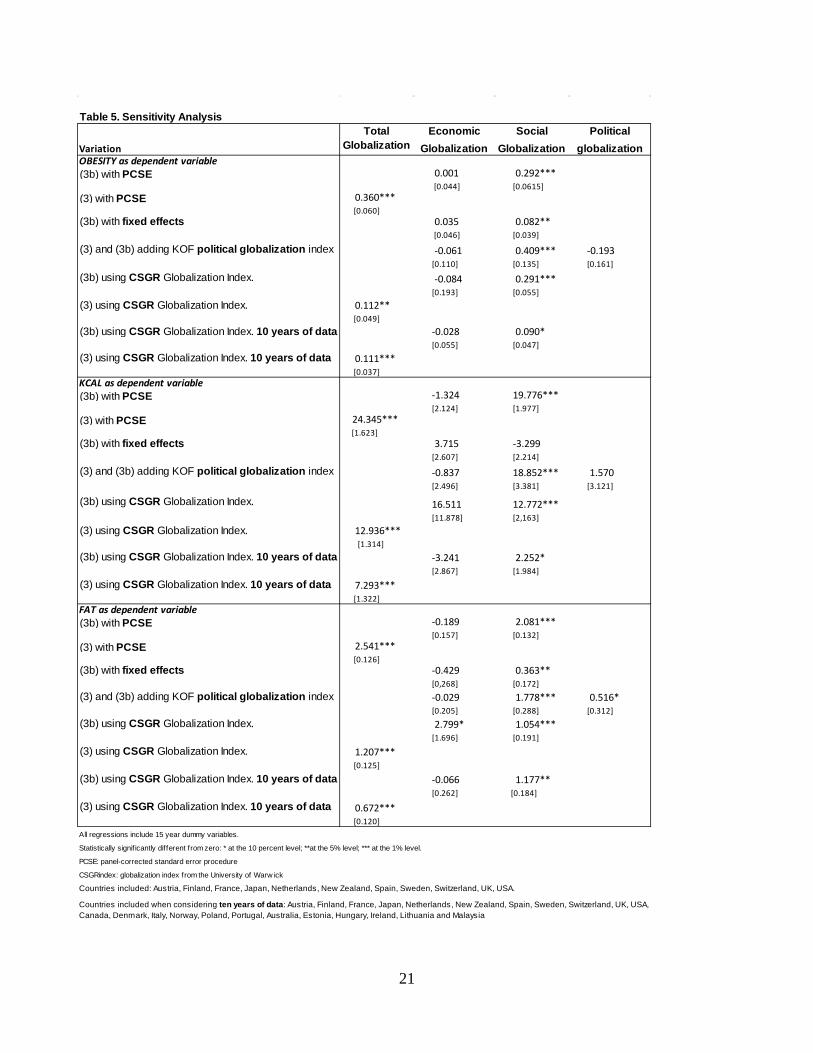
Table 5 expands the sensitivity analysis already performed in Tables 2, 3 and 4. It lists the effect of
different types of globalization on the three dependent variables for several sensitivity tests to see
how results change when we use different econometric specifications as well as different sets of
countries. All of them include the full set of control variables as used in expressions (3) and (3b). All
results are robust with the previous findings.
The first type of sensitivity analysis addresses the possibility of using different econometric
specifications. The first three columns include panel-corrected standard errors (PCSE) and fixed
effects (FE) estimates. In all cases total globalization has a significantly positive relationship with the
three dependent variables. Here as well, as we separate the two types of globalization, it is only the
social globalization index that shows a significant positive effect on obesity and on fat and calorie
intake.
21
Table 5. Sensitivity Analysis
Variation
Total Globalization
I d
Economic Globalization
Social Globalization
Political globalization
OBESITY as dependent variable(3b) with PCSE 0.001 0.292***
[0.044] [0.0615](3) with PCSE 0.360***
[0.060] (3b) with fixed effects 0.035 0.082**
[0.046] [0.039]
(3) and (3b) adding KOF political globalization index -0.061 0.409*** -0.193 [0.110] [0.135] [0.161]
(3b) using CSGR Globalization Index. -0.084 0.291*** [0.193] [0.055]
(3) using CSGR Globalization Index. 0.112** [0.049]
(3b) using CSGR Globalization Index. 10 years of data -0.028 0.090* [0.055] [0.047]
(3) using CSGR Globalization Index. 10 years of data 0.111*** [0.037]
KCAL as dependent variable(3b) with PCSE -1.324 19.776***
[2.124] [1.977](3) with PCSE 24.345***
[1.623](3b) with fixed effects 3.715 -3.299
[2.607] [2.214]
(3) and (3b) adding KOF political globalization index -0.837 18.852*** 1.570 [2.496] [3.381] [3.121]
(3b) using CSGR Globalization Index. 16.511 12.772*** [11.878] [2,163]
(3) using CSGR Globalization Index. 12.936*** [1.314]
(3b) using CSGR Globalization Index. 10 years of data -3.241 2.252* [2.867] [1.984]
(3) using CSGR Globalization Index. 10 years of data 7.293*** [1.322]
FAT as dependent variable(3b) with PCSE -0.189 2.081***
[0.157] [0.132](3) with PCSE 2.541***
[0.126](3b) with fixed effects -0.429 0.363**
[0,268] [0.172](3) and (3b) adding KOF political globalization index -0.029 1.778*** 0.516*
[0.205] [0.288] [0.312](3b) using CSGR Globalization Index. 2.799* 1.054***
[1.696] [0.191]
(3) using CSGR Globalization Index. 1.207*** [0.125]
(3b) using CSGR Globalization Index. 10 years of data -0.066 1.177** [0.262] [0.184]
(3) using CSGR Globalization Index. 10 years of data 0.672*** [0.120]
All regressions include 15 year dummy variables.
Statistically signif icantly different from zero: * at the 10 percent level; **at the 5% level; *** at the 1% level.
PCSE: panel-corrected standard error procedure
CSGRindex: globalization index from the University of Warw ick
Countries included: Austria, Finland, France, Japan, Netherlands, New Zealand, Spain, Sweden, Switzerland, UK, USA.
Countries included when considering ten years of data: Austria, Finland, France, Japan, Netherlands, New Zealand, Spain, Sweden, Switzerland, UK, USA, Canada, Denmark, Italy, Norway, Poland, Portugal, Australia, Estonia, Hungary, Ireland, Lithuania and Malaysia
22
Another type of robustness test addresses the role of all the different types of globalization.
Specification four also includes the coefficient of political globalization. There is no literature
supporting much of a relationship between this type of globalization and obesity. Hence, it is not
surprising that we find no statistically significant relationship between political globalization and
obesity nor with calorie intake. It shows, however, a positive relation with the amount of fat
consumed.
Next we examine the robustness of the results using the CSGR as an alternative globalization
index. Once again, results remain robust with total globalization having a positive relationship with
obesity and consumption of calories and grams of fat. When distinguishing between economic and
social CSGR globalization, once again, the positive relationship between economic globalization and
the dependent variables fades away as we include the relevant mechanisms behind obesity as found in
the literature. Once again, the positive relationship with social globalization remains. Here, with this
set of countries and years of data, a one standard deviation increase in the CSGR index of social
globalization implies an increase of 4.8 percentage points in the share of obese population, and a
higher consumption of kcal and grams of fat of 212 and 17, respectively.
Finally, we also address the trade-off between having a broader set of countries but with fewer
years of data. In the last specification, we show the results with ten years of data and 23 countries.
The relationship between globalization and obesity, calories and fat consumed prevails.
To summarize, the relationship between globalization and obesity is very robust and positive.
However, when we disentangle the different mechanisms at work, we find that economic
globalization per se is not significantly positively related to obesity. What matters are aspects such as
food prices, the percentage of women in the active labor force, or income per capita. The same is true
for the amount of calories and fat consumed.
Social globalization keeps presenting a positive relationship with obesity, but most likely, if we
could perform the same exercise and control for all the potential mechanisms, this impact might also
disappear.
23
5. CONCLUSIONS
This paper addresses the question of macro-determinants of the so-called obesity epidemic, and more
specifically the relationship between different types of globalization and obesity, alongside calorie
and fat intake. We provide an empirical account of such an association by controlling for some of the
micro-mechanisms for which there is available data.
Our findings provide suggestive evidence consistent with the hypothesis that social globalization
has a positive relationship with obesity, but that the effects of economic globalization are conveyed
by micro-mechanisms such as food price decline and female labor market participation. The effect of
social globalization – as defined in the data appendix and the data section below – is such that the
doubling of that component leads to a large share of the BMI rise of the world population, with
elasticity estimates up to 7%. Results are robust to the inclusion of other pathways that might be
plausibly considered to influence obesity As we keep controlling for micro-determinants – such as
the percentage of women in the labor force, income, and urbanization or food prices –they all capture
the overall significance of economic globalization. This could be, in great part, due to the fact that
economic globalization might just work through these mechanisms. In contrast, social globalization
encompasses environmental effects that are not fully captured by the micro-mechanisms included and
hence remains as a significant variable. However, it is important to observe that not all of them affect
globalization with a positive sign and that there was no evidence of high multi-colinearity among the
variables measuring globalization and its micro-mechanisms. We leave to future research the
expansion of other variables that could not be examined here due to data availability constraints.
In addition to this principal result, our analysis also generates the following additional findings:
We report effects that are more significant in the case of fat intake, indicating that most likely, before
becoming obese, a population exhibits a spike in calories consumed from fat. This might explain why
only 10 years of data are enough to identify a larger impact of total globalization or social
globalization on grams of fat consumed than on total calories consumed or obesity.
Second, participation of women in the labor force presents a positive impact on all three dependent
variables. This effect is particularly significant for fat intake, indicating that again, probably, before
becoming obese a population starts by consuming more calories and more calories from fat.
Third, urbanization is found to be related to a lower consumption of grams of fat and of calories
but it is not statistically significant in explaining obesity. That is, urbanization can trigger an
24
expansion in the availability of diverse food and influence sedentary habits. However, as countries
become richer urbanization shows more of a positive relationship with the three dependent variables.
Finally, we find that income plays a significant role; however, such an effect is heterogeneous across
countries. Our results show that a rise in income in rich countries has, if anything, a negative effect
on the percentage of population obesity. However, an income increase in poor countries has a
positive impact on the percentage of their population that is obese and even more so on their caloric
intake.
Our results suggest that, while the micromechanisms that could affect the link between economic
globalization and obesity are quite well understood, this is not the case of the ones related to the role
of social globalization which might have environmental effects which are not fully captured by
micro-mechanisms. Obesity emerges in social and cultural contexts that can lead similar economic
environments to have different effects on obesity. Those are important factors that need to be yet
fully understood.
25
REFERENCES
Beck, N. and Katz, J.N., 1995. What to do (and not to do) with time series cross-section data. American Political Science Review 89:634-647.
Bergh, A. and Nilsson, T., 2010. Good for living? On the Relationship Between Globalization and Life Expectancy. World Development 38(9): 1191-1203.
Bowan, A.A. and Gortmaker,S.L., 2004. Effects of fast-food consumption on energy intake and diet quality among children in the National Household Survey. Pediatrics 113 (1): 112-118.
Cawley, J. and Liu, F., 2007. Maternal Employment and Childhood Obesity: A Search for Mechanisms in Time Use Data. Economics and Human Biology 10(4), 352-364.
Cawley, J. and Meyerhoefer, C., 2012. The Medical Care Costs of Obesity: An Instrumental Variables Approach. Journal of Health Economics 31(1):219–230. Chou, SY, Rashad, I. and Grossman, M., 2008. Fast-Food Restaurant Advertising on Television and Its Influence on Childhood Obesity. Journal of Law and Economics 51:599-618.
Costa-Font, J. and Gil, J., 2004. Social Interactions and the contemporaneous determinants of individual´s weight. Applied Economics 36: 2253-2263.
Cutler, D.M., Glaeser, E.L. and Shapiro, J.M., 2003. Why Have Americans Become More Obese?. Journal of Economic Perspectives 17:93-118.
Dreeben, O., 2001. Health status of African Americans. Journal of Health and Social Policy 14: 1-17.
Dreher, A. 2006. Does Globalization Affect Growth?. Applied Economics 38(10): 1091-1110.
Dreher, A. and Gaston, N., 2008. Has globalization increased inequality?. Review of International Economics 16(3): 516-536.
Dreher, A, Gaston, N. and Martens, P., 2008. Measuring Globalization: Gauging Its Consequences, Springer.
Duffey K.J., Gordon-Larsen P., Shikany J.M., Guilkey D., Jacobs D.R., Jr., Popkin B.M., 2010. Food price and diet and health outcomes: 20 years of the CARDIA Study.Archives of Internal Medicine 170:420–426.
Egger, G., Swinburn, B. and Islam, F.M.A. 2012. Economic growth and obesity: an interesting relationship with world-wide implications. Economics and Human Biology 10: 147-153.
Flegal K.M., Carroll M.D., Kit BK and Ogden, C.L., 2012. Prevalence of obesity and trends in the distribution of Body Mass Index Among US adults 1999-2010. Journal of the American Medical Association 307(5):491-497.
Frank B. et al. 2003. Television Watching and Other Sedentary Behaviors in Relation to Risk of Obesity and Type 2 Diabetes Mellitus in Women. Journal of the American Medical Association 289(14):1785-1791.
Frenk D.J., 2012. The obesity prevention source Globalization. http://www.hsph.harvard.edu/obesity-prevention-source/obesity-causes/globalization-and-obesity/.
Fuchs, V., 1982. Time preferences and health: an exploration study. In: Fuchs, V. (ed.) Economics Aspects of Health. Chicago, University of Chicago Press, 93-120.
26
Hill,J Edward L. Melanson, and Holly T. Wyatt, 2000. Dietary fat intake and regulation of energy balance: implications for obesity. Journal of Nutrition 130(2): 284.
Huffman, S.K. and Rizov, M., 2007. Determinants of obesity in transition economies: the case of Russia. Economics and Human Biology 5: 379-391.
Jeffery, R.W. and S.A. French (1998) “Epidemic obesity in the United States: are fast foods and television viewing contributing? American Journal of Public Health 88(2): 277-289).
Kenkel, D., 2000, Prevention. In: Culyer, A., Newhouse, J. (eds.). Handbook of Health Economics, vol. 1A, Amsterdam: North Holland, Elseiver, 1675-1720.
Kim S., Moon, S. and Popkin, B.M., 2000. the Nutrition Transition in South Korea. American Journal of Clinical Nutrition 71: 44-53.
Knai, C., Suhrcke, M. and Lobstein, T., 2007. Obesity in Eastern Europe: an overview of its health and economic implications. Economics and Human Biology 5: 392-408.
Komlos, J., Smith, P. and Bogin, B., 2004. Obesity and the rate of time preference: is there a connection?. Journal of Biosocial Science 36, part 2, 209-219.
Komlos, J. and Brabec, M., 2011. The Trend of BMI Values by Deciles of US Adults birth cohorts 1882-1986. Economics and Human Biology 9(·): 234-250.
Lakdawalla, D and T Philipson (2009), “The growth of obesity and technological change” Economics and Human Biology, 7:283-293.
Lake, A and Townshend, T., 2006. Obsogenic environments: exploring the built and food environments. The Journal of the Royal Society for the Promotion of Health 126: 262-267.
Lockwood, B. and Redoano, M., 2005. The CSGR Globalisation Index: an Introductory Guide. Centre for the Study of Globalisation and Regionalisation Working Paper 155/04.
McLaren, L., 2007. Socioeconomic status and obesity. Epidemiologic Review. 29: 29-48.
Monteiro C.A., Benicio M.H., Mondini, L. Popkin, B.M., 2000. Shifting Obesity Trends in Brazil. European Journal of Clinical Nutrition 54:342-346.
Offer, A., Pechey, R. and Ulijaszek, S., 2010. Obesity under affluence varies by welfare regimes: the effect of fast food, insecurity and inequality. Economics and Human Biology 8: 297-308.
Offer, A., Pechey, R. and Ulijaszek, S., 2013. Insecurity, inequality and obesity in affluent societies. Oxford: Oxford University Press. ISBN-978-0-19-726498-0; ISSN 0068-1202. Paeratakul S., Popkin B.M., Ge K., Adair, L.S. and Stevens, J., 1998. Changes in Diet and Phisical Activity Affect the body Mass Index of Shines Adults. International Journal of Obesity 22:424-432.
Phillipson, TJ. (2001) “The world-wide growth in obesity: an economic research agenda” Health Economics, 10 (1): 1-17.
Philipson, T and R Posner (2003), “The Long Run Growth of Obesity as a Function of Technological Change”, Perspectives in Biology and Medicine, 46:87-108.
Popkin, B.M., 2001. The Nutrition Transition and Obesity in the Developing World. The Journal of Nutrition 131(3): 8715-8735.
Popkin, B.M., 2004. The nutrition transition: worldwide obesity dynamics and their determinants. International Journal of Obesity 28.
Popkin, B.M., 2007. The world is fat. Scientific American 297: 88-95.
27
Potrafke, N., 2010. The Growth of Public Health Expenditures in OECD Countries: do Government Ideology and Electoral Motives Matter?. Journal of Health Economics 29, 6: 797-810.
Powell, L.M. and Bao, Y., 2009. Food prices, access to food outlets and child weight. Economics and Human Biology 7: 64-72.
Prentice, A.M. and Jebb, S.A., 1995. Obesity in Britain: Gluttony or sloth?. British Medical Journal. 311 : 437-9.
Ruhm, C.J., 2000. Are recessions good for your health?. Quarterly Journal of Economics 115(2): 617-650.
Robinson, T.N., 1999 Reducing Children's Television Viewing to Prevent Obesity. A Randomized controlled Trial, Journal of the American Medical Association 282(16):1561-1567.
Sobal, J. and Stunkard, A. J., 1989. Socioeconomic status and obesity: a review of the literature. Psychological Bulletin 105: 260-275.
Sobal, J., 1991. Obesity and socioeconomic status: a framework for examining relationships between physical and social variables. Medical Antropology 13: 231-248.
Swinburn, B.A., Egger, G., Raza F., 1999. Disecting obesogenic environments: the development and application of a framework for identifying and prioritizing environmental interventions for obesity. Preventive Medicine 29: 563-570.
Sundquist, J. and Johansson, S.E., 1998. The influence of socio-economic status, ethnicity and lifestyle on body mass index in a longitudinal study. International Journal of Epidemiology 27: 57-63.
Ulijaszek, S.J., 2007. Frameworks of population obesity and the use of cultural consensus modeling in the study of environments contributing to obesity. Economics and Human Biology 5: 443-457.
Ulijaszek, S.J. and Schwekendiek, D., 2012. Intercontinental differences inoverweight of adopted Koreans in the United States and Europe. Economics and Human Biology 2012. Sept 23. Doi: 10.1016/j.ehb.2012.09.001.
Wansink, B., 2004. Environmental Factors that Unknowingly Increase a Consumer's Food Intake and Consumption Volume". Annual Review of Nutrition. 24: 455-479.
Welch, N., Hunter, W., Butera, K. et al., 2009. Women's work. Maintaining a healthy body weight. Appetite 53:9–15.
28
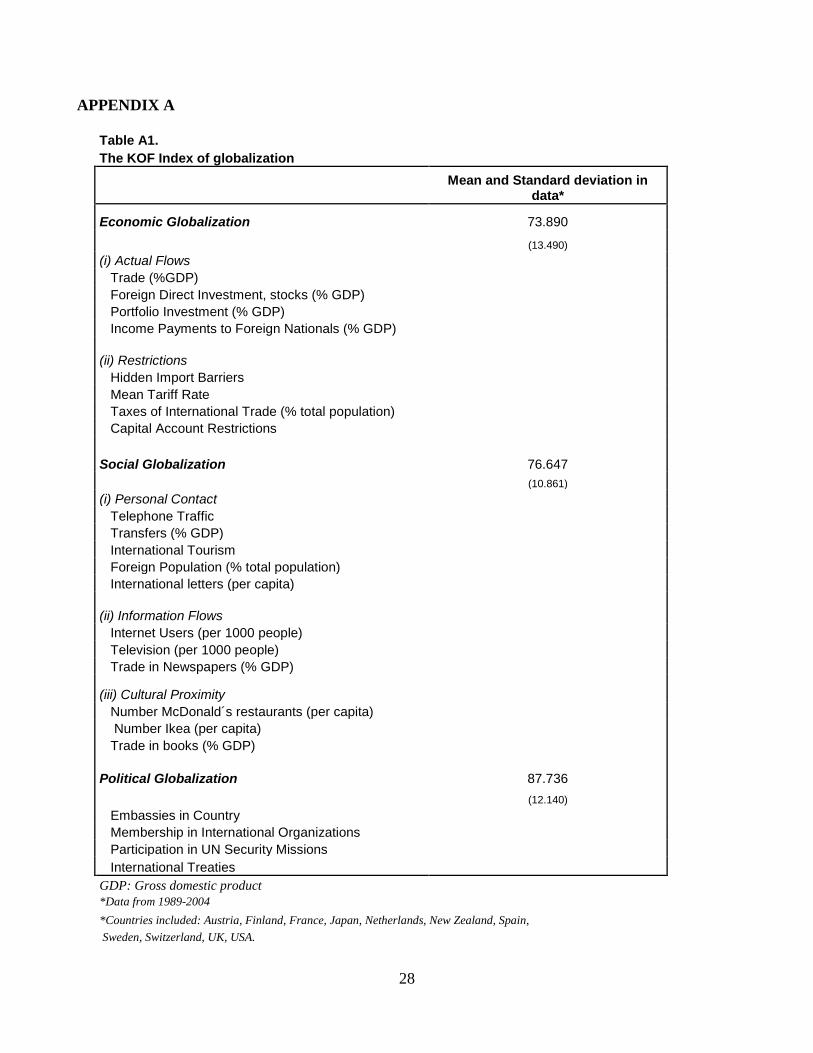
APPENDIX A
Table A1. The KOF Index of globalization
Mean and Standard deviation in
data*
Economic Globalization 73.890 (13.490) (i) Actual Flows Trade (%GDP) Foreign Direct Investment, stocks (% GDP) Portfolio Investment (% GDP) Income Payments to Foreign Nationals (% GDP)
(ii) Restrictions Hidden Import Barriers Mean Tariff Rate Taxes of International Trade (% total population) Capital Account Restrictions
Social Globalization 76.647 (10.861) (i) Personal Contact Telephone Traffic Transfers (% GDP) International Tourism Foreign Population (% total population) International letters (per capita)
(ii) Information Flows Internet Users (per 1000 people) Television (per 1000 people) Trade in Newspapers (% GDP)
(iii) Cultural Proximity Number McDonald´s restaurants (per capita) Number Ikea (per capita) Trade in books (% GDP)
Political Globalization 87.736 (12.140) Embassies in Country Membership in International Organizations Participation in UN Security Missions International Treaties GDP: Gross domestic product *Data from 1989-2004 *Countries included: Austria, Finland, France, Japan, Netherlands, New Zealand, Spain, Sweden, Switzerland, UK, USA.
29
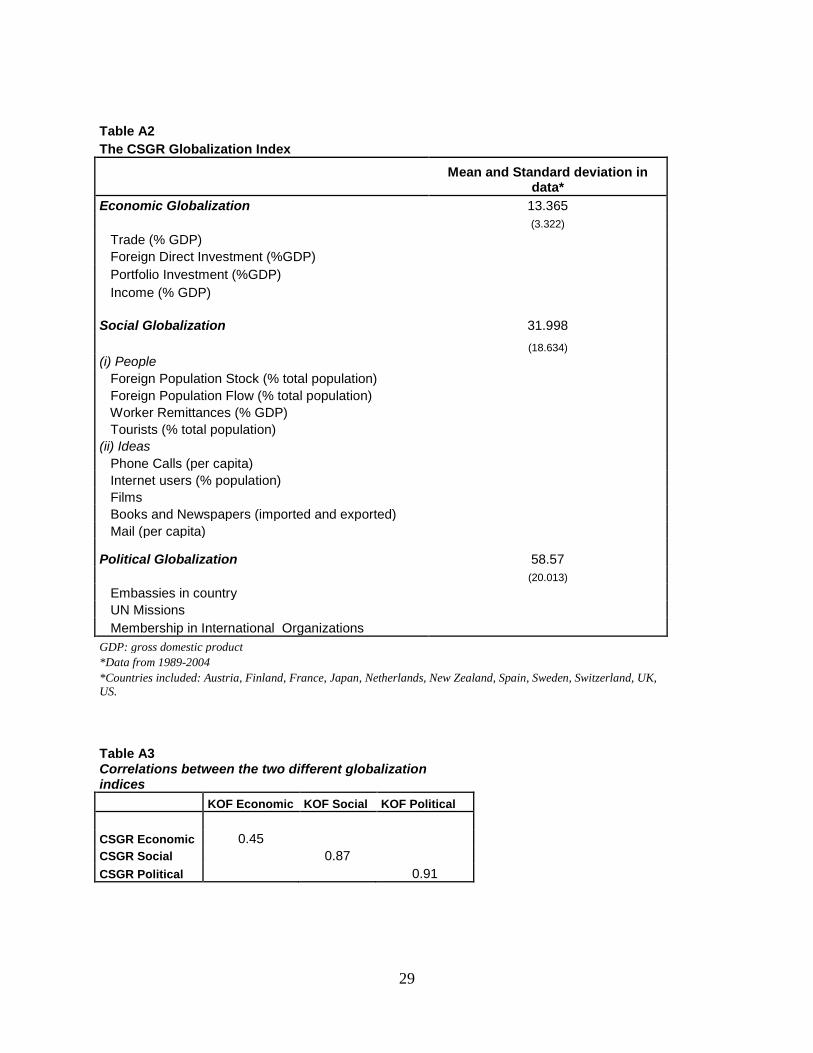
Table A2 The CSGR Globalization Index
Mean and Standard deviation in
data* Economic Globalization 13.365 (3.322) Trade (% GDP) Foreign Direct Investment (%GDP) Portfolio Investment (%GDP) Income (% GDP)
Social Globalization 31.998 (18.634) (i) People Foreign Population Stock (% total population) Foreign Population Flow (% total population) Worker Remittances (% GDP) Tourists (% total population) (ii) Ideas Phone Calls (per capita) Internet users (% population) Films Books and Newspapers (imported and exported) Mail (per capita)
Political Globalization 58.57 (20.013) Embassies in country UN Missions Membership in International Organizations GDP: gross domestic product *Data from 1989-2004 *Countries included: Austria, Finland, France, Japan, Netherlands, New Zealand, Spain, Sweden, Switzerland, UK, US. Table A3 Correlations between the two different globalization indices KOF Economic KOF Social KOF Political CSGR Economic 0.45 CSGR Social 0.87 CSGR Political 0.91

For further information on this or any of the
Health publications contact:
Naho Ollason
Managing Editor
LSE Health
The London School of Economics and Political Science
Houghton Street
London WC2A 2AE
Tel: + 44 (0)20 7955 6989
Fax: + 44 (0)20 7955 6090
Email: [email protected]
Website: lse.ac.uk/LSEHealthAndSocialCare/aboutUs/LSEHealth/home.aspx
11_0997 Working paper 24 new size:Layout 1 20/1/12 15:24 Page 2