jl.mh. thamrin no.2 jakarta 10110 - indonesia … monetary policy report bank indonesia downward...
TRANSCRIPT
Jl.MH. Thamrin No.2 Jakarta 10110 - Indonesiahttp://www.bi.go.id

BANK INDONESIAFor further information, please contact:Economic Outlook & Policy DisseminationBureau of Monetary Policy Directorate of Economic Research and Monetary Policy
Telephone : +62 61 3818163 +62 21 3818206Fax. : +62 21 3452489E-mail : [email protected] : http://www.bi.go.id

i
MONETARY POLICY REPORTBANk INdONEsIA
The Monetary Policy Report is published quarterly by Bank Indonesia after the Board of Governors’
Meetings in January, April, July, and October. In addition to fulfilling the mandate of article 58
of Act Number 23 of 1999 concerning Bank Indonesia, amended by Act No. 3 of 2004, the
report has two main purposes: (i) to function as a tangible product of a forward-looking working
framework in which formulation of monetary policy is based on economic and inflation forecasts;
and (ii) as a medium for the Board of Governors of Bank Indonesia to present to the public the
various policy considerations underlying its monetary policy decisions.
The Board of Governors
Boediono Governor
Miranda S. Goeltom Senior Deputy Governor
Hartadi A. Sarwono Deputy Governor
Siti Ch. Fadjrijah Deputy Governor
S. Budi Rochadi Deputy Governor
Muliaman D. Hadad Deputy Governor
Ardhayadi Mitroatmodjo Deputy Governor
Budi Mulya Deputy Governor
MONETARY POLICY REPORTQUARTER II-2009

ii
MONETARY POLICY REPORTBANk INdONEsIA

iii
MONETARY POLICY REPORTBANk INdONEsIA
Monetary Policy Strategy
Underlying Principles
Under the ITF, the inflation target is established as the overriding objective and nominal anchor for monetary policy. In this regard, Bank Indonesia has adopted a forward looking strategy by guiding the present monetary policy response for achievement of a medium-term inflation target.
The application of the ITF does not mean that monetary policy disregards economic growth. The basic monetary policy paradigm of striking the optimum balance between inflation and economic growth is retained in both setting the inflation target and in the monetary policy response by focusing on achievement of low, stable inflation in the medium to long-term.
The Inflation Target
After consultations with Bank Indonesia, the Government has determined and announced the CPI inflation target at 5%+1%, 4.5%+1% and 4%+1% for 2008, 2009 and 2010. The inflation target is consistent with the process of disinflation aimed at medium to long-term inflation competitive with other nations at about 3%.
Monetary Instruments and Operations
The BI Rate is the published policy rate reflecting the monetary policy stance adopted by Bank Indonesia. The BI Rate is a signal for achieving the medium to long-term inflation target and is announced periodically by Bank Indonesia for a specific period. To strengthen the operational framework for monetary policy, Bank Indonesia changed from use of the 1-month SBI rate as the operational target to the overnight interbank rate with effect from 9 June 2008. In monetary operations, the BI Rate is implemented through liquidity management on the money market to achieve the monetary policy operational target, reflected in movement in the overnight interbank money market rate. To enhance the effectiveness of liquidity management on the market, a set of standing facilities in combination with an interest rate corridor is employed in day-to-day monetary operations.
Policymaking Process
The BI Rate is determined by the Board of Governors in the Monthly Board of Governors’ Meeting. In unforeseen circumstances, the monetary policy stance may be adjusted in advance of the Monthly Board of Governors’ Meeting in a weekly Board of Governors’ Meeting. Changes in the BI Rate essentially depict the Bank Indonesia monetary policy response for guiding the forecasted level of inflation within the limits of the established inflation target.
Transparency
Monetary policy is regularly communicated to the public through customary media for communication, such as statements to the press and market actors, website postings and publication of the Monetary Policy Report (MPR). This transparency is aimed at building improved understanding and shaping public expectations of the economic and inflation outlook and the monetary response taken by Bank Indonesia.
Coordination with the Government
For the purpose of coordination in inflation targeting, monitoring and control, the Government and Bank Indonesia have established a team of officials representing the various relevant agencies. The task of the Team is to deliberate and recommend the necessary policy actions for the Government and Bank Indonesia in managing inflationary pressures for achievement of the established inflation target.
Steps for Reinforcing Monetary Policy with the Overriding Objective of Price Stability (Inflation Targeting Framework)
In July 2005, Bank Indonesia launched a reinforced monetary policy framework consistent with the Inflation Targeting Framework (ITF), encompassing four key elements: (1) use of the BI Rate as the policy reference rate, (2) anticipatory monetary policymaking process, (3) more transparent communications strategy and (4) closer policy coordination with the Government. These measures are intended to strengthen monetary policy effectiveness and governance in order to achieve the overriding objective of price stability in support of sustainable economic growth and greater public prosperity.
Enhanced Monetary Policy Measures Under Inflation Targeting Framework
In July 2005, Bank Indonesia implemented and enhanced monetary policy measures within the Inflation Targeting Framework (ITF) which encompasses four main areas: the use of the BI rate as an operational target, enhanced decision making process, more transparent communications strategy, and strengthened policy coordination with the Government. The measures is intended to strengthen the effectiveness and to provide good governance to its monetary policy making to achieve the price stability needed to support suistainable economic growth and attain social welfare.

iv
MONETARY POLICY REPORTBANk INdONEsIA

v
MONETARY POLICY REPORTBANk INdONEsIA
Foreword
The second quarter of 2009 was marked by initial signs of improvement in the world economy. Expectations
of recovery under way kindled positive sentiment on world financial markets. However, the improvement in the
economic outlook is not regarded sufficient to compensate for the global economic slowdown, which has its origin
mainly in advanced nations. Indonesia’s domestic economy has entered a period of slowdown, although not as
severe as originally projected. Externally, the balance of payments is performing ahead earlier forecasts, bolstered
by the improving outlook for the global economy, rising commodity prices and signs of renewed stability on global
financial markets.
Economic growth during Q2/2009 is estimated in the range of 3.7%-4.0%, below the 4.4% charted in
Q1/2009. Indonesia’s weaker economic growth is explained primarily by contraction in exports and slowing growth
in household consumption. Export performance is down considerably from the same period one year earlier as a
result of sluggish expansion in the world economy, including Indonesia’s major trading partners. Private consumption
expenditures have weakened in the absence of significant improvement in purchasing power. Nevertheless, spending
related to the presidential election and the payment of the 13th month salary to civil servants has helped keep private
consumption from steeper decline.
Indonesia’s balance of payments recorded an estimated second quarter surplus. Rising global commodity
prices and more vigorous demand from emerging markets, led by China and India, contributed to a surplus in the
current account. On the other hand, the capital and financial account posted a deficit. As a result of capital reversal
sustained briefly on domestic financial markets from mid-June 2009, portfolio investment in Q2/2009 fell short of
earlier predictions. International reserves reached USD57.58 billion, equivalent to 5.6 months of imports and servicing
of official debt.
Conditions in the domestic financial sector have improved in line with global developments and conducive
domestic macroeconomic indicators. During Q2/2009, the rupiah maintained an appreciating trend and yield on
Indonesian government securities with support from robust domestic fundamentals. At the end of the quarter, these
indicators sustained some correction due to the effect of unsettled global conditions.
Banking system liquidity is in more ample supply, as reflected in the growing placements of banking funds in
monetary instruments, increased volume of interbank money market transactions and fall in interbank rates. The
The Governor of Bank Indonesia

vi
MONETARY POLICY REPORTBANk INdONEsIA
downward interest rate response in the banking system is still limited to deposit rates. Lending rates have eased at a
slower pace, while credit expansion remains tight.
The downward inflationary trend continues. Inflationary pressure has eased in response to measures to safeguard
food supplies and exchange rate appreciation. Q2/2009 inflation was recorded at -0.15% (qtq), well below the historical
trend. Measured cumulatively, CPI inflation is at a very modest 0.21% (ytd), or 3.65% (yoy).
In 2009, the Indonesian economy has potential to chart higher than forecasted growth. GDP growth in 2009
is predicted in the 3.5%-4.0% range. At the same time, the outlook for CPI inflation is steady decline to about 5%
in 2009, with a substantial downward bias.
Bank Indonesia will stay the course with monetary policy conducive to domestic demand while remaining committed
to safeguarding economic stability in the medium to long-term. In the banking sector, Bank Indonesia will move
forward with the banking consolidation and intermediation programmes and strengthen the resilience of the banking
system amid the global economic turmoil. This concludes the overview of the Bank Indonesia progress report for
Q2/2009.
Jakarta, 2 July 2009
On behalf of
THE GOVERNOR OF BANK INDONESIA
Miranda S. Goeltom

Monetary Policy Report - Quarter I-2009Contents
MONETARY POLICY REPORTBANk INdONEsIA
vii
Contents
1. General Review ............................................................................ 1
2. Latest Macroeconomic Indicators ................................................ 5
Deveopments In The World Economy ............................................. 5
Economic Growth ........................................................................... 6
Balance of Payments ...................................................................... 13
3. Monetary Indicators and Policy, QII-2009 .............................................. 16
Rupiah Exchange Rate ................................................................................ 17
Inflation ..................................................................................................... 18
Monetary Policy ......................................................................................... 21
4. The Indonesian Economic Outlook......................................................... 26
Assumptions and Scenarios ....................................................................... 26
Economic Growth Outlook ........................................................................ 27
Inflation Forecast ............................................................................. 31
Risks................................................................................................ 32
5. Monetary Policy Response, QII-2009 ...................................................... 34
Statistics........................................................................................................ 35

General Review
1
1. General Review
Developments in the global economy suggest a gathering momentum in the recovery
process, although still daunted by risks. In developed nations, various indicators of
macroeconomic recovery have shown an improving trend. Government-sponsored stimulus
packages and financial sector stabilisation programmes have successfully bolstered public
confidence, and in turn strengthened consumption. Conditions on credit markets have also
begun to improve in an added development encouraging greater private consumption.
Despite this, stubbornly high levels of unemployment pose risks daunting the economic
recovery process in these nations. On the other hand, economic recovery is gaining
momentum in emerging market countries, led by China, India and Korea. Investment
activity in China, under way since the beginning of the year, is supported by a fiscal stimulus
through infrastructure spending and brisk credit expansion Resurgent domestic demand in
these Asian economies has stimulated improved economic performance in other countries
in the region. Despite this, the economic improvement in some emerging market countries
is not yet regarded sufficient to compensate for the slowdown in advanced economies. In
response to these developments, further contraction is predicted in the global economy,
although at a lesser pace.
Expectations of world economic recovery have fuelled positive developments
on global financial markets. Global financial sector performance showed steady gains
throughout Q2/2009. Stock markets in developed economies recorded index gains on the
back of positive sentiment linked to improvement in bank performance in the wake of the
stress tests, optimism for stabilisation of the financial sector and economic conditions and
positive performance reported in financial statements published by some world financial
institutions. Banking sector conditions have shown improvement, as reflected in a relaxation
of lending standards. These financial market developments in advanced nations have in turn
impacted financial markets in the region. Despite this, financial market developments took a
downturn near the end of the period, triggered by negative sentiment related to stubbornly
high levels of unemployment in the United States and Europe.
The improving trend in the global economy has had a positive impact on Indonesia’s
economic performance. The impact of strengthening demand in trading partners, led by
China and India, has boosted Indonesian exports of commodities such as CPO, coal and
copper,. Despite the steady improvement, the lack of recovery in the global economy means
that exports continue to suffer contraction. Concerning domestic demand, the flagging pace
of private consumption has been mitigated by the presidential election and the payout of
the 13th month salary to civil servants. Investment activity remains limited under the present
conditions of continued weak demand and low levels of capacity utilisation. In view of these
developments, economic growth in Q2/2009 is estimated at 3.7%-4.0%.
In regard to prices, the declining inflation trend is set to continue. During June 2009,
consumer goods prices recorded 0.11% inflation (mtm), considerably below the historical
level and earlier projections. Increases in some international food commodity prices were

Monetary Policy Report - Quarter II-2009
2
again offset by appreciation in the rupiah, thus keeping a lid on increases in domestic prices.
Besides the appreciation in the rupiah, improving expectations of inflation bolstered by
the accelerated pace of disinflation brought down the rate of core inflation. Measures to
safeguard adequate supplies of food staples also helped maintain low inflation in Q2/2009.
Taken together, cumulative inflation in the CPI measured 0.21% (ytd) or 3.65% (yoy).
Rising commodity prices and strengthening demand in emerging market countries
also bolstered the balance of payments, which is performing ahead of earlier
predictions. Balance of payments performance has strengthened on the back of a larger
than expected surplus in the current account. Non-oil and gas exports have received a boost
from rising global market commodity prices, led by mining commodities and crude palm
oil, and also from resurgent demand in emerging market nations and especially China and
India. In the capital and financial account, portfolio investments again recorded a surplus.
Improving conditions on global financial markets and sustained positive perceptions of the
domestic economy have prompted renewed growth in portfolio capital inflows. However,
following the capital reversal that hit domestic financial markets in mid-June 2009, portfolio
investment levels for Q2/2009 were not as high as predicted. Inflows for direct investment
are also estimated to have climbed in response to growing exploration activity by oil and
natural gas companies. Furthermore, the confidence that has been maintained in the
domestic economic outlook and the freeing up of global financial markets has led to higher
than forecasted disbursements on private foreign debt. As a result, international reserves
reached US$57.58 billion at end-June/2009, equivalent to 5.6 months of imports and
servicing of official debt.
Improvement in the balance of payments and positive sentiment on the global
market have brought about exchange rate appreciation. Compared to other countries
in the region, the rupiah maintained the second highest rate of appreciation after the Korean
won. Averaged over Q2/2009, the rupiah gained 9.99% on the back of increased supply
of foreign currency in response to foreign capital inflows. Optimism for global economic
recovery alongside carefully managed domestic economic fundamentals, reflected in the
balance of payments surplus and attractive yields on rupiah instruments, has stimulated risk
appetite for financial assets in emerging markets, including Indonesia. Despite this, negative
sentiment over global economic developments prompted a slight drop in the value of the
rupiah at end-Q2/2009 compared to early June 2009.
In the financial sector, global developments and conducive domestic macroeconomic
indicators have had a positive effect on the domestic financial sector. The stock
market charted overall index gains during Q2/2009 despite temporary capital reversal near
the end of the quarter that prompted a dip in the stock index. Improvement in domestic
fundamentals and rising global commodity prices have paved the way for brisk share
buying activity by foreign and domestic investors. On the bond market, yield on Indonesian
government securities eased in line with the downward movement in the monetary policy
rate and resurgent interest among foreign investors. Despite this, Government Securities yield
in longer tenors (above 15 years) remains high, reflecting strong risk perceptions.

General Review
3
In the banking sector, the national banking system is in comparatively stable
condition despite the limited banking response to monetary easing. At the micro
level, conditions in the Indonesian banking system were again stable, as indicated by the
safe level of the capital adequacy ratio (CAR) at a high 17.3% in May 2009. Alongside this,
the gross non-performing loans (NPLs) ratio has been held below 5% with net NPLs less
than 2%. Banking liquidity, including liquidity on the interbank money market, is steadily
improving alongside growth in depositor funds. Despite this, bank interest rates again showed
only limited response. The base lending rate response to the 250 bps reduction in the BI
Rate from December 2008 to June 2009 measured no more than about 45 bps in figures
for May 2009. In a related development, bank loan disbursements for the position at May
2009 saw further contraction at 1.1% (ytd). Even so, liquidity in the economy was adequate.
Although the expansion in monetary aggregates (cash outside banks and M1) remains very
thin, calculations based on fundamentals indicate that the trend in monetary aggregates
is still commensurate to the needs of the economy. With loan interest rates declining at
a slower pace and the very limited rate of credit expansion, indications are emerging of a
more intensive shift under way in business towards non-bank financing alternatives, such
as bond issues.
Looking forward, the economic growth outlook is better than originally predicted.
In the short-term, economic projections will be strongly influenced by global developments.
The predicted contraction in exports for the year as a whole is expected to be offset by a
surge in private consumption from the national elections. Given the bigger than expected
impact from the election of parliamentary and local assembly candidates in Q1/2009, the
2009 presidential polls are predicted to contribute significantly to private consumption. While
purchasing power has yet to show significant improvement, private consumption is forecasted
to maintain brisk growth in 2009 from the knock-on effects of the national elections. Against
this background, the economy has potential to chart higher than projected growth for 2009
as a whole. Indonesia’s GDP is forecasted at 3.5%-4.0% growth by end-2009, with a bias
towards the upper limit of this band.
Indonesia’s balance of payments is predicted to chart a surplus for 2009 overall,
strengthened by improvement in global economic conditions, rising commodity prices and
ongoing stabilisation of global financial markets. Exports are predicted to improve in response
to the more evenly distributed improvement in the global economy across the world’s regions
since Q3/2008 and the ongoing rise in world commodity prices. In the capital and financial
account, foreign capital inflows in portfolio and direct investments are set to continue in line
with optimism for world economic recovery alongside more conducive conditions on global
financial markets. In addition, capital inflows in the public sector are expected to shore up
performance in the capital and financial account.
After factoring in these developments, the Bank Indonesia Board of Governors
Meeting on 03 July 2009 decided to lower the BI Rate by 25 bps from 7.0% to
6.75%. This decision is expected to bolster measures for sustaining optimism in domestic
economic growth.

Monetary Policy Report - Quarter II-2009
4
Looking ahead, monetary policy will seek to maintain a balance between bolstering the
domestic economy amid the persistent sluggishness of the global economy and maintaining
macroeconomic stability over the medium-term with the looming increase in inflationary
pressure in 2010. Accordingly, future monetary policy will pursue a more prudent
course in view of the progressively limited room for monetary relaxation.

Latest Macroeconomic Indicators
5
2. Latest Macroeconomic Indicators
Economic growth in Q2/2009 is estimated to have slowed to about 3.7-4.0% (y-o-y).
On the demand side, preliminary figures indicate that all GDP components maintained
a slowing trend. Although improvement in the global economy provided some
support for Indonesia’s exports during Q2/2009, the global economy itself remains
in contraction with the result that exports sustained further significant contraction
during Q2/2009. However, the economy was prevented from slowing further by
private consumption expenditures related to the first round of the presidential
election. Alongside this, investment growth is estimated lower in keeping with
weakening demand and lack of improvement in business sentiment. On the supply-
side, growth in some economic sectors is believed to have slowed during Q2/2009
due to weakening external and domestic demand. Some economic sectors are
nevertheless predicted to chart improved growth on the back of rising demand related
to the activities for holding the presidential election. This uplift is expected in the
transportation and telecommunications sector, the services sector and manufacturing,
with focus on the food and beverages, paper and printed products and the textile
industry subsectors.
DEVELOPMENTS IN THE WORLD ECONOMY
The global economic outlook has shown steady improvement. Key to the present
outlook is the stabilisation process in the financial sector, support from massive
fiscal stimulus packages, low interest rates and the onset of recovery in consumer
and business confidence. The various monetary easing and fiscal stimulus responses
pursued in almost all countries have reinvigorated market optimism for the global economic
outlook. The recovery trend in the world economy is reflected in the slowing rate of decline
in macroeconomic indicators, with many even convinced that the worst is over. Overall, the
world economy is estimated to have sustained further contraction in
Q2/2009, but this is thought to be more limited compared to the actual
drop in economic growth during Q1/2009. Improvement in the world
economy has been driven more by growth in developed economies,
while advanced nations remain in a trough.
The US economy is estimated to have declined further in Q2/2009.
This downward trend is the result of flagging economic activity triggered
mainly by falling private investment in non-residential business and
loss of exports caused by the collapse in world demand. On the other
hand, growth in US household consumption remains in positive territory
bolstered by the various cash aid policies launched by US government.
US household incomes in April were up from the preceding month, due
to the effect of social benefits provided by the US government (Graph
2.1). Despite this, concerns over the tight labour market and future
Graph 2.1
USA Household Income and Expenditure
������
����
����
����
���
���
���
���
����
����
����
���
���
���
���
���
������ ������ ������ ������ ������ ������ ������ ������ ������ ������
�����
�����������������
������������������
�����������
�

Monetary Policy Report - Quarter II-2009
6
uncertainties have prompted households to cut back consumption and
shift money to savings, as reflected in the surge in the savings rate to
a 14-year high. In the initial response to improvement in consumption
indicators, economic activity has picked up in the manufacturing sector.
Reflecting this is the falling inventory to sales ratio, improved purchasing
manager index (PMI) and slowing contraction in industrial production
(Graph 2.2).
Conditions in the global financial sector have seen steady
improvement. Tight liquidity conditions are easing in response to
liquidity flows and the quantitative easing policies adopted by some
central banks. Liquidity injections by central banks such as the Fed,
BOE, BOJ and ECB have eased tight conditions on credit markets, with
improvement reflected in the narrowing in the LIBOR-Overnight Index
Swap (OIS) spread to levels preceding the Lehman Brothers bankruptcy.
Improvement in the financial sector was also indicated by the results of stress tests by the
Fed. These tests concluded that the US banking system is adequately resilient to financial
turmoil, with shortfalls in the capital requirement not as great as originally suspected. In
more recent developments, some banks even plan to repay the TARP (Trouble Asset Relief
Programme) funding to the Government ahead of schedule and are able to comply with the
required capital adequacy without setting off financial market turmoil.
Indications of more vigorous economic growth in Q2/2009 are also visible in Asia.
Economic gains in China have boosted growth across the Asian region. This improvement
in the Chinese economy is reflected in the solid growth in fixed asset investments and high
rate of bank loan disbursements, added to which is the mega stimulus package worth 4
trillion yuan (586 billion US dollars).
World inflation remains on a downward trend due to slowing economic activity
and persistently low level of commodity prices compared to 2008. Some nations,
notably the US, Japan, China and India, even reported deflation in May 2009. Even so,
the improvement in the future economic outlook has been accompanied by escalation in
international oil prices that could drive up future inflation. These conditions have prompted
central banks around the world to pursue monetary relaxation with greater caution. For these
reasons, the improving developments in the global economy must be monitored closely in
view of the associated risks.
ECONOMIC GROWTH
Aggregate Demand
Within Indonesia, the improvement the global economy has resulted in a positive contribution
to export performance. However, in view of the ongoing global economic contraction, export
growth remains negative despite resistance to decline related to indications of improved
demand in developing countries. Import growth is also estimated in negative territory,
consistent with the declining intensity of economic activity (Table 2.1). At home, the domestic
Graph 2.2
USA Capacity Utilization and Industrial Production
����� �
���
����
����
��
��
��
��
��
��������������������
��������������������������
��� ��� ��� ��� ��� ��� ��� ������� ���� ����

Latest Macroeconomic Indicators
7
economic slowdown has been restrained to some extent by consumption expenditures in
advance of the first round of the presidential election. Alongside this, investment is also
predicted to slump further due to weakening economic activity. GDP
growth in Q2/2009 is estimated in the range of 3.7%-4.0% (yoy).
Confirming this slowing trend are leading GDP indicators suggesting
that economic growth will remain in a slowing phase for at least the
next 5 months (Graph 2.3).
Private consumption growth is estimated to have slackened in
Q2/2009. This slowdown is consistent with movement in the leading
indicators for private consumption, which suggest that growth will
continue to slow for at least two more quarters (Graph 2.4). With
companies still laying off workers, the downward pressure on public
purchasing power is forecasted to continue. Despite this, incomes from
the harvest at end-Q1/2009, payment of the 13th month salary for civil
servants and expenditures in advance of the presidential election offer
potential to keep private consumption from steeper decline. The arrest
in the decline of private consumption in Q2/2009 was also supported by
developments in early indicators, most of which showed gains in April
2009. In the overall analysis, household consumption recorded lower
estimated growth during Q2/2009 in the 3.8%-4.5% range (yoy).
Some early indicators in April 2009 point to improvement in
private consumption during the quarter under review, compared
to one quarter earlier. Concerning financing, the real M1 and real
consumption credit indicators suggest that support private consumption
financing is largely stable. Middle and upper class purchasing power is on
the rise, as indicated by the increased growth in shopping transactions
paid with debit/ATM cards and credit cards as of mid-Q2/2009 compared
to the average growth recorded for January-March 2009. Besides
this, positive indications are evident in private consumption growth,
especially for durable goods, as borne out in rising sales of electronic
Graph 2.3
Leading Indicators of GDP
��������� ����������������
����
����
����
�����
�����
�����
����
����
����
�����
�����
�����
� �� ��� �� � �� ��� �� � �� ��� �� � �� ��� �� � �� ��� �� � �� ��� �� � �� ��� �� � ������ ���� ���� ���� ���� ���� ���� ����
�������������������������������������� ����������������������������������������������������������� ��������������������������������������������������
��������������������������������������������������������������������������������������
����������������������������������������������������������������������������������������������
% Y-o-Y, Base Year 2000
II III IV I II III IV I II*I t e m
Table 2.1
Economic Growth - Demand Side
2007
* Bank Indonesia Projection Figures
Total Consumption 4.6 5.3 5.0 4.9 5.5 5.5 6.3 6.4 5.9 7.2 4 .9 - 5 .6
Private Consumption 4.7 5.1 5.5 5.0 5.7 5.5 5.3 4.8 5.3 5.8 3 .8 - 4 .5
Government Consumption 3.8 6.5 2.0 3.9 3.6 5.3 14.1 16.4 10.4 19.2 12.9 - 13.5
Gross Domestic Fixed Capital Formation 7.6 9.7 12.4 9.4 13.7 12.0 12.2 9.1 11.7 3.5 1 .9 - 2 .4
Export of Goods and Services 10.4 7.4 7.9 8.5 13.6 12.4 10.6 1.8 9.5 -19.1 (-17.4) - (-16.5)
Import of Goods and Services 6.5 7.0 13.9 9.0 18.0 16.1 11.0 -3.5 10.0 -24.1 (-21.3 - (-19.9)
GDP 6.6 6.6 5.8 6.3 6.2 6.4 6.4 5.2 6.1 4.4 3 .7 - 4 .0
20072008
20082009
Graph 2.4
Leading Indicators of Private Consumption
����
����
����
����
����
�����
�����
�����
�����
��
��
��
���
���
���
���
���
���
� �� ��� �� � �� ��� �� � �� ��� �� � �� ��� �� � �� ��� �� � �� ��� �� � �� ��� �� � �� ��� ��
���� ���� ���� ���� ���� ���� ���� ����
��������������������������������������
��������������������� ���������������������

Monetary Policy Report - Quarter II-2009
8
Graph 2.7
Construction and Non-Construction Investment Growth
������������� ����������������� �����������������������������
�
�
�
��
��
���
���
�
��
��
��
��
� �� ��� �� � �� ��� �� � ��
�������
���� ���� ����
products and motor vehicles, led by motorcycles. However, growth in
consumer goods imports has undergone steep decline. On the other
hand, consumer confidence is rising, buoyed by expectations of higher
incomes and greater availability of employment. The Bank Indonesia
Consumer Confidence Indicator (IKK-BI, Graph 2.5) shows improvement
mainly from strengthening consumer perceptions of current conditions,
which are comparatively stable in the aftermath of the presidential poll,
and of conditions 6 months forward due to mounting expectations of
better incomes bolstered by the payment of a 13th month salary to civil
servants at the end of the quarter under review. Alongside this, the real
retail sales index is moving upwards, particularly in the food and tobacco
category, in keeping with falling prices.
Purchasing power indicators in some regions confirm a levelling
out in the slowing consumption trend. Consumption credit has
maintained a stable trend across all regions alongside improvement
in public optimism indicated by a rise in the Consumer Confidence
Index in all regions. Added to this, the Farmer Terms of Trade have also
shown positive developments, most importantly in the Java-Bali-Nusa
Tenggara region.
Investment growth in Q2/2009 is predicted to ease due to
the present flagging levels of external demand and business
confidence. Leading indicators for investment until Q2/2009 suggest
that investment growth will remain in the contractionary stage of
the cycle for at least the next four months (Graph 2.6). The slowing
investment growth is explained primarily by falling non-construction
investment related to the low capacity for external absorption and lack of
improvement in global risks and uncertainties. Delays in the disbursement
of the fiscal stimulus and commencement of infrastructure projects have
weakened business tendencies, despite relative stable domestic conditions
leading up to the presidential polls. In addition, the establishment of two
agencies, the Infrastructure Fund and the Guarantee Fund, to accelerate
the process of infrastructure construction did not produce visible results
in Q2/2009. Accordingly, private consumption in Q2/2009 is estimated
to have charted 1.9%-2.2% growth (yoy), down from the preceding
quarter. Analysed in terms of distribution, preliminary figures suggest that
the investment growth share in Q2/2009 is still bolstered by construction
investment (Graph 2.7).
Slowing investment growth is also confirmed by developments
in a range of preliminary indicators. Growth in non-construction
investment is estimated to have declined in keeping with falling demand
for foreign machinery and equipment and flagging imports of capital
goods (Graph 2.8). On the other hand, construction investment growth
Graph 2.5
Consumer Confidence Index - BI Consumer Survey
��
��
��
��
���
���
���
� � � � � � � � � �� �� �� � � � � � � � � � �� �� �� � � � � � ������ ���� ����
������������������� ����������������������������� �������������������������
����������
����������
�����
Graph 2.6
Investment Leading Indicators
��
��
��
��
��
���
���
���
���
���
���
� �� ��� �� � �� ��� �� � �� ��� �� � �� ��� �� � �� ��� �� � �� ��� �� � �� ��� �� � ������ ���� ���� ���� ���� ���� ���� ����
����������������������������� ��������������
��������������������������������������������������������������������������
Latest Macroeconomic Indicators
9
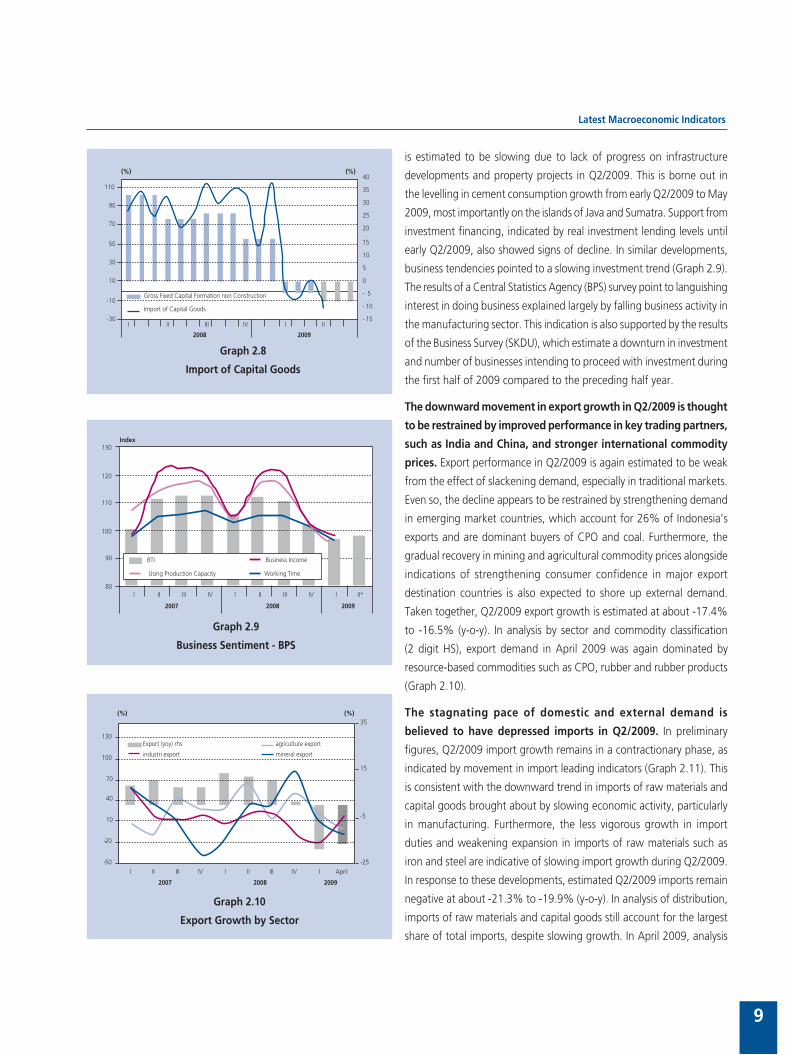
is estimated to be slowing due to lack of progress on infrastructure
developments and property projects in Q2/2009. This is borne out in
the levelling in cement consumption growth from early Q2/2009 to May
2009, most importantly on the islands of Java and Sumatra. Support from
investment financing, indicated by real investment lending levels until
early Q2/2009, also showed signs of decline. In similar developments,
business tendencies pointed to a slowing investment trend (Graph 2.9).
The results of a Central Statistics Agency (BPS) survey point to languishing
interest in doing business explained largely by falling business activity in
the manufacturing sector. This indication is also supported by the results
of the Business Survey (SKDU), which estimate a downturn in investment
and number of businesses intending to proceed with investment during
the first half of 2009 compared to the preceding half year.
The downward movement in export growth in Q2/2009 is thought
to be restrained by improved performance in key trading partners,
such as India and China, and stronger international commodity
prices. Export performance in Q2/2009 is again estimated to be weak
from the effect of slackening demand, especially in traditional markets.
Even so, the decline appears to be restrained by strengthening demand
in emerging market countries, which account for 26% of Indonesia’s
exports and are dominant buyers of CPO and coal. Furthermore, the
gradual recovery in mining and agricultural commodity prices alongside
indications of strengthening consumer confidence in major export
destination countries is also expected to shore up external demand.
Taken together, Q2/2009 export growth is estimated at about -17.4%
to -16.5% (y-o-y). In analysis by sector and commodity classification
(2 digit HS), export demand in April 2009 was again dominated by
resource-based commodities such as CPO, rubber and rubber products
(Graph 2.10).
The stagnating pace of domestic and external demand is
believed to have depressed imports in Q2/2009. In preliminary
figures, Q2/2009 import growth remains in a contractionary phase, as
indicated by movement in import leading indicators (Graph 2.11). This
is consistent with the downward trend in imports of raw materials and
capital goods brought about by slowing economic activity, particularly
in manufacturing. Furthermore, the less vigorous growth in import
duties and weakening expansion in imports of raw materials such as
iron and steel are indicative of slowing import growth during Q2/2009.
In response to these developments, estimated Q2/2009 imports remain
negative at about -21.3% to -19.9% (y-o-y). In analysis of distribution,
imports of raw materials and capital goods still account for the largest
share of total imports, despite slowing growth. In April 2009, analysis
Graph 2.8
Import of Capital Goods
� ��
� ��
� �
�
�
��
��
��
��
��
��
��
���
���
��
��
��
��
��
���
� �� ��� �� � ��
���� ����
����������������������������������������������
�����������������������
��� ���
Graph 2.9
Business Sentiment - BPS
��
��
���
���
���
���
� �� ��� �� � �� ��� �� � ���
���� ���� ����
�����
��� ���������������
������������������������� ������������
Graph 2.10
Export Growth by Sector
���������������� ������������������
��������������� ��������������
���
��
��
��
���
���
��
��
��
���
���
� �� ��� �� � �� ��� �� � �����
���� ���� ����
��� ���

Monetary Policy Report - Quarter II-2009
10
by HS2 digit commodity classification showed that imported growth
continued to rely on imports of raw material commodities and capital
goods in support of production, such as machinery/mechanical tools
and iron and steel.
Government Financial Operations
In April-May 2009, the state budget posted a Rp 5.8 trillion
surplus (0.1% of GDP), almost on par with performance in the
same period one year earlier, when the budget surplus reached
Rp 3.6 trillion (also 0.1% of GDP). Compared to the same period one
year before, estimated Government financial operations in Q2/2009
were down both in revenues and expenditures. Diminishing revenues
in January-May 2009 led to a reduced budget surplus compared to the
same period in 2008. Measured against the 2009 target, the outcome
in state revenues and grants was down from the same period one year
before, due to the flagging performance of the taxation sector. In contrast, absorption of
budget expenditures fared better during the quarter, with improvements recorded in central
government expenditures and transfers to the regions.
Taxation revenues were down in Q2/2009 in response to the slowdown in the
economy and the launching of stimulus measures involving tax cuts during 2009.
Nevertheless, this decline was offset to some degree by an increase in non-oil and gas income
taxes in April, related to tax payments on corporate earnings. Tax revenues were down mainly
in VAT and Export Tax due to the shrinking volume of international trade and the rescinding
of the CPO export tax in November 2008. In non-tax revenues, natural resource revenues on
oil and natural gas production mounted significantly in May in line with the renewed climb
in international oil prices.1 Growth tapered off further in major taxation sectors, such as
non-oil and gas income tax, not only from the effects of the economic slowdown, but also
from stimulus actions such as income tax cuts and the increased tax free income allowance
introduced this year. At the same time, the impact of the world economic slowdown was
starkly evident in the negative growth in VAT revenues at -.6.5% (yoy) during the first five
months of 2009, largely due to plunging import activity.
Improvements have been achieved in performance of state expenditures. Budget
expenditure activity during Q2/2009 was marked by significant payouts for the fuel and
electricity subsidies in May. The Government also made retroactive payments on wage
increases for civil servants, police and military personnel in April and the 13th month salary
payment was scheduled for June 2009. Looking at the year overall, budget expenditure
performance is up from the same period one year earlier, with increases in realised levels of
Central Government spending and transfers to the regions. The higher disbursement rate
of Central Government expenditures is driven by increased material and other expenditures.
In the area of transfer payments, the government expenditure portion for subsidy payments
improved against target in comparison to the January-May 2008 period. However, in nominal
terms, the subsidy expense was lower due to the effect of falling international oil prices.
1 In May 2009, the average Minas Crude price reached US$59.7 per barrel, up considerably from the Minas average of US$45.2 per barrel in January-April 2009.
Graph 2.11
Leading Import Indicators
����
����
����
����
����
�����
�����
�����
�����
�����
�����
��
��
��
��
��
���
���
���
���
���
���
� �� ��� �� � �� ��� �� � �� ��� �� � �� ��� �� � �� ��� �� � �� ��� �� � �� ��� �� � �� ��� ��
���� ���� ���� ���� ���� ���� ���� ����
����������������
����������������
�����
�������
����������
��������������������������������������������������������������������������������������������������������������������������������������������������������������������������������������������������������������������������������������������������������������������������������������������������

Latest Macroeconomic Indicators
11
Under these conditions, the Central Government expenditure outcome came to 25.3% of the
Revised Budget, up from 21.8% of the Revised Budget in the same period one year earlier.
Transfers to the Regions also mounted despite the drop in Profit Sharing Funds related to the
fall in international market oil prices. The growing regional budget expenditures is explained
by technical factors with adjusted payment of General Allocations for January and February
paid out in January. In response to these developments, Transfers to the Regions came to
37.5% of the Revised Budget, representing improvement over the 33.0% of the Revised
Budget during the same period last year.
Aggregate Supply
Preliminary figures for economic sectors in Q2/2009 point to slowing economic
growth in keeping with demand-side developments (Table 2.2). This is related to
the persistently high level of global economic uncertainties that has resulted in business
postponing planned investments and business expansion. Indicating this are the findings of
the business survey, which point to decline in Q2/2009. The BPS Business Tendency Survey
identified deterioration in business expectations as of Q2/2009. Decline was reported in all
variables shaping the BPS business tendency index, such as capacity utilisation, business
revenues and hours of work. Indications of slowing supply-side performance were also
confirmed by the growing numbers of mass dismissals. Nevertheless, the holding of the
presidential election is believed to have positively impacted performance in some sectors
during Q2/2009. In looking back to the historical pattern in 2004, the presidential polls
provide a boost to growth in a number of sectors and especially in the corporate services
subsector. This is explained by the surge in advertising spending during the presidential
election compared to the previous legislative polls. At the same time, other sectors such as
communications and industry, notably the foods, textiles and printed goods subsectors, are
set to chart even lower growth compared to the previous legislative elections.
% Y-o-Y, Base Year 2000
II III IV I II III IV* I II*Sector
Table 2.2
Economic Growth - Supply Side
2007
* Bank Indonesia Projection Figures
Agriculture 5.6 7.7 2.0 3.4 6.3 4.8 3.4 4.7 4.8 4.8 4 . 0 - 4 . 3
Mining and Quarrying 3.2 1.0 -2.0 2.0 -1.7 -0.5 2.1 2.1 0.5 2.2 1 . 7 - 1 . 9
Manufacturing 5.1 4.5 3.8 4.7 4.3 4.2 4.3 1.8 3.7 1.6 1 . 3 - 1 . 6
Electricity, Gas and Water Supply 10.2 11.3 11.6 10.3 12.3 11.8 10.4 9.3 10.9 11.4 11.0 - 11.4
Construction 7.7 8.3 9.9 8.6 8.0 8.1 7.6 5.7 7.3 6.3 5 . 7 - 6 . 1
Trade, Hotels and Restaurants 7.8 8.0 8.6 8.4 6.9 8.1 8.4 5.6 7.2 0.6 0 . 3 - 0 . 6
Transportation and Communication 13.7 14.8 14.5 14.0 18.3 17.3 15.5 15.8 16.7 16.7 14.7 - 15.9
Financial, Rental and Business Services 7.6 7.6 8.6 8.0 8.3 8.7 8.6 7.4 8.2 6.3 4 . 6 - 4 . 6
Services 7.0 5.2 7.2 6.6 5.9 6.7 7.2 6.0 6.4 6.8 5 . 8 - 6 . 1
GDP 6.6 6.6 5.8 6.3 6.2 6.4 6.4 5.2 6.1 4.4 3 . 7 - 4 . 0
20072008
20082009

Monetary Policy Report - Quarter II-2009
12
Manufacturing is estimated to have maintained a slowing trend in Q2/2009 with
growth at 1.3%-1.6% (yoy). The slowing performance is related primarily to lack of
improvement in demand, especially for exports. Besides impacting the utilisation of available
capacity, the weak demand has also prompted business to delay investments, as reflected in
the low rate of absorption of fiscal stimulus funding provided through import duty subsidies.
Despite this, the holding of the presidential election is expected to put some brake on decline
in manufacturing activity, particularly in the textile manufacturing, food, beverages and
tobacco production and the paper and printed goods subsectors. In analysis by structure,
manufacturing growth was distributed mostly among the transportation manufacturing,
machinery and tools, the food, beverages and tobacco and the chemical industry and rubber
products subsectors. Even so, the food, beverages and tobacco, chemicals and rubber goods
and paper and printed goods subsectors are the leading contributors to manufacturing
sector performance.
Slowing manufacturing performance is reflected in the downward trend in the
production capacity index generated in the BI Production Survey. When examined in
greater detail, a significant drop is visible in the transportation equipment, machinery and
machine tools and the basic metals subsectors. However, some election-related subsectors,
such as food and beverages, textile production and paper and printed goods, still charted
gains. Signs of slowing industry performance were also confirmed by developments in other
early indicators. As of mid-Q2/2009, growth in car and motorcycle production remained
on a downward trend. Similar movement was evident in the flagging levels of electricity
consumption by industrial users as of early Q2/2009. In contrast, the cement subsector
managed a modest turnaround indicated by an upswing in cement consumption in mid-
Q2/2009. Despite this, growth in cement consumption remains below that of the same
period one year before. In regard to financing, figures for early Q2/2009 indicate further
slowing in bank lending to manufacturing, which has been running below the average rate
of expansion for 2008.
The trade, hotels and restaurants sector charted reduced growth in Q2/2009 at
an estimated 0.3%-0.6% (yoy). This slowdown is primarily the result of sliding demand
in response to weakening public purchasing power as incomes decline and more workers
suffer layoffs. An added factor is slumping imports. Despite this, the activities surrounding
the presidential election are expected to prevent even worse decline, particularly in key
commodity categories such as food and tobacco and the clothing and accessories category.
Early indicators for the trade, hotels and restaurant sector, such as the retail sales index (SPE-
BI) also point to decline in mid-Q2/2009. Analysed in closer detail, almost all commodity
categories are marked by slowing trends, led by durable goods. Similar behaviour is visible
in performance indicators for the hotels subsector, with stagnating average occupancy rates
in Jakarta and Bali hotels in early Q2/2009. In regard to financing, figures for early Q2/2009
indicate further slowing in bank lending for the trade sector, which has similarly been running
below the average rate of expansion for 2008.
Preliminary Q2/2009 figures for agriculture sector growth indicate slowing
performance compared to one quarter earlier. This dip in growth is explained by the

Latest Macroeconomic Indicators
13
end of the main harvest season. In the Forecast I figures published by the Central Statistics
Agency (BPS), rice production and harvested land area will decline in the second sub-round
(May-August) in keeping with the end of the harvest season. When analysed by structure,
the food crops subsector accounts for the largest share of agricultural sector output. The
estates subsector also reported similar decline, except for oil palm cultivation. In regard to
financing, banks maintained stable levels of lending to agriculture in figures for mid-Q2/2009,
although below the average lending growth recorded in 2008.
The mining and quarrying sector recorded growth estimated at 1.7%-1.9% (yoy)
during Q2/2009. This stagnating performance in the mining sector is explained mainly by
subsiding demand for exported mining commodities, as visible in exports of metal ores, matte
and concentrates, nickel and aluminium. Despite this, the onset of price gains in some export
commodities is set to put some brake on the decline in the mining sector. In early Q2/2009,
significant contraction was also reported in lending to the mining sector.
Growth in the transport and communications is estimated stable in Q2/2009 in the
range of 14.7%-15.9% (yoy), as indicated by an upward trend in cellular subscribers.
The stable movement in this growth is reflected in the continued performance gains by
telecommunications enterprises such as Telkom. These gains are driven primary by the surge
in call traffic and calling time in advance of the legislative elections, with similar activity also
forecasted during the coming Presidential Election. At the same time, figures for early Q2/2009
indicate generally stable growth in bank lending to the transport and communications sector,
albeit still below the average growth in 2008.
The construction sector again charted stable estimated growth in Q2/2009. This is
borne out in indicators such as the comparatively stable growth in commercial property
construction in the BI Commercial Property Survey for Q2/2009. Also reflecting this are
developments in cement consumption, which at mid-Q2/2009 was still showing indications
of growth albeit below the growth levels of 2008. In regard to financing, bank lending to the
construction sector in early Q2/2009 remained below the average rate of credit expansion
in 2008. At the same time, the onset of decline in bank interest rates, and especially home
mortgage rates, is expected to have a positive impact on property sector growth.
BALANCE OF PAYMENTS
Evaluation of the Q2/2009 balance of payments points toward future improvement
in Indonesia’s external performance, led by the current account. Key to this is the
improving outlook for the global economy and rising demand for Indonesia’s export
commodities. The halt in commodity price decline has also had a positive effect on Indonesia’s
balance of trade. In preliminary figures, imports contracted more steeply than exports,
resulting in an improved position in the current account for Q2/2009. In the capital and
financial account, the comparative stability on global financial markets and keen foreigner
interest in investment sustained positive momentum in foreign capital inflows for portfolio
investments. Foreign direct investment also appears to be moving in a positive direction
Monetary Policy Report - Quarter II-2009
14
in line with rising commodity prices and the continued positive outlook for the domestic
economy. The public sector role retains a dominant role in attracting inflows with the use of
Bank Indonesia Certificates (SBIs), Government Securities and the recent issuance of foreign
currency Sukuk (Islamic bonds) in Q2/2009. In the private sector, pressure from foreign
borrowing transactions mounted slightly due to an increase in corporate debt repayments.
Taken together, the Q2/2009 balance of payments is estimated to have achieved a surplus
The Current Account
The condition of the current account points to improvement in Indonesia’s external
performance, visible in the strengthening trade surplus as export mount a recovery.
The positive export performance was bolstered by rising demand for resource-based
commodities in some countries, led by China and other nations in non-Japan Asia. Demand
in these nations is expected to partially offset the slowdown in global demand originating
mainly from the US and Europe. The levelling off in the downward movement of commodity
prices has helped to shore up exports. Taken together, the balance of payments surplus was
sufficient to cover the deficits in the services, income and current account accounts.
Export performance received a positive boost from commodity price movements
during the January-June 2009 period. The downward movement in non-oil and gas
commodity prices dating back to Q3/2008 levelled out in Q1/2009, with prices recovering
in Q2/2009. With the combination of these commodity price developments and potential
for strengthening demand in trading partner nations, non-oil and gas exports in Q2/2009
are estimated to have surpassed original forecasts. In the import sector, the still struggling
domestic economy is maintaining a downward bias in actual imports of non-oil and gas
merchandise, In the oil and natural gas sector, the low oil consumption recorded in Q1/2009
is estimated to have carried forward into Q2/2009. In figures for March 2009, oil imports
were in progressive decline due to the effect of flagging domestic economic activity. Also
contributing to reduced oil imports was more modest consumption of oil-based fuels in
line with the progress in the kerosene to LPG conversion programme and diversification
of energy sources for power generation. The Q2/2009 deficit in the services, income and
current transfers account, as part of the overall balance of payments, is estimated above
earlier forecasts. The higher deficit is explained by the services account and especially
transportation, which recorded an increased deficit due to the effect of the recent climb in
international oil prices.
Capital and Financial Account
A key development influencing the capital and financial account during Q2/2009 was
the decision by Moody’s to upgrade Indonesia’s credit rating outlook from stable
to positive. Moody’s emphasised a number of factors, including the strong outlook for
economic growth, an effective policy framework for mitigating the impact of turmoil and
sustaining economic resilience, domestic political stability, improving credit fundamentals
compared to peers reflected in the decline in the external debt ratio, a positive trade balance,
sustainability of external financing and adequate levels of banking liquidity backed by robust
Latest Macroeconomic Indicators
15
capital. Foreign portfolio capital transactions are estimated to have booked another surplus
in Q2/2009 on the back of subdued domestic macroeconomic conditions. During Q2/2009,
foreign investor interest in domestic commercial assets (SBIs, Government Securities and
stocks) remained positive. Nevertheless, portfolio transactions are predicted to fall short of
original forecasts in response to portfolio rebalancing by foreigners exiting the domestic
financial market, among others for profit taking purposes. This condition, which has persisted
since mid-June 2009, is expected to be temporary in view of the ongoing adjustments in the
global economy as it shifts towards a more positive direction.
International Reserves
Following the latest developments in the current account and the capital and financial account,
international reserves mounted to 57.58 billion US dollars at end-Q2/2009, a level
equivalent to 5.6 months of imports and servicing of official external debt.

Monetary Policy Report - Quarter II-2009
16
3. Monetary indicators and policy QII-2009
During Q2/2009, signs of improvement emerged in external conditions. The
ongoing process of global economic recovery has engendered positive sentiment
among market actors for resumption of investment activity in emerging markets.
This development has also imbued optimism for future improvement in the global
economy. The rupiah exchange rate registered appreciation during Q2/2009. This
performance was bolstered not only by external factors, but also the solid condition
of domestic factors. Indonesia’s balance of payments surplus, continued attractiveness
of rupiah yields and conducive socio-political conditions in the aftermath of the
national elections contributed to the strengthening of the rupiah. In Q2/2009, the
rupiah exchange rate averaged Rp 10,527 to the US dollar, having appreciated 9.99%
over Q1/2009. Concerning prices, inflationary pressure eased further in Q2/2009 with
an accelerated rate of decline. CPI inflation in Q2/2009 was recorded at 3.65% (yoy),
down from 7.92% (yoy) in the preceding quarter. The drop in inflation is explained
primarily by non-fundamentals, although pressure on the fundamentals side has also
begun to ease. The lower administered prices during Q2/2009 is explained by the
absence of government rulings on strategic items, while the decline in volatile foods
inflation was influenced mainly by the harvest season and measures safeguarding
domestic supply of foodstuffs. Inflationary pressure from fundamentals is also
estimated lower. The softening of external pressures from rupiah appreciation amid
conditions of sustained weak domestic demand has been a key factor bringing down
inflationary pressure.
In similar developments, monetary indicators show reduced expansion. The stagnating
growth in depositor funds is related to the drop in economic growth, while flagging
credit expansion is explained by heightened perceptions of risks in future economic
conditions. The bank interest rate response to BI Rate cuts is improving, as reflected
in the downward movement in interest rates across various tenors. On the stock
market, optimism in the global economic recovery process and the strength of
corporate micro fundamentals encouraged investors to return to the capital market.
During Q2/2009, the JSX composite index charted further gains, despite sustaining
brief correction at the end of the period under review. On the Government Securities
market, yield on all tenors eased in keeping with the lowering of the BI Rate alongside
improvement in perceptions of risk. This has encouraged renewed growth in foreign
investor placements on the Government Securities market. At the same time, Q2/2009
expansion in real sector financing came mainly from outside the banking sector.
Reflecting this were rights issues for some listed stocks and new corporate bond
issuances in contrast to the sharp drop in bank lending.
Monetary Indicators and Policy, QII-2009
17
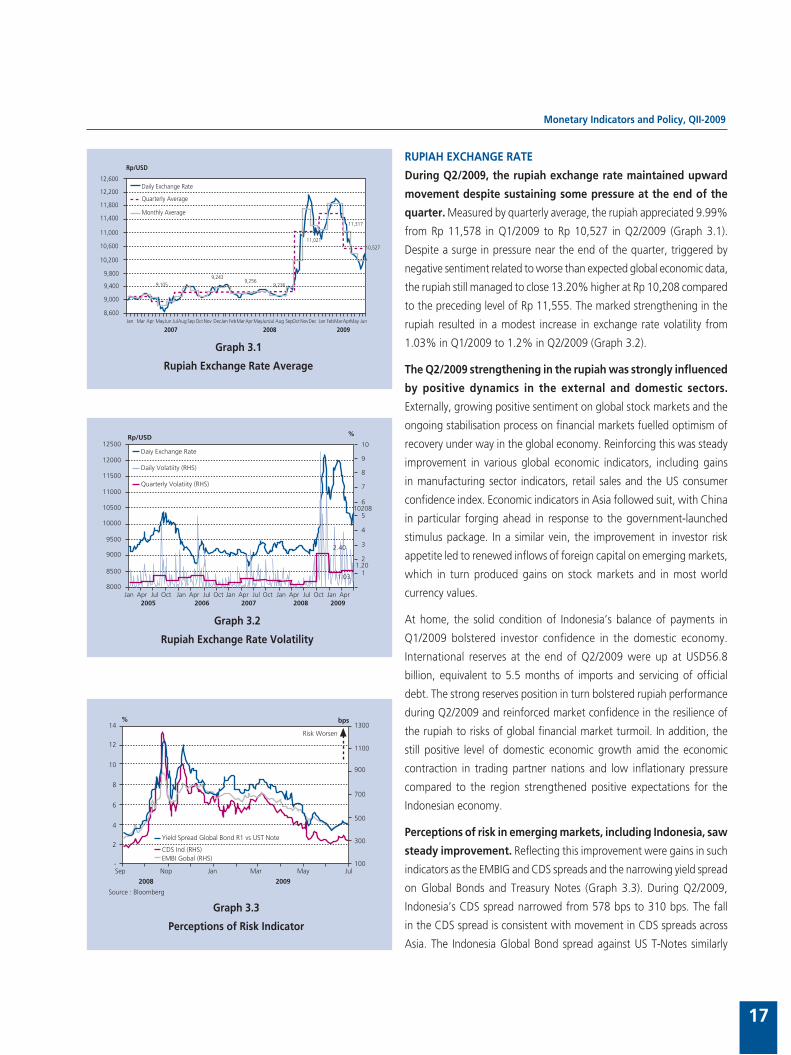
RUPIAH EXCHANGE RATE
During Q2/2009, the rupiah exchange rate maintained upward
movement despite sustaining some pressure at the end of the
quarter. Measured by quarterly average, the rupiah appreciated 9.99%
from Rp 11,578 in Q1/2009 to Rp 10,527 in Q2/2009 (Graph 3.1).
Despite a surge in pressure near the end of the quarter, triggered by
negative sentiment related to worse than expected global economic data,
the rupiah still managed to close 13.20% higher at Rp 10,208 compared
to the preceding level of Rp 11,555. The marked strengthening in the
rupiah resulted in a modest increase in exchange rate volatility from
1.03% in Q1/2009 to 1.2% in Q2/2009 (Graph 3.2).
The Q2/2009 strengthening in the rupiah was strongly influenced
by positive dynamics in the external and domestic sectors.
Externally, growing positive sentiment on global stock markets and the
ongoing stabilisation process on financial markets fuelled optimism of
recovery under way in the global economy. Reinforcing this was steady
improvement in various global economic indicators, including gains
in manufacturing sector indicators, retail sales and the US consumer
confidence index. Economic indicators in Asia followed suit, with China
in particular forging ahead in response to the government-launched
stimulus package. In a similar vein, the improvement in investor risk
appetite led to renewed inflows of foreign capital on emerging markets,
which in turn produced gains on stock markets and in most world
currency values.
At home, the solid condition of Indonesia’s balance of payments in
Q1/2009 bolstered investor confidence in the domestic economy.
International reserves at the end of Q2/2009 were up at USD56.8
billion, equivalent to 5.5 months of imports and servicing of official
debt. The strong reserves position in turn bolstered rupiah performance
during Q2/2009 and reinforced market confidence in the resilience of
the rupiah to risks of global financial market turmoil. In addition, the
still positive level of domestic economic growth amid the economic
contraction in trading partner nations and low inflationary pressure
compared to the region strengthened positive expectations for the
Indonesian economy.
Perceptions of risk in emerging markets, including Indonesia, saw
steady improvement. Reflecting this improvement were gains in such
indicators as the EMBIG and CDS spreads and the narrowing yield spread
on Global Bonds and Treasury Notes (Graph 3.3). During Q2/2009,
Indonesia’s CDS spread narrowed from 578 bps to 310 bps. The fall
in the CDS spread is consistent with movement in CDS spreads across
Asia. The Indonesia Global Bond spread against US T-Notes similarly
������
������
������
������
������
������
������
������
�����
�����
�����
�������� ��� ��� ������ ������ ��������� ������ ��������������� ��� ��������������� ��� ������������ ���
���� ���� ����
����������
����������
������
������
������
�����������������
�������������������
���������������
Graph 3.1
Rupiah Exchange Rate Average
Graph 3.2
Rupiah Exchange Rate Volatility
�����������
�����
�����
�����
�����
�����
����
����
����
������� ��� ��� ��� ��� ��� ��� ��� ��� ��� ��� ��� ��� ��� ��� ��� ��� ���
���� ���� ���� ���� ����
�
��
�
�
�
�
�
�
�
�
�
�����
����
����
����
���������������������
�������������������������
������������������
Graph 3.3
Perceptions of Risk Indicator
���������������������������������������
�����������������������������
�����������
���
��
��
�
�
�
�
���� ��� ��� ��� ��� ���
���� ����
�������
����
���
���
���
���
���
������������������
Monetary Policy Report - Quarter II-2009
18
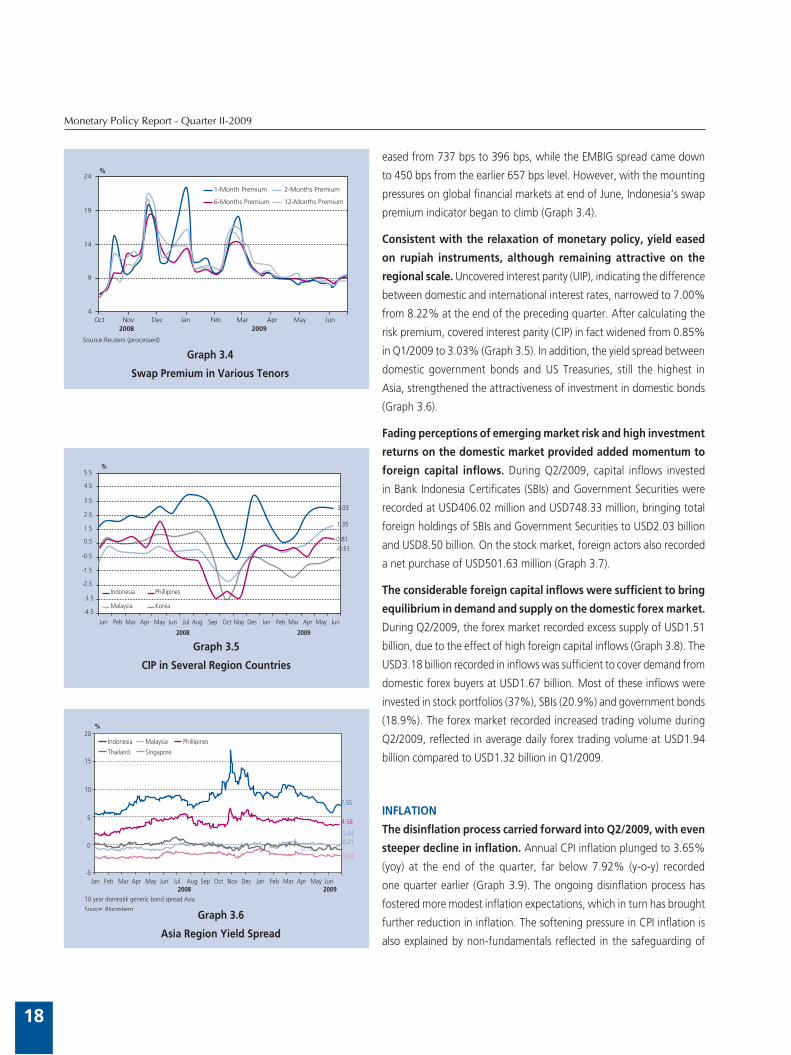
eased from 737 bps to 396 bps, while the EMBIG spread came down
to 450 bps from the earlier 657 bps level. However, with the mounting
pressures on global financial markets at end of June, Indonesia’s swap
premium indicator began to climb (Graph 3.4).
Consistent with the relaxation of monetary policy, yield eased
on rupiah instruments, although remaining attractive on the
regional scale. Uncovered interest parity (UIP), indicating the difference
between domestic and international interest rates, narrowed to 7.00%
from 8.22% at the end of the preceding quarter. After calculating the
risk premium, covered interest parity (CIP) in fact widened from 0.85%
in Q1/2009 to 3.03% (Graph 3.5). In addition, the yield spread between
domestic government bonds and US Treasuries, still the highest in
Asia, strengthened the attractiveness of investment in domestic bonds
(Graph 3.6).
Fading perceptions of emerging market risk and high investment
returns on the domestic market provided added momentum to
foreign capital inflows. During Q2/2009, capital inflows invested
in Bank Indonesia Certificates (SBIs) and Government Securities were
recorded at USD406.02 million and USD748.33 million, bringing total
foreign holdings of SBIs and Government Securities to USD2.03 billion
and USD8.50 billion. On the stock market, foreign actors also recorded
a net purchase of USD501.63 million (Graph 3.7).
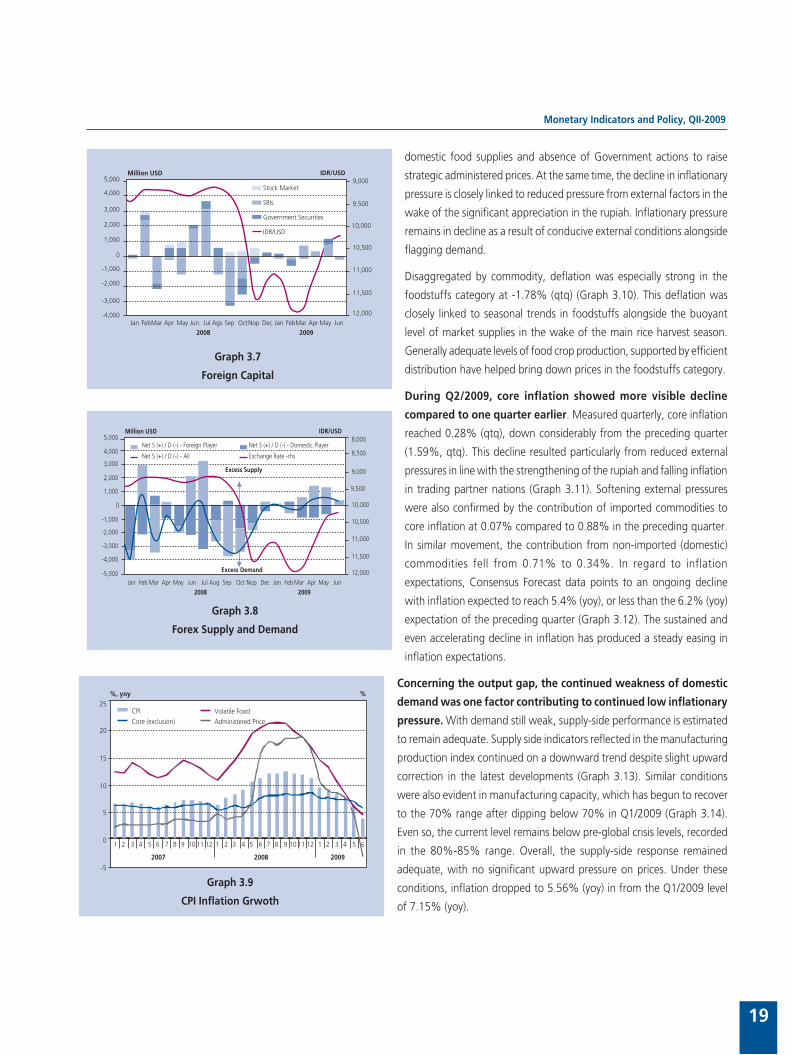
The considerable foreign capital inflows were sufficient to bring
equilibrium in demand and supply on the domestic forex market.
During Q2/2009, the forex market recorded excess supply of USD1.51
billion, due to the effect of high foreign capital inflows (Graph 3.8). The
USD3.18 billion recorded in inflows was sufficient to cover demand from
domestic forex buyers at USD1.67 billion. Most of these inflows were
invested in stock portfolios (37%), SBIs (20.9%) and government bonds
(18.9%). The forex market recorded increased trading volume during
Q2/2009, reflected in average daily forex trading volume at USD1.94
billion compared to USD1.32 billion in Q1/2009.
INFLATION
The disinflation process carried forward into Q2/2009, with even
steeper decline in inflation. Annual CPI inflation plunged to 3.65%
(yoy) at the end of the quarter, far below 7.92% (y-o-y) recorded
one quarter earlier (Graph 3.9). The ongoing disinflation process has
fostered more modest inflation expectations, which in turn has brought
further reduction in inflation. The softening pressure in CPI inflation is
also explained by non-fundamentals reflected in the safeguarding of
��������������� ����������������
���������������� �����������������
���
��
��
�
���� ��� ��� ��� ��� ��� ��� ��� ���
���� ����
��������������������������
Graph 3.4
Swap Premium in Various Tenors
Graph 3.5
CIP in Several Region Countries
��������� �����������
�������� �����
����
����
���������
���
���
���
���
���
���
����
����
����
����
����
��� ��� ��� ��� ��� ��� ��� ��� ��� ��� ��� ��� ��� ��� ��� ��� ��� ���
���� ����
�
Graph 3.6
Asia Region Yield Spread
�����������������������������������������
�����������������
��������
�
��� ��� ��� ��� ��� ��� ��� ��� ���
����
��� ��� ������ ��� ��� ��� ��� ���
��������� �������� �����������
�������� ���������
��
�
�
��
��
��
����
����
����
���������
Monetary Indicators and Policy, QII-2009
19
domestic food supplies and absence of Government actions to raise
strategic administered prices. At the same time, the decline in inflationary
pressure is closely linked to reduced pressure from external factors in the
wake of the significant appreciation in the rupiah. Inflationary pressure
remains in decline as a result of conducive external conditions alongside
flagging demand.
Disaggregated by commodity, deflation was especially strong in the
foodstuffs category at -1.78% (qtq) (Graph 3.10). This deflation was
closely linked to seasonal trends in foodstuffs alongside the buoyant
level of market supplies in the wake of the main rice harvest season.
Generally adequate levels of food crop production, supported by efficient
distribution have helped bring down prices in the foodstuffs category.
During Q2/2009, core inflation showed more visible decline
compared to one quarter earlier. Measured quarterly, core inflation
reached 0.28% (qtq), down considerably from the preceding quarter
(1.59%, qtq). This decline resulted particularly from reduced external
pressures in line with the strengthening of the rupiah and falling inflation
in trading partner nations (Graph 3.11). Softening external pressures
were also confirmed by the contribution of imported commodities to
core inflation at 0.07% compared to 0.88% in the preceding quarter.
In similar movement, the contribution from non-imported (domestic)
commodities fell from 0.71% to 0.34%. In regard to inflation
expectations, Consensus Forecast data points to an ongoing decline
with inflation expected to reach 5.4% (yoy), or less than the 6.2% (yoy)
expectation of the preceding quarter (Graph 3.12). The sustained and
even accelerating decline in inflation has produced a steady easing in
inflation expectations.
Concerning the output gap, the continued weakness of domestic
demand was one factor contributing to continued low inflationary
pressure. With demand still weak, supply-side performance is estimated
to remain adequate. Supply side indicators reflected in the manufacturing
production index continued on a downward trend despite slight upward
correction in the latest developments (Graph 3.13). Similar conditions
were also evident in manufacturing capacity, which has begun to recover
to the 70% range after dipping below 70% in Q1/2009 (Graph 3.14).
Even so, the current level remains below pre-global crisis levels, recorded
in the 80%-85% range. Overall, the supply-side response remained
adequate, with no significant upward pressure on prices. Under these
conditions, inflation dropped to 5.56% (yoy) in from the Q1/2009 level
of 7.15% (yoy).
Graph 3.7
Foreign Capital
������������
����
���������������������
�������
����������������
�����
�����
�����
�����
�
������
������
������
������
������������
�����
������
������
������
������
��������� ������ ��� ��� ��� ��� ��� ��� ������ ��� ��� ������ ��� ��� ���
���� ����
Graph 3.8
Forex Supply and Demand
����������������
�����
�����
�����
�����
�
������������
�����
�����
������
������
������
��������� ��� ��� ��� ��� ��� ��� ��� ��� ��� ��� ��� ��� ��� ��� ��� ��� ���
���� ����
����������������������������������
�����������������������
�����������������������������������
������������������
�������������
�������������
������
������
������
������
������
������
�����
Graph 3.9
CPI Inflation Grwoth
��
�
�
��
��
��
��
� � � � � � � � � �� �� �� � � � � � � � � � �� �� �� � � � � � �
���� ���� ����
�������������������
�������������������������������
������ �

Monetary Policy Report - Quarter II-2009
20
Measured quarterly, volatile foods underwent deflation in
keeping with the abundant domestic market supply of foodstuffs
brought on by the arrival of the harvest. The volatile foods category
recorded -2.02% deflation (qtq) with rice deflation at about -1% (qtq).
Regarding seasonal factors, Q2/2009 was marked by the arrival of the
rice harvest, which led to deflation in rice commodity prices. Given
the considerable weighting of rice in the volatile food basket, the fall
in rice prices resulted overall deflation in the volatile foods category.
At the same time, supply and distribution of other food commodities
was also adequate, with the result that other food commodities in the
miscellaneous vegetables and seasonings category also contributed to
deflation.
Conversely, an upward trend has emerged in international food
commodity prices. Despite indications that higher international food
commodity prices have been transmitted to related domestic commodity
prices, the transmission of imported inflation to the food stuffs category
is still low. The less pronounced response in domestic prices during 2008
is explained party by the comparatively moderate rise in international
food commodity prices, which remained well below the peak levels
of 2008. Furthermore, annual volatile foods inflation fell by a
substantial margin to 4.32% (yoy) from the past quarter’s level
of 10.57% (yoy). The below 5% (yoy) volatile foods inflation represents
an achievement, being considerably lower than the historical level in the
range of 9%-10% (yoy).1
Government decisions concerning administered prices were
minimal, with Q2/2009 inflation in the administered prices
category at a slim 0.28% (qtq). During Q2/2009, administered prices
inflation was driven only by increases in cigarette prices, and that only in
small increments. Cigarettes have traditionally contributed to inflation,
although the price increases remain minimal in view of the potential for
price adjustments with some cigarettes still selling below recommended
retail prices. On the other hand, household fuels (kerosene and LPG),
two key components in the energy conversion programme, generated
comparatively little pressure on inflation even though the programme is
ongoing. This is believed to be the result of the smoothly operating supply
and distribution process in the conversion programme, thus avoiding
the shortages of the past year. Accordingly, pressure in the annual rate
of administered prices inflation fell sharply to -3.22% (yoy).
1 This range represents average annual inflation (yoy) for the years of 2003-2007, albeit after eliminating the effect of favourable supply shocks in 2003 and the impact of the fuel price hikes in October 2005 and September 2006, which produced second round impact in price increases for other goods, including food staples.
Graph 3.10
Inflation and Contribution to Inflation by Category, (qtq)
�����
����
����
�����
����
����
�����
�����
����
����
� ����
����
����
����
� ��� ���� ���� � ��� ���� ��� ��� ��� ��� ���
��������������
����������������
�������
�������
������
���������
��������������
�
�����������
���������������
Graph 3.12
Inflation Expectation – Consensus Forecast
�������
�
�
�
�
��� ���
���
���
���
��� ���
������
���
������
���
���
���
���������
������ ���
��� ���
���
� � � � � � � � � �� �� �� � � � � � ����� ����
��������
Graph 3.11
Exchange Rate and Trade Partner Countries Inflation
���
���
���
���
���
���
���
��
�
�
��
��
��
��
� � �� � � � � ������� �� � � � � � � ������� � � � � � � � �������� � � � � � �� � ������� � � � �� �
���� ���� ���� ���� ����
� ������
��������������������������������������
�����������������������������
����������������������������
�����������������������������������������������������������������������������������������������������������
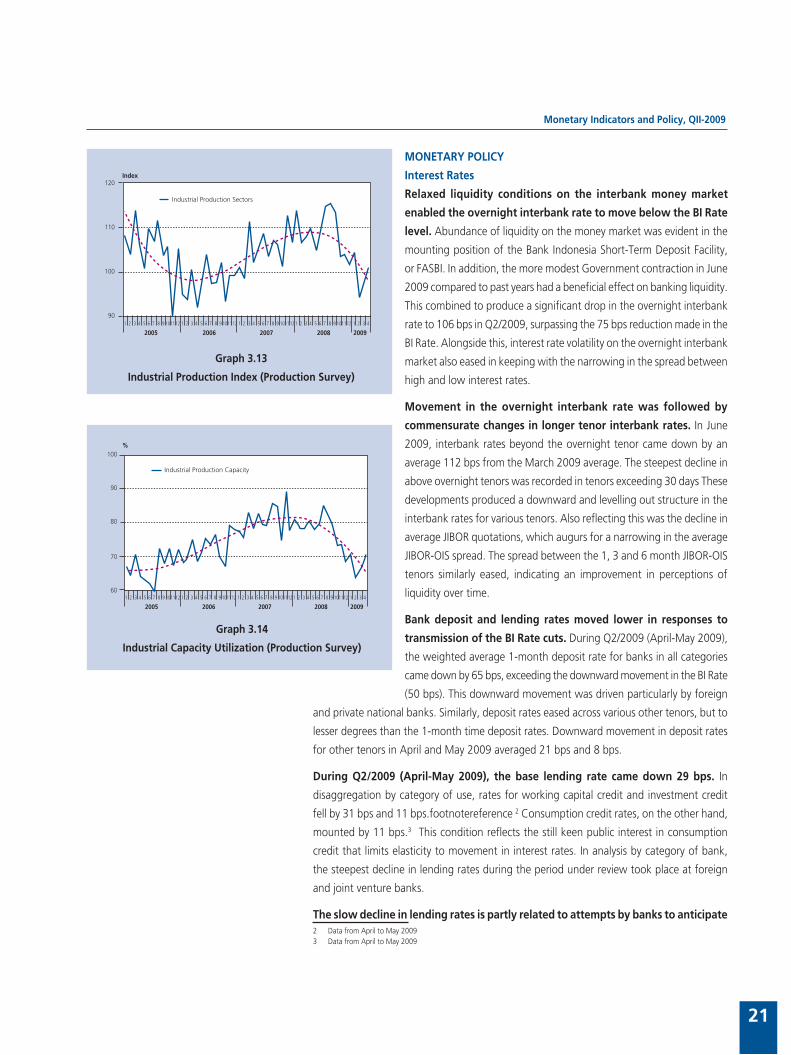
Monetary Indicators and Policy, QII-2009
21
MONETARY POLICY
Interest Rates
Relaxed liquidity conditions on the interbank money market
enabled the overnight interbank rate to move below the BI Rate
level. Abundance of liquidity on the money market was evident in the
mounting position of the Bank Indonesia Short-Term Deposit Facility,
or FASBI. In addition, the more modest Government contraction in June
2009 compared to past years had a beneficial effect on banking liquidity.
This combined to produce a significant drop in the overnight interbank
rate to 106 bps in Q2/2009, surpassing the 75 bps reduction made in the
BI Rate. Alongside this, interest rate volatility on the overnight interbank
market also eased in keeping with the narrowing in the spread between
high and low interest rates.
Movement in the overnight interbank rate was followed by
commensurate changes in longer tenor interbank rates. In June
2009, interbank rates beyond the overnight tenor came down by an
average 112 bps from the March 2009 average. The steepest decline in
above overnight tenors was recorded in tenors exceeding 30 days These
developments produced a downward and levelling out structure in the
interbank rates for various tenors. Also reflecting this was the decline in
average JIBOR quotations, which augurs for a narrowing in the average
JIBOR-OIS spread. The spread between the 1, 3 and 6 month JIBOR-OIS
tenors similarly eased, indicating an improvement in perceptions of
liquidity over time.
Bank deposit and lending rates moved lower in responses to
transmission of the BI Rate cuts. During Q2/2009 (April-May 2009),
the weighted average 1-month deposit rate for banks in all categories
came down by 65 bps, exceeding the downward movement in the BI Rate
(50 bps). This downward movement was driven particularly by foreign
and private national banks. Similarly, deposit rates eased across various other tenors, but to
lesser degrees than the 1-month time deposit rates. Downward movement in deposit rates
for other tenors in April and May 2009 averaged 21 bps and 8 bps.
During Q2/2009 (April-May 2009), the base lending rate came down 29 bps. In
disaggregation by category of use, rates for working capital credit and investment credit
fell by 31 bps and 11 bps.footnotereference 2 Consumption credit rates, on the other hand,
mounted by 11 bps.3 This condition reflects the still keen public interest in consumption
credit that limits elasticity to movement in interest rates. In analysis by category of bank,
the steepest decline in lending rates during the period under review took place at foreign
and joint venture banks.
The slow decline in lending rates is partly related to attempts by banks to anticipate 2 Data from April to May 20093 Data from April to May 2009
Graph 3.13
Industrial Production Index (Production Survey)
�����
�����������������������������
���
���
���
��� � � � � � � � � ������ � � � � � � � � � ������ � � � � � � � � � ������ � � � � � � � � � ������ � � � �
���� ���� ���� ���� ����
Graph 3.14
Industrial Capacity Utilization (Production Survey)
�
������������������������������
���
��
��
��
��� � � � � � � � � ������ � � � � � � � � � ������ � � � � � � � � � ������ � � � � � � � � � ������ � � � �
���� ���� ���� ���� ����
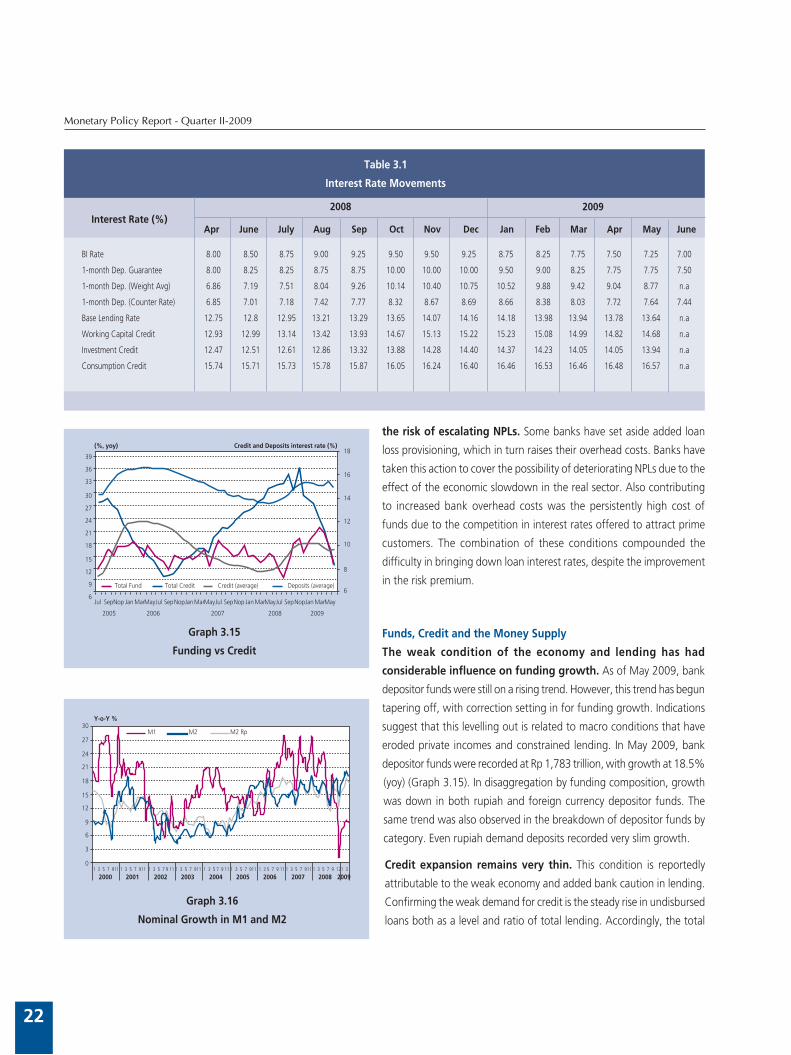
Monetary Policy Report - Quarter II-2009
22
the risk of escalating NPLs. Some banks have set aside added loan
loss provisioning, which in turn raises their overhead costs. Banks have
taken this action to cover the possibility of deteriorating NPLs due to the
effect of the economic slowdown in the real sector. Also contributing
to increased bank overhead costs was the persistently high cost of
funds due to the competition in interest rates offered to attract prime
customers. The combination of these conditions compounded the
difficulty in bringing down loan interest rates, despite the improvement
in the risk premium.
Funds, Credit and the Money Supply
The weak condition of the economy and lending has had
considerable influence on funding growth. As of May 2009, bank
depositor funds were still on a rising trend. However, this trend has begun
tapering off, with correction setting in for funding growth. Indications
suggest that this levelling out is related to macro conditions that have
eroded private incomes and constrained lending. In May 2009, bank
depositor funds were recorded at Rp 1,783 trillion, with growth at 18.5%
(yoy) (Graph 3.15). In disaggregation by funding composition, growth
was down in both rupiah and foreign currency depositor funds. The
same trend was also observed in the breakdown of depositor funds by
category. Even rupiah demand deposits recorded very slim growth.
Credit expansion remains very thin. This condition is reportedly
attributable to the weak economy and added bank caution in lending.
Confirming the weak demand for credit is the steady rise in undisbursed
loans both as a level and ratio of total lending. Accordingly, the total
Apr June July Aug Sep Oct Nov Dec Jan Feb Mar Apr May JuneInterest Rate (%)
2008 2009
Table 3.1
Interest Rate Movements
BI Rate 8.00 8.50 8.75 9.00 9.25 9.50 9.50 9.25 8.75 8.25 7.75 7.50 7.25 7.00
1-month Dep. Guarantee 8.00 8.25 8.25 8.75 8.75 10.00 10.00 10.00 9.50 9.00 8.25 7.75 7.75 7.50
1-month Dep. (Weight Avg) 6.86 7.19 7.51 8.04 9.26 10.14 10.40 10.75 10.52 9.88 9.42 9.04 8.77 n.a
1-month Dep. (Counter Rate) 6.85 7.01 7.18 7.42 7.77 8.32 8.67 8.69 8.66 8.38 8.03 7.72 7.64 7.44
Base Lending Rate 12.75 12.8 12.95 13.21 13.29 13.65 14.07 14.16 14.18 13.98 13.94 13.78 13.64 n.a
Working Capital Credit 12.93 12.99 13.14 13.42 13.93 14.67 15.13 15.22 15.23 15.08 14.99 14.82 14.68 n.a
Investment Credit 12.47 12.51 12.61 12.86 13.32 13.88 14.28 14.40 14.37 14.23 14.05 14.05 13.94 n.a
Consumption Credit 15.74 15.71 15.73 15.78 15.87 16.05 16.24 16.40 16.46 16.53 16.46 16.48 16.57 n.a
Graph 3.15
Funding vs Credit
�
�
��
��
��
��
��
�
�
��
��
��
��
��
��
��
��
��
��
�������� �������������������������������������
���������� ������������ ���������������� ������������������
��� ������ ������������ ������������������ ������ ������������ ���������������
���� ���� ���� ���� ����
Graph 3.16
Nominal Growth in M1 and M2
�
�
�
�
��
��
��
��
��
��
��
� � � � ��� � � � � ��� � � � � � �� � � � � ��� � � � � � �� � � � � ��� � � � � � �� � � � � ��� � � � � � ��� �
���� ���� ���� ���� ���� ���� ���� ���� ���� ����
�� �� �����
�������

Monetary Indicators and Policy, QII-2009
23
outstanding credit position in May 2009 is estimated largely unchanged, and could even
be lower than at the end of Q1/2009. In May 2009, the outstanding credit position
reached Rp 1,339 trillion, with growth at only 17.7% (yoy, including channelling).
Accordingly, bank lending for the five months ending May 2009 sustained 1.1%
contraction (ytd). In regard to currency denomination, contraction in foreign currency
credit was not only related to the appreciation in the exchange rate, but also reflected bank
preferences for trimming exposures in foreign currency lending. Disaggregated by use,
working capital credit again represented the most important contribution to overall lending
decline. Nevertheless, in analysis by sector, some sectors such as trade, electricity, gas and
water utilities and transportation appear to be taking advantage of increased lending.
With economic developments on a slowing trend, economic liquidity began charting
limited growth. The constricted expansion in rupiah M1 and M2 indicates potential for
further slowing in the economy in Q2/2009. In May 2009, the M1, M2 and rupiah M2
positions widened to Rp 467.7 trillion, Rp 1,917.1 trillion and Rp 1,633.8 trillion. Even so, the
slowed pace of growth brought M1 and M2 growth in April and May to 6.7% and 17.2%
from the previous quarter’s expansion of 9.3% and 20.4% (Graph 3.16).
Financial Markets
The JSX Composite Index charted further gains, despite some levelling at end-
Q2/2009. These performance gains on the capital market were driven by improvement in
external conditions, including positive expectations for the global economy and financial
markets. This optimism has encouraged global investors to resume their pursuit of high yield
assets by placing funds in emerging markets. Capital markets in Asia, including Indonesia,
have charted impressive gains. The Indonesian composite stock index closed at 2,026.8,
having climbed 41.3% over the closing position in Q1/2009. Market capitalisation similarly
widened by Rp 462 trillion to close at Rp 1,553.7 trillion. However, at the end of the quarter,
escalating concerns over fallout on corporate performance from the economic malaise in
developed nations triggered a fresh round of capital reversal, accompanied by modest
correction in the JSX Composite at end-Q2/2009.
JSX index gains were not only bolstered by improvement in external conditions, but
also by conducive domestic conditions including a loose bias monetary policy and
strong micro fundamentals in the corporate sector. The BI Rate cuts announced during
Q2/2009 provided added momentum for trading activity on the capital market. Reinforcing
this was micro corporate performance, with Q1/2009 revenue and earnings performance
reported by LQ-45 stock issuers reinforcing investor confidence in the resilience of company
micro fundamentals.
Renewed inflows of foreign capital on emerging markets have boosted liquidity
on the stock market. Foreign investor activity has rekindled domestic investor confidence,
strengthening market turnover overall. Daily average trading value on the Indonesian Stock
Exchange mounted to Rp 5.3 trillion in Q2/2009, up from the Q1/2009 position of Rp 1.6

Monetary Policy Report - Quarter II-2009
24
trillion per day (Graph 3.17). At this level, trading activity was in fact
ahead of conditions in 2008, when share trading averaged Rp 4.41 trillion
per day. Consistent with the renewed foreign capital inflows reported
until mid-June 2009, the Q2/2009 net foreign purchase reached Rp 5.2
trillion. This compares favourably to the net purchase in Q1/2009 at only
Rp 0.09 trillion (Graph 3.18).
Like with the capital market, performance gains also took place on
the Government Securities market. The ongoing decline in the BI Rate
and inflows of foreign capital combined to bolster the performance of
Government Securities. Indicating this was the narrowing in Government
Securities yield in almost all tenors, with average decline at 215 bps to
9.8% in Q2/2009 compared to end-Q1/2009 yield at 12.0%. However,
further decline in yield was forestalled by profit taking by market actors
and the renewed weakening on global financial markets at the end of
the quarter under review.
Improvement in external conditions and strong domestic economic
fundamentals contributed to decline in yield on Government
Securities. On the external side, factors boosting the performance of
Government Securities include (i) market optimism for global economic
recovery, (ii) persistently high yield on offered Government Securities,
despite the narrowing in the spread between US T-Bonds and domestic
interest rates, (iii) decline in CDS, and (iv) appreciation in the exchange
rate. Domestically, factors influencing performance include: (i) outlook
for reasonably healthy economic growth, (ii) low inflation improving the
attractiveness of real yields4 on Government Securities, (iii) expectations
of further reductions in the BI Rate, and (iv) fiscal sustainability holding
relatively firm amid renewed increases in world oil prices.
Renewed foreigner activity has helped improve conditions for
Government Securities. During Q2/2009, the added net purchase by
foreign investors reached Rp 6.4 trillion, while in Q1/2009, foreigners
booked a net sale of Rp 7.8 trillion. Acting as counterparties in selling
these Government Securities were recapitalised banks, pension funds,
securities firms and individuals. At end-Q2/2009, the outstanding
Government Securities position closed at Rp 555.9 trillion.
Liquidity conditions on the Government Securities market
improved in response to rising inflows of non-resident capital.
Average daily trading volume in Government Securities during Q2/2009
reached Rp 3.7 trillion, up from Rp 2.9 trillion in the previous quarter
(Graph 3.19). Similar movement was also observed in daily frequency of
4 Yield calculated in real terms is the spread between nominal yield and correction for inflation
Graph 3.17
JCI and Trade Volume
��
�
�
�
�
�
�����
�����
�����
�����
�����
���
�������������������������
�����������
� � � � � � � � � ���� �� � � � � � � � � � ���� �� � � � � � �
������������
Graph 3.18
JCI and Net Foreign Buying
�
�
�
�
�
�
�
�
�
���
���
���
�����
�����
�����
�����
�����
���
�������������������������������
���������
�����������
� � � � � � � � � ���� �� � � � � � � � � � ���� �� � � � � � �
������������
Graph 3.19
Trade Volume & Govt Bond Yield (all tenors)
�
�
�
�
�
��
� � � � � � � � � ������ � � � � � � � � ������� � � � � � � � � � ������ � � � � � � � � � ������ � � � � � �
���� ���� ���� ���� ����
�
��
��
����������������������������������������
�������������������
����������� �
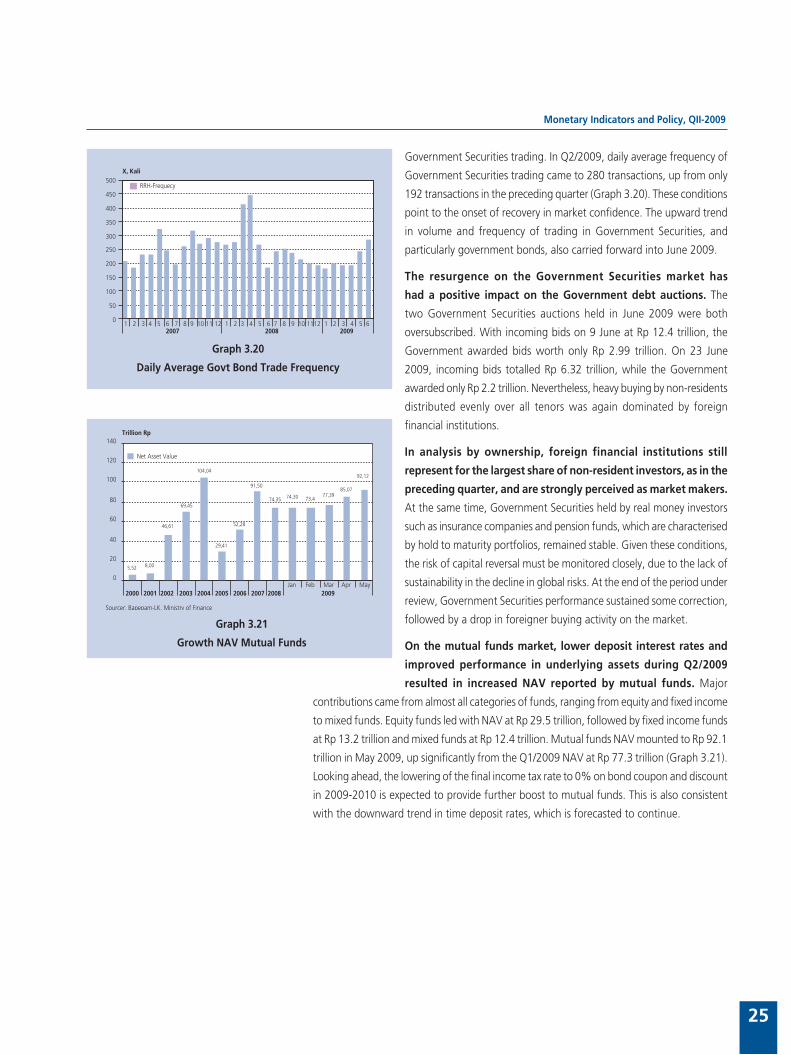
Monetary Indicators and Policy, QII-2009
25
Government Securities trading. In Q2/2009, daily average frequency of
Government Securities trading came to 280 transactions, up from only
192 transactions in the preceding quarter (Graph 3.20). These conditions
point to the onset of recovery in market confidence. The upward trend
in volume and frequency of trading in Government Securities, and
particularly government bonds, also carried forward into June 2009.
The resurgence on the Government Securities market has
had a positive impact on the Government debt auctions. The
two Government Securities auctions held in June 2009 were both
oversubscribed. With incoming bids on 9 June at Rp 12.4 trillion, the
Government awarded bids worth only Rp 2.99 trillion. On 23 June
2009, incoming bids totalled Rp 6.32 trillion, while the Government
awarded only Rp 2.2 trillion. Nevertheless, heavy buying by non-residents
distributed evenly over all tenors was again dominated by foreign
financial institutions.
In analysis by ownership, foreign financial institutions still
represent for the largest share of non-resident investors, as in the
preceding quarter, and are strongly perceived as market makers.
At the same time, Government Securities held by real money investors
such as insurance companies and pension funds, which are characterised
by hold to maturity portfolios, remained stable. Given these conditions,
the risk of capital reversal must be monitored closely, due to the lack of
sustainability in the decline in global risks. At the end of the period under
review, Government Securities performance sustained some correction,
followed by a drop in foreigner buying activity on the market.
On the mutual funds market, lower deposit interest rates and
improved performance in underlying assets during Q2/2009
resulted in increased NAV reported by mutual funds. Major
contributions came from almost all categories of funds, ranging from equity and fixed income
to mixed funds. Equity funds led with NAV at Rp 29.5 trillion, followed by fixed income funds
at Rp 13.2 trillion and mixed funds at Rp 12.4 trillion. Mutual funds NAV mounted to Rp 92.1
trillion in May 2009, up significantly from the Q1/2009 NAV at Rp 77.3 trillion (Graph 3.21).
Looking ahead, the lowering of the final income tax rate to 0% on bond coupon and discount
in 2009-2010 is expected to provide further boost to mutual funds. This is also consistent
with the downward trend in time deposit rates, which is forecasted to continue.
Graph 3.20
Daily Average Govt Bond Trade Frequency
�
��
���
���
���
���
���
���
���
���
���
� � � � � � � � � �� �� �� � � � � � � � � � �� ���� � � � � � ����� ���� ����
������������
�������
Graph 3.21
Growth NAV Mutual Funds
���� ����
�����
�����
������
�����
�����
�����
����� ����� ���������
�����
�����
�
��
��
��
��
���
���
���
��� ��� ��� ��� ������� ���� ���� ���� ���� ���� ���� ���� ���� ����
���������������
�����������
����������������������������������������

Monetary Policy Report - Quarter II-2009
26
4. Outlook for the Indonesian Economy
The latest developments indicate that the Indonesian economy is generally
outperforming earlier predictions. Nevertheless, these developments warrant
increased caution due to the persistently high level of uncertainty in the global
economy. The global economic crisis has had significant impact on the Indonesian
economy, particularly through plunging exports. However, unlike other countries in
the region, Indonesia’s economic growth is expected to remain positive. The impact
of falling exports on economic growth in Indonesia is not expected to take the same
toll as for other exporting nations in the region. Indonesia’s comparative advantage
lies in the relative strength of domestic demand with the structure of the economy.
However, some challenges in the domestic economy must inevitably be faced,
particularly in regard to financing. Taken together, Indonesia’s economic growth
is predicted to slow from 6.1% in 2008 to 3.5%-4.0% in 2009. If the monetary and
fiscal stimulus can be scaled up and operate more effectively in the coming quarters,
economic growth may reach the 4% upper limit of the 2009 projection.
Concerning prices, the key positive factors behind the fall in inflation include
adequate production levels, smooth foodstuff distribution, improving expectations
of inflation, low levels of capacity utilisation and minimum government actions to
raise administered prices. In the outcome of these factors, CPI inflation is forecasted
at about 5% in 2009 with a significant downward trend, and remains within the
corridor of the 2009 CPI inflation target of 4.5%±1%. Bank Indonesia will stay the
course with monetary policy directed towards accommodating the need for economic
growth but maintaining prudence in achievement of the inflation target.
ASSUMPTIONS AND SCENARIOS
International Economic Conditions
In 2009, the world economy is predicted to undergo the most dramatic decline since the end
of the Second World War. In the April 2009 edition of the World Economic Outlook, the IMF
predicts a steep drop in world economic growth to -1.3% (yoy), mainly due to contraction
in advanced economies expected to reach -3.8% (yoy). At the same time, economic growth
in developing countries is predicted to slow to 1.6% (yoy) due to downward pressure on
domestic demand and plunging external performance (Table 4.1).
The contracting global economy will in turn depress activity in world trade. International
institutions, such as the IMF, World Bank and WTO, project a drop in world trade volume
during 2009. In IMF predictions, world trade volume is set to fall -11.0%, while the World
Bank forecasts a drop of -9.7%. At the same time, the WTO forecasts world trade volume
to slide -9.0% in 2009 due to the effect of a -10% contraction in exports from advanced
economies and -2% to -3% loss of exports in the developing world. Declining volume of
World GDP 3.2 -1.3
Advanced Countries 0.9 -3.8
United States 1.1 -2.8
Euro Area 0.9 -4.2
Japan -0.6 -6.2
Other Advanced Countries 1.6 -4.1
Emerging Countries 6.1 1.6
Africa 5.2 2.0
Eropa Timur dan Tengah 2.9 -3.7
Negara Persemakmuran 5.5 -5.1
Developing Countries 7.7 4.8
China 9.0 6.5
India 7.3 4.5
Middle East Countries 5.9 2.5
Latin America 4.2 -1.5
Table 4.1
World GDP Projection
Sources : IMF, World Economic Outlook Projections, April 2009
Projection
2008 2009

Outlook for the Indonesian Economy
27
world trade will in turn drive down commodity prices. Average non-oil and gas commodity
prices are expected to tumble -13.2% in 2009, while the average forecast for world oil
prices is 60 US dollars per barrel.
Fiscal Policy Scenario
The year 2009 is marked by an expansionary direction in fiscal policy. Government
consumption and investment are expected to climb in comparison to 2008 in response to
a range of Government policy actions, such as pay hikes, the election budget, increased
budget spending on education and an added stimulus package to fend off the impact of the
global crisis. Government investment is predicted to move forward in the second half of 2009
with significant realisation of the infrastructure stimulus package. While fiscal expansion will
take place, this will be matched by actions to safeguard fiscal sustainability. Supporting this
is the expected reduction in the Government debt ratio from about 33% of GDP in 2008
to around 31% of GDP in 2009 and the still conducive state of macroeconomic indicators.
ECONOMIC GROWTH OUTLOOK
The economic growth outlook in 2009 is strongly influenced by the flurry of
election-related spending and the level of contraction in volume of world trade.
Spending on the election of legislatures and the president and vice-president is expected to
provide sufficient momentum to sustain high levels of growth in household consumption.
However, weakening volume of world trade has produced steep contraction in exports. Taken
together, the effect of election-related spending is predicted to offset the sharp decline in
exports, potentially pushing economic growth in 2009 towards the upper limit of the
3.5%-4.0% range. If the monetary and fiscal stimulus can be scaled up and operate more
effectively in the coming quarters, economic growth may reach the 4% upper limit of
the 2009 projection. In analysis by sector, the 2009 elections will also create a stimulus for
key sectors such as manufacturing, transport and communications, financial services, leasing
and corporate services and miscellaneous services.
Outlook for Aggregate Demand
Growth in household consumption is forecasted to reach 4.1%-4.5% in 2009, down
from the 5.3% growth recorded in 2008. The impact of plunging exports caused by the
ongoing global economic downturn will in turn depress growth in household consumption.
The sharp drop in exports has not only hit exporter revenues, but also all links in the chain
of economic activities involving manufacturers, traders and workers earning the livelihoods
in export-related sectors, with knock-on effects on a wide range of economic actors in
other sectors.
In overall terms, various indicators point to an ongoing slowing trend in household
consumption. In April 2009, imports of consumption goods diminished -24.6% (yoy),
representing steeper decline compared to Q1/2009. The automotive sector, representative

Monetary Policy Report - Quarter II-2009
28
of public purchasing power for durable goods, reports significant falls in sales of cars and
motorcycles. During the April-May 2009 period, car sales plummeted -31.2% (yoy), while
sales of motorcycles were down -22.2% (yoy). Household consumption is predicted to resume
growth only in the second half of 2009 in response to the income effect of strengthening
exports. Nevertheless, overall household consumption is forecasted to maintain buoyant
growth (above 4%), particularly on the back of heavy election-related spending. Election
spending related to campaigning for national and local legislatures and the presidential
election is expected to involve considerable funding, which in turn may counter the steep
drop in household consumption.
Government consumption is forecasted to mount 9.8%-10.8% in real terms. Key
factors driving Government consumption for 2009 overall are the national legislative
elections and the presidential election, pay increases for civil servants and the payment of a
13th month salary. In Q3/2009, government consumption is expected to slow down after
peaks of high growth in the preceding quarters. The drop in government consumption is
related to the conclusion of the legislative elections in the first quarter and the completion of
preparations for the presidential poll in Q2/2009. On the other hand, government investment
is forecasted to soar in Q3/2009 with the infrastructure stimulus package expected to see
significant progress on the ground.
Investment growth in 2009 is predicted to reach 3.9%-4.3%, down from the 11.7%
growth of 2008. This drop is consistent with the more modest economic growth outlook.
Flagging economic outlook has prompted investors to delay investments in both construction
and non-construction activities, such as machinery and transportation equipment.
Confirmation of this comes from a range of indicators marked by an absence of signs of
investment momentum. Cement consumption, which provides an indication of construction
investment, remains in decline. Similarly, imports of capital goods, which provide an indication
of non-construction investment, also reported steep contraction.
In external performance, exports of goods and services in 2009 are forecasted to
contract in the range of -13.7% to -12.9%, in keeping with the lack of recovery in
the world economy. Present conditions point to further contraction in the world economy,
% Y-o-Y, Base Year 2000
I II III IV I II III IV I II*I t e m
Table 4.2
Economic Growth Projection - Demand Side
2007
* Bank Indonesia Projection Figures
Total Consumption 4.6 4.6 5.3 5.0 4.9 5.5 5.5 6.3 6.4 5.9 7.2 4.9 - 5.6 4.8 - 5.3
Private Consumption 4.7 4.7 5.1 5.5 5.0 5.7 5.5 5.3 4.8 5.3 5.8 3.8 - 4.5 4.1 - 4.5
Government Consumption 3.7 3.8 6.5 2.0 3.9 3.6 5.3 14.1 16.4 10.4 19.2 12.9 - 13.5 9.8 - 10.8
Total Investment 7.6 7.6 9.7 12.4 9.4 13.7 12.0 12.2 9.1 11.7 3.5 1.9 - 2.4 3.9 - 4.3
Domestic Demand 5.3 5.3 6.4 6.8 6.0 7.5 7.1 7.9 7.1 7.4 6.2 4.1 - 4.7 4.6 - 5.0
Export of Goods and Services 8.6 10.4 7.4 7.9 8.5 13.6 12.4 10.6 1.8 9.5 (-19.1) (-17.4) - (-16.5) (-13.7) - (-12.9)
Import of Goods and Services 8.5 6.5 7.0 13.9 9.0 18.0 16.1 11.0 -3.5 10.0 (-24.1) (-21.3) - (-19.9) (-16.3) - (-15.7)
GDP 6.0 6.6 6.6 5.8 6.3 6.2 6.4 6.4 5.2 6.1 4.4 3.7 - 4.0 3.5 - 4.0
20072008
2008 2009*2009

Outlook for the Indonesian Economy
29
bearing down advanced nations such as the United States, Europe and Japan and also
emerging market destinations for Indonesian exports, such as China and India. Based on the
Consensus Forecast for June 2009, the economies in Indonesia’s key export destinations are
set to undergo further contraction in 2009, with the exception of China and India. Even so,
the Chinese and Indian economies are predicted to perform more slowly than in 2008.
Prices for Indonesia’s export commodities - both non-oil and gas merchandise and exported
oil and natural gas - show signs of improvement. In early Q3/2009, commodity prices are
expected to chart steady gains. The average Indonesian crude price in 2009 is forecasted at
about 60 US dollars per barrel. The rise in commodity prices offers one form of incentive for
exporters to sell on the export market amid the global economic slowdown.
Plunging exports and slowing growth in household consumption are the key factors
in the steep drop in imports of goods and services, estimated to shrink in the range
of -16.3% to -15.7% in 2009. The significant fall in exports during 2009 will compel
manufacturers to cut back procurement of raw materials for export-oriented production.
On the domestic front, the slowdown in household consumption and investment has
exacerbated the falling demand for imports to satisfy domestic demand. The combination
of these developments augurs for a steep drop in imports during 2009.
Outlook for Aggregate Supply
The global economic crisis that has carried forward into 2009 has led to slowing
growth across all economic sectors. Despite this, the 2009 election activities are
expected to bolster the fortunes of the Indonesian economy and prevent further decline.
Sectors benefiting from the election activities in 2009 include manufacturing, transport and
communications, financial services, leasing and corporate services and miscellaneous services.
In analysis by contribution, transport and communications has been the largest contributing
sector to economic growth in 2009.
The agriculture sector is forecasted to grow 3.8%-4.1% in 2009, down from the 2008
outcome at 4.8%. Persistently weak external demand alongside falling international market
commodity prices has depressed agriculture sector growth compared to 2008. Nevertheless,
international prices have recently begun to climb, although still well below the average levels
of 2008. Some economic indicators in major economies such as the US, Japan and China
are improving. Strengthening global confidence is reflected in improvement in confidence
indices in the US, Japan and Germany. This has engendered optimism for a light appearing
at the end of the tunnel for global economic recovery. Signs of this optimism include a
substantial rise in natural rubber futures, encouraged by speculation over renewed demand
for automotive raw materials. The emergence of fresh hope for eventual recovery in global
economic conditions has encouraged Toyota Motor Corp, the world’s largest automotive
concern, to take on more workers to boost production of hybrid cars. This augurs well for
future demand for raw material for tyre production.
The mining and quarrying sector is expected to chart increased growth over the
preceding year at 1.5%-1.9% in 2009. One mining commodity with strong prospects
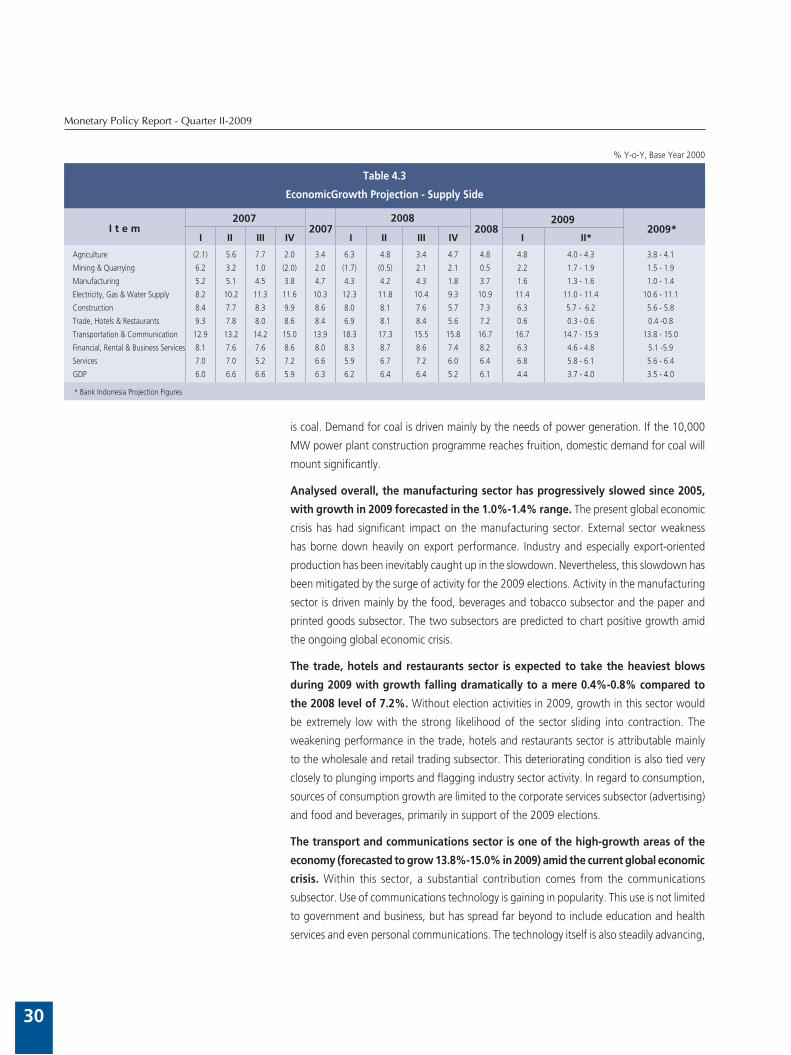
Monetary Policy Report - Quarter II-2009
30
is coal. Demand for coal is driven mainly by the needs of power generation. If the 10,000
MW power plant construction programme reaches fruition, domestic demand for coal will
mount significantly.
Analysed overall, the manufacturing sector has progressively slowed since 2005,
with growth in 2009 forecasted in the 1.0%-1.4% range. The present global economic
crisis has had significant impact on the manufacturing sector. External sector weakness
has borne down heavily on export performance. Industry and especially export-oriented
production has been inevitably caught up in the slowdown. Nevertheless, this slowdown has
been mitigated by the surge of activity for the 2009 elections. Activity in the manufacturing
sector is driven mainly by the food, beverages and tobacco subsector and the paper and
printed goods subsector. The two subsectors are predicted to chart positive growth amid
the ongoing global economic crisis.
The trade, hotels and restaurants sector is expected to take the heaviest blows
during 2009 with growth falling dramatically to a mere 0.4%-0.8% compared to
the 2008 level of 7.2%. Without election activities in 2009, growth in this sector would
be extremely low with the strong likelihood of the sector sliding into contraction. The
weakening performance in the trade, hotels and restaurants sector is attributable mainly
to the wholesale and retail trading subsector. This deteriorating condition is also tied very
closely to plunging imports and flagging industry sector activity. In regard to consumption,
sources of consumption growth are limited to the corporate services subsector (advertising)
and food and beverages, primarily in support of the 2009 elections.
The transport and communications sector is one of the high-growth areas of the
economy (forecasted to grow 13.8%-15.0% in 2009) amid the current global economic
crisis. Within this sector, a substantial contribution comes from the communications
subsector. Use of communications technology is gaining in popularity. This use is not limited
to government and business, but has spread far beyond to include education and health
services and even personal communications. The technology itself is also steadily advancing,
Agriculture (2.1) 5.6 7.7 2.0 3.4 6.3 4.8 3.4 4.7 4.8 4.8 4.0 - 4.3 3.8 - 4.1
Mining & Quarrying 6.2 3.2 1.0 (2.0) 2.0 (1.7) (0.5) 2.1 2.1 0.5 2.2 1.7 - 1.9 1.5 - 1.9
Manufacturing 5.2 5.1 4.5 3.8 4.7 4.3 4.2 4.3 1.8 3.7 1.6 1.3 - 1.6 1.0 - 1.4
Electricity, Gas & Water Supply 8.2 10.2 11.3 11.6 10.3 12.3 11.8 10.4 9.3 10.9 11.4 11.0 - 11.4 10.6 - 11.1
Construction 8.4 7.7 8.3 9.9 8.6 8.0 8.1 7.6 5.7 7.3 6.3 5.7 - 6.2 5.6 - 5.8
Trade, Hotels & Restaurants 9.3 7.8 8.0 8.6 8.4 6.9 8.1 8.4 5.6 7.2 0.6 0.3 - 0.6 0.4 -0.8
Transportation & Communication 12.9 13.2 14.2 15.0 13.9 18.3 17.3 15.5 15.8 16.7 16.7 14.7 - 15.9 13.8 - 15.0
Financial, Rental & Business Services 8.1 7.6 7.6 8.6 8.0 8.3 8.7 8.6 7.4 8.2 6.3 4.6 - 4.8 5.1 -5.9
Services 7.0 7.0 5.2 7.2 6.6 5.9 6.7 7.2 6.0 6.4 6.8 5.8 - 6.1 5.6 - 6.4
GDP 6.0 6.6 6.6 5.9 6.3 6.2 6.4 6.4 5.2 6.1 4.4 3.7 - 4.0 3.5 - 4.0
% Y-o-Y, Base Year 2000
I II III IV I II III IV I II*I t e m
Table 4.3
EconomicGrowth Projection - Supply Side
2007
* Bank Indonesia Projection Figures
20072008
2008 2009*2009

Outlook for the Indonesian Economy
31
bringing increasing levels of efficiency with the ability to offer communications services at
ever lower prices.
The major growth activity in communications in 2009 is data communications. The
comprehensive coverage of telecommunications infrastructure has fostered the growth of
telecommunications business activities. While growth in voice communications has begun to
level off, data communications (internet use) is gaining dominance as indicated by increased
use of bandwidth. Developments in various data applications and the lower charges for
internet use are key factors driving this trend, and keeping growth at a high level. At the
same time, the 2009 election activities are expected to make considerable use of data
communications. This is reported to be a major driving factor in the rapid communications
subsector growth during 2009.
Growth in the transportation subsector is led by activity in waterway and ferry transport
and road transport services. The election activities are likely to provide a major boost in this
area. These activities are primarily related to the distribution and logistics processes for the
election and travel related to election campaigning in 2009.
In 2009, construction sector growth is forecasted at 5.6%-5.8%, down from the 2008 level
of 7.3%. Construction sector activity in 2009 will be dominated by infrastructure, such as
toll roads and power plants under Phase 1 of the 10,000 MW power generation project.
Alongside this property construction, including both high-rise and landed houses, moves
forward, but also with a more sluggish rate of growth compared to 2008. The construction
sector slowdown is explained by, among others, funding constraints. Reflecting this is the
downward trend in cement consumption.
Like in other sectors, performance in the financial services, leasing and corporate services
sector is in decline with growth in 2009 forecasted at 5.1%-5.9%. The economic downturn
is expected to sap demand for intermediary services in the financial sector. At the same
time, banks face heightened levels of business risk in 2009 amid the persistently high levels
of uncertainty caused by the global financial crisis. This has created a credit crunch bearing
down on economic sectors. As a result, the banking sector has kept interest rates relatively
high despite BI Rate cuts totalling 250 bps from December 2008 to June 2009.
The main activities driving growth in the financial services, leasing and corporate services sector
are related to advertising. The flurry of activities for the 2009 elections is forecasted to become
the engine of growth in the advertising subsector. Advertising services are used widely in the
election cycle beginning with voter education activities and campaigning by candidates for
legislative office and including the election of the president and vice president. Each time an
election is held, advertising spending soars. Advertising expenditures are predicted to mount
significantly in 2009 over 2008 levels, boosted by these election activities.
INFLATION FORECAST
CPI inflation is forecasted at about 5% in 2009, with a substantial downward trend.
The key factors underlying the decline in inflation during 2009 are adequate production and
Monetary Policy Report - Quarter II-2009
32
smooth distribution of foodstuffs, improving inflation expectations, comparatively low levels
of capacity utilisation and minimum pressure from administered prices.
In analysis of aggregates, core inflationary pressure is predicted to ease during 2009 alongside
the downward trend in public inflation expectations, minimal demand side pressures and
stable levels of imported inflation. The low rate of inflation from the beginning of the year
to May 2009 has eased the general level of public inflation expectations.
Only minimal inflationary pressure is forecasted from demand and supply interaction in 2009,
consistent with the expected drop in economic growth to 3.5%-4.0% for the year. Confirming
the minimum demand side pressure is the downward trend in capacity utilisation.
Inflation in trading partner nations is predicted to be stable. While prices for some commodities
and freight costs have begun to climb, the Government’s countercyclical policy through
import duty subsidies for selected industry sectors is expected to ease pressure from imported
inflation.
Inflationary pressure from administered prices is predicted to be minimal and
declining during 2009. The lower pressure from administered prices is largely attributable
to significant cuts in subsidised fuel prices at the end of 2008 and in early 2009, followed by
reductions in transport fares. The kerosene conversion programme, originally suspected to
be fuelling administered prices inflation, is estimated to have only a minimal contribution to
inflation. Looking ahead, inflationary pressure in administered prices is predicted from non-
strategic items such as toll road charges, water billing rates and non-subsidised fuel prices.
Only minimal, declining inflationary pressure from volatile foods is forecasted for
2009. The low rate of volatile foods inflation as of May 2009 is expected to carry forward
throughout the year, consistent with outlook for sustained supply and distribution of
foodstuffs during 2009. Although the harvest season in some rice growing centres is over,
prices remain generally stable, as are prices for other staple needs. Within Indonesia, more
abundant supply will be driven mainly by productivity gains through the use of hybrid
seedlings, provision of subsidised fertilisers and improvements in agricultural infrastructure,
such as irrigation.
By mid-May 2009, rice procurement had reached 2.6 million tons, or 68% of the overall
2009 target. In regard to stocks, the BULOG rice stockpile in mid-May 2009 stood at 2.3
million tons, sufficient to supply the market for 7 months. This is a considerably high level
compared to the stocks of May last year, which were sufficient only for 5 months. Increases
in international food commodity prices are not expected to have significant upward impact
on inflationary pressures due to the adequate production and procurement of domestic
foodstuffs.
RISKS
The 3.5%-4.0% economic growth projection relies to a great extent on the outcome
of domestic and external risks. Factors that may drag GDP growth below the projected

Outlook for the Indonesian Economy
33
range include a steeper than predicted contraction in volume of world trade. Flagging world
trade volume would depress demand for Indonesia’s exports, dealing a further blow to export
performance. In a similar vein, persistently low commodity prices could sap the incentive to
export if the offered prices are perceived by exporters as insufficient in comparison to the
production costs for the exported goods. At home, tight lending will constrain the availability
of financing sources from the banking system. On the other hand, if the monetary stimulus
and fiscal stimulus can be expanded and operate smoothly and effectively, economic growth
can be achieved within the targeted band.
Risks associated with CPI inflation stem from rising prices for cooking oil and
derivative products, increases in non-strategic administered prices (such as toll road
charges), escalating international commodity prices and disruptions in food staple
production and stocks. Added to this, the ongoing kerosene to LPG energy conversion
programme in some areas of Sumatra and Sulawesi could potentially boost inflation if
shortages result from supply and distribution problems.

Monetary Policy Report - Quarter II-2009
34
5. Monetary Policy Response Quarter II-2009
In the Board of Governor’s Meeting held on 3 July 2009, Bank Indonesia decided
to lower the BI Rate by 25 bps from 7.0% to 6.75%. This decision was taken in view of
the steady reduction in future inflationary pressure and the ongoing need for a loose bias
monetary policy to bolster public and business optimism for domestic economic growth.
Bank Indonesia is maintaining a close watch on potential for inflationary pressure in
2010, including potential for increases in world commodity prices. Within this context,
future monetary policy will be directed at striking a balance between boosting the domestic
economy and measures to safeguard macroeconomic and financial system stability in the
medium-term. Accordingly, future monetary policy will pursue a more prudent bias
in view of the increasingly limited room for monetary relaxation.
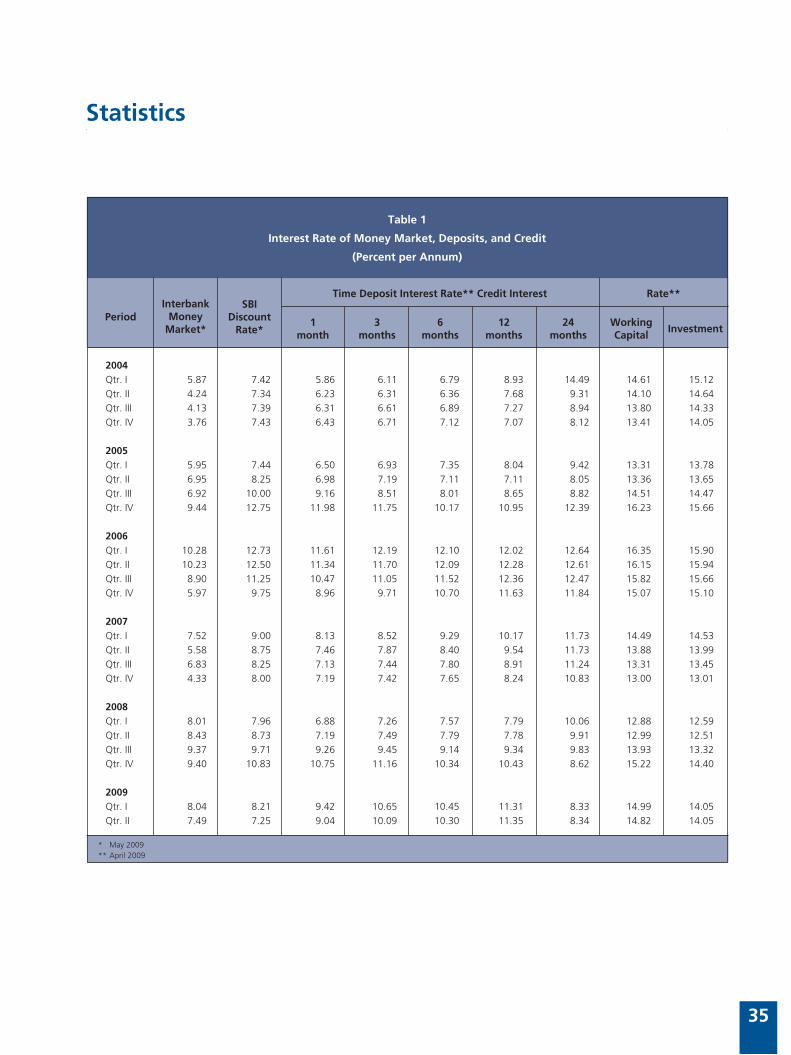
Statistics
35
Statistics
Table 1
Interest Rate of Money Market, Deposits, and Credit
(Percent per Annum)
PeriodInterbank
MoneyMarket*
SBIDiscount
Rate*
Time Deposit Interest Rate** Credit Interest Rate**
1month
3months
6months
12months
24months
5.87 7.42 5.86 6.11 6.79 8.93 14.49 14.61 15.12 4.24 7.34 6.23 6.31 6.36 7.68 9.31 14.10 14.64 4.13 7.39 6.31 6.61 6.89 7.27 8.94 13.80 14.33 3.76 7.43 6.43 6.71 7.12 7.07 8.12 13.41 14.05 5.95 7.44 6.50 6.93 7.35 8.04 9.42 13.31 13.78 6.95 8.25 6.98 7.19 7.11 7.11 8.05 13.36 13.65 6.92 10.00 9.16 8.51 8.01 8.65 8.82 14.51 14.47 9.44 12.75 11.98 11.75 10.17 10.95 12.39 16.23 15.66 10.28 12.73 11.61 12.19 12.10 12.02 12.64 16.35 15.90 10.23 12.50 11.34 11.70 12.09 12.28 12.61 16.15 15.94 8.90 11.25 10.47 11.05 11.52 12.36 12.47 15.82 15.66 5.97 9.75 8.96 9.71 10.70 11.63 11.84 15.07 15.10 7.52 9.00 8.13 8.52 9.29 10.17 11.73 14.49 14.53 5.58 8.75 7.46 7.87 8.40 9.54 11.73 13.88 13.99 6.83 8.25 7.13 7.44 7.80 8.91 11.24 13.31 13.45 4.33 8.00 7.19 7.42 7.65 8.24 10.83 13.00 13.01 8.01 7.96 6.88 7.26 7.57 7.79 10.06 12.88 12.59 8.43 8.73 7.19 7.49 7.79 7.78 9.91 12.99 12.51 9.37 9.71 9.26 9.45 9.14 9.34 9.83 13.93 13.32 9.40 10.83 10.75 11.16 10.34 10.43 8.62 15.22 14.40 8.04 8.21 9.42 10.65 10.45 11.31 8.33 14.99 14.05 7.49 7.25 9.04 10.09 10.30 11.35 8.34 14.82 14.05
WorkingCapital
Investment
2004Qtr. IQtr. IIQtr. IIIQtr. IV
2005Qtr. IQtr. IIQtr. IIIQtr. IV
2006Qtr. IQtr. IIQtr. IIIQtr. IV
2007Qtr. IQtr. IIQtr. IIIQtr. IV
2008Qtr. IQtr. IIQtr. IIIQtr. IV
2009Qtr. IQtr. II
* May 2009 ** April 2009
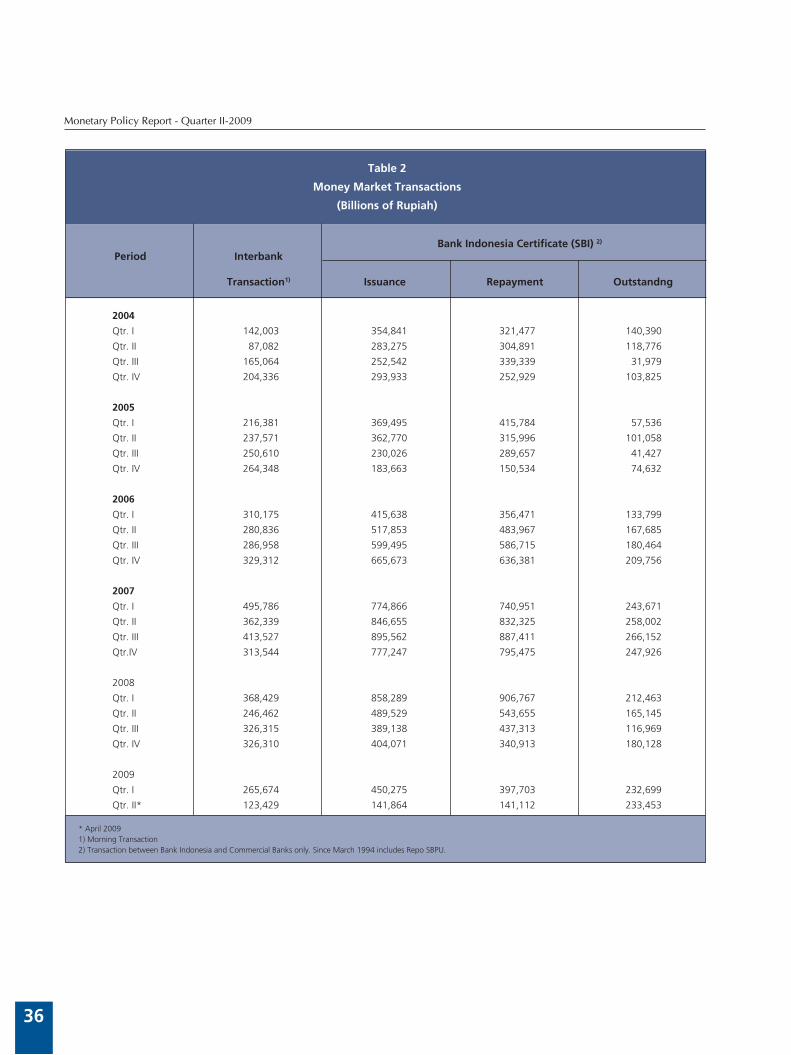
Monetary Policy Report - Quarter II-2009
36
Table 2
Money Market Transactions
(Billions of Rupiah)
Bank Indonesia Certificate (SBI) 2)
Period Interbank Transaction1) Issuance Repayment Outstandng
2004
Qtr. I
Qtr. II
Qtr. III
Qtr. IV
2005
Qtr. I
Qtr. II
Qtr. III
Qtr. IV
2006
Qtr. I
Qtr. II
Qtr. III
Qtr. IV
2007
Qtr. I
Qtr. II
Qtr. III
Qtr.IV
2008
Qtr. I
Qtr. II
Qtr. III
Qtr. IV
2009
Qtr. I
Qtr. II*
* April 2009 1) Morning Transaction2) Transaction between Bank Indonesia and Commercial Banks only. Since March 1994 includes Repo SBPU.
142,003 354,841 321,477 140,390
87,082 283,275 304,891 118,776
165,064 252,542 339,339 31,979
204,336 293,933 252,929 103,825
216,381 369,495 415,784 57,536
237,571 362,770 315,996 101,058
250,610 230,026 289,657 41,427
264,348 183,663 150,534 74,632
310,175 415,638 356,471 133,799
280,836 517,853 483,967 167,685
286,958 599,495 586,715 180,464
329,312 665,673 636,381 209,756
495,786 774,866 740,951 243,671
362,339 846,655 832,325 258,002
413,527 895,562 887,411 266,152
313,544 777,247 795,475 247,926
368,429 858,289 906,767 212,463
246,462 489,529 543,655 165,145
326,315 389,138 437,313 116,969
326,310 404,071 340,913 180,128
265,674 450,275 397,703 232,699
123,429 141,864 141,112 233,453

Statistics
37
II III IV I II III IV I II III IV I II
* April 2009 1) Excluded central government, non-resident, foreign counter part value, and managable credit.
Table 3
Outstanding of Credits in Rupiah and Foreign Currency of Commercial Banks by Group of Banks and Economic Sector1)
(Billions of Rupiah)
1 State Bank
- Agriculture
- Mining
- Industry
- Trade
- Services
- Others
2 Private National Foreign Bank
- Agriculture
- Mining
- Industry
- Trade
- Services
- Others
3 Regional Government Bank
- Agriculture
- Mining
- Industry
- Trade
- Services
- Others
4 Foreign and Joint Bank
- Agriculture
- Mining
- Industry
- Trade
- Services
- Othersn
5 Sub total (1 until 4)
- Agriculture
- Mining
- Industry
- Trade
- Services
- Others
256,267 264,735 282,784 282,633 301,186 314,427 348,973 350,232 394,065 432,850 461,877 471,478 476,280
22,110 23,012 25,816 24,222 26,805 28,433 30,281 30,711 32,381 35,153 37,409 39,839 41,901
3,428 3,485 4,771 7,414 9,006 6,556 10,647 13,371 14,922 14,778 13,807 13,363 12,893
64,567 64,265 71,165 71,600 69,959 69,450 72,810 72,706 81,038 88,181 96,838 98,660 96,970
57,548 61,031 61,431 63,561 68,172 75,722 85,601 79,209 92,719 98,865 102,017 104,904 107,064
37,094 39,269 43,481 39,477 44,868 47,465 55,587 55,271 64,182 77,295 87,505 87,080 86,885
71,520 73,673 76,120 76,359 82,376 86,801 94,047 98,964 108,823 118,578 124,301 127,632 130,567
302,693 313,651 334,943 335,998 367,168 394,451 432,595 451,967 500,718 534,599 552,617 540,163 535,867
10,248 10,316 11,430 11,312 12,053 12,467 15,533 15,571 18,298 18,169 19,150 18,722 18,306
3,414 3,775 6,460 5,409 7,321 7,076 10,678 9,621 10,137 10,850 11,137 8,979 8,685
57,119 58,125 61,525 59,826 63,319 68,670 73,840 77,952 84,610 90,896 97,042 93,414 88,966
74,997 78,679 85,628 86,783 95,549 100,883 108,726 111,756 123,057 125,908 130,687 127,648 129,184
71,371 74,729 78,963 80,252 90,497 98,503 110,144 115,400 131,115 143,486 148,332 146,455 144,578
85,544 88,027 90,937 92,416 98,429 106,852 113,674 121,667 133,501 145,290 146,269 144,945 146,148
51,141 55,009 55,959 58,851 65,123 70,937 71,921 75,065 85,339 93,991 96,440 100,956 104,021
1,860 1,922 2,030 2,090 2,130 2,248 2,274 2,379 2,710 3,067 3,182 3,143 3,1476
56 54 58 58 58 55 43 53 182 187 270 312 364
471 476 457 487 520 543 631 710 770 787 814 829 913
8,058 8,312 8,239 8,386 8,762 9,295 9,617 10,191 11,504 12,042 12,055 12,639 13,020
6,561 7,531 6,915 6,776 7,747 9,850 8,879 8,615 10,831 13,456 13,356 13,316 14,380
34,135 36,714 38,260 41,054 45,906 48,946 50,477 53,117 59,342 64,452 66,763 70,717 72,197
100,003 107,692 113,450 117,232 121,509 127,445 141,622 151,908 161,998 178,061 189,245 184,692 173,853
4,124 4,727 5,727 5,395 5,460 5,933 7,817 7,449 6,425 6,505 6,419 7,020 6,6010
2,173 2,369 2,607 2,287 2,540 2,629 3,972 4,591 3,910 4,478 5,327 6,081 5,581
46,847 49,682 49,285 50,219 51,029 51,259 56,527 60,265 65,896 68,739 74,458 71,358 65,486
5,865 6,663 7,098 7,691 9,035 10,379 11,726 11,383 13,022 14,256 13,246 15,113 14,295
21,721 24,726 28,279 30,709 31,540 34,679 37,831 43,878 46,763 56,523 60,766 57,456 53,655
19,273 19,525 20,454 20,931 21,905 22,566 23,749 24,342 25,982 27,560 29,029 27,664 28,2354
710,104 741,087 787,136 794,714 854,986 907,260 995,111 1,029,172 1,142,120 1,239,501 1,300,179 1,297,289 1,290,021
38,342 39,977 45,003 43,019 46,448 49,081 55,905 56,110 59,814 62,894 66,160 68,724 69,955
9,071 9,683 13,896 15,168 18,925 16,316 25,340 27,636 29,151 30,293 30,541 28,735 27,523
169,004 172,548 182,432 182,132 184,827 189,922 203,808 211,633 232,314 248,603 269,152 264,261 252,335
146,468 154,685 162,396 166,421 181,518 196,279 215,670 212,539 240,302 251,071 258,005 260,304 263,563
136,747 146,255 157,638 157,214 174,652 190,497 212,441 223,164 252,891 290,760 309,959 304,307 299,498
210,472 217,939 225,771 230,760 248,616 265,165 281,947 298,090 327,648 355,880 366,362 370,958 377,147
2006 2007 2008 2009

Monetary Policy Report - Quarter II-2009
38
* Apri 2009 1) M1 plus Quasi Money2) Currency Outside Banks plus Demand Deposits3) Including Government Particular Account
Table 4
Money Supply and Its Affecting Factors
(Billion of Rupiah)
M2 Affecting Factors
End ofPeriod
Total 1) Total 2)
M1
CurrencyOutsideBanks
DemandDeposits
QuasiMoney
Net ForeignAssets
NetClaims On
CentralGovt.3)
Claims OnOfficial
Entities andState
Enterprises
Claims OnPrivate
Enterprisesand
Individuals
2004
Qtr. I
Qtr. II
Qtr. III
Qtr. IV
2005
Qtr. I
Qtr. II
Qtr. III
Qtr. IV
2006
Qtr. I
Qtr. II
Qtr. III
Qtr. IV
2007
Qtr. I
Qtr. II
Qtr. III
Qtr. IV
2008
Qtr. I
Qtr. II
Qtr. III
Qtr. IV
2009
Qtr. I
Qtr.II
935.247 219.086 86.881 132.205 716.161 275.819 443.440 22.803 454.663 -261.518
975.166 233.726 97.574 136.152 741.440 280.070 468.907 27.806 522.161 -323.778
986.806 240.911 99.505 141.406 745.895 258.684 476.451 25.261 551.562 -325.152
1.033.528 253.818 109.265 144.553 779.710 263.647 498.019 26.919 588.885 -343.940
1.020.693 250.492 98.584 151.908 770.201 268.482 456.274 28.257 612.463 -344.783
1.073.746 267.635 106.125 161.510 806.111 256.058 468.004 28.237 659.129 -337.682
1.150.451 273.954 114.998 158.956 876.497 280.369 488.483 29.805 708.018 -356.224
1.203.215 281.905 124.316 157.589 921.310 313.082 498.901 28.059 710.783 -347.610
1.195.067 277.293 112.625 164.668 917.774 347.970 470.048 25.557 705.321 -353.829
1.253.757 313.153 123.761 189.392 940.604 345.457 481.654 29.746 729.609 -332.709
1.291.396 333.905 129.969 203.936 957.491 401.065 481.641 31.858 758.261 -381.429
1.382.074 361.073 151.009 210.064 1.021.001 413.265 506.488 38.946 798.125 -374.750
1.375.947 341.833 129.618 212.215 1.034.114 457.382 447.655 35.032 810.996 -375.118
1.451.974 381.376 146.715 234.661 1.070.598 496.522 430.956 44.185 865.144 -384.833
1.512.756 411.281 160.327 250.954 1.101.475 519.360 439.649 45.496 916.657 -408.406
1.643.203 460.842 183.419 277.423 1.182.361 524.703 497.478 56.152 984.844 -419.974
1.586.795 419.746 164.995 254.751 1.167.049 549.049 375.976 49.644 1.025.856 -413.730
1.699.480 466.708 189.453 277.255 1.232.772 562.636 359.645 57.304 1.131.796 -411.901
1.768.250 491.729 223.166 268.563 1.276.521 525.702 348.387 64.488 1.222.193 -392.520
1.883.851 466.379 209.378 257.001 1.417.472 602.347 379.217 66.571 1.282.257 -446.541
1.909.681 458.581 186.538 272.043 1.451.100 703.621 348.466 67.164 1.283.406 -492.976
1.905.475 464.922 190.328 274.594 1.440.553 671.148 332.695 71.044 1.272.802 -442.214
NetOtherItems

Statistics
39
Table 5
Base Money and Its Affecting Factors
(Billions of Rupiah)
247,742 257,843 297,080 272,239 289,727 310,265 379,582 325,044 349,649 392,136 344,688 304,718 309,232
0 0 0 0 0 0 0 0 0 0 0 0 0
145,666 153,569 178,572 155,498 173,888 189,221 220,785 198,940 224,342 270,243 264,391 226,672 231,368
123,761 129,969 151,009 129,618 146,715 160,327 183,419 164,995 189,453 223,166 209,378 186,538 192,143
21,905 23,600 27,563 25,880 27,173 28,894 37,366 33,945 34,889 47,077 55,013 40,134 39,225
101,751 104,061 118,417 116,558 115,524 120,740 158,452 125,705 124,811 121,302 79,648 77,404 77,279
325 213 91 183 315 304 345 399 496 591 650 642 585
213,143 255,182 274,694 305,744 330,295 337,523 356,883 351,874 351,561 355,967 338,692 354,727 361,540
34,599 2,661 22,386 -33,505 -40,569 -27,258 22,699 -26,830 -1,912 36,169 5,996 -50,009 -52,308
218,033 219,538 265,919 200,460 187,081 184,961 249,069 128,907 117,614 123,797 172,012 105,571 95,605
18,226 18,226 18,196 18,186 18,136 18,136 8,847 8,838 8,800 8,800 8,711 8,715 8,7158
11,165 11,035 10,832 10,598 10,366 10,206 9,994 9,751 9,353 9,227 9,009 8,783 8,758
5,491 5,494 5,352 5,366 5,389 5,357 3,074 3,089 3,295 3,155 3,815 2,545 2,465
-174,258 -189,131 -242,001 -247,525 -264,280 -254,096 -281,164 -219,099 -191,525 -152,563 -233,866 -257,701 -249,664
-167,685 -180,382 -208,763 -239,977 -257,998 -265,034 -247,688 -212,463 -165,145 -116,967 -179,879 -232,700 -223,319
-14,241 -16,829 -41,568 -19,298 -21,615 -4,750 -48,933 -5,737 -4,989 -1,403 -4,223 -15,288 -20,334
7,668 8,080 8,330 11,750 15,333 15,688 15,457 14,356 14,172 15,929 19,569 15,599 25,407
-68,704 -62,501 -35,912 -20,590 2,739 8,178 32,879 41,684 50,551 43,752 46,316 82,078 81,813
2006 2007 2008 2009
II III IV I II III IV I II III IV I II
I. Base Money
a. Statutory Reserve Shortfall
b. Currency
- Currency outside bank
- Cash in vaults
c. Commercial Banks Positive Balance
d. Private Sector Demand Deposits
I. Factor Affecting Base Money
a. Net International Reserve 1)
b. Net Domestic Assets
- Net Claims on Central Government
- Liquidity Support
- Liquidity Credits
- Others Claims
- Open Market
- SBI (net) 2)
- FASBI
- Others 3)
- Net Other Items
* May 2009 1) Before June 1997 : NFA, after June 1997 : NIR using constant rate Rp7,000/$ Since June 1998 up to March 1999 using constant rate Rp10,000/$ Since April 1999 using constant rate Rp7,500/$ Since 21 November 1999 using constant rate Rp7,000/$ Sejak 25 Mei 2000 for account NIR using IRFCL (Int’l Reserve and Foreign Currency Liquidity) concept2) Since March 2000 include SBI Syariah3) including Government Bonds and FTO (Fine Tune Operation)
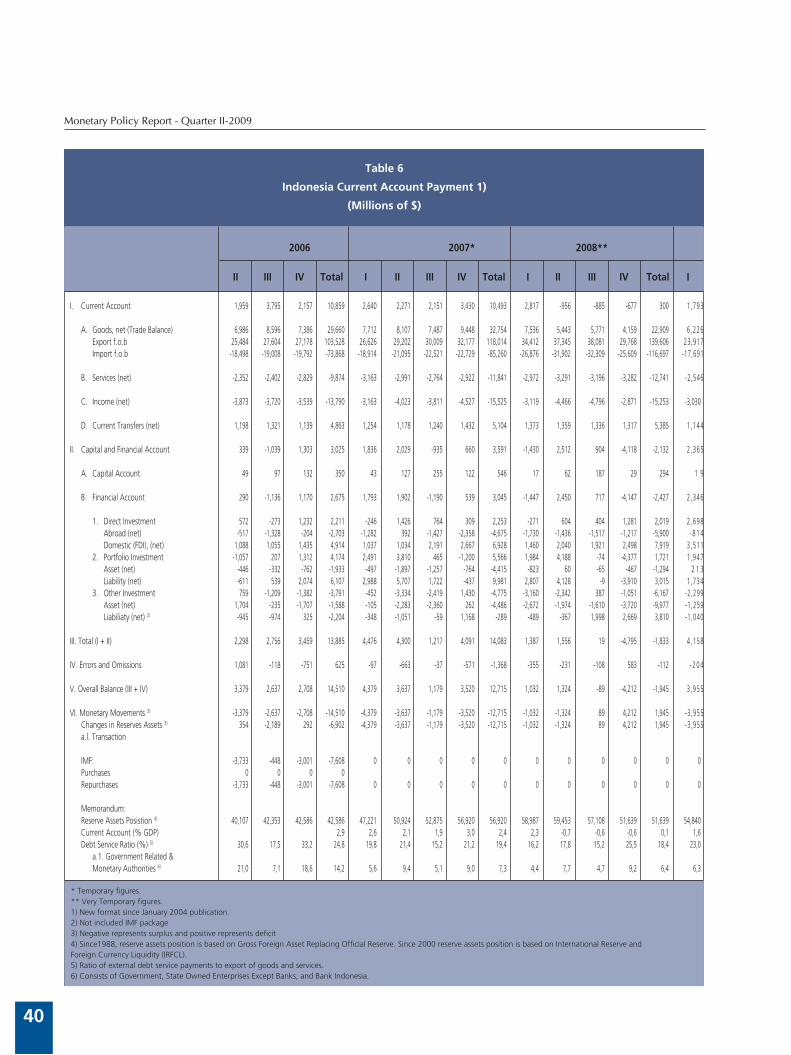
Monetary Policy Report - Quarter II-2009
40
Table 6
Indonesia Current Account Payment 1)
(Millions of $)
2006 2007* 2008**
II III IV Total I II III IV Total I II III IV Total I
I. Current Account
A. Goods, net (Trade Balance) Export f.o.b Import f.o.b
B. Services (net)
C. Income (net)
D. Current Transfers (net)
II. Capital and Financial Account
A. Capital Account B. Financial Account
1. Direct Investment Abroad (net) Domestic (FDI), (net) 2. Portfolio Investment Asset (net) Liability (net) 3. Other Investment Asset (net) Liabiliaty (net) 2)
III. Total (I + II)
IV. Errors and Omissions
V. Overall Balance (III + IV)
VI. Monetary Movements 3)
Changes in Reserves Assets 3)
a.l. Transaction
IMF: Purchases Repurchases
Memorandum: Reserve Assets Posistion 4)
Current Account (% GDP) Debt Service Ratio (%) 5)
a.1. Government Related & Monetary Authorities 6) * Temporary figures.** Very Temporary figures.1) New format since January 2004 publication.2) Not included IMF package3) Negative represents surplus and positive represents deficit4) Since1988, reserve assets position is based on Gross Foreign Asset Replacing Official Reserve. Since 2000 reserve assets position is based on International Reserve andForeign Currency Liquidity (IRFCL).5) Ratio of external debt service payments to export of goods and services.6) Consists of Government, State Owned Enterprises Except Banks, and Bank Indonesia.
1,959 3,795 2,157 10,859 2,640 2,271 2,151 3,430 10,493 2,817 -956 -885 -677 300 1 ,793 6,986 8,596 7,386 29,660 7,712 8,107 7,487 9,448 32,754 7,536 5,443 5,771 4,159 22,909 6 ,226 25,484 27,604 27,178 103,528 26,626 29,202 30,009 32,177 118,014 34,412 37,345 38,081 29,768 139,606 23,917 -18,498 -19,008 -19,792 -73,868 -18,914 -21,095 -22,521 -22,729 -85,260 -26,876 -31,902 -32,309 -25,609 -116,697 -17,691 -2,352 -2,402 -2,829 -9,874 -3,163 -2,991 -2,764 -2,922 -11,841 -2,972 -3,291 -3,196 -3,282 -12,741 -2,546 -3,873 -3,720 -3,539 -13,790 -3,163 -4,023 -3,811 -4,527 -15,525 -3,119 -4,466 -4,796 -2,871 -15,253 -3,030 1,198 1,321 1,139 4,863 1,254 1,178 1,240 1,432 5,104 1,373 1,359 1,336 1,317 5,385 1 ,144 339 -1,039 1,303 3,025 1,836 2,029 -935 660 3,591 -1,430 2,512 904 -4,118 -2,132 2 ,365 49 97 132 350 43 127 255 122 546 17 62 187 29 294 1 9 290 -1,136 1,170 2,675 1,793 1,902 -1,190 539 3,045 -1,447 2,450 717 -4,147 -2,427 2 ,346 572 -273 1,232 2,211 -246 1,426 764 309 2,253 -271 604 404 1,281 2,019 2 ,698 -517 -1,328 -204 -2,703 -1,282 392 -1,427 -2,358 -4,675 -1,730 -1,436 -1,517 -1,217 -5,900 - 8 1 4 1,088 1,055 1,435 4,914 1,037 1,034 2,191 2,667 6,928 1,460 2,040 1,921 2,498 7,919 3 ,511 -1,057 207 1,312 4,174 2,491 3,810 465 -1,200 5,566 1,984 4,188 -74 -4,377 1,721 1 ,947 -446 -332 -762 -1,933 -497 -1,897 -1,257 -764 -4,415 -823 60 -65 -467 -1,294 2 1 3 -611 539 2,074 6,107 2,988 5,707 1,722 -437 9,981 2,807 4,128 -9 -3,910 3,015 1 ,734 759 -1,209 -1,382 -3,791 -452 -3,334 -2,419 1,430 -4,775 -3,160 -2,342 387 -1,051 -6,167 -2,299 1,704 -235 -1,707 -1,588 -105 -2,283 -2,360 262 -4,486 -2,672 -1,974 -1,610 -3,720 -9,977 -1,259 -945 -974 325 -2,204 -348 -1,051 -59 1,168 -289 -489 -367 1,998 2,669 3,810 -1,040 2,298 2,756 3,459 13,885 4,476 4,300 1,217 4,091 14,083 1,387 1,556 19 -4,795 -1,833 4 ,158 1,081 -118 -751 625 -97 -663 -37 -571 -1,368 -355 -231 -108 583 -112 - 2 0 4 3,379 2,637 2,708 14,510 4,379 3,637 1,179 3,520 12,715 1,032 1,324 -89 -4,212 -1,945 3 ,955 -3,379 -2,637 -2,708 -14,510 -4,379 -3,637 -1,179 -3,520 -12,715 -1,032 -1,324 89 4,212 1,945 -3,955 354 -2,189 292 -6,902 -4,379 -3,637 -1,179 -3,520 -12,715 -1,032 -1,324 89 4,212 1,945 -3,955
-3,733 -448 -3,001 -7,608 0 0 0 0 0 0 0 0 0 0 0 0 0 0 0 -3,733 -448 -3,001 -7,608 0 0 0 0 0 0 0 0 0 0 0 40,107 42,353 42,586 42,586 47,221 50,924 52,875 56,920 56,920 58,987 59,453 57,108 51,639 51,639 54,840 2,9 2,6 2,1 1,9 3,0 2,4 2,3 -0,7 -0,6 -0,6 0,1 1,6 30,6 17,5 33,2 24,8 19,8 21,4 15,2 21,2 19,4 16,2 17,8 15,2 25,5 18,4 23,0 21,0 7,1 18,6 14,2 5,6 9,4 5,1 9,0 7,3 4,4 7,7 4,7 9,2 6,4 6,3
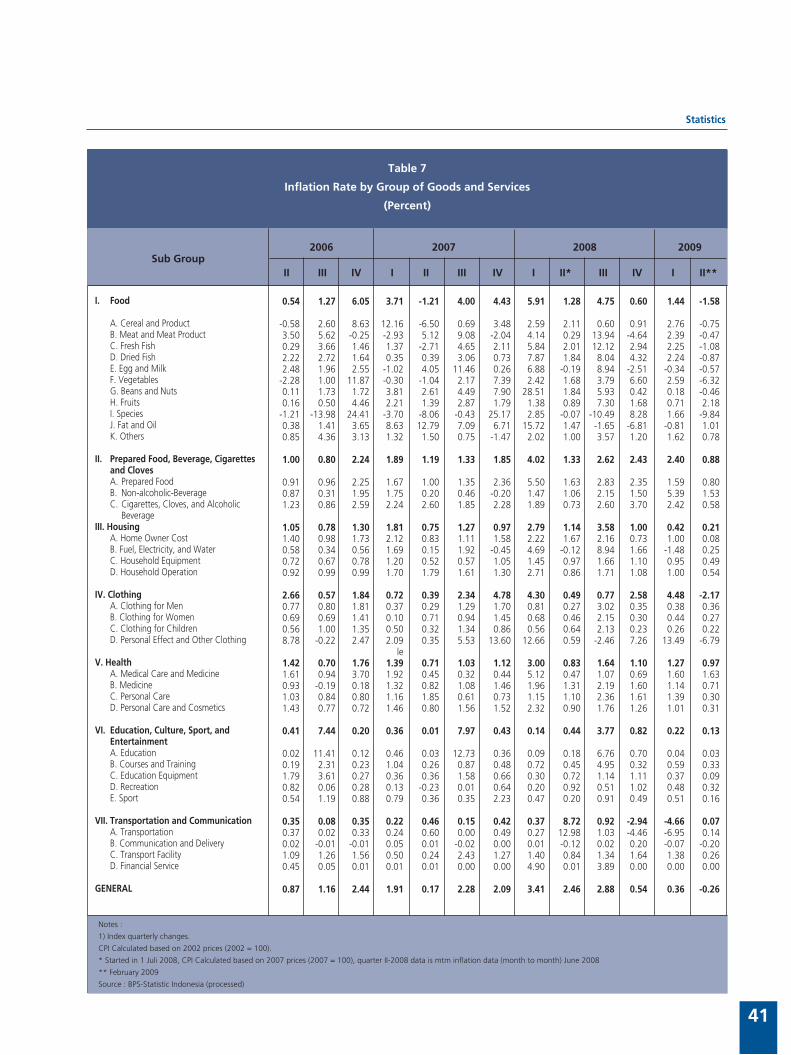
Statistics
41
Notes :
1) Index quarterly changes.
CPI Calculated based on 2002 prices (2002 = 100).
* Started in 1 Juli 2008, CPI Calculated based on 2007 prices (2007 = 100), quarter II-2008 data is mtm inflation data (month to month) June 2008
** February 2009
Source : BPS-Statistic Indonesia (processed)
Table 7
Inflation Rate by Group of Goods and Services
(Percent)
0.54 1.27 6.05 3.71 -1.21 4.00 4.43 5.91 1.28 4.75 0.60 1.44 -1.58 -0.58 2.60 8.63 12.16 -6.50 0.69 3.48 2.59 2.11 0.60 0.91 2.76 -0.75 3.50 5.62 -0.25 -2.93 5.12 9.08 -2.04 4.14 0.29 13.94 -4.64 2.39 -0.47 0.29 3.66 1.46 1.37 -2.71 4.65 2.11 5.84 2.01 12.12 2.94 2.25 -1.08 2.22 2.72 1.64 0.35 0.39 3.06 0.73 7.87 1.84 8.04 4.32 2.24 -0.87 2.48 1.96 2.55 -1.02 4.05 11.46 0.26 6.88 -0.19 8.94 -2.51 -0.34 -0.57 -2.28 1.00 11.87 -0.30 -1.04 2.17 7.39 2.42 1.68 3.79 6.60 2.59 -6.32 0.11 1.73 1.72 3.81 2.61 4.49 7.90 28.51 1.84 5.93 0.42 0.18 -0.46 0.16 0.50 4.46 2.21 1.39 2.87 1.79 1.38 0.89 7.30 1.68 0.71 2.18 -1.21 -13.98 24.41 -3.70 -8.06 -0.43 25.17 2.85 -0.07 -10.49 8.28 1.66 -9.84 0.38 1.41 3.65 8.63 12.79 7.09 6.71 15.72 1.47 -1.65 -6.81 -0.81 1.01 0.85 4.36 3.13 1.32 1.50 0.75 -1.47 2.02 1.00 3.57 1.20 1.62 0.78 1.00 0.80 2.24 1.89 1.19 1.33 1.85 4.02 1.33 2.62 2.43 2.40 0.88 0.91 0.96 2.25 1.67 1.00 1.35 2.36 5.50 1.63 2.83 2.35 1.59 0.80 0.87 0.31 1.95 1.75 0.20 0.46 -0.20 1.47 1.06 2.15 1.50 5.39 1.53 1.23 0.86 2.59 2.24 2.60 1.85 2.28 1.89 0.73 2.60 3.70 2.42 0.58 1.05 0.78 1.30 1.81 0.75 1.27 0.97 2.79 1.14 3.58 1.00 0.42 0.21 1.40 0.98 1.73 2.12 0.83 1.11 1.58 2.22 1.67 2.16 0.73 1.00 0.08 0.58 0.34 0.56 1.69 0.15 1.92 -0.45 4.69 -0.12 8.94 1.66 -1.48 0.25 0.72 0.67 0.78 1.20 0.52 0.57 1.05 1.45 0.97 1.66 1.10 0.95 0.49 0.92 0.99 0.99 1.70 1.79 1.61 1.30 2.71 0.86 1.71 1.08 1.00 0.54 2.66 0.57 1.84 0.72 0.39 2.34 4.78 4.30 0.49 0.77 2.58 4.48 -2.17 0.77 0.80 1.81 0.37 0.29 1.29 1.70 0.81 0.27 3.02 0.35 0.38 0.36 0.69 0.69 1.41 0.10 0.71 0.94 1.45 0.68 0.46 2.15 0.30 0.44 0.27 0.56 1.00 1.35 0.50 0.32 1.34 0.86 0.56 0.64 2.13 0.23 0.26 0.22 8.78 -0.22 2.47 2.09 0.35 5.53 13.60 12.66 0.59 -2.46 7.26 13.49 -6.79 le 1.42 0.70 1.76 1.39 0.71 1.03 1.12 3.00 0.83 1.64 1.10 1.27 0.97 1.61 0.94 3.70 1.92 0.45 0.32 0.44 5.12 0.47 1.07 0.69 1.60 1.63 0.93 -0.19 0.18 1.32 0.82 1.08 1.46 1.96 1.31 2.19 1.60 1.14 0.71 1.03 0.84 0.80 1.16 1.85 0.61 0.73 1.15 1.10 2.36 1.61 1.39 0.30 1.43 0.77 0.72 1.46 0.80 1.56 1.52 2.32 0.90 1.76 1.26 1.01 0.31 0.41 7.44 0.20 0.36 0.01 7.97 0.43 0.14 0.44 3.77 0.82 0.22 0.13 0.02 11.41 0.12 0.46 0.03 12.73 0.36 0.09 0.18 6.76 0.70 0.04 0.03 0.19 2.31 0.23 1.04 0.26 0.87 0.48 0.72 0.45 4.95 0.32 0.59 0.33 1.79 3.61 0.27 0.36 0.36 1.58 0.66 0.30 0.72 1.14 1.11 0.37 0.09 0.82 0.06 0.28 0.13 -0.23 0.01 0.64 0.20 0.92 0.51 1.02 0.48 0.32 0.54 1.19 0.88 0.79 0.36 0.35 2.23 0.47 0.20 0.91 0.49 0.51 0.16 0.35 0.08 0.35 0.22 0.46 0.15 0.42 0.37 8.72 0.92 -2.94 -4.66 0.07 0.37 0.02 0.33 0.24 0.60 0.00 0.49 0.27 12.98 1.03 -4.46 -6.95 0.14 0.02 -0.01 -0.01 0.05 0.01 -0.02 0.00 0.01 -0.12 0.02 0.20 -0.07 -0.20 1.09 1.26 1.56 0.50 0.24 2.43 1.27 1.40 0.84 1.34 1.64 1.38 0.26 0.45 0.05 0.01 0.01 0.01 0.00 0.00 4.90 0.01 3.89 0.00 0.00 0.00 0.87 1.16 2.44 1.91 0.17 2.28 2.09 3.41 2.46 2.88 0.54 0.36 -0.26
Sub Group 2006 2007 2008 2009 II III IV I II III IV I II* III IV I II**
I. Food A. Cereal and Product B. Meat and Meat Product C. Fresh Fish D. Dried Fish E. Egg and Milk F. Vegetables G. Beans and Nuts H. Fruits I. Species J. Fat and Oil K. Others
II. Prepared Food, Beverage, Cigarettes and Cloves A. Prepared Food B. Non-alcoholic-Beverage C. Cigarettes, Cloves, and Alcoholic BeverageIII. Housing A. Home Owner Cost B. Fuel, Electricity, and Water C. Household Equipment D. Household Operation IV. Clothing A. Clothing for Men B. Clothing for Women C. Clothing for Children D. Personal Effect and Other Clothing
V. Health A. Medical Care and Medicine B. Medicine C. Personal Care D. Personal Care and Cosmetics
VI. Education, Culture, Sport, and Entertainment A. Education B. Courses and Training C. Education Equipment D. Recreation E. Sport
VII. Transportation and Communication A. Transportation B. Communication and Delivery C. Transport Facility D. Financial Service
GENERAL
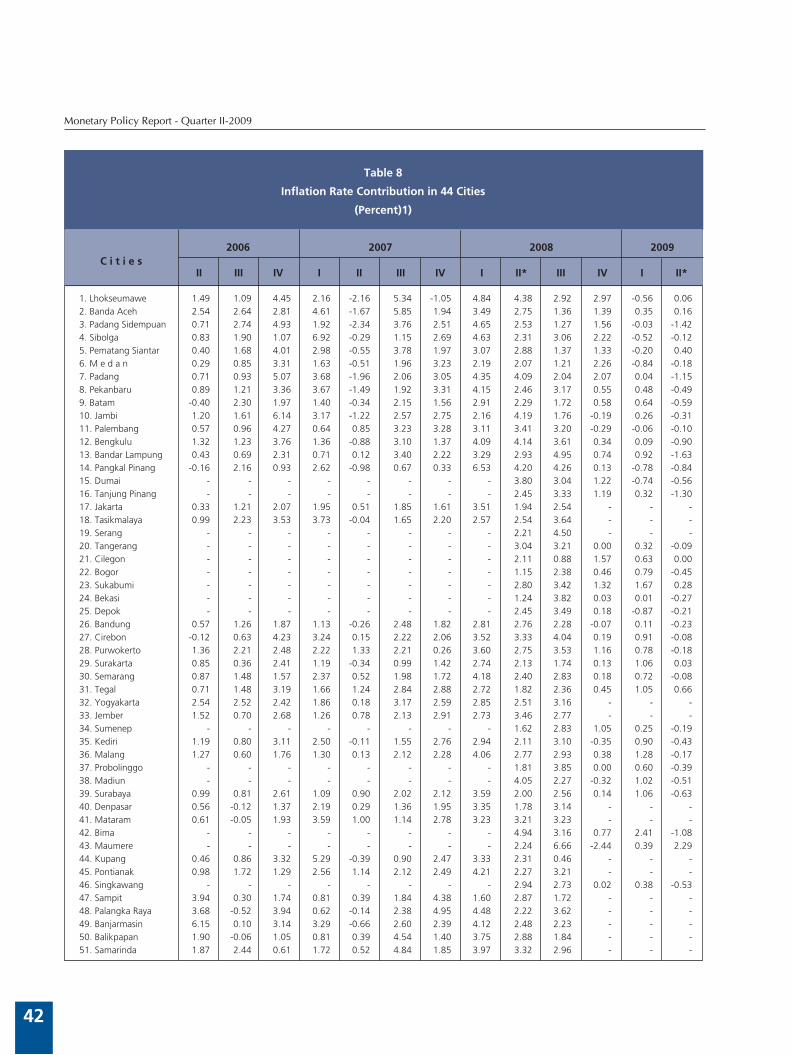
Monetary Policy Report - Quarter II-2009
42
Table 8
Inflation Rate Contribution in 44 Cities
(Percent)1)
1.49 1.09 4.45 2.16 -2.16 5.34 -1.05 4.84 4.38 2.92 2.97 -0.56 0.06 2.54 2.64 2.81 4.61 -1.67 5.85 1.94 3.49 2.75 1.36 1.39 0.35 0.16 0.71 2.74 4.93 1.92 -2.34 3.76 2.51 4.65 2.53 1.27 1.56 -0.03 -1.42 0.83 1.90 1.07 6.92 -0.29 1.15 2.69 4.63 2.31 3.06 2.22 -0.52 -0.12 0.40 1.68 4.01 2.98 -0.55 3.78 1.97 3.07 2.88 1.37 1.33 -0.20 0.40 0.29 0.85 3.31 1.63 -0.51 1.96 3.23 2.19 2.07 1.21 2.26 -0.84 -0.18 0.71 0.93 5.07 3.68 -1.96 2.06 3.05 4.35 4.09 2.04 2.07 0.04 -1.15 0.89 1.21 3.36 3.67 -1.49 1.92 3.31 4.15 2.46 3.17 0.55 0.48 -0.49 -0.40 2.30 1.97 1.40 -0.34 2.15 1.56 2.91 2.29 1.72 0.58 0.64 -0.59 1.20 1.61 6.14 3.17 -1.22 2.57 2.75 2.16 4.19 1.76 -0.19 0.26 -0.31 0.57 0.96 4.27 0.64 0.85 3.23 3.28 3.11 3.41 3.20 -0.29 -0.06 -0.10 1.32 1.23 3.76 1.36 -0.88 3.10 1.37 4.09 4.14 3.61 0.34 0.09 -0.90 0.43 0.69 2.31 0.71 0.12 3.40 2.22 3.29 2.93 4.95 0.74 0.92 -1.63 -0.16 2.16 0.93 2.62 -0.98 0.67 0.33 6.53 4.20 4.26 0.13 -0.78 -0.84 - - - - - - - - 3.80 3.04 1.22 -0.74 -0.56 - - - - - - - - 2.45 3.33 1.19 0.32 -1.30 0.33 1.21 2.07 1.95 0.51 1.85 1.61 3.51 1.94 2.54 - - - 0.99 2.23 3.53 3.73 -0.04 1.65 2.20 2.57 2.54 3.64 - - - - - - - - - - - 2.21 4.50 - - - - - - - - - - - 3.04 3.21 0.00 0.32 -0.09 - - - - - - - - 2.11 0.88 1.57 0.63 0.00 - - - - - - - - 1.15 2.38 0.46 0.79 -0.45 - - - - - - - - 2.80 3.42 1.32 1.67 0.28 - - - - - - - - 1.24 3.82 0.03 0.01 -0.27 - - - - - - - - 2.45 3.49 0.18 -0.87 -0.21 0.57 1.26 1.87 1.13 -0.26 2.48 1.82 2.81 2.76 2.28 -0.07 0.11 -0.23 -0.12 0.63 4.23 3.24 0.15 2.22 2.06 3.52 3.33 4.04 0.19 0.91 -0.08 1.36 2.21 2.48 2.22 1.33 2.21 0.26 3.60 2.75 3.53 1.16 0.78 -0.18 0.85 0.36 2.41 1.19 -0.34 0.99 1.42 2.74 2.13 1.74 0.13 1.06 0.03 0.87 1.48 1.57 2.37 0.52 1.98 1.72 4.18 2.40 2.83 0.18 0.72 -0.08 0.71 1.48 3.19 1.66 1.24 2.84 2.88 2.72 1.82 2.36 0.45 1.05 0.66 2.54 2.52 2.42 1.86 0.18 3.17 2.59 2.85 2.51 3.16 - - - 1.52 0.70 2.68 1.26 0.78 2.13 2.91 2.73 3.46 2.77 - - - - - - - - - - - 1.62 2.83 1.05 0.25 -0.19 1.19 0.80 3.11 2.50 -0.11 1.55 2.76 2.94 2.11 3.10 -0.35 0.90 -0.43 1.27 0.60 1.76 1.30 0.13 2.12 2.28 4.06 2.77 2.93 0.38 1.28 -0.17 - - - - - - - - 1.81 3.85 0.00 0.60 -0.39 - - - - - - - - 4.05 2.27 -0.32 1.02 -0.51 0.99 0.81 2.61 1.09 0.90 2.02 2.12 3.59 2.00 2.56 0.14 1.06 -0.63 0.56 -0.12 1.37 2.19 0.29 1.36 1.95 3.35 1.78 3.14 - - - 0.61 -0.05 1.93 3.59 1.00 1.14 2.78 3.23 3.21 3.23 - - - - - - - - - - - 4.94 3.16 0.77 2.41 -1.08 - - - - - - - - 2.24 6.66 -2.44 0.39 2.29 0.46 0.86 3.32 5.29 -0.39 0.90 2.47 3.33 2.31 0.46 - - - 0.98 1.72 1.29 2.56 1.14 2.12 2.49 4.21 2.27 3.21 - - - - - - - - - - - 2.94 2.73 0.02 0.38 -0.53 3.94 0.30 1.74 0.81 0.39 1.84 4.38 1.60 2.87 1.72 - - - 3.68 -0.52 3.94 0.62 -0.14 2.38 4.95 4.48 2.22 3.62 - - - 6.15 0.10 3.14 3.29 -0.66 2.60 2.39 4.12 2.48 2.23 - - - 1.90 -0.06 1.05 0.81 0.39 4.54 1.40 3.75 2.88 1.84 - - - 1.87 2.44 0.61 1.72 0.52 4.84 1.85 3.97 3.32 2.96 - - -
C i t i e s 2006 2007 2008 2009
II III IV I II III IV I II* III IV I II*
1. Lhokseumawe2. Banda Aceh3. Padang Sidempuan4. Sibolga5. Pematang Siantar6. M e d a n7. Padang8. Pekanbaru9. Batam10. Jambi11. Palembang12. Bengkulu13. Bandar Lampung14. Pangkal Pinang15. Dumai16. Tanjung Pinang17. Jakarta18. Tasikmalaya19. Serang20. Tangerang21. Cilegon22. Bogor23. Sukabumi24. Bekasi25. Depok26. Bandung27. Cirebon28. Purwokerto29. Surakarta30. Semarang31. Tegal32. Yogyakarta33. Jember34. Sumenep35. Kediri36. Malang37. Probolinggo38. Madiun39. Surabaya40. Denpasar41. Mataram42. Bima43. Maumere44. Kupang45. Pontianak46. Singkawang47. Sampit48. Palangka Raya49. Banjarmasin50. Balikpapan51. Samarinda
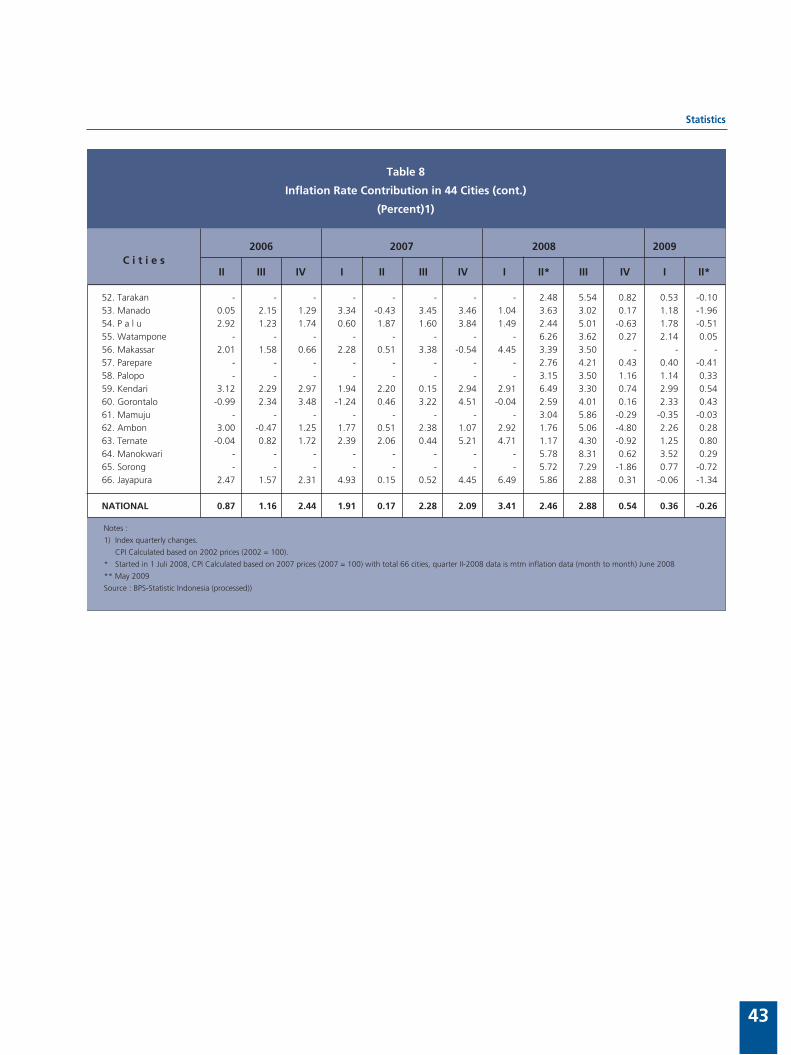
Statistics
43
Notes :
1) Index quarterly changes.
CPI Calculated based on 2002 prices (2002 = 100).
* Started in 1 Juli 2008, CPI Calculated based on 2007 prices (2007 = 100) with total 66 cities, quarter II-2008 data is mtm inflation data (month to month) June 2008
** May 2009
Source : BPS-Statistic Indonesia (processed))
Table 8
Inflation Rate Contribution in 44 Cities (cont.)
(Percent)1)
- - - - - - - - 2.48 5.54 0.82 0.53 -0.10 0.05 2.15 1.29 3.34 -0.43 3.45 3.46 1.04 3.63 3.02 0.17 1.18 -1.96 2.92 1.23 1.74 0.60 1.87 1.60 3.84 1.49 2.44 5.01 -0.63 1.78 -0.51 - - - - - - - - 6.26 3.62 0.27 2.14 0.05 2.01 1.58 0.66 2.28 0.51 3.38 -0.54 4.45 3.39 3.50 - - - - - - - - - - - 2.76 4.21 0.43 0.40 -0.41 - - - - - - - - 3.15 3.50 1.16 1.14 0.33 3.12 2.29 2.97 1.94 2.20 0.15 2.94 2.91 6.49 3.30 0.74 2.99 0.54 -0.99 2.34 3.48 -1.24 0.46 3.22 4.51 -0.04 2.59 4.01 0.16 2.33 0.43 - - - - - - - - 3.04 5.86 -0.29 -0.35 -0.03 3.00 -0.47 1.25 1.77 0.51 2.38 1.07 2.92 1.76 5.06 -4.80 2.26 0.28 -0.04 0.82 1.72 2.39 2.06 0.44 5.21 4.71 1.17 4.30 -0.92 1.25 0.80 - - - - - - - - 5.78 8.31 0.62 3.52 0.29 - - - - - - - - 5.72 7.29 -1.86 0.77 -0.72 2.47 1.57 2.31 4.93 0.15 0.52 4.45 6.49 5.86 2.88 0.31 -0.06 -1.34 0.87 1.16 2.44 1.91 0.17 2.28 2.09 3.41 2.46 2.88 0.54 0.36 -0.26
C i t i e s 2006 2007 2008 2009
II III IV I II III IV I II* III IV I II*
52. Tarakan53. Manado54. P a l u55. Watampone56. Makassar57. Parepare58. Palopo59. Kendari60. Gorontalo61. Mamuju62. Ambon63. Ternate64. Manokwari65. Sorong66. Jayapura
NATIONAL
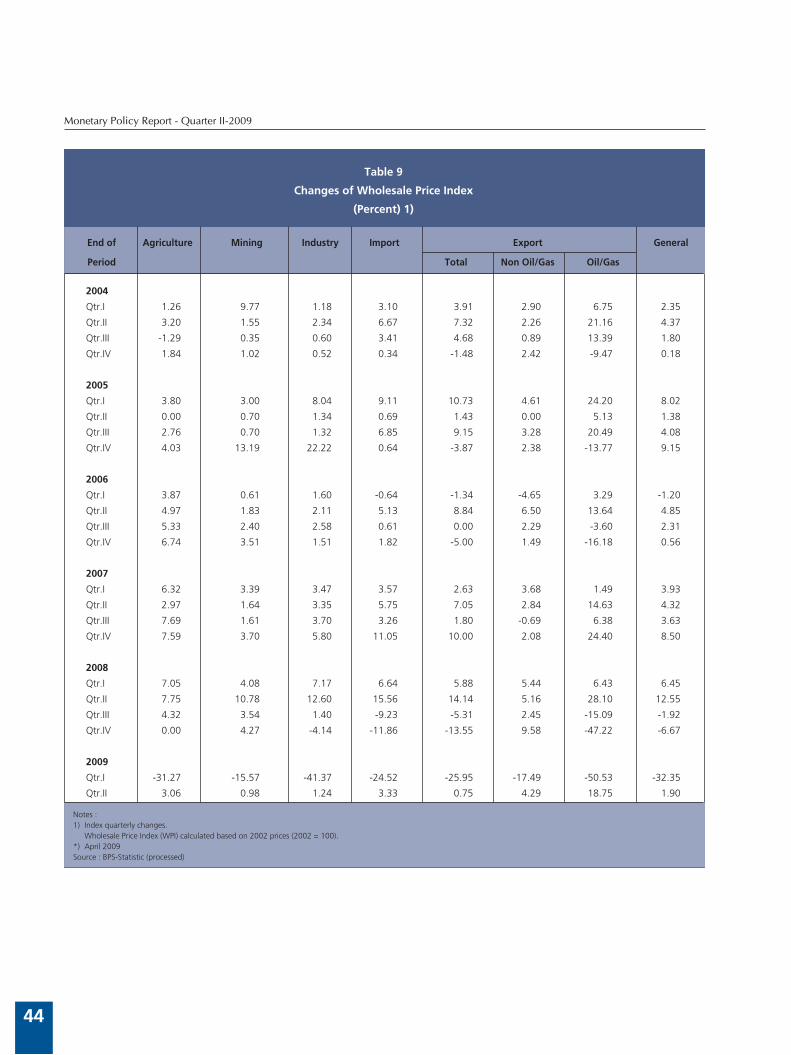
Monetary Policy Report - Quarter II-2009
44
Notes :1) Index quarterly changes. Wholesale Price Index (WPI) calculated based on 2002 prices (2002 = 100).*) April 2009Source : BPS-Statistic (processed)
Table 9
Changes of Wholesale Price Index
(Percent) 1)
1.26 9.77 1.18 3.10 3.91 2.90 6.75 2.35
3.20 1.55 2.34 6.67 7.32 2.26 21.16 4.37
-1.29 0.35 0.60 3.41 4.68 0.89 13.39 1.80
1.84 1.02 0.52 0.34 -1.48 2.42 -9.47 0.18
3.80 3.00 8.04 9.11 10.73 4.61 24.20 8.02
0.00 0.70 1.34 0.69 1.43 0.00 5.13 1.38
2.76 0.70 1.32 6.85 9.15 3.28 20.49 4.08
4.03 13.19 22.22 0.64 -3.87 2.38 -13.77 9.15
3.87 0.61 1.60 -0.64 -1.34 -4.65 3.29 -1.20
4.97 1.83 2.11 5.13 8.84 6.50 13.64 4.85
5.33 2.40 2.58 0.61 0.00 2.29 -3.60 2.31
6.74 3.51 1.51 1.82 -5.00 1.49 -16.18 0.56
6.32 3.39 3.47 3.57 2.63 3.68 1.49 3.93
2.97 1.64 3.35 5.75 7.05 2.84 14.63 4.32
7.69 1.61 3.70 3.26 1.80 -0.69 6.38 3.63
7.59 3.70 5.80 11.05 10.00 2.08 24.40 8.50
7.05 4.08 7.17 6.64 5.88 5.44 6.43 6.45
7.75 10.78 12.60 15.56 14.14 5.16 28.10 12.55
4.32 3.54 1.40 -9.23 -5.31 2.45 -15.09 -1.92
0.00 4.27 -4.14 -11.86 -13.55 9.58 -47.22 -6.67
-31.27 -15.57 -41.37 -24.52 -25.95 -17.49 -50.53 -32.35
3.06 0.98 1.24 3.33 0.75 4.29 18.75 1.90
End of Agriculture Mining Industry Import Export General
Period Total Non Oil/Gas Oil/Gas
2004
Qtr.I
Qtr.II
Qtr.III
Qtr.IV
2005
Qtr.I
Qtr.II
Qtr.III
Qtr.IV
2006
Qtr.I
Qtr.II
Qtr.III
Qtr.IV
2007
Qtr.I
Qtr.II
Qtr.III
Qtr.IV
2008
Qtr.I
Qtr.II
Qtr.III
Qtr.IV
2009
Qtr.I
Qtr.II