jl.mh. thamrin no.2 jakarta 10110 - indonesia :// · dollars, equivalent to 6.3 months of imports...
TRANSCRIPT

Jl.MH. Thamrin No.2 Jakarta 10110 - Indonesiahttp://www.bi.go.id

BANK INDONESIAFor further information. please contact:Economic Outlook & Policy DisseminationBureau of Monetary Policy Directorate of Economic Research and Monetary Policy
Telephone : +62 61 3818163 +62 21 3818206Fax. : +62 21 3452489E-mail : [email protected] : http://www.bi.go.id

i
MONETARY POLICY REPORTBANk INdONEsIA
Monetary Policy Report - Quarter I-2011
The Monetary Policy Report is published quarterly by Bank Indonesia after the Board of
Governors’ Meetings in December, April, July, and October. In addition to fulfilling the
mandate of article 58 of Act Number 23 of 1999 concerning Bank Indonesia, amended
by Act No. 3 of 2004 and Act No. 6 of 2009, the report has two main purposes: (i)
to function as a tangible product of a forward-looking working framework in which
formulation of monetary policy is based on economic and inflation forecasts; and (ii) as
a medium for the Board of Governors of Bank Indonesia to present to the public the
various policy considerations underlying its monetary policy decisions.
The Board of Governors
Darmin Nasution Governor
Hartadi A. Sarwono Deputy Governor
S. Budi Rochadi Deputy Governor
Muliaman D. Hadad Deputy Governor
Ardhayadi Mitroatmodjo Deputy Governor
Budi Mulya Deputy Governor
Halim Alamsyah Deputy Governor
MONETARY POLICY REPORTQUARTER I-2011

ii
MONETARY POLICY REPORTBANk INdONEsIA
Monetary Policy Report - Quarter I-2011
iii
MONETARY POLICY REPORTBANk INdONEsIA
Monetary Policy Report - Quarter I-2011
Monetary Policy Strategy
Underlying Principles
Under the ITF, the inflation target is established as the overriding objective and nominal anchor for monetary policy. In this regard, Bank Indonesia has adopted a forward looking strategy by guiding the present monetary policy response for achievement of a medium-term inflation target.
The application of the ITF does not mean that monetary policy disregards economic growth. The basic monetary policy paradigm of striking the optimum balance between inflation and economic growth is retained in both setting the inflation target and in the monetary policy response by focusing on achievement of low, stable inflation in the medium to long-term.
The Inflation Target
Government upon coordination with Bank Indonesia has set and announce an inflation target of CPI every year. Based on PMK No.143/PMK.011/2010 the inflation targets established by the Government for 2010 – 2012 are 5,0%, 5,0%, and 4,5% with ±1% deviation.
Monetary Instruments and Operations
The BI Rate is the published policy rate reflecting the monetary policy stance adopted by Bank Indonesia. The BI Rate is a signal for achieving the medium to long-term inflation target and is announced periodically by Bank Indonesia for a specific period. To strengthen the operational framework for monetary policy, Bank Indonesia changed from use of the 1-month SBI rate as the operational target to the overnight interbank rate with effect from 9 June 2008. In monetary operations, the BI Rate is implemented through liquidity management on the money market to achieve the monetary policy operational target, reflected in movement in the overnight interbank money market rate. To enhance the effectiveness of liquidity management on the market, a set of standing facilities in combination with an interest rate corridor is employed in day-to-day monetary operations.
Policymaking Process
The BI Rate is determined by the Board of Governors in the Monthly Board of Governors’ Meeting. In unforeseen circumstances, the monetary policy stance may be adjusted in advance of the Monthly Board of Governors’ Meeting in a weekly Board of Governors’ Meeting. Changes in the BI Rate essentially depict the Bank Indonesia monetary policy response for guiding the forecasted level of inflation within the limits of the established inflation target.
Transparency
Monetary policy is regularly communicated to the public through customary media for communication, such as statements to the press and market actors, website postings and publication of the Monetary Policy Report (MPR). This transparency is aimed at building improved understanding and shaping public expectations of the economic and inflation outlook and the monetary response taken by Bank Indonesia.
Coordination with the Government
For the purpose of coordination in inflation targeting, monitoring and control, the Government and Bank Indonesia have established a team of officials representing the various relevant agencies. The task of the Team is to deliberate and recommend the necessary policy actions for the Government and Bank Indonesia in managing inflationary pressures for achievement of the established inflation target.
Steps for Reinforcing Monetary Policy with the Overriding Objective of Price Stability (Inflation Targeting Framework)
In July 2005, Bank Indonesia launched a reinforced monetary policy framework consistent with the Inflation Targeting Framework (ITF), encompassing four key elements: (1) use of the BI Rate as the policy reference rate, (2) anticipatory monetary policymaking process, (3) more transparent communications strategy and (4) closer policy coordination with the Government. These measures are intended to strengthen monetary policy effectiveness and governance in order to achieve the overriding objective of price stability in support of sustainable economic growth and greater public prosperity.
Enhanced Monetary Policy Measures Under Inflation Targeting Framework
In July 2005, Bank Indonesia implemented and enhanced monetary policy measures within the Inflation Targeting Framework (ITF) which encompasses four main areas: the use of the BI rate as an operational target, enhanced decision making process, more transparent communications strategy, and strengthened policy coordination with the Government. The measures is intended to strengthen the effectiveness and to provide good governance to its monetary policy making to achieve the price stability needed to support sustainable economic growth and attain social welfare.

iv
MONETARY POLICY REPORTBANk INdONEsIA
Monetary Policy Report - Quarter I-2011

v
MONETARY POLICY REPORTBANk INdONEsIA
Monetary Policy Report - Quarter I-2011
Foreword
The global economic recovery is showing a steady, upward trend. Economies are regaining momentum in
almost all regions, from Asia’s emerging markets to Latin America and advanced economies such as the United States
and Europe. Economic recovery is marked by improving performance in manufacturing, which has benefited from
external sector performance and solid levels of household consumption. Despite this, progress in global economic
recovery remains daunted by a number of risks, including the debt crisis in some European nations. Global inflationary
pressures may also mount further, due to the soaring prices for oil and food commodities.
Domestic economic growth is on an upward trend. In 2011, economic growth is forecasted to reach 6.0%-
6.5% before mounting further to 6.1%-6.6% in 2012. Greater equilibrium is expected in the nation’s economic
growth, due to more robust growth in investment and exports. The expanding role of investment in the economy will
also pave the way for expansion of economic capacity. Exports are also predicted to maintain growth in line with the
ongoing global economic recovery. In analysis by sector, more robust economic activity is forecasted across a range
of sectors, led by transport and communications, trade, hotels and restaurants and the construction sector.
The ongoing improvement in external and domestic conditions underpins the outlook for continued robust
performance in Indonesia’s balance of payments. Throughout 2011, the balance of payments is projected to
chart a considerable surplus. While imports have mounted in keeping with strengthening domestic economic activity,
sustained growth in exports has enabled the current account to maintain a surplus, albeit less than in 2010. The
upbeat economic outlook and looming opportunity for Indonesia to achieve investment grade is expected to benefit
investment with stronger inflows of foreign direct investment (FDI) and portfolio capital, producing yet another hefty
surplus in the capital and financial account. The continued balance of payments surplus will further strengthen the
international reserves position. At the end of March 2011, international reserves were recorded at 105.7 billion US
dollars, equivalent to 6.3 months of imports and servicing of official foreign debt.
The rupiah exchange rate has charted further appreciation, bolstered by the improving condition of
Indonesia’s economic fundamentals and solid performance in the balance of payments. By the end of
Q1/2011, the rupiah had gained 3.47% to Rp 8,708 to the US dollar. The strengthening of the rupiah may assist in
The Governor of Bank Indonesia
vi
MONETARY POLICY REPORTBANk INdONEsIA
Monetary Policy Report - Quarter I-2011
easing inflationary pressures, in particular imported inflation related to increases in international commodity prices.
The rupiah has maintained adequate competitiveness to sustain export performance, given that rupiah appreciation
has kept pace with currency trends within the region.
Inflation is on a downward trend, although looming risks still call for vigilance. These risks have arisen from
developments in international commodity prices and steadily rising domestic demand. Inflation expectations also
remain high, necessitating comprehensive measures to curb inflation within the targeted range of 5%±1% in 2011
and 4.5%±1% in 2012. Bank Indonesia will keep a close watch on the risk of inflationary pressure. For this reason,
Bank Indonesia will reinforce the monetary and macroprudential policy mix and strengthen cooperation with the
Government in addressing supply issues.
Further improvement is visible in the bank intermediation function alongside prudently managed financial
system stability. Credit expansion reached 25.1% (yoy) in March 2011, with lending up in all categories including
MSME credit. Despite the brisk pace of credit expansion, credit quality has not deteriorated as reflected in the gross
ratio of non-performing loans (NPLs) that has held below 5%. Also attesting to the robust condition of the domestic
banking system is the capital adequacy ratio (CAR) at 18%.
A comprehensive assessment of the economic outlook with risks shifting towards equilibrium was carefully
considered in the decision in the Bank Indonesia Board of Governors’ Meeting on 12 April 2011 to hold the
BI Rate at 6.75%. Nevertheless, this decision did not alter the tight bias in the Bank Indonesia monetary policy stance
aimed at curbing the persistently high level of inflationary pressure. In addition, to minimise adverse impact from
short-term capital inflows on monetary and financial system stability, the Board of Governors decided to replace the
one-month holding period for Bank Indonesia Certificates (SBIs) with a six-month holding period. This new regulation
will come into force on 13 May 2011.
Jakarta, 12 April 2011
The Governor of Bank Indonesia
Dr. Darmin Nasution

vii
Contents
MONETARY POLICY REPORTBANk INdONEsIA
Monetary Policy Report - Quarter I-2011
Contents
1. Monetary Policy Response Quarter I-2011 ................................. 1
2. Economic Outlook and Risks Ahead ........................................... 3
Assumptions ................................................................................... 3
Economic Growth Outlook .............................................................. 4
Inflation Outlook ............................................................................ 11
Risks ............................................................................................... 12
3. Latest Macroeconomic and Monetary Developments ............... 14
Developments in the World Economy .............................................. 15
Economic Growth ........................................................................... 17
Balance of Payments (BOP) ............................................................. 23
Rupiah Exchange Rate ..................................................................... 24
Inflation .......................................................................................... 25
Dissaggregation of Inflation ............................................................ 26
Monetary Policy .............................................................................. 27
Statistics ............................................................................................ 32

viii
Contents
MONETARY POLICY REPORTBANk INdONEsIA
Monetary Policy Report - Quarter I-2011

1Monetary Policy Report - Quarter I-2011
Monetary Policy Response Quarter I-2011
1. Monetary Policy Response Quarter I-2011
In the Board of Governors’ Meeting convened on 12 April 2011, Bank Indonesia
decided to hold the BI Rate at 6.75%. This decision does not alter the tight bias in
the Bank Indonesia monetary policy stance aimed at curbing the persistently high
level of inflationary pressure in tandem with Government efforts to ease inflationary
pressure from volatile foods. In the opinion of the Board of Governors, rupiah appreciation
has worked effectively in mitigating pressure from imported inflation driven by rising prices
for internationally-traded commodities. Furthermore, to minimise negative impact from
short-term capital inflows on monetary and financial system stability, the Board of Governors
also decided to replace the one-month holding period for Bank Indonesia Certificates (SBIs)
with a six-month holding period, effective from 13 May 2011. Looking forward, Bank
Indonesia sees available headroom for adjustment in the BI Rate level to curb any further
rise in inflationary pressure. Bank Indonesia is confident that this mix of monetary and
macroprudential policies, with added support from strengthened policy coordination with the
Government, will safeguard macro stability and keep inflation on track with the established
target at 5%±1% in 2011 and 4.5%±1% in 2012.
The Board of Governors envisages further improvement in global economic
recovery, as evident in the upward revision of global economic growth projections
by various international agencies. This strengthening of global optimism will also bolster
growth in volume of world trade with positive impact on demand for exported products,
thus contributing to domestic economic growth. However, the global economic recovery
remains daunted by risks and uncertainty related to the debt crisis in some European nations
and potential disruption in manufacturing output in the aftermath of the earthquake in
Japan. In addition, further escalation is projected in world oil and food commodity prices,
generating added inflationary pressure in many advanced nations and emerging economies
including Indonesia.
On the domestic front, the Board of Governors forecasts Indonesia’s economic
growth to mount to 6.0%-6.5% in 2011 and 6.1%-6.6% in 2012. This performance will
be bolstered by greater equilibrium in the sources of growth, with investment forging ahead
alongside continued solid performance in exports. In Q2/2011, the economy is forecasted
to grow at a brisk 6.4%. Investment, led by FDI, is set for an expanded role in building the
capacity of the economy in keeping with buoyant domestic and external demand and the
upgrading of the sovereign credit rating. At the sectoral level, high growth is predicted in all
economic sectors, led by transport and communications, the trade, hotels and restaurants
sector and construction.
Indonesia’s balance of payments is expected to post another hefty surplus in 2011.
Key to this surplus will be performance in the current account and the capital and financial
account. Exports are forecasted to maintain vigorous growth. Foreign portfolio capital
2 Monetary Policy Report - Quarter I-2011
Monetary Policy Response Quarter I-2011
inflows are set to remain strong, while foreign direct investment (FDI) is on an upward
track. In response to these developments, the international reserves position at end-March
2011 reached 105.7 billion US dollars, equivalent to 6.3 months of imports and servicing
of official external debt.
The rupiah charted further appreciation during March 2011. While this can be
explained by the considerable surplus in the balance of payments and positive foreign
investor perceptions of the strength of Indonesia’s economic fundamentals, the rupiah gains
also formed part of the Bank Indonesia policy response for curbing pressure from imported
inflation. By the end of March 2011, the rupiah had strengthened 3.47% (ptp) to Rp 8,708
to the US dollar. So far, rupiah appreciation has not dented Indonesia’s competitiveness in
terms of the exchange rate, as reflected in the sustained high growth that marks Indonesia’s
non-oil and gas export performance.
Regarding prices, while inflation has embarked on a downward trend, there is
considerable risk of high inflationary pressure looking forward. CPI inflation in March
2011 was recorded at 6.65% (yoy) following month-on-month deflation at 0.32% (mtm) in
line with correction in food stuffs inflation. Although still high, inflation in the volatile foods
category has shown a downward trend in line with Government actions to strengthen national
food resilience. Similarly, administered prices have experienced only moderate inflation, a
trend related to the minimum price increases announced by the Government. However,
core inflation is on the rise, having reached 4.45% (yoy) or 0.25% (mtm) in March 2011
as a result of secondary effects from high food prices and mounting inflation expectations.
Looking forward, risks of inflationary pressure continue to loom large, stoked by rising
international commodity prices, buoyant domestic demand and high inflation expectations.
Bank Indonesia will closely monitor the risk of inflationary pressure and reinforce the monetary
and macroprudential policy mix to keep inflation on track with the established target.
Financial system stability remained secure, accompanied by steady improvement in
the banking intermediation function and prudently managed banking liquidity. The
stable condition of the banking industry is marked by secure levels of capital and liquidity,
with the capital adequacy ratio (CAR) at a tall 18% and non-performing loans (NPLs) gross
managed at a comfortably safe level below 5%. Improvement in banking intermediation is
also reflected in rising credit growth, recorded in March 2011 at 25.1% (yoy) on the strength
of expansion in all categories of lending including credit to MSMEs.
Economic Outlook and Risk Ahead
3Monetary Policy Report - Quarter I-2011
2. Economic Outlook and Risks Ahead
The Indonesian economy is predicted to chart further improvement while building
greater equilibrium in sources of growth. Higher levels of economic growth will be driven
by a strengthening investment role and continued solid performance of exports. Economic
growth in 2011 is forecasted to reach 6.0%-6.5% and in 2012 to accelerate further to 6.1%-
6.6%. Investment will play an expanding role in economic growth as a result of positive factors
such as the outlook for robust economic growth, potential for achievement of investment
grade and improvements in the investment climate and bureaucratic reforms. Household
consumption is similarly forecasted to increase in line with improvement in wages, export
earnings and support from credit financing extended by banks. On the external side, exports
will maintain high growth to keep pace with escalating demand from trading partner nations
and rising export commodity prices. Analysed by line of business, future improvement in
growth will be supported mainly by manufacturing; the trade, hotels and restaurants sector;
and transport and communications.
Although inflationary pressure has embarked on a downward trend, there is
considerable risk of high inflationary pressure looking forward. Domestic factors
spurring inflation include growing demand, consistent with forecasts of increased economic
growth. Externally, inflationary pressure will come mainly from the upward trend in
international commodity prices. Nevertheless, headroom still exists for further appreciation in
the exchange rate and this is expected to mitigate rising inflationary
pressure from externals. While potential for inflationary pressure
remains strong, the outlook suggests that inflation can be managed
in line with the inflation target at 5%±1% for 2011 and 4.5%±1%
for 2012. Bank Indonesia and the Government will manage inflation
in line with the targeting range by strengthening the policy mix
and coordination.
ASSUMPTIONS
Assumptions for the International Economy
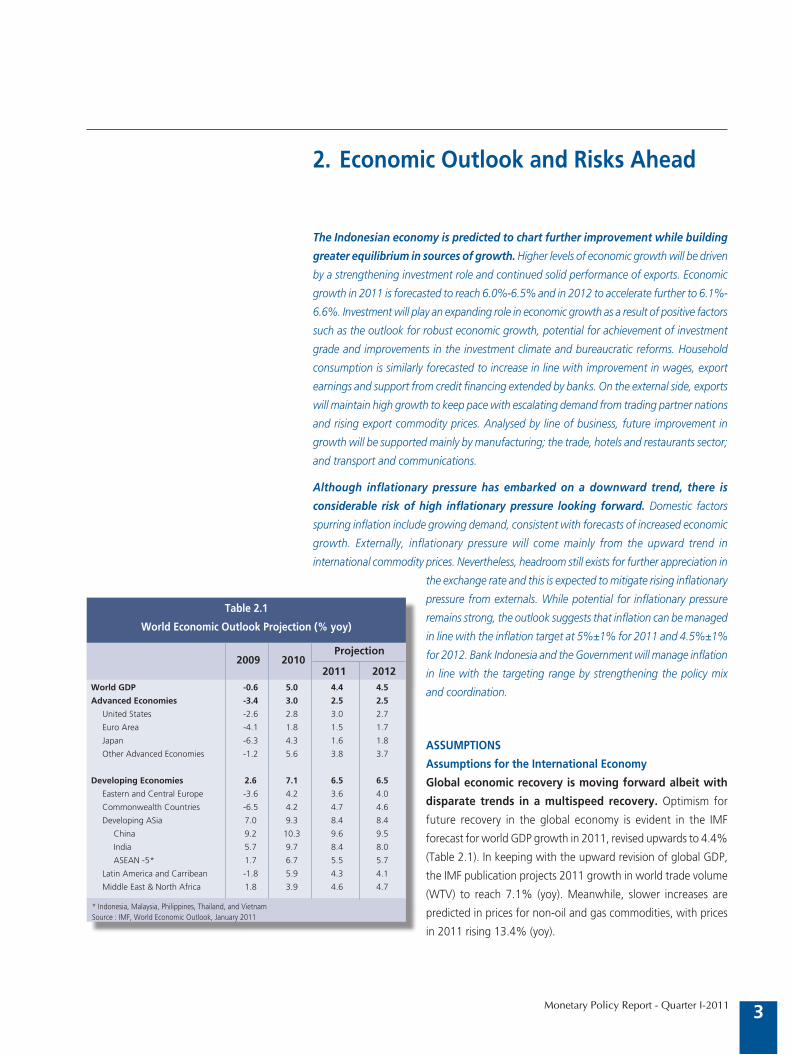
Global economic recovery is moving forward albeit with
disparate trends in a multispeed recovery. Optimism for
future recovery in the global economy is evident in the IMF
forecast for world GDP growth in 2011, revised upwards to 4.4%
(Table 2.1). In keeping with the upward revision of global GDP,
the IMF publication projects 2011 growth in world trade volume
(WTV) to reach 7.1% (yoy). Meanwhile, slower increases are
predicted in prices for non-oil and gas commodities, with prices
in 2011 rising 13.4% (yoy).
Table 2.1
World Economic Outlook Projection (% yoy)
2011 2012 2009 2010
Projection
World GDP -0.6 5.0 4.4 4.5
Advanced Economies -3.4 3.0 2.5 2.5
United States -2.6 2.8 3.0 2.7
Euro Area -4.1 1.8 1.5 1.7
Japan -6.3 4.3 1.6 1.8
Other Advanced Economies -1.2 5.6 3.8 3.7
Developing Economies 2.6 7.1 6.5 6.5
Eastern and Central Europe -3.6 4.2 3.6 4.0
Commonwealth Countries -6.5 4.2 4.7 4.6
Developing ASia 7.0 9.3 8.4 8.4
China 9.2 10.3 9.6 9.5
India 5.7 9.7 8.4 8.0
ASEAN -5* 1.7 6.7 5.5 5.7
Latin America and Carribean -1.8 5.9 4.3 4.1
Middle East & North Africa 1.8 3.9 4.6 4.7
* Indonesia, Malaysia, Philippines, Thailand, and VietnamSource : IMF, World Economic Outlook, January 2011
Economic Outlook and Risk Ahead
4 Monetary Policy Report - Quarter I-2011
Oil prices, in contrast, are expected to persist at high levels, surpassing 100 US dollars per
barrel. For 2012, the IMF predicts the world economy to grow 4.5% (yoy) with WTV growth
projected at 8.0% (yoy).
Fiscal Policy Assumptions
In the 2011 State Budget, the government has targeted the fiscal deficit at about
1.8% of GDP. The fiscal strategy in 2011 is aimed at striking a balance between fiscal
consolidation and stimulus. The more robust stimulus is reflected in increased expenditures
for productive activities with extensive multiplier effects. Added expenditures have been
allocated mainly to cover higher spending by line ministries/government agencies and transfers
to regions. On the revenues side, the Government will attempt to boost state revenues,
with increases drawn mainly from the taxation sector and other receipts. The deficit itself
will be financed mainly from issuances of rupiah-denominated government securities on
the domestic market.
In 2012, the government will stay the course with a prudent fiscal policy and controlled
deficit management to maintain the nation’s budget deficit within the range of 1.5%-1.7%
of GDP. This is also consistent with the government plan announced under the framework
of the Medium-Term Budget.
ECONOMIC GROWTH OUTLOOK
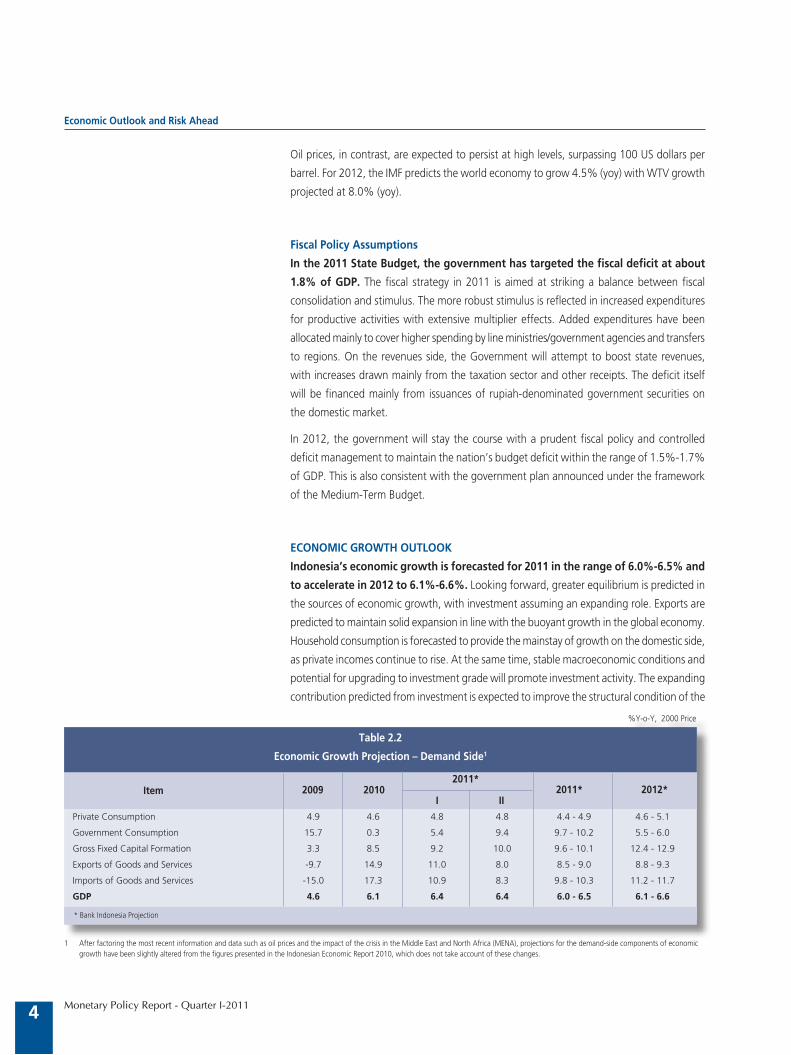
Indonesia’s economic growth is forecasted for 2011 in the range of 6.0%-6.5% and
to accelerate in 2012 to 6.1%-6.6%. Looking forward, greater equilibrium is predicted in
the sources of economic growth, with investment assuming an expanding role. Exports are
predicted to maintain solid expansion in line with the buoyant growth in the global economy.
Household consumption is forecasted to provide the mainstay of growth on the domestic side,
as private incomes continue to rise. At the same time, stable macroeconomic conditions and
potential for upgrading to investment grade will promote investment activity. The expanding
contribution predicted from investment is expected to improve the structural condition of the
Item
Table 2.2
Economic Growth Projection – Demand Side1
* Bank Indonesia Projection
Private Consumption 4.9 4.6 4.8 4.8 4.4 - 4.9 4.6 - 5.1
Government Consumption 15.7 0.3 5.4 9.4 9.7 - 10.2 5.5 - 6.0
Gross Fixed Capital Formation 3.3 8.5 9.2 10.0 9.6 - 10.1 12.4 - 12.9
Exports of Goods and Services -9.7 14.9 11.0 8.0 8.5 - 9.0 8.8 - 9.3
Imports of Goods and Services -15.0 17.3 10.9 8.3 9.8 - 10.3 11.2 - 11.7
GDP 4.6 6.1 6.4 6.4 6.0 - 6.5 6.1 - 6.6
2009 2010I II
2011*2011* 2012*
%Y-o-Y, 2000 Price
1 After factoring the most recent information and data such as oil prices and the impact of the crisis in the Middle East and North Africa (MENA), projections for the demand-side components of economic growth have been slightly altered from the figures presented in the Indonesian Economic Report 2010, which does not take account of these changes.
Economic Outlook and Risk Ahead
5Monetary Policy Report - Quarter I-2011
economy. In analysis by line of business, the mainstay sectors of manufacturing, trade, hotels
and restaurants and transportation and communications are expected to carry forward as
the engines of economic growth. In view of these various factors, the Indonesian economy
has potential to grow beyond the forecasted range.
Outlook for Aggregate Demand
Vibrant growth is predicted for household consumption as incomes continue to
rise. Household consumption growth in Q2/2011 is forecasted at 4.8% and to stay within
the 4.4%-4.9% range for 2011 as a whole. In 2012, household consumption growth is
projected even higher in the range of 4.6%-5.1%. Income growth will be driven mainly by
increases in wages and salaries and export revenues.
In 2011, provincial minimum wage levels will rise by an average of 8.7%, ahead of the average
increase in 2010 reported at 8%. The stronger increase in provincial minimum wage levels in
2011 compared to 2010 will also boost private consumption. Besides the provincial minimum
wage, the 10%-15% rise in civil servant salaries and payment of a 13th month salary will
also strengthen household consumption. Civil servant incomes are also expected to benefit
from improved remuneration linked to administrative reforms in some line ministries and
government agencies. According to data held by the National Civil Servant Agency (BAKN),
the total number of civil servants in 2010 reached 4.6 million. Any increase in the purchasing
power of civil servants is therefore expected to provide a boost to household consumption.
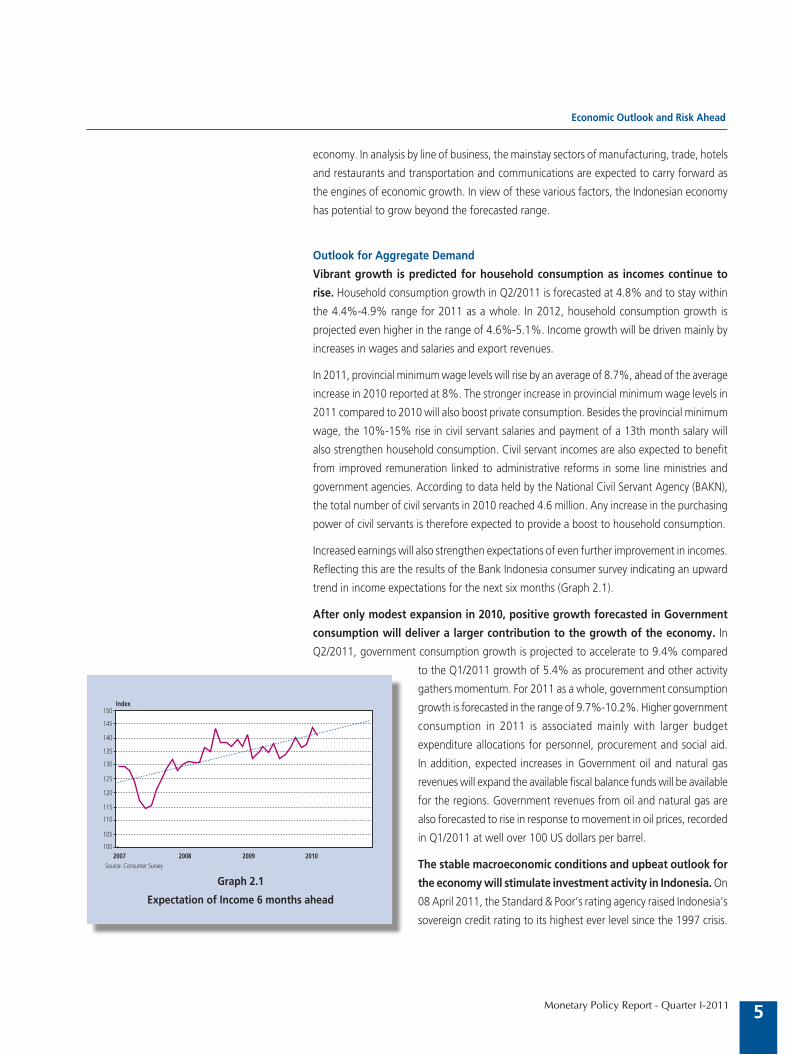
Increased earnings will also strengthen expectations of even further improvement in incomes.
Reflecting this are the results of the Bank Indonesia consumer survey indicating an upward
trend in income expectations for the next six months (Graph 2.1).
After only modest expansion in 2010, positive growth forecasted in Government
consumption will deliver a larger contribution to the growth of the economy. In
Q2/2011, government consumption growth is projected to accelerate to 9.4% compared
to the Q1/2011 growth of 5.4% as procurement and other activity
gathers momentum. For 2011 as a whole, government consumption
growth is forecasted in the range of 9.7%-10.2%. Higher government
consumption in 2011 is associated mainly with larger budget
expenditure allocations for personnel, procurement and social aid.
In addition, expected increases in Government oil and natural gas
revenues will expand the available fiscal balance funds will be available
for the regions. Government revenues from oil and natural gas are
also forecasted to rise in response to movement in oil prices, recorded
in Q1/2011 at well over 100 US dollars per barrel.
The stable macroeconomic conditions and upbeat outlook for
the economy will stimulate investment activity in Indonesia. On
08 April 2011, the Standard & Poor’s rating agency raised Indonesia’s
sovereign credit rating to its highest ever level since the 1997 crisis.
Graph 2.1
Expectation of Income 6 months ahead
���
���
���
���
���
���
���
���
���
�����������������������
�����
���
���
���� ������������
Economic Outlook and Risk Ahead
6 Monetary Policy Report - Quarter I-2011
Graph 2.2
Investment to GDP Ratio
�������
����
��
��
��
��
��
���
�
�����
�������������
���� �� ��
��
�� ����
��
���� ���� ���� ���� ���� ����� �����
Graph 2.3
Trade Volume of Advanced & Developing Economies
Indonesia’s long-term foreign currency rating was upgraded to BB+ from BB, with outlook
positive. This brings Indonesia’s present credit rating to only one level below investment
grade. The upward revision of the credit rating follows upgrading by other rating agencies
and represents one positive factor attracting inflows of investment. Following this, investment
growth in Q2/2011 is predicted to surge ahead of growth in past quarters, reaching 10%.
This positive trend is predicted to continue, with investment growth climbing to
9.6%-10.1% in 2011 and 12.4%-12.9% in 2012. Stable movement in the rupiah, low
inflation and accelerating momentum in the domestic economy are key factors attracting
inflows of long-term investment. Non-construction investment activity will involve investment
in capital goods to increase production capacity. In other developments, work under way on
infrastructure projects will boost activity in construction investment.
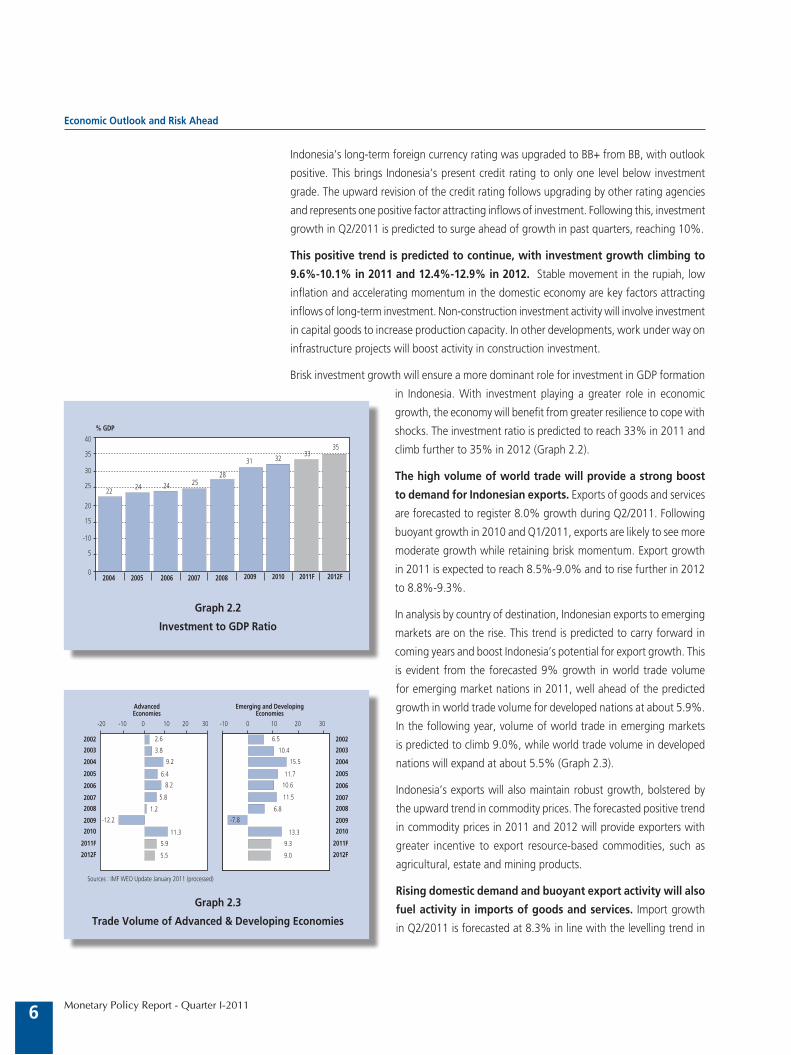
Brisk investment growth will ensure a more dominant role for investment in GDP formation
in Indonesia. With investment playing a greater role in economic
growth, the economy will benefit from greater resilience to cope with
shocks. The investment ratio is predicted to reach 33% in 2011 and
climb further to 35% in 2012 (Graph 2.2).
The high volume of world trade will provide a strong boost
to demand for Indonesian exports. Exports of goods and services
are forecasted to register 8.0% growth during Q2/2011. Following
buoyant growth in 2010 and Q1/2011, exports are likely to see more
moderate growth while retaining brisk momentum. Export growth
in 2011 is expected to reach 8.5%-9.0% and to rise further in 2012
to 8.8%-9.3%.
In analysis by country of destination, Indonesian exports to emerging
markets are on the rise. This trend is predicted to carry forward in
coming years and boost Indonesia’s potential for export growth. This
is evident from the forecasted 9% growth in world trade volume
for emerging market nations in 2011, well ahead of the predicted
growth in world trade volume for developed nations at about 5.9%.
In the following year, volume of world trade in emerging markets
is predicted to climb 9.0%, while world trade volume in developed
nations will expand at about 5.5% (Graph 2.3).
Indonesia’s exports will also maintain robust growth, bolstered by
the upward trend in commodity prices. The forecasted positive trend
in commodity prices in 2011 and 2012 will provide exporters with
greater incentive to export resource-based commodities, such as
agricultural, estate and mining products.
Rising domestic demand and buoyant export activity will also
fuel activity in imports of goods and services. Import growth
in Q2/2011 is forecasted at 8.3% in line with the levelling trend in
��� ��� � �� �� ��
�����������������
����
����
����
����
����
����
����
����
����
�����
�����
���
���
���
���
���
���
���
����
���
���
�����
��� � �� �� ��
��������������������������������
����
����
����
����
����
����
����
����
����
�����
�����
���
����
����
����
����
����
���
����
���
���
����
�������������������������������������������������
Economic Outlook and Risk Ahead
7Monetary Policy Report - Quarter I-2011
exports. For 2011 overall, imports are predicted to register 9.7%-10.3% growth, while
growth in 2012 will reach 11.2%-11.7%. Analysed by category of merchandise, import
growth will be driven mainly by imports of raw materials and capital goods, in line with
brisk investment activity.
Outlook for Aggregate Supply
Analysed by line of business, future improvement in growth will be supported
mainly by manufacturing; the trade, hotels and restaurants sector; and transport
and communications. Higher manufacturing growth will be driven primarily by rising
household consumption and investment, while also bolstered by continued solid performance
in exports. Performance in the trade, hotels and restaurants sector, while strengthened by
rising household consumption, is also related to high imports. Meanwhile, the transport and
communications sector is projected to maintain solid performance
commensurate with the mounting pace of economic activity.
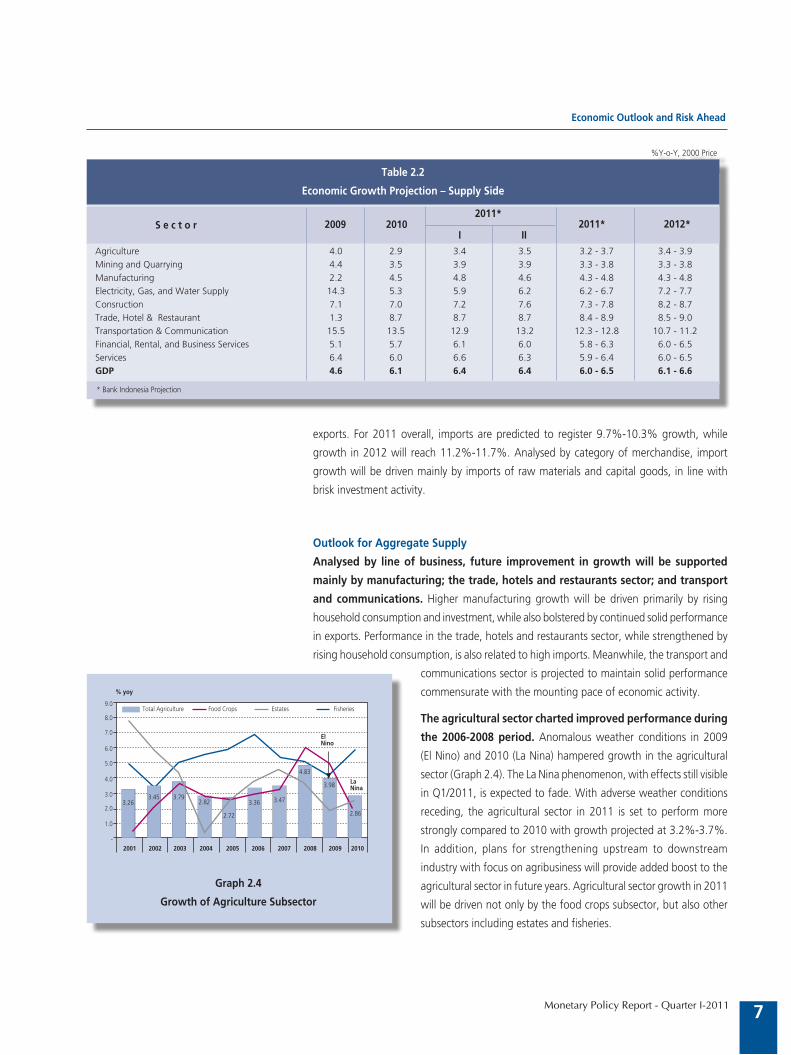
The agricultural sector charted improved performance during
the 2006-2008 period. Anomalous weather conditions in 2009
(El Nino) and 2010 (La Nina) hampered growth in the agricultural
sector (Graph 2.4). The La Nina phenomenon, with effects still visible
in Q1/2011, is expected to fade. With adverse weather conditions
receding, the agricultural sector in 2011 is set to perform more
strongly compared to 2010 with growth projected at 3.2%-3.7%.
In addition, plans for strengthening upstream to downstream
industry with focus on agribusiness will provide added boost to the
agricultural sector in future years. Agricultural sector growth in 2011
will be driven not only by the food crops subsector, but also other
subsectors including estates and fisheries.
S e c t o r
Table 2.2
Economic Growth Projection – Supply Side
* Bank Indonesia Projection
Agriculture 4.0 2.9 3.4 3.5 3.2 - 3.7 3.4 - 3.9
Mining and Quarrying 4.4 3.5 3.9 3.9 3.3 - 3.8 3.3 - 3.8
Manufacturing 2.2 4.5 4.8 4.6 4.3 - 4.8 4.3 - 4.8
Electricity, Gas, and Water Supply 14.3 5.3 5.9 6.2 6.2 - 6.7 7.2 - 7.7
Consruction 7.1 7.0 7.2 7.6 7.3 - 7.8 8.2 - 8.7
Trade, Hotel & Restaurant 1.3 8.7 8.7 8.7 8.4 - 8.9 8.5 - 9.0
Transportation & Communication 15.5 13.5 12.9 13.2 12.3 - 12.8 10.7 - 11.2
Financial, Rental, and Business Services 5.1 5.7 6.1 6.0 5.8 - 6.3 6.0 - 6.5
Services 6.4 6.0 6.6 6.3 5.9 - 6.4 6.0 - 6.5
GDP 4.6 6.1 6.4 6.4 6.0 - 6.5 6.1 - 6.6
2009 2010I II
2011*2011* 2012*
%Y-o-Y, 2000 Price
Graph 2.4
Growth of Agriculture Subsector
�
���
���
���
���
���
���
���
���
���
���� ���� ���� ���� ���� ���� ���� ���� ���� ����
�����
����������������� ���������� ������� ���������
������
������
�������� ����
����
����
���� ����
����
����
����

Economic Outlook and Risk Ahead
8 Monetary Policy Report - Quarter I-2011
In addition to more favourable weather conditions, growth in the agricultural sector will
also benefit from programmes targeting increased agricultural production, with focus on
agricultural commodities. The food resilience programme is one focus of the Government
priority work programme in 2011-2012. Expansion of food crop cultivation in 2011 will
focus more closely on rice, corn, soy beans, sugar and beef. Food crop cultivation will be
promoted under the Integrated Crop Management (PTT) programme that encompasses use
of superior varieties, quality label seeds, regulation of the crop population and fertiliser use
and deployment of field laboratories. The government has established a target of building a
10 million ton surplus rice production under the Gerakan Surplus Beras programme, launched
in 2011. To this end, the Ministry of Agriculture is engaged in an aggressive drive to develop
special hybrid strains of rice.
Stronger performance is projected in the estates and fisheries subsectors during 2011. High
demand coupled with international market prices for estate commodities offer considerable
incentive for expansion in the estates subsector. Estate crop production
is predicted to rise in 2011, bolstered by Government programmes
for boosting productivity of cocoa, tea, sugar cane, coffee and oil
palm plantings. Looking forward, the estates subsector is expected to
show even further improvement in view of the investments planned
by some state enterprises operating in primary industry. During the
2011-2014 period, investment is slated for rubber, oil palm, sugar,
tea, coffee and cocoa cultivation in Sumatra, Java (including Jakarta),
Kalimantan, Sulawesi, the North Moluccas, Bali-Nusa Tenggara and
Papua-Moluccas. Stronger performance is also forecasted in the
fisheries subsector, driven in part by high demand for seaweed, eels,
silver catfish and smoked garfish.
Manufacturing has picked up with growth approaching levels
reached before the 2008 global economic crisis (Graph 2.5).
While manufacturing has been driven by rising domestic demand,
the improvement in global economic conditions will also benefit
export performance (Graph 2.6). The outlook for increasing demand
provides incentive for expansion in domestic and export-oriented
manufacturing. Among the indicators of expansion in the industrial
sector is growing activity in imports of raw materials and capital
goods as well as non-construction investment.
However, following the Japan earthquake, the upbeat performance
in manufacturing is overshadowed by looming risks in the
transportation equipment and oil and natural gas refining subsectors,
particularly during Q2/2011. The disaster in Japan has kindled fears
of disruption in supply of components and raw materials for vehicles
and heavy equipment. In other developments, the risk looming in
the oil and natural gas refining subsector is related to the burning
of raw material storage tanks owned by Pertamina in early April
Graph 2.5.
Growth of Manufacturing
Graph 2.6.
Growth of Export and Non Oil & Gas Industry
���� ���� ���� ���� ���� ���� ���� �������� ����
������
������ ������������������������
����
����
����
���
�
�����
������
������
���
���
���
���
���
���
���
���
�
�
���
���
���
���
���
���
���
���� ���� ���� ���� ���� ���� ���� ���� ���� ���� ����� �����
������
��������������������������������������������������������������������������������������
��� ���
���
��� ���
���
��� ��� ���
���
���
���
Economic Outlook and Risk Ahead
9Monetary Policy Report - Quarter I-2011
2011. Nevertheless, the fires at the Pertamina storage tanks in
Cilacap are expected to have minimum impact on fuel production.
Aside from these factors, the potential for disruption in supply of
automotive components as a result of the Japan quake is seen as
only temporary.
Optimism for strengthening industry performance is also supported
by efforts by the Ministry of Industry to focus industrial development
in six priority areas of industry. These priority industries are labour
intensive and consist of textiles and textile products, small and
medium-scale industries, capital goods production and resource-
based, high growth and special priority industries. To promote
accelerated economic growth in Indonesia, the Ministry of Industry
has grouped industrial development into six economic corridors,
namely Sumatra, Kalimantan, Sulawesi and North Moluccas, Java, Bali
and Nusa Tenggara and Papua and the Moluccas. In other actions to
promote more rapid expansion in priority industries, the Government
will offer fiscal incentives including import duty exemptions on capital
goods and raw materials needed to support priority manufacturing
production in Indonesia.
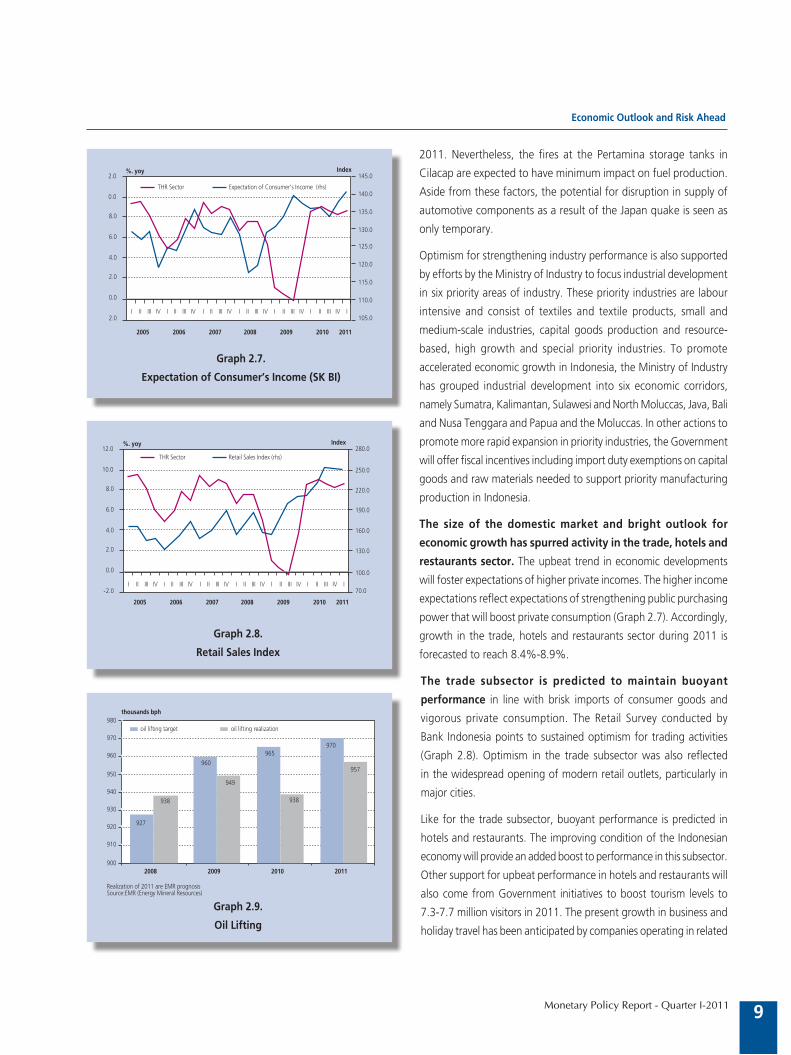
The size of the domestic market and bright outlook for
economic growth has spurred activity in the trade, hotels and
restaurants sector. The upbeat trend in economic developments
will foster expectations of higher private incomes. The higher income
expectations reflect expectations of strengthening public purchasing
power that will boost private consumption (Graph 2.7). Accordingly,
growth in the trade, hotels and restaurants sector during 2011 is
forecasted to reach 8.4%-8.9%.
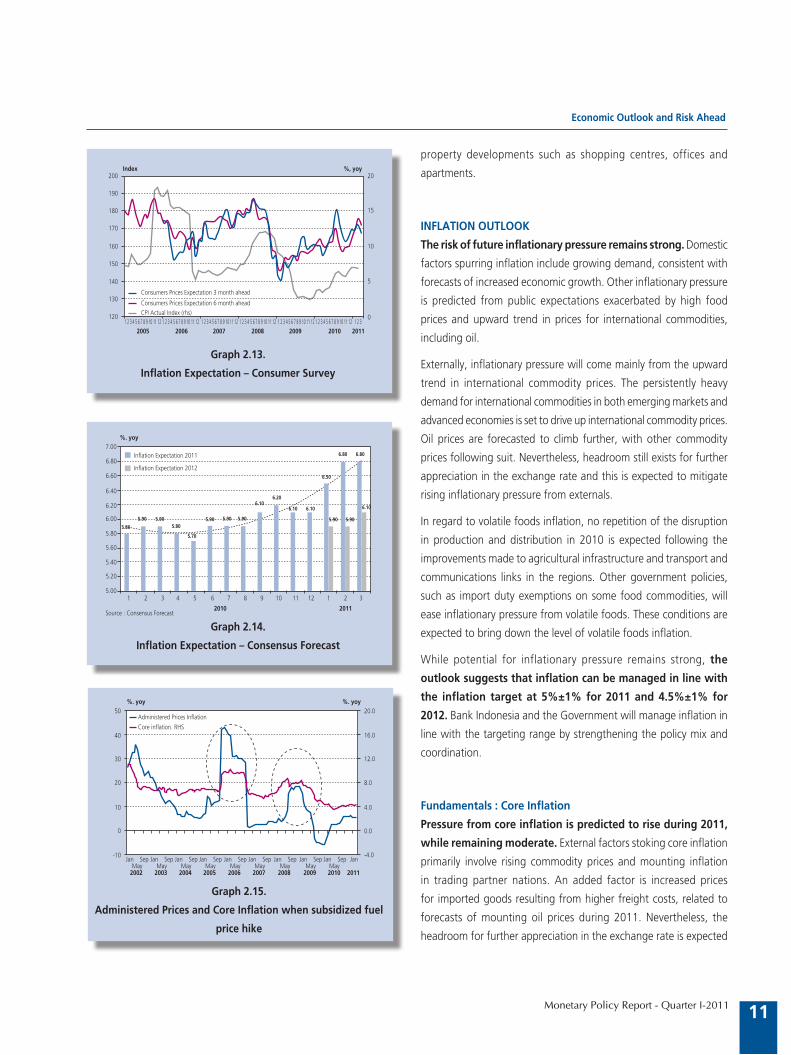
The trade subsector is predicted to maintain buoyant
performance in line with brisk imports of consumer goods and
vigorous private consumption. The Retail Survey conducted by
Bank Indonesia points to sustained optimism for trading activities
(Graph 2.8). Optimism in the trade subsector was also reflected
in the widespread opening of modern retail outlets, particularly in
major cities.
Like for the trade subsector, buoyant performance is predicted in
hotels and restaurants. The improving condition of the Indonesian
economy will provide an added boost to performance in this subsector.
Other support for upbeat performance in hotels and restaurants will
also come from Government initiatives to boost tourism levels to
7.3-7.7 million visitors in 2011. The present growth in business and
holiday travel has been anticipated by companies operating in related
Graph 2.7.
Expectation of Consumer’s Income (SK BI)
�����
�����
�����
�����
�����
�����
�����
�����
�����
����
���
���
���
���
���
����
����
���� ���� ���� ���� ���� ���� ����
�����������
� �� ��� �� � �� ��� �� � �� ��� �� � �� ��� �� � �� ��� �� � �� ��� �� �
���������� ���������������������������������������
Graph 2.8.
Retail Sales Index
����
�����
�����
�����
�����
�����
�����
�����
����
���
���
���
���
���
����
����
���� ���� ���� ���� ���� ���� ����
�����������
����������� ������������������������
� �� ��� �� � �� ��� �� � �� ��� �� � �� ��� �� � �� ��� �� � �� ��� �� �
Graph 2.9.
Oil Lifting
���
���
���
���
���
���
���
���
���
���� ���� ���� ����
�������������
������������������ �����������������������
��������������������������������������������������������������������������
���
���
���
���
���
���
���
���

Economic Outlook and Risk Ahead
10 Monetary Policy Report - Quarter I-2011
lines of business, such as flights and accommodation. Some airlines
have responded to growing travel by expanding their aircraft fleets,
increasing flight frequency or opening new routes. Meanwhile, the
hospitality industry has seen a rush to build budget hotels, comprising
lower-priced 1 or 2 star accommodation. These hotels are being
developed to meet demand for short-term or transit accommodation,
currently a rapidly growing segment of the market.
The transport and communications sector is forecasted to
keep charting a respectable level of growth. The main engine of
growth in this sector, like before, is the communications subsector.
Service innovations are continually rolling out, particularly in
relation to development of data services infrastructure. Although
not dominant, the transportation subsector has also shown positive
growth. Performance in the transportation subsector is closely tied to
the dynamics of wider economic activity. The predicted expansion in
economic activity will also stimulate activity in freight and passenger
transportation. Bolstered by these developments, the transport and
communications sector is predicted to maintain vigorous growth at
12.3% in 2011.
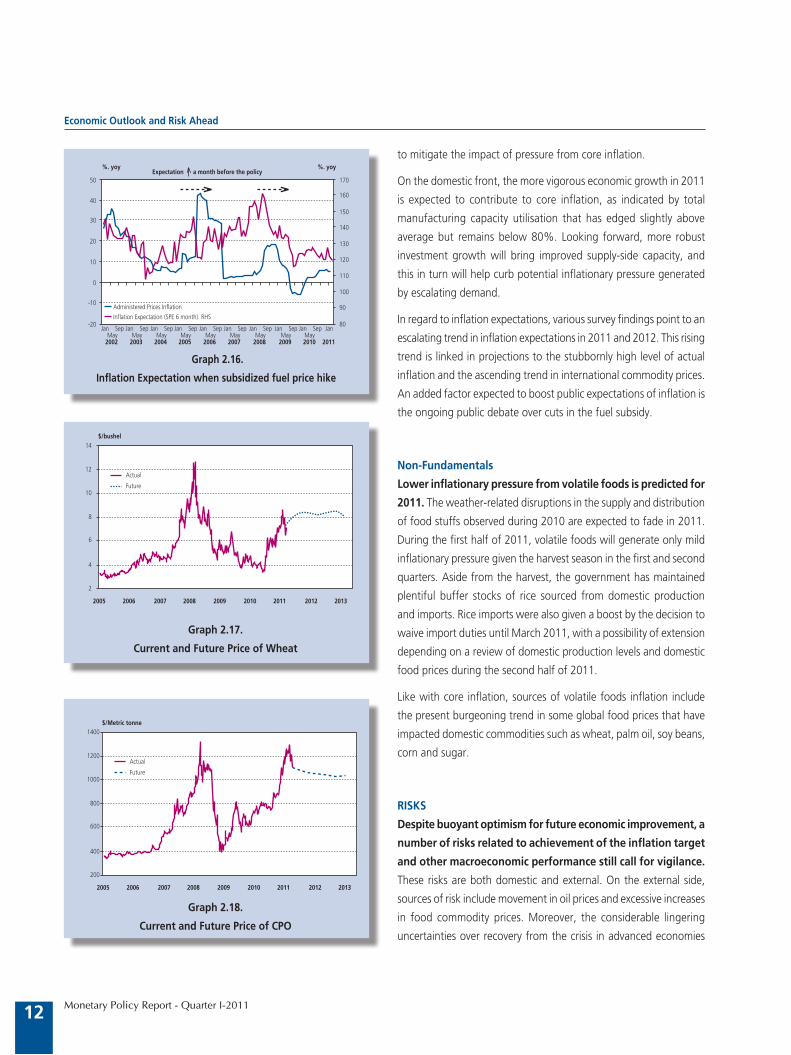
Improved fortunes are predicted for the mining and quarrying
sector in 2011 compared to the year before. More favourable
weather conditions this year will pave the way for increased mining
activity compared to the past year. Production in the oil and gas
subsector is forecasted to rise (Graphs 2.9 and 2.10). In the non-oil
and gas subsector, coal offers bright prospects, given the steady
rise in domestic and foreign demand. Indonesian coal is not only in
demand in other countries in Asia, but also in Europe. At home, the
Government plans to expand the use of coal with the development
of coal bed methane (CBM) for power generation. Gas from CBM
project in the Sangatta field is targeted to come on stream for power
generation supplying the national grid before the end of 2011.
More rapid progress on infrastructure projects in 2011 is
expected to bolster performance in the construction sector. In
2011, the Government plans to develop infrastructure in a range of
sectors in support of national economic growth. A number of airport
expansion projects are targeted in the transportation infrastructure
development for 2011. Slated for expansion are the Achmad Yani
and Samarinda Baru airports, the Ngurah Rai international airport in
Bali, Sorong airport, airfields for pioneering routes in the Moluccas
and Papua, the Tampa Padang airport (Mamuju) and the Lombok
international airport. Aside from infrastructure development,
construction sector performance will also be driven by commercial
Graph 2.10.
Natural Gas Lifting
�����
�����
�����
�����
�����
�����
�����
���� ���� ���� ����
�����������������������
�������������������
��������������������������������������������������������������������������
�����
�����
�����
�����
Graph 2.11.
Oil Price and WPI Import
�
���
���
���
���
���
���
���
���
���
�
��
��
��
��
���
���
���
� � � � � � � � � � � � � � � � � � � � � � � � � � � � � � � �
���������������
����������
���������������
���� ���� ���� ���� ���� ���� ���� ����
Graph 2.12.
Manufacturing Production Capacity and Core Inflation
����
����
����
����
����
�����
�����
���
����
����
����
����
����
����
����
����
����
���� ���� ���� ���� ���� ����
� ����
���������������������������������������
��������������
� � � � � � � � � � � � � � � � � � � � �
Economic Outlook and Risk Ahead
11Monetary Policy Report - Quarter I-2011
property developments such as shopping centres, offices and
apartments.
INFLATION OUTLOOK
The risk of future inflationary pressure remains strong. Domestic
factors spurring inflation include growing demand, consistent with
forecasts of increased economic growth. Other inflationary pressure
is predicted from public expectations exacerbated by high food
prices and upward trend in prices for international commodities,
including oil.
Externally, inflationary pressure will come mainly from the upward
trend in international commodity prices. The persistently heavy
demand for international commodities in both emerging markets and
advanced economies is set to drive up international commodity prices.
Oil prices are forecasted to climb further, with other commodity
prices following suit. Nevertheless, headroom still exists for further
appreciation in the exchange rate and this is expected to mitigate
rising inflationary pressure from externals.
In regard to volatile foods inflation, no repetition of the disruption
in production and distribution in 2010 is expected following the
improvements made to agricultural infrastructure and transport and
communications links in the regions. Other government policies,
such as import duty exemptions on some food commodities, will
ease inflationary pressure from volatile foods. These conditions are
expected to bring down the level of volatile foods inflation.
While potential for inflationary pressure remains strong, the
outlook suggests that inflation can be managed in line with
the inflation target at 5%±1% for 2011 and 4.5%±1% for
2012. Bank Indonesia and the Government will manage inflation in
line with the targeting range by strengthening the policy mix and
coordination.
Fundamentals : Core Inflation
Pressure from core inflation is predicted to rise during 2011,
while remaining moderate. External factors stoking core inflation
primarily involve rising commodity prices and mounting inflation
in trading partner nations. An added factor is increased prices
for imported goods resulting from higher freight costs, related to
forecasts of mounting oil prices during 2011. Nevertheless, the
headroom for further appreciation in the exchange rate is expected
Graph 2.13.
Inflation Expectation – Consumer Survey
��������
���
���
���
���
���
���
���
���
������������������������������������������
����������������������������������������������������������������
��
��
��
�
�
������
�������������������������� �������������������������� �������������������������� �������������������������� �������������������������� �������������������������� ��������� ���� ���� ���� ���� ���� ����
Graph 2.14.
Inflation Expectation – Consensus Forecast
����
����
����
����
����
����
����
����
����
����
����
����
���� ��������
����
���� ���� ����
��������
���� ����
����
���� ����
����
���� ����
� � � � � � � � � �� �� �� � � �
��������������������������
��������������������������
���� �������������������������������
������
Graph 2.15.
Administered Prices and Core Inflation when subsidized fuel
price hike
��
��
��
��
��
�
���
����
����
����
���
���
���
����
������������������������������������������������
������ ������
������
���
����
������
���
����
������
���
����
������
���
����
������
���
����
������
���
����
������
���
����
������
���
����
������
���
����
���
����
Economic Outlook and Risk Ahead
12 Monetary Policy Report - Quarter I-2011
to mitigate the impact of pressure from core inflation.
On the domestic front, the more vigorous economic growth in 2011
is expected to contribute to core inflation, as indicated by total
manufacturing capacity utilisation that has edged slightly above
average but remains below 80%. Looking forward, more robust
investment growth will bring improved supply-side capacity, and
this in turn will help curb potential inflationary pressure generated
by escalating demand.
In regard to inflation expectations, various survey findings point to an
escalating trend in inflation expectations in 2011 and 2012. This rising
trend is linked in projections to the stubbornly high level of actual
inflation and the ascending trend in international commodity prices.
An added factor expected to boost public expectations of inflation is
the ongoing public debate over cuts in the fuel subsidy.
Non-Fundamentals
Lower inflationary pressure from volatile foods is predicted for
2011. The weather-related disruptions in the supply and distribution
of food stuffs observed during 2010 are expected to fade in 2011.
During the first half of 2011, volatile foods will generate only mild
inflationary pressure given the harvest season in the first and second
quarters. Aside from the harvest, the government has maintained
plentiful buffer stocks of rice sourced from domestic production
and imports. Rice imports were also given a boost by the decision to
waive import duties until March 2011, with a possibility of extension
depending on a review of domestic production levels and domestic
food prices during the second half of 2011.
Like with core inflation, sources of volatile foods inflation include
the present burgeoning trend in some global food prices that have
impacted domestic commodities such as wheat, palm oil, soy beans,
corn and sugar.
RISKS
Despite buoyant optimism for future economic improvement, a
number of risks related to achievement of the inflation target
and other macroeconomic performance still call for vigilance.
These risks are both domestic and external. On the external side,
sources of risk include movement in oil prices and excessive increases
in food commodity prices. Moreover, the considerable lingering
uncertainties over recovery from the crisis in advanced economies
Graph 2.16.
Inflation Expectation when subsidized fuel price hike
��
��
��
��
��
�
���
���
���
���
���
���
���
��
���������������������������������������������������������������������
������ ������
������
���
����
������
���
����
������
���
����
������
���
����
������
���
����
������
���
����
������
���
����
������
���
����
������
���
����
���
����
���
���
���
��
������������������������������������������
Graph 2.17.
Current and Future Price of Wheat
��
��
��
�
�
�
�
���� ���� ���� ���� ���� ���� ���� ���� ����
��������
������
������
Graph 2.18.
Current and Future Price of CPO
����
����
����
���
���
���
���
���� ���� ���� ���� ���� ���� ���� ���� ����
��������������
������
������
Economic Outlook and Risk Ahead
13Monetary Policy Report - Quarter I-2011
are feared could bear down on demand for exported commodities.
At home, sharp increases in global commodity prices, led by oil, may
compel the Government to raise administered prices for strategic
goods including subsidised fuels and transport fares.
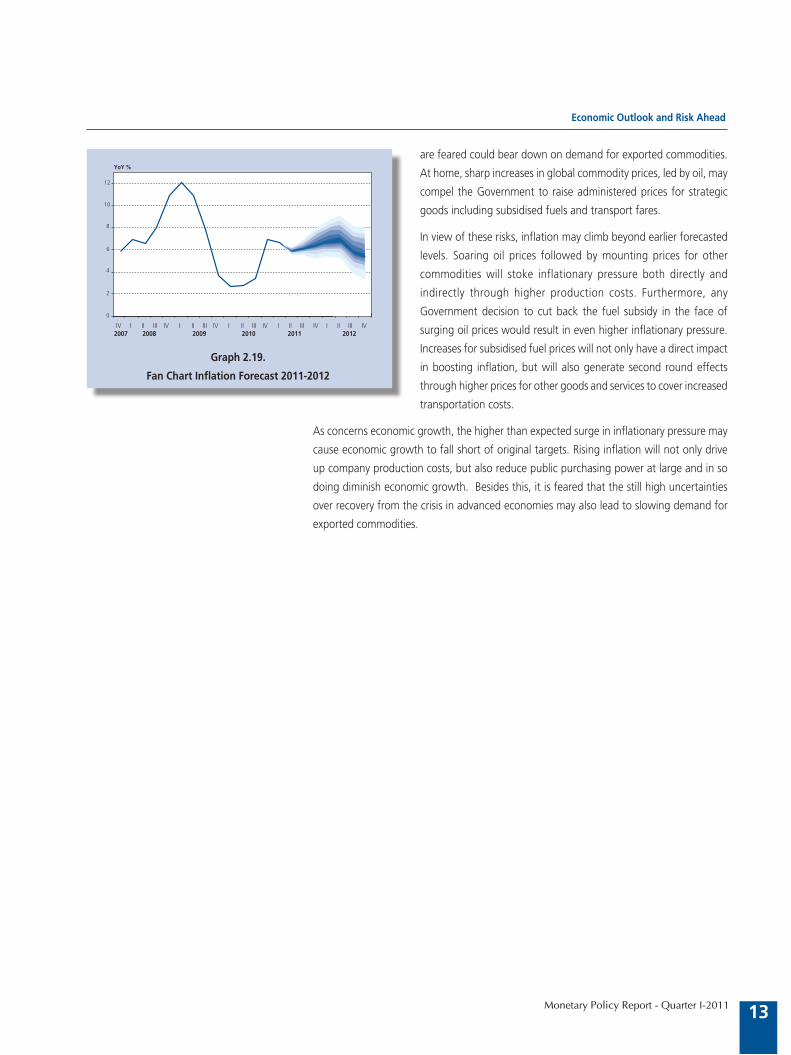
In view of these risks, inflation may climb beyond earlier forecasted
levels. Soaring oil prices followed by mounting prices for other
commodities will stoke inflationary pressure both directly and
indirectly through higher production costs. Furthermore, any
Government decision to cut back the fuel subsidy in the face of
surging oil prices would result in even higher inflationary pressure.
Increases for subsidised fuel prices will not only have a direct impact
in boosting inflation, but will also generate second round effects
through higher prices for other goods and services to cover increased
transportation costs.
As concerns economic growth, the higher than expected surge in inflationary pressure may
cause economic growth to fall short of original targets. Rising inflation will not only drive
up company production costs, but also reduce public purchasing power at large and in so
doing diminish economic growth. Besides this, it is feared that the still high uncertainties
over recovery from the crisis in advanced economies may also lead to slowing demand for
exported commodities.
Graph 2.19.
Fan Chart Inflation Forecast 2011-2012
�
�
�
�
�
��
��
�����
�� ��� ��� �� ��� ��� �� ��� ��� ������ ���� ���� ����
���� ������
�� ���� �� ������

Monetary Policy Report - Quarter I-2011
3. Latest Macroeconomic and Monetary Developments
The ongoing global economic recovery has also strengthened the performance of the domestic
economy. During Q1/2011, the more vibrant economic recovery in emerging market nations
was buoyed by solid domestic consumption and improving performance in externals. These
conditions have had a positive impact on economic developments in Indonesia. Indonesia’s
economic growth for Q1/2011 is forecasted at 6.4%, driven mainly by exports and rising
investment. Exports are forecasted to maintain brisk growth in line with improvement in the
global economy and support from rising commodity prices. This combination of domestic
and external demand kept import volume running high during Q1/2011. On the supply-side,
stronger growth is predicted in the economic sectors of construction and electricity, gas and
water utilities. Manufacturing is also expected to chart significant growth.
Upbeat performance of the domestic economy, improvement in risk indicators and continued
attractiveness of yields on rupiah instruments all contributed to exchange rate appreciation.
During Q1/2011, the rupiah exchange rate charted further gains. The robust GDP growth
outcome and strong performance in the balance of payments bolstered the exchange rate,
with the rupiah appreciating by an average of 0.8% to Rp 8,897 to the US dollar despite
greater volatility than in the preceding quarter. In regard to prices, inflationary pressure eased
in Q1/2011 compared to one quarter earlier. Measured annually, CPI inflation in Q1/2011
eased to 6.65% (yoy) from the Q4/2010 level of 6.96% (yoy), primarily from correction
in volatile foods. In contrast, pressure from fundamentals, visible in core inflation, began
escalating in response to strengthening demand.
Monetary policy transmission showed mainly on the financial market, while transmission
through the banking sector was not yet evident due to the effect of monetary policy lag.
Short-term interest rates, reflected in the rates on the interbank market, remained at
conducive levels as indicated by stable movement in the overnight rate at about the BI Rate
level during Q1/2011. However, monetary policy lag was visible in the ongoing downward
movement in deposit and lending rates some time after the BI Rate increase. Monetary policy
transmission in the credit channel was marked by a rise in credit expansion to 25.1% (yoy), up
from the level reached one month before at 22.1% (yoy). Similarly, positive monetary policy
transmission was also observed on the capital market and markets for government securities
and mutual funds. On the stock market, Indonesia’s composite index - the JCI - mounted
steadily to a level of 3,678. Yields on the government securities market widened early in the
period under review, but eased again following the increase in the BI Rate. Performance of
mutual funds was also up from the preceding quarter.
Latest Macroeconomic and Monetary Developments
14
Monetary Policy Report - Quarter I-2011
DEVELOPMENTS IN THE WORLD ECONOMY
Global economic recovery is predicted to carry forward on momentum generated by
emerging markets. Signs of this were visible in the higher than expected growth in 2010
that has contributed to more optimistic forecasts for growth for 2011. This is also consistent
with the upward revision in the 2011 growth projections by some international institutions.
The combination of ongoing recovery in the global economy with negative sentiment from
the geopolitical crisis in the Middle East and North Africa (MENA) and the natural disaster
in Japan has sent world commodity prices soaring with oil trading at over 100 US dollars
per barrel. The effect of this will be to stoke global inflationary pressure, with impact felt
in both emerging markets and advanced economies. As regards policy stance, emerging
markets have introduced further monetary tightening with interest rate increases, tighter
liquidity management and tolerance of currency appreciation. However, monetary policy in
advanced economies has maintained an accommodative stance although some countries and
also the European Central Bank (ECB) have begun raising their policy rates. Looking forward,
world economic growth faces various risks from the impact of the disaster in Japan, political
crisis in the MENA region, mounting world commodity prices, the debt and fiscal crisis in
the PIIGS nations and the global monetary policy response. On financial markets worldwide,
growth has been constrained by negative sentiment from the MENA geopolitical crisis and
the disaster in Japan. Besides this, the bearish condition of global financial markets has come
in response to monetary tightening in China and mounting tensions in the deft and fiscal
deficit crises in Europe. Global markets remain awash with liquidity, despite some liquidity
tightening in some nations including China, Europe and Japan.
US economic growth is again estimated in positive territory for Q1/2011, buoyed
by the industry sector. Confirmation of the solid gains in industry came from industry
indicators such as the Purchasing Manager Index, which remains on an upward trend. US
industrial growth in Q1/2011 is estimated at 5.3% (yoy), consistent with the strength of
external demand. Household consumption is predicted to remain stable, as indicated by
retail sales and household income and expenditure indicators moving into positive territory.
Despite this, household consumption remains daunted by high unemployment in the US,
recorded at 8.8%.
Sustained positive growth is also estimated for Eurozone economies in Q1/2011.
Positive economic growth in Europe was supported by economic expansion in Germany and
France with growth during the quarter running at 4.1% (yoy) and 1.7% (yoy). However, the
ability of Portugal, Ireland, Italy, Spain and Greece (the PIIGS nations) to promote economic
growth was constrained by the impact of fiscal tightening. From an overall perspective,
manufacturing remains the backbone of the European economy as nations respond to rising
external demand. Household consumption has maintained moderate growth, reflected in the
limited improvement in consumer confidence against the background of Europe’s persistently
high unemployment at 10%.
Asian economies are predicted to keep growing although at a more moderate
pace in line with the monetary tightening trend in Asia. Even so, still vibrant levels of
domestic demand and accommodative fiscal policies mean that Asian economies are set
Latest Macroeconomic and Monetary Developments
15
Monetary Policy Report - Quarter I-2011
to maintain expansion. Exports, the primary engine of growth in many Asian economies,
will return to normal in line with more modest economic expansion in China, the major
destination for exports from Asian countries. The moderation in China’s economic growth
will result from monetary tightening policies introduced by the nation’s authorities to curb
signs of overheating. Asian economies as a whole will keep forging ahead with expansion
despite the threat of rising inflationary pressure.
Commodity prices maintained upward movement during Q1/2011. According to
IMF projections as of February 2011, the commodity price index is on an ascending trend.
In monthly figures, the IMF commodity price index in January and February mounted by
6.6% and 4.4%. The rise in the index during February in particular was driven by increases
in fuel commodities and especially the price of oil. Oil prices have surged on fears of supply
disruptions triggered by escalating tensions in Egypt and Tunisia, which adds to the effect
on prices from the ongoing process of global economic recovery. Measured against the
preceding year, the commodity price index in January and February reported gains of
27.6% (yoy) and 26.0% (yoy). This surge in commodity prices also contributed in higher
world inflation during Q1/2011. Composite data on inflation outcomes in various countries
points to mounting global inflationary pressure in February 2011 compared to the previous
quarter. Inflation mounted to 3.7% (yoy) after being recorded at 3.3% (yoy) in Q4/2010
due to escalating world commodity prices.
Central banks in advanced economies continue to lean towards accommodative
monetary policy with renewed quantitative easing measures to boost their
economies. During Q1/2011, leading central banks, including the Fed, BoJ and ECB,
maintained low policy rates in a drive to promote domestic economic recovery. The Fed
held its policy rate in the 0%-0.25% range against a background of stubbornly high
unemployment and predictions of continued low inflation. The ECB followed suit by leaving
its rate unchanged at 1.0% to create a conducive climate for resolution of the European fiscal
crisis. Meanwhile, the BoJ responded the impact of the disaster in Japan that had triggered
bank liquidity shortages by injecting liquidity into the banking system. The Reserve Bank of
New Zealand lowered its policy rate by 50 bps to 2.50% in an effort to stimulate economic
recovery in the area struck by an earthquake in February 2011. In contrast, the Swedish
Riksbank opted for a different course through a policy of monetary tightening by raising its
policy rate to 1.50% in response to mounting inflationary pressure.
On the other hand, central banks in emerging markets are tightening monetary
policy through increases in interest rates in tandem with liquidity management
and macroprudential policies in the financial system. Some central banks in emerging
markets (Asia and Latin America) have embarked on monetary tightening to cope with
mounting inflationary pressure in these regions. Asian central banks announcing rate
increases included China (+25 bps), Philippines (+25 bps), India (+50 bps), Korea (+50 bps)
and Thailand (+50 bps). In Latin America, interest rates were raised by central banks in Brazil
(+100 bps), Chile (+75 bps), Colombia (+50 bps) and Peru (+75 bps). In addition to raising
interest rates, some central banks in emerging market economies also instituted non-interest
rate policies during Q1/2011. Monetary authorities in Singapore, Hong Kong and Taiwan
Latest Macroeconomic and Monetary Developments
16

Monetary Policy Report - Quarter I-2011
employed currency appreciation as a means to curb inflation. The central bank of Vietnam
raised its refinance rate and discount rate to 12%, while the policy rate remained unchanged.
Malaysia pursued similar action when the nation’s central bank raised the statutory reserve
requirement ratio to 2% without any change in the policy rate. The People’s Bank of China
also announced an increase in the reserve requirement for major banks to 20%, effective
from 25 March 2011.
The brisk advancement on global financial market abruptly slowed due to negative
geopolitical sentiment from the MENA region and natural disaster that hit Japan.
Global financial markets plunged significantly in response to mounting geopolitical turmoil
in the MENA region, despite the release of economic data pointing to further recovery in the
world economy. The disaster in Japan put even greater pressure on global financial markets
and disrupted activity in the nation’s economy. The bearish condition of global financial
markets is also explained by the fallout from the debt and fiscal deficit crises in Europe
after decisions by the Moody’s and Fitch rating agencies to downgrade credit ratings for
Greece, Spain and Portugal. This has prompted investors to switch to risk averse behaviour
by shunning higher-risk assets, including those in emerging market economies. Meanwhile,
the flush condition of global liquidity is predicted to continue. The accommodate interest
rate policies adopted under the quantitative easing by central banks in advanced economies
have created the present conditions of flush liquidity. However, indications of a liquidity
crunch are emerging in some nations, including Europe, China and Japan, as reflected in
higher rate quotations on the interbank market (LIBOR).
ECONOMIC GROWTH
Aggregate Demand
Indonesia’s economic growth is forecasted for Q1/2011 at 6.4%, bolstered mainly
by exports and investment (Table 3.1). Investment is predicted to accelerate further on
momentum from positive developments in infrastructure projects, appreciation in the rupiah,
regulatory improvements and performance of the capital market. Household consumption is
also forecasted to rise in keeping with strengthening purchasing power and buoyant levels
I t e m
Table 3.1
Economic Growth – Demand Side
* Bank Indonesia Projection
Private Consumption 4.9 3.9 5.0 5.2 4.4 4.6 4.8
Government Consumption 15.7 (-7.6) (-7.3) 4.8 7.3 0.3 5.4
Gross Fixed Capital Formation 3.3 8.0 8.0 9.2 8.7 8.5 9.2
Exports of Goods and Services -9.7 20.0 14.6 9.6 16.1 14.9 11.0
Imports of Goods and Services -15.0 22.6 18.4 12.2 16.9 17.3 10.9
GDP 4.6 5.6 6.1 5.8 6.9 6.1 6.4
20092010
I III III IV2010
2011*
%Y-o-Y, 2000 Price
Latest Macroeconomic and Monetary Developments
17
Monetary Policy Report - Quarter I-2011
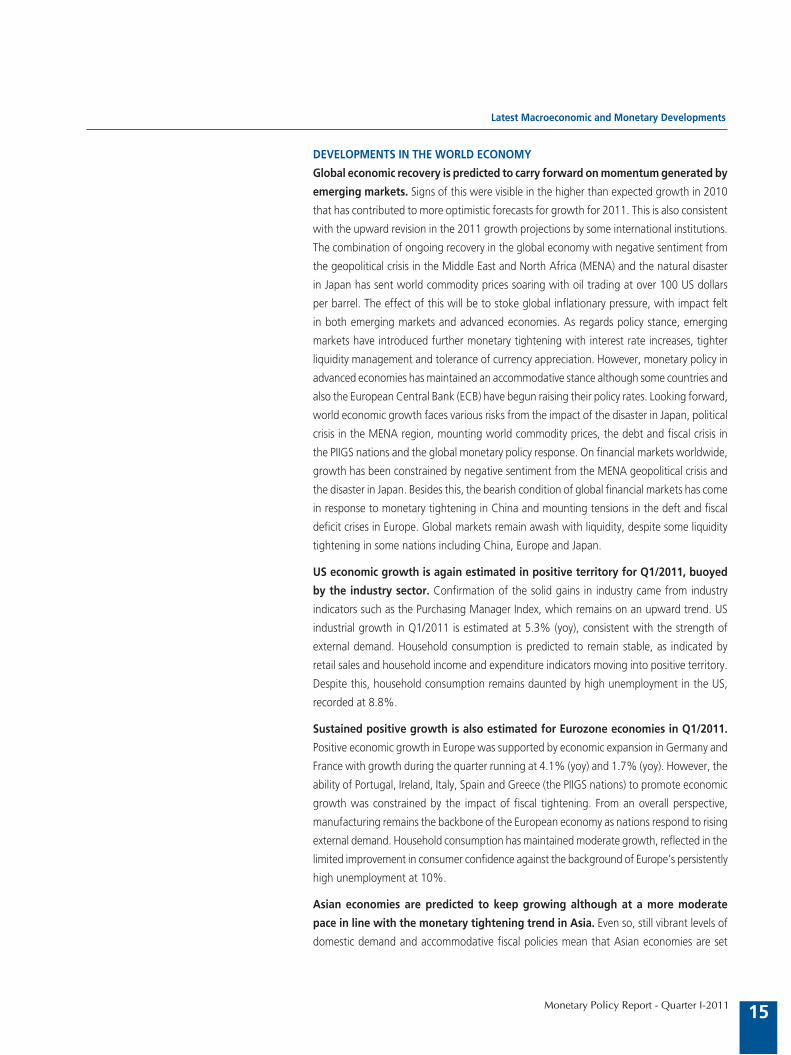
of consumer confidence. growth during Q1/2011 is estimated below
that of exports, but a renewed surge is expected in the following
quarter in line with growth in consumption and non-construction
investment.
Estimated growth in household consumption during Q1/2011
was up from the preceding quarter. Increased growth was
bolstered by an upswing in consumer confidence, sustained
expectations of rupiah appreciation in line with the policy for
exchange rate appreciation and more robust purchasing power
among civil servants from higher remuneration levels linked to
administrative reforms. The Consumer Confidence Index in the March
2011 BI Consumer Survey indicates strengthened optimism buoyed by
more robust expectations for the economy 6 months forward, while
optimism over current economic conditions remains comparatively
stable (Graph 3.1). Increased consumer confidence in future economic
conditions was also supported by expectations of higher incomes six
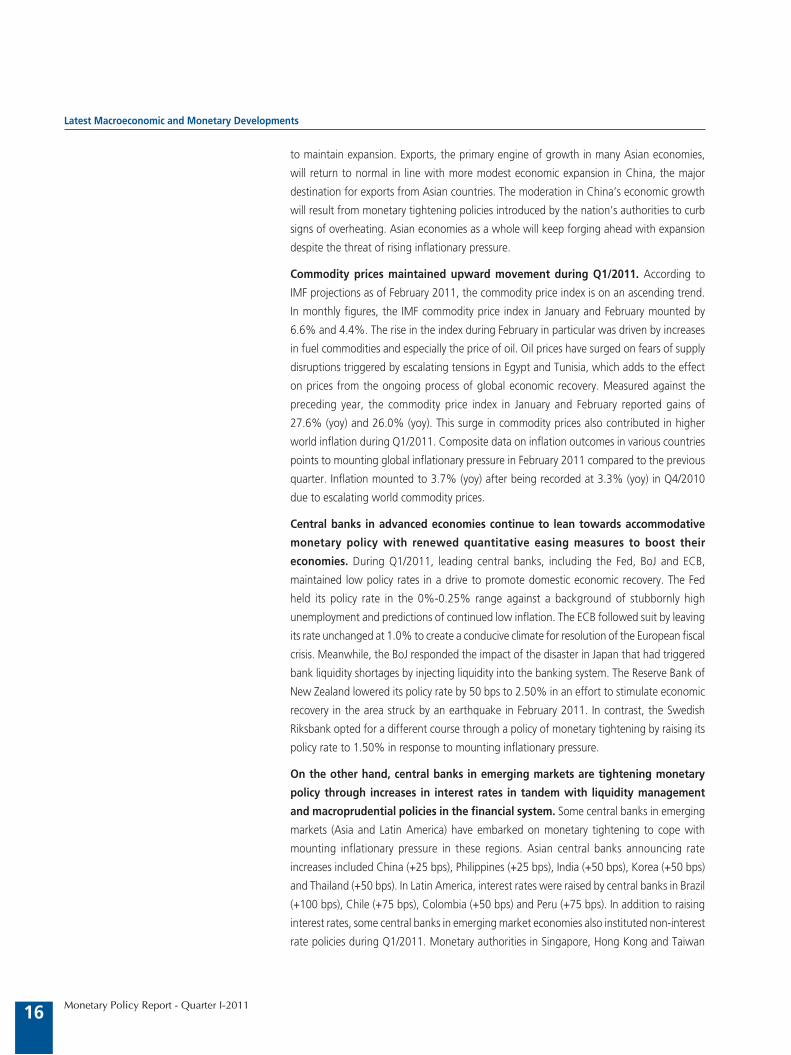
months forward among all household categories. On the regulatory
side, the lowering of import duties on motor vehicles is expected to
boost automotive sales. Non-food consumption remained at high
levels in early Q1/2011 as indicated by strong car and motorcycle
sales despite some slowing (Graph 3.2). In January-March 2011,
growth in car and motorcycle sales reached 29.5% (yoy) and 16.2%
(yoy).1 In other developments, the retail sales index notched a very
thin increase from 19.7% (yoy) in the preceding quarter to 19.9%
(yoy) in January-February 2011 (average).
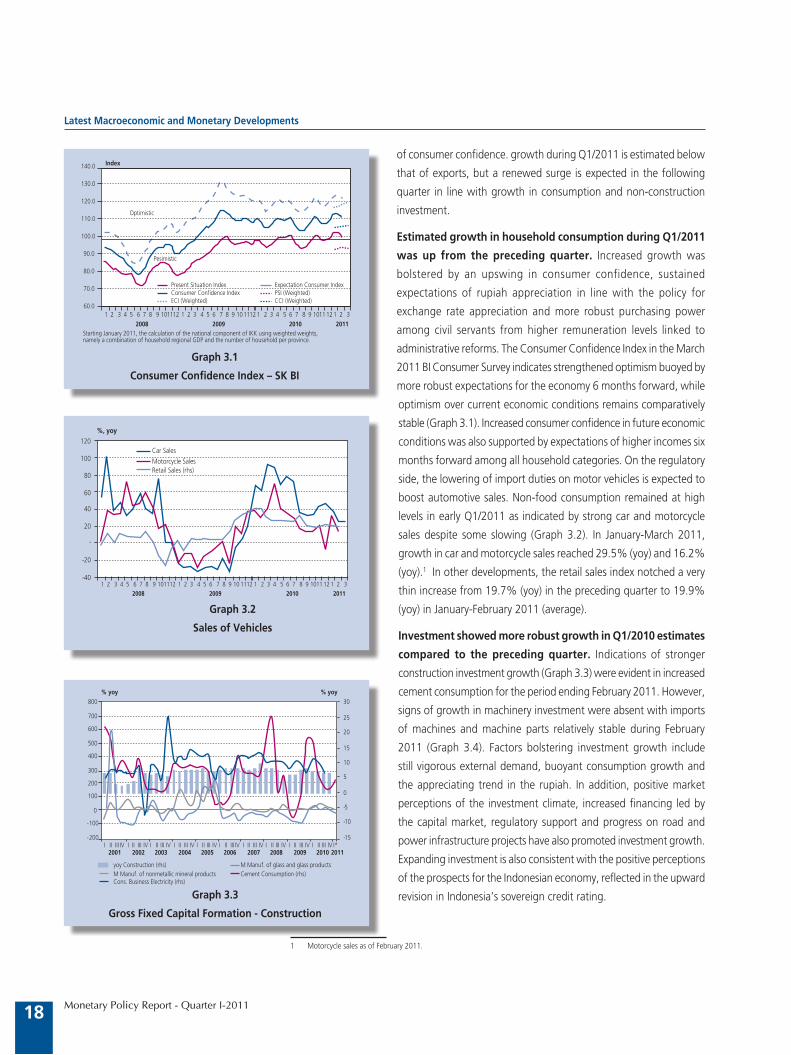
Investment showed more robust growth in Q1/2010 estimates
compared to the preceding quarter. Indications of stronger
construction investment growth (Graph 3.3) were evident in increased
cement consumption for the period ending February 2011. However,
signs of growth in machinery investment were absent with imports
of machines and machine parts relatively stable during February
2011 (Graph 3.4). Factors bolstering investment growth include
still vigorous external demand, buoyant consumption growth and
the appreciating trend in the rupiah. In addition, positive market
perceptions of the investment climate, increased financing led by
the capital market, regulatory support and progress on road and
power infrastructure projects have also promoted investment growth.
Expanding investment is also consistent with the positive perceptions
of the prospects for the Indonesian economy, reflected in the upward
revision in Indonesia’s sovereign credit rating.
1 Motorcycle sales as of February 2011.
Graph 3.1
Consumer Confidence Index – SK BI
Graph 3.2
Sales of Vehicles
����
����
����
����
�����
�����
�����
�����
����� �����
����������������������� ��������������������������������������������������� ���������������������������� ��������������
����������
����������
� � � � � � � � � ������ � � � � � � � � � ������� � � � � � � � � ������� � ����� ���� ���� ����
���������������������������������������������������������������������������������������������������������������������������������������������������������������������������������������
� � � � � � � � � ������ � � � � � � � � � �� ���� � � � � � � � � � ���� �� � � ����� ���� ���� ����
���
���
��
��
��
��
�
���
���
�������������������������������������������
������
Graph 3.3
Gross Fixed Capital Formation - Construction
���
���
��
�
�
��
��
��
��
��
����
����
�
���
���
���
���
���
���
���
���
���������������������� ���������������������������������������������������������������������������� ��������������������������������������������������������
����� �����
� �� ��� �� � �� ��� �� � �� ��� �� � �� ��� �� � �� ��� �� � �� ��� �� � �� ��� �� � �� ��� �� � �� ��� �� � �� ��� �� ������ ���� ���� ���� ���� ���� ���� ���� ���� ���� ����
Latest Macroeconomic and Monetary Developments
18
Monetary Policy Report - Quarter I-2011
Graph 3.6
Total Export, Oil&Gas and Non Oil&Gas Export (Real Value)
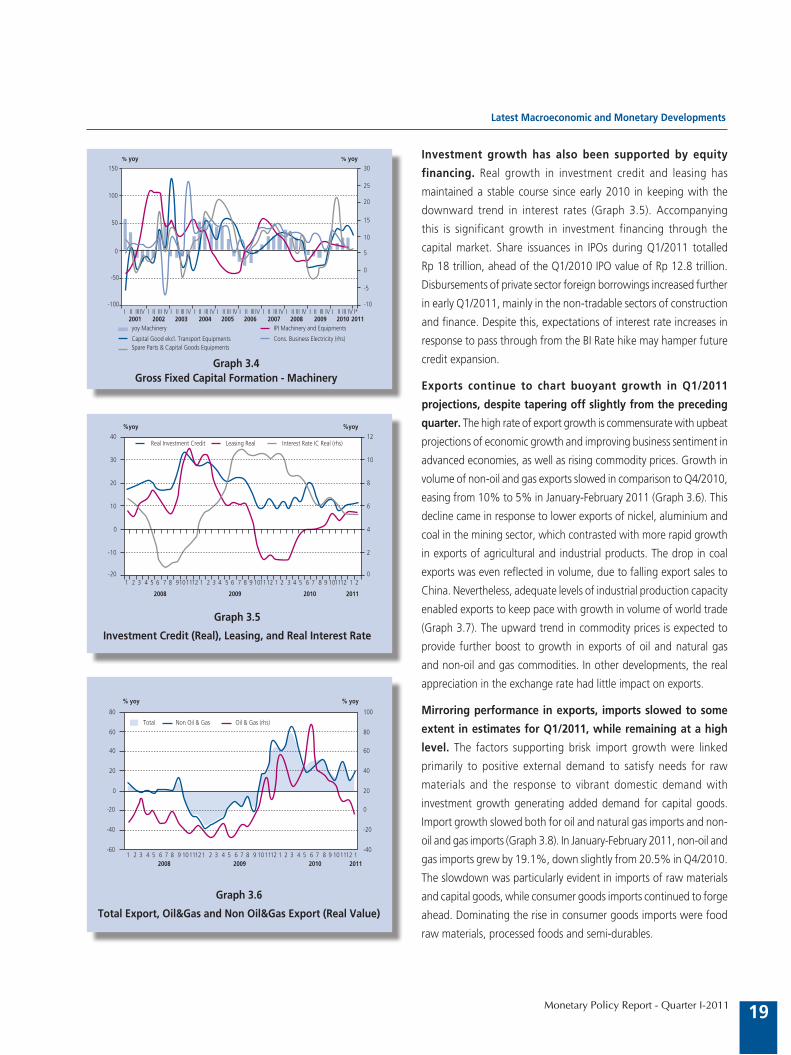
Investment growth has also been supported by equity
financing. Real growth in investment credit and leasing has
maintained a stable course since early 2010 in keeping with the
downward trend in interest rates (Graph 3.5). Accompanying
this is significant growth in investment financing through the
capital market. Share issuances in IPOs during Q1/2011 totalled
Rp 18 trillion, ahead of the Q1/2010 IPO value of Rp 12.8 trillion.
Disbursements of private sector foreign borrowings increased further
in early Q1/2011, mainly in the non-tradable sectors of construction
and finance. Despite this, expectations of interest rate increases in
response to pass through from the BI Rate hike may hamper future
credit expansion.
Exports continue to chart buoyant growth in Q1/2011
projections, despite tapering off slightly from the preceding
quarter. The high rate of export growth is commensurate with upbeat
projections of economic growth and improving business sentiment in
advanced economies, as well as rising commodity prices. Growth in
volume of non-oil and gas exports slowed in comparison to Q4/2010,
easing from 10% to 5% in January-February 2011 (Graph 3.6). This
decline came in response to lower exports of nickel, aluminium and
coal in the mining sector, which contrasted with more rapid growth
in exports of agricultural and industrial products. The drop in coal
exports was even reflected in volume, due to falling export sales to
China. Nevertheless, adequate levels of industrial production capacity
enabled exports to keep pace with growth in volume of world trade
(Graph 3.7). The upward trend in commodity prices is expected to
provide further boost to growth in exports of oil and natural gas
and non-oil and gas commodities. In other developments, the real
appreciation in the exchange rate had little impact on exports.
Mirroring performance in exports, imports slowed to some
extent in estimates for Q1/2011, while remaining at a high
level. The factors supporting brisk import growth were linked
primarily to positive external demand to satisfy needs for raw
materials and the response to vibrant domestic demand with
investment growth generating added demand for capital goods.
Import growth slowed both for oil and natural gas imports and non-
oil and gas imports (Graph 3.8). In January-February 2011, non-oil and
gas imports grew by 19.1%, down slightly from 20.5% in Q4/2010.
The slowdown was particularly evident in imports of raw materials
and capital goods, while consumer goods imports continued to forge
ahead. Dominating the rise in consumer goods imports were food
raw materials, processed foods and semi-durables.
Graph 3.4Gross Fixed Capital Formation - Machinery
Graph 3.5
Investment Credit (Real), Leasing, and Real Interest Rate
���
��
�
�
��
��
��
��
��
����
���
�
��
���
�������� �����
� �� ��� �� � �� ��� �� � �� ��� �� � �� ��� �� � �� ��� �� � �� ��� �� � �� ��� �� � �� ��� �� � �� ��� �� � �� ��� �� ������ ���� ���� ���� ���� ���� ���� ���� ���� ���� ����������������� ����������������������������
����������������������������������������������������������������������������� ��������������������������������
�
�
�
�
�
��
��
���
���
�
��
��
��
��
� � � � � � � � ������� � � � � � � � � � ������ � � � � � � � � � ������ � �
���� ���� ���� ����
���������������������� ������������ ���������������������������
���� ����
���
���
�
��
��
��
��
���
���
���
���
�
��
��
��
��
� � � � � � � � � ������� � � � � � � � � ������ � � � � � � � � � ������ ����� ���� ���� ����
����� ������������� ���������������
����� �����
Latest Macroeconomic and Monetary Developments
19

Monetary Policy Report - Quarter I-2011
Government Financial Operations
In the outcome for February 2011, the national budget posted
a surplus at 0.3% of GDP. This outcome was commensurate with
the 0.2% surplus for the same period one year earlier, despite a
significant nominal increase. Performance is up in state revenues
alongside relatively stable absorption of expenditures at the central
and regional levels. In financing the budget deficit, issuances of
Indonesian government securities during Q1/2011 surpassed target
with yield in decline from the beginning of the year. An important
factor in this achievement was keen investor interest, visible in the high
bid to target ratio. With receipts exceeding expenditures, Government
financial operations had a contractionary effect during Q1/2011.
Realised revenues came to 11.8% of the target in the 2011
State Budget, up from equivalent revenues in 2010 at only
10.9% of the Revised State Budget target. Revenue growth was
supported by performance in both tax and non-tax sectors. Regarding
taxation, the leading areas of revenue growth were import duties
and export taxes. Actual revenues on export taxes in fact surpassed
the budget target as a result of mounting crude palm oil (CPO) prices
on the international market. However, non-oil and gas income taxes
and VAT, the two largest contributors of taxation revenues, were
comparatively stable. In the non-tax sector, non-oil and gas resources
provided the main source of revenue growth.
Realised absorption of state expenditures in February 2011
stood at only 9.0% of the target in the Revised State Budget,
relatively unchanged from 8.7% one year earlier. Expenditures
have so far been channelled mainly into recurrent and operational
spending, such as personnel expenditures, debt interest payments
and transfers to regions. Meanwhile only modest levels were recorded
for the non-recurrent expenditures of procurement and capital expenditures, in keeping with
historical trends. Expenditure outcomes in both categories were down from levels reached
in the previous year, with realised levels at only 2.5% and 1.4% of targeted expenditures
in the state budget.
Aggregate Supply
In projections for Q1/2011, business sector performance was bolstered by improved
performance in the manufacturing sector. The brisk pace of manufacturing growth
was commensurate with sustained vigorous external and domestic demand. However, only
limited growth is estimated for the agricultural sector due to widely varying harvest levels
in 2011. The mining sector also saw only modest growth. In other developments, robust
performance in the transport and communications sector was driven by brisk growth in air
transportation, part of the transportation subsector.
Graph 3.7
WTV and Export
Graph 3.8
Total Import, Oil&Gas and Non Oil&Gas Import (Real Value)
���
���
���
���
��
�
�
��
��
��
��
���
���
���
���
��
�
�
��
��
��
��
� � � � � � � � � ������ � � � � � � � � � �� ���� � � � � � � � � � ������ ����� ���� ���� ����
������ ���������
����� �����
����
���
�
��
���
���
���
���
���
���
�
��
��
��
���
� � � � � � � � � ������� � � � � � � � � ������ � � � � � � � � � ������ ����� ���� ���� ����
����� ������������� ���������������
����� �����
��
Latest Macroeconomic and Monetary Developments
20
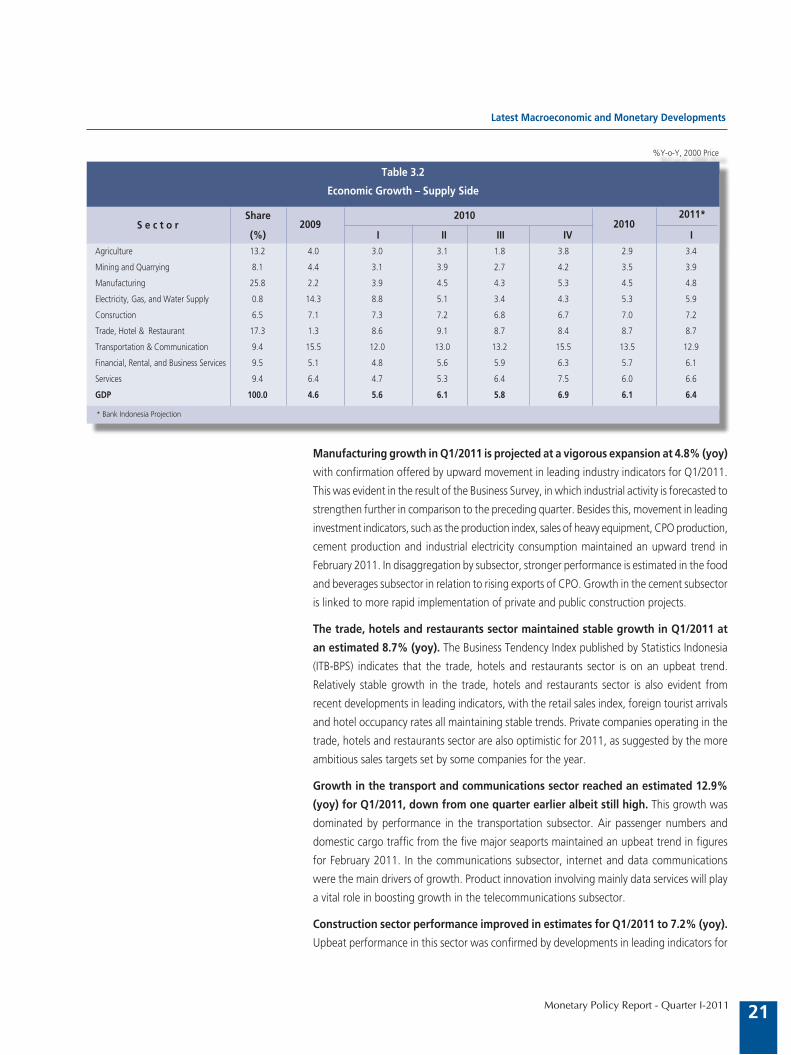
Monetary Policy Report - Quarter I-2011
Manufacturing growth in Q1/2011 is projected at a vigorous expansion at 4.8% (yoy)
with confirmation offered by upward movement in leading industry indicators for Q1/2011.
This was evident in the result of the Business Survey, in which industrial activity is forecasted to
strengthen further in comparison to the preceding quarter. Besides this, movement in leading
investment indicators, such as the production index, sales of heavy equipment, CPO production,
cement production and industrial electricity consumption maintained an upward trend in
February 2011. In disaggregation by subsector, stronger performance is estimated in the food
and beverages subsector in relation to rising exports of CPO. Growth in the cement subsector
is linked to more rapid implementation of private and public construction projects.
The trade, hotels and restaurants sector maintained stable growth in Q1/2011 at
an estimated 8.7% (yoy). The Business Tendency Index published by Statistics Indonesia
(ITB-BPS) indicates that the trade, hotels and restaurants sector is on an upbeat trend.
Relatively stable growth in the trade, hotels and restaurants sector is also evident from
recent developments in leading indicators, with the retail sales index, foreign tourist arrivals
and hotel occupancy rates all maintaining stable trends. Private companies operating in the
trade, hotels and restaurants sector are also optimistic for 2011, as suggested by the more
ambitious sales targets set by some companies for the year.
Growth in the transport and communications sector reached an estimated 12.9%
(yoy) for Q1/2011, down from one quarter earlier albeit still high. This growth was
dominated by performance in the transportation subsector. Air passenger numbers and
domestic cargo traffic from the five major seaports maintained an upbeat trend in figures
for February 2011. In the communications subsector, internet and data communications
were the main drivers of growth. Product innovation involving mainly data services will play
a vital role in boosting growth in the telecommunications subsector.
Construction sector performance improved in estimates for Q1/2011 to 7.2% (yoy).
Upbeat performance in this sector was confirmed by developments in leading indicators for
S e c t o r
Table 3.2
Economic Growth – Supply Side
* Bank Indonesia Projection
Agriculture 13.2 4.0 3.0 3.1 1.8 3.8 2.9 3.4
Mining and Quarrying 8.1 4.4 3.1 3.9 2.7 4.2 3.5 3.9
Manufacturing 25.8 2.2 3.9 4.5 4.3 5.3 4.5 4.8
Electricity, Gas, and Water Supply 0.8 14.3 8.8 5.1 3.4 4.3 5.3 5.9
Consruction 6.5 7.1 7.3 7.2 6.8 6.7 7.0 7.2
Trade, Hotel & Restaurant 17.3 1.3 8.6 9.1 8.7 8.4 8.7 8.7
Transportation & Communication 9.4 15.5 12.0 13.0 13.2 15.5 13.5 12.9
Financial, Rental, and Business Services 9.5 5.1 4.8 5.6 5.9 6.3 5.7 6.1
Services 9.4 6.4 4.7 5.3 6.4 7.5 6.0 6.6
GDP 100.0 4.6 5.6 6.1 5.8 6.9 6.1 6.4
2009Share
(%)
2010
I II III IV I2010
2011*
%Y-o-Y, 2000 Price
Latest Macroeconomic and Monetary Developments
21
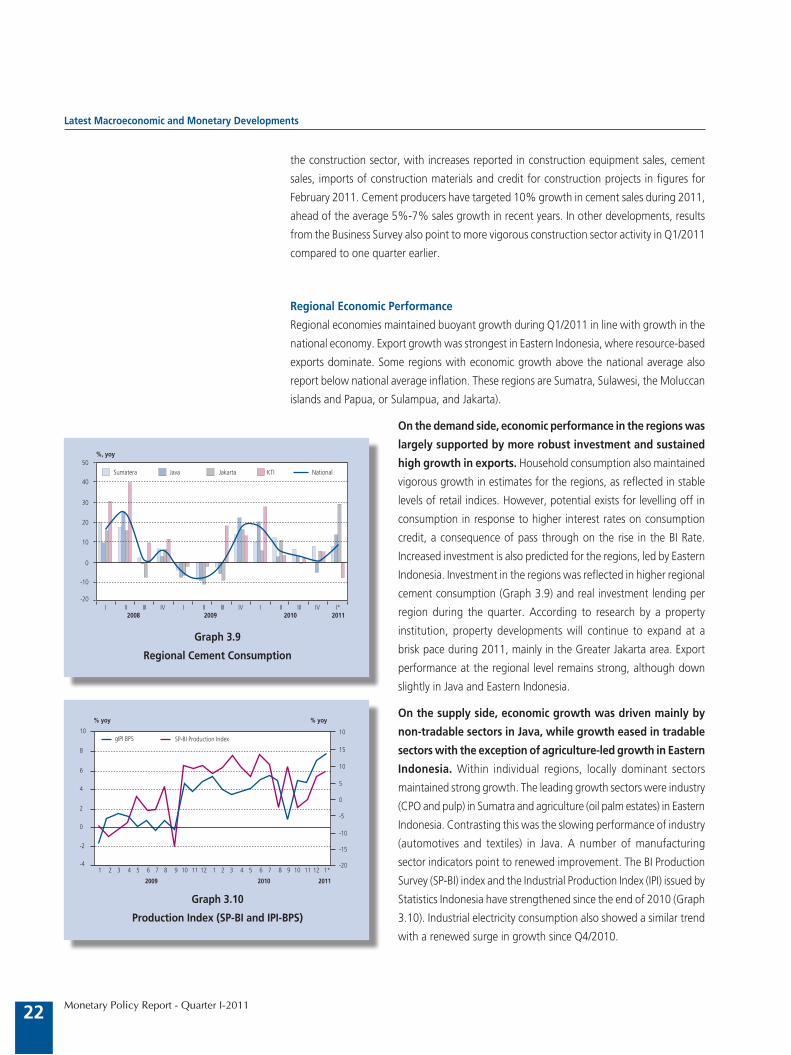
Monetary Policy Report - Quarter I-2011
the construction sector, with increases reported in construction equipment sales, cement
sales, imports of construction materials and credit for construction projects in figures for
February 2011. Cement producers have targeted 10% growth in cement sales during 2011,
ahead of the average 5%-7% sales growth in recent years. In other developments, results
from the Business Survey also point to more vigorous construction sector activity in Q1/2011
compared to one quarter earlier.
Regional Economic Performance
Regional economies maintained buoyant growth during Q1/2011 in line with growth in the
national economy. Export growth was strongest in Eastern Indonesia, where resource-based
exports dominate. Some regions with economic growth above the national average also
report below national average inflation. These regions are Sumatra, Sulawesi, the Moluccan
islands and Papua, or Sulampua, and Jakarta).
On the demand side, economic performance in the regions was
largely supported by more robust investment and sustained
high growth in exports. Household consumption also maintained
vigorous growth in estimates for the regions, as reflected in stable
levels of retail indices. However, potential exists for levelling off in
consumption in response to higher interest rates on consumption
credit, a consequence of pass through on the rise in the BI Rate.
Increased investment is also predicted for the regions, led by Eastern
Indonesia. Investment in the regions was reflected in higher regional
cement consumption (Graph 3.9) and real investment lending per
region during the quarter. According to research by a property
institution, property developments will continue to expand at a
brisk pace during 2011, mainly in the Greater Jakarta area. Export
performance at the regional level remains strong, although down
slightly in Java and Eastern Indonesia.
On the supply side, economic growth was driven mainly by
non-tradable sectors in Java, while growth eased in tradable
sectors with the exception of agriculture-led growth in Eastern
Indonesia. Within individual regions, locally dominant sectors
maintained strong growth. The leading growth sectors were industry
(CPO and pulp) in Sumatra and agriculture (oil palm estates) in Eastern
Indonesia. Contrasting this was the slowing performance of industry
(automotives and textiles) in Java. A number of manufacturing
sector indicators point to renewed improvement. The BI Production
Survey (SP-BI) index and the Industrial Production Index (IPI) issued by
Statistics Indonesia have strengthened since the end of 2010 (Graph
3.10). Industrial electricity consumption also showed a similar trend
with a renewed surge in growth since Q4/2010.
Graph 3.9
Regional Cement Consumption
��
��
��
��
��
�
���
���
������
� �� ��� �� � �� ��� �� � �� ��� �� ������ ���� ���� ����
�������� ���� ������� ��� ��������
Graph 3.10
Production Index (SP-BI and IPI-BPS)
��
�����
�
�
�
�
�
��
��
��
�����
��
��
�
�
��
���
���
���� � � � � � � � � �� �� �� � � � � � � � � � �� �� �� ��
���� ���� ����
�������� ����������������������
Latest Macroeconomic and Monetary Developments
22

Monetary Policy Report - Quarter I-2011
BALANCE OF PAYMENTS (BOP)
Indonesia’s balance of payments maintained solid performance
in estimates for Q1/2011, buoyed by strong external demand,
high commodity prices and assured perceptions among foreign
investors. In estimates for Q1/2011, the current account posted
yet another surplus driven by performance in the trade balance
and services balance. The capital and financial also charted an
estimated surplus in line with the massive inflows of foreign capital
invested in rupiah financial instruments. As a result, international
reserves mounted to 105.7 billion US dollars at the end of March
2011, equivalent to 6.3 months of imports and servicing of official
external debt.
The current account is again set to book a Q1/2011 surplus
in line with strengthening economic growth. The strength of
demand for exports even with vigorous import demand resulted
in another trade surplus. So far, high oil prices have not produced
significant performance gains in the oil and natural gas sector, due
to the impact of rising oil imports and indications of decline in daily
oil lifting.
The ongoing recovery in the world economy bolstered
export performance in Q1/2011. Data for January-February
2011 indicates that non-oil and gas exports continued to forge
ahead albeit with slowing growth. Exports of resource-based
commodities retained their dominant position, advancing more
rapidly than exports of non-resource-based commodities. Also
driving this growth were sustained high commodity prices,
particularly for mining and agricultural products. In analysis by
export destination, exports to advanced economies such as the US
and Japan maintained positive expansion. The steady improvement
in the US economy has also strengthened US demand for exported
products. However, exports to Japan could suffer in line with fears
of an economic slowdown in the wake of the recent disaster that
struck that country.
Imports, however, are set to maintain high growth as the domestic
economy gathers momentum amid stable exchange rate movement
marked by an appreciating trend. Even so, there has been some
moderating in the rate of import growth. During January-February
2011, import growth was dominated by consumer goods and raw
materials. So far, there is good reason to believe that the high volume
of imports is supporting domestic manufacturing activity. At the same
time, the lower estimated services deficit contributed to the more
robust performance in the current account. Construction services
Graph 3.11
Average Rupiah Exchange Rate
Graph 3.12
Rupiah Exchange Rate Volatility
����
����
����
����
����
����
����
����
����
�������
�����
�����
�����
�����
����
����
�����
�����
�����
�����
�����
����
����
�����
�����
�����
�����
����
����
����
�����
�����
�����
�����
�����
�����
�����
�����
�����
�����
�����
�����
�������������������
������������������
����������������������
������
������ ������������ ������ ������ ������
�
�
�
�
�
�
�
�
�
�
�
�����
�����
������ ������
Graph 3.13
Risk Perception Indicators
���
���
���
���
���
���
���
���
���
���
���
�
����������� �����������
���
���
���
���
���
���
���
���
���
������������
�������������
������������������
��� ��� ��� ��� ��� ��� ��� ��� ��� ��� ��� ��� ��� ��� ������� ����
Latest Macroeconomic and Monetary Developments
23
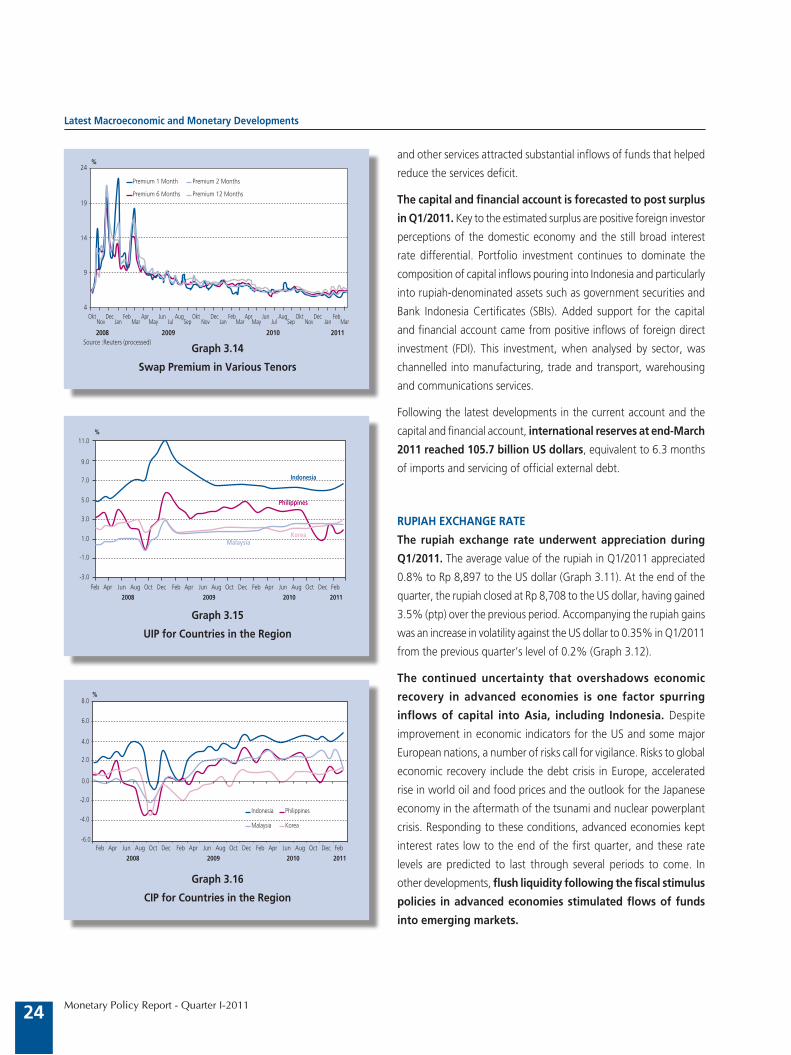
Monetary Policy Report - Quarter I-2011
and other services attracted substantial inflows of funds that helped
reduce the services deficit.
The capital and financial account is forecasted to post surplus
in Q1/2011. Key to the estimated surplus are positive foreign investor
perceptions of the domestic economy and the still broad interest
rate differential. Portfolio investment continues to dominate the
composition of capital inflows pouring into Indonesia and particularly
into rupiah-denominated assets such as government securities and
Bank Indonesia Certificates (SBIs). Added support for the capital
and financial account came from positive inflows of foreign direct
investment (FDI). This investment, when analysed by sector, was
channelled into manufacturing, trade and transport, warehousing
and communications services.
Following the latest developments in the current account and the
capital and financial account, international reserves at end-March
2011 reached 105.7 billion US dollars, equivalent to 6.3 months
of imports and servicing of official external debt.
RUPIAH EXCHANGE RATE
The rupiah exchange rate underwent appreciation during
Q1/2011. The average value of the rupiah in Q1/2011 appreciated
0.8% to Rp 8,897 to the US dollar (Graph 3.11). At the end of the
quarter, the rupiah closed at Rp 8,708 to the US dollar, having gained
3.5% (ptp) over the previous period. Accompanying the rupiah gains
was an increase in volatility against the US dollar to 0.35% in Q1/2011
from the previous quarter’s level of 0.2% (Graph 3.12).
The continued uncertainty that overshadows economic
recovery in advanced economies is one factor spurring
inflows of capital into Asia, including Indonesia. Despite
improvement in economic indicators for the US and some major
European nations, a number of risks call for vigilance. Risks to global
economic recovery include the debt crisis in Europe, accelerated
rise in world oil and food prices and the outlook for the Japanese
economy in the aftermath of the tsunami and nuclear powerplant
crisis. Responding to these conditions, advanced economies kept
interest rates low to the end of the first quarter, and these rate
levels are predicted to last through several periods to come. In
other developments, flush liquidity following the fiscal stimulus
policies in advanced economies stimulated flows of funds
into emerging markets.
Graph 3.14
Swap Premium in Various Tenors
Graph 3.15
UIP for Countries in the Region
��������������� ����������������
���������������� �����������������
���
��
��
�
����
���������������������������
������
������
������
������
������
������
������
������
���
���� ����
������
������
������
������
������
������
��������
�����
���
���
���
���
���
����
���������
�����������
�������������
�������
����
��� ��� ��� ��� ��� ���
����
��� ��� ��� ��� ��� ���
����
��� ��� ��� ��� ��� ���
����
Graph 3.16
CIP for Countries in the Region
��������� �����������
�������� �����
����
���
���
���
���
����
����
�������
����
��� ��� ��� ��� ��� ���
����
��� ��� ��� ��� ��� ���
����
��� ��� ��� ��� ��� ���
����
Latest Macroeconomic and Monetary Developments
24
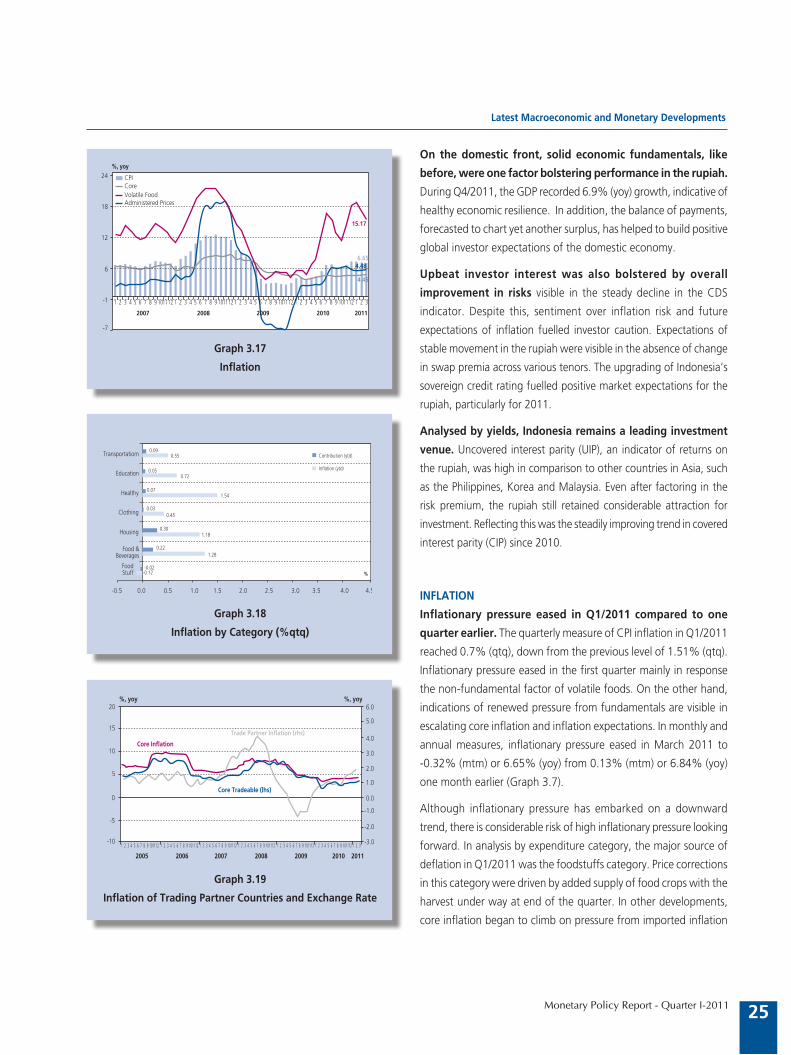
Monetary Policy Report - Quarter I-2011
On the domestic front, solid economic fundamentals, like
before, were one factor bolstering performance in the rupiah.
During Q4/2011, the GDP recorded 6.9% (yoy) growth, indicative of
healthy economic resilience. In addition, the balance of payments,
forecasted to chart yet another surplus, has helped to build positive
global investor expectations of the domestic economy.
Upbeat investor interest was also bolstered by overall
improvement in risks visible in the steady decline in the CDS
indicator. Despite this, sentiment over inflation risk and future
expectations of inflation fuelled investor caution. Expectations of
stable movement in the rupiah were visible in the absence of change
in swap premia across various tenors. The upgrading of Indonesia’s
sovereign credit rating fuelled positive market expectations for the
rupiah, particularly for 2011.
Analysed by yields, Indonesia remains a leading investment
venue. Uncovered interest parity (UIP), an indicator of returns on
the rupiah, was high in comparison to other countries in Asia, such
as the Philippines, Korea and Malaysia. Even after factoring in the
risk premium, the rupiah still retained considerable attraction for
investment. Reflecting this was the steadily improving trend in covered
interest parity (CIP) since 2010.
INFLATION
Inflationary pressure eased in Q1/2011 compared to one
quarter earlier. The quarterly measure of CPI inflation in Q1/2011
reached 0.7% (qtq), down from the previous level of 1.51% (qtq).
Inflationary pressure eased in the first quarter mainly in response
the non-fundamental factor of volatile foods. On the other hand,
indications of renewed pressure from fundamentals are visible in
escalating core inflation and inflation expectations. In monthly and
annual measures, inflationary pressure eased in March 2011 to
-0.32% (mtm) or 6.65% (yoy) from 0.13% (mtm) or 6.84% (yoy)
one month earlier (Graph 3.7).
Although inflationary pressure has embarked on a downward
trend, there is considerable risk of high inflationary pressure looking
forward. In analysis by expenditure category, the major source of
deflation in Q1/2011 was the foodstuffs category. Price corrections
in this category were driven by added supply of food crops with the
harvest under way at end of the quarter. In other developments,
core inflation began to climb on pressure from imported inflation
Graph 3.17
Inflation
Graph 3.18
Inflation by Category (%qtq)
��������
��
��
�
��
��
������������������������������������
���
� � � � � � � � � ������ � � � � � � � � � ������� � � � � � � � � ������ � � � � � � � � � ������ � � �
���� ���� ���� ���� ����
����
��������
�����
��������������
���������
�������
��������
�������
���������������
���������
����
����
��������
��������
����
����
�����
����
����
�
����
����
������������������
���������������
�����
����������������������������������
Graph 3.19
Inflation of Trading Partner Countries and Exchange Rate
�����������������������������
��������������
��������������������
�������� ������
��
��
�
�
��
���
���� ���� ���� ���� ���� ����
���
���
���
���
���
����
����
���
���
����
� � � � � � � � � ������ � � � � � � � � � ������ � � � � � � � � � ������ � � � � � � � � � ������ � � � � � � � � � ������ � � � � � � � � � ������ � � �
����
Latest Macroeconomic and Monetary Developments
25

Monetary Policy Report - Quarter I-2011
resulting from higher inflation in trading partner nations and rising
global commodity prices. Alongside this, inflationary pressure
in administered prices remained moderate in the absence of
government decisions to raise prices for strategic items to the end
of the quarter.
DISSAGGREGATION OF INFLATION
Core inflation edged upwards during Q2/1011. Inflation in the
core category reached 4.45% (yoy), ahead of 4.28% (yoy) in the
previous quarter. The main source of the increased core inflation lies
in external factors related to global price escalations and inflation
in trading partners. Nevertheless, the continued strengthening in
the rupiah during the period under review helped prevent further
increases in core inflation (Graphs 3.19 and 3.20).
Inflation expectations in Q1/2011 remained strong. Rising
inflationary pressure, driven mainly by externals, kept inflation
expectations running high. However, the Bank Indonesia decision
for a 25 bps rise in the BI Rate in February 2011 was effective in
curbing potential for further increases in inflation expectations.
Consumer expectations of inflation eased somewhat (Graph 3.11),
while inflation expectations at the trader level and the Consensus
Forecast (Graph 3.12) were little changed from the preceding
period.
Regarding fundamentals, increased demand met with
adequate supply side response. Reflecting this was the capacity
utilisation indicator, which edged upwards but remained stable at
below 80%, pointing to equilibrium between demand and supply.
The adequacy of the supply-side response is closely linked to the
brisk growth in investment during 2010, led by non-construction
investment.
The volatile foods (VF) category underwent deflation in
Q1/2011. Prices were driven down by increased supply during
the main harvest season, reinforced by imports. The VF category
recorded -0.39% (qtq) deflation as a result of steep price corrections
in March 2011. Measured annually, VF inflation in Q1/2011 reached
15.17% (yoy), down from the previous quarter’s level of 17.74%
(yoy).
Deflation in the VF category resulted mainly from dramatically
falling prices for chilli peppers. During Q1/2011, red chilli peppers
underwent a steep price correction of 37.04% (qtq). Prices tumbled
Graph 3.20
Import Commodities Inflation, Core Inflation, and WPI Import
��
�������������� ��������������������������
�������������������������
��
�
�
�
�
�
��
��
��
��
��
�
���
���
�����������������������
� � � �� � � � �� � � � �� � � � �� � � � �� � � � �� �
���� ���� ���� ���� ���� ���� ����
Graph 3.21
Inflation Expectation (SK-BI)
��������
���
���
���
���
���
���
���
��
��������������������������������������������������������������������������������
��������������������������
���
��
��
�
�
������
���� ���� ���� ���� ���� ���� ����
� � � � � � � � � ������ � � � � � � � � � ������ � � � � � � � � � ������ � � � � � � � � � ������ � � � � � � � � � ������ � � � � � � � � � ������ � � �
Graph 3.22.
Inflation Expectation – Consensus Forecast
����������
����
����
����
����
����
����
����
����
����
����� � � � � � � � � �� �� �� � � �
���� ����
�������� ����
����
����
���� ���� ����
���� ���� ��������
���� ����
����
��������
����
���������������������������
��������������������������
��������������������������
Latest Macroeconomic and Monetary Developments
26
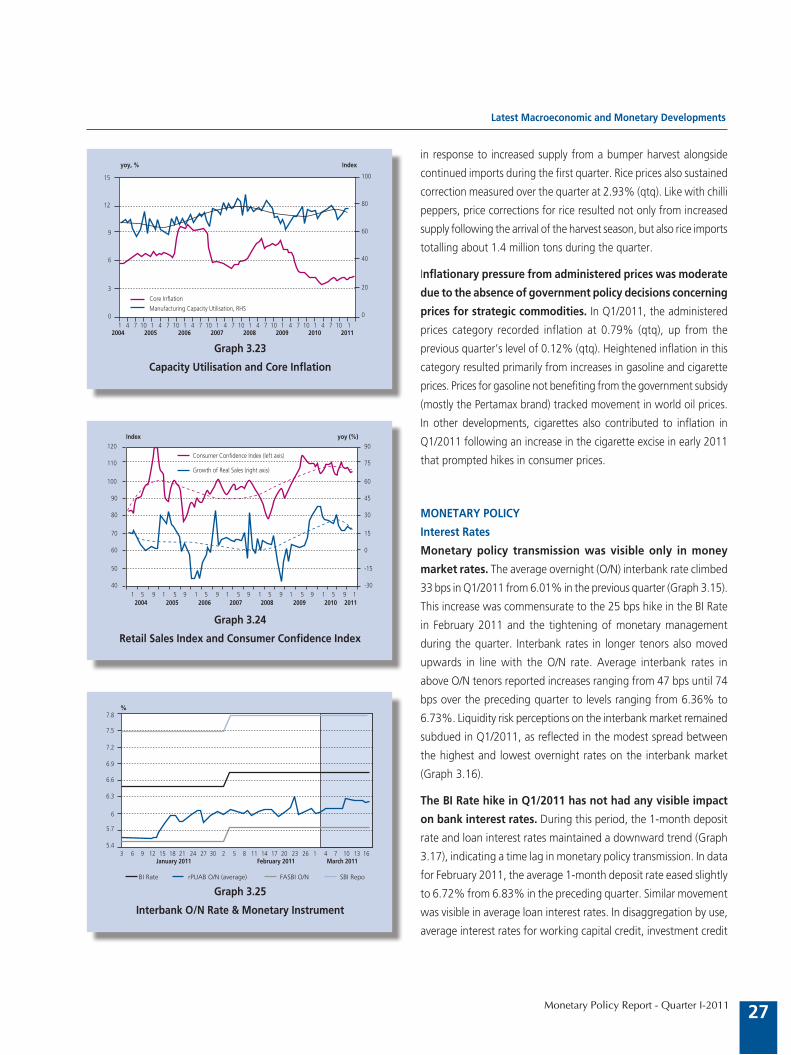
Monetary Policy Report - Quarter I-2011
in response to increased supply from a bumper harvest alongside
continued imports during the first quarter. Rice prices also sustained
correction measured over the quarter at 2.93% (qtq). Like with chilli
peppers, price corrections for rice resulted not only from increased
supply following the arrival of the harvest season, but also rice imports
totalling about 1.4 million tons during the quarter.
Inflationary pressure from administered prices was moderate
due to the absence of government policy decisions concerning
prices for strategic commodities. In Q1/2011, the administered
prices category recorded inflation at 0.79% (qtq), up from the
previous quarter’s level of 0.12% (qtq). Heightened inflation in this
category resulted primarily from increases in gasoline and cigarette
prices. Prices for gasoline not benefiting from the government subsidy
(mostly the Pertamax brand) tracked movement in world oil prices.
In other developments, cigarettes also contributed to inflation in
Q1/2011 following an increase in the cigarette excise in early 2011
that prompted hikes in consumer prices.
MONETARY POLICY
Interest Rates
Monetary policy transmission was visible only in money
market rates. The average overnight (O/N) interbank rate climbed
33 bps in Q1/2011 from 6.01% in the previous quarter (Graph 3.15).
This increase was commensurate to the 25 bps hike in the BI Rate
in February 2011 and the tightening of monetary management
during the quarter. Interbank rates in longer tenors also moved
upwards in line with the O/N rate. Average interbank rates in
above O/N tenors reported increases ranging from 47 bps until 74
bps over the preceding quarter to levels ranging from 6.36% to
6.73%. Liquidity risk perceptions on the interbank market remained
subdued in Q1/2011, as reflected in the modest spread between
the highest and lowest overnight rates on the interbank market
(Graph 3.16).
The BI Rate hike in Q1/2011 has not had any visible impact
on bank interest rates. During this period, the 1-month deposit
rate and loan interest rates maintained a downward trend (Graph
3.17), indicating a time lag in monetary policy transmission. In data
for February 2011, the average 1-month deposit rate eased slightly
to 6.72% from 6.83% in the preceding quarter. Similar movement
was visible in average loan interest rates. In disaggregation by use,
average interest rates for working capital credit, investment credit
Graph 3.23
Capacity Utilisation and Core Inflation
Graph 3.24
Retail Sales Index and Consumer Confidence Index
�
��
��
��
��
���
�
�
�
�
��
��
�����
� � �� �����
� � �� �����
� � �� �����
� � �� �����
� � �� �����
� � �� �����
� � �� �����
�����������������������������������������������������
������ �����
���
���
�
��
��
��
��
��
��
��
��
��
��
��
��
���
���
���
� � � � � � � � � � � � � � � � � � � � � ����� ���� ���� ���� ���� ���� ���� ����
�������������������������������������
���������������������������������
����� �������
Graph 3.25
Interbank O/N Rate & Monetary Instrument
������� ������������������� ��������� ��������
�
���
���
�
���
���
���
���
���
���
� � � �� �� �� �� �� �� ��������������
� � � �� �� �� �� �� �� ��������������
� � �� �� ������������
Latest Macroeconomic and Monetary Developments
27

Monetary Policy Report - Quarter I-2011
and consumption credit came down by 11 bps, 8 bps and 3 bps
from one quarter earlier to 12.72%, 12.20% and 14.50%. Similarly,
preliminary data for the end of March 2011 again indicated further
easing in bank deposit and lending rates.
Funds, Credit, and Money Supply
Funding growth maintained stable performance during
Q1/2011 in relation to one quarter earlier. In February
2011, growth in depositor funds reached 18.4% (yoy), barely
changed from 18.5% (yoy) in the previous quarter (Graph 3.18).
With this growth, bank depositor funds in Q1/2011 (figures for
February 2011) were recorded at Rp 2,287.8 trillion. In analysis by
component, demand deposits underwent brisk expansion at 17.9%
(yoy), which compared to the previous quarter’s growth of only
15.0%. In contrast, growth in time deposits slowed to 15.3% (yoy)
from 18.6% (yoy) in the preceding quarter in movement consistent
with bank credit expansion during Q1/2011. However, preliminary
figures at the end of the period pointed to a renewed increase in
bank funding growth.
Lending growth continued to forge ahead. According to
preliminary data, credit expansion in Q1/2011 reached 25.1%
(yoy). However, in data for February 2011, credit expansion was
recorded at 23.6% (yoy), up from the previous quarter’s growth of
22.1% (yoy). This credit expansion was mostly supported by more
buoyant growth in working capital credit at 35.4% (yoy) compared
to 25.2% (yoy) one quarter before (Graph 3.19). Meanwhile, growth
in consumption credit slowed to 13.2% (yoy) from the previous
quarter’s brisk expansion at 22.9% (yoy). Investment credit, however, maintained relatively
Graph 3.26
Interbank Rate in Various Tenors
����
����
����
����
����
������������������������������
��������������������������������������
�
� � � �� �� �� �� �� �� �������������
� � � �� �� �� �� �� ���������������
� � �� �� ������������
� �� �� �� �� ��
Graph 3.27
Banks‘ Interest Rates
�
�
��
��
��
��
��
��
� � � � � �� � � � � � �� � � � � � �� � ����� ���� ���� ����
������� ��������������� ��������������������������������������� ������������������
�
Interest Rate (%) Jan Feb Mar Apr May Jun Jul Aug Sep Oct Nov Dec Jan Feb Mar
Quarter I-2010
Table 3.3
The Development of Interest Rate
BI Rate 6.50 6.50 6.50 6.50 6.50 6.50 6.50 6.50 6.50 6.50 6.50 6.50 6.50 6.75 6.75
Deposit Guarantee 7.00 7.00 7.00 7.00 7.00 7.00 7.00 7.00 7.00 7.00 7.00 7.00 7.00 7.25 n.a
1-month Deposit (Weighted Average) 7.09 6.93 6.77 6.89 6.76 6.79 6.79 6.75 6.72 6.81 6.78 6.83 6.72 6.72 n.a
Base Lending Rate 12.65 12.66 12.58 12.62 12.58 12.50 12.39 12.38 12.21 12.07 11.98 11.98 12.03 11.84 n.a
Working Capital Credit 13.75 13.68 13.54 13.42 13.26 13.17 13.21 13.19 13.00 13.01 12.96 12.83 12.75 12.72 n.a
Investment Credit 13.24 13.21 12.72 12.62 12.59 12.70 12.60 12.40 12.41 12.38 12.35 12.28 12.25 12.20 n.a
Consumption Credit 16.32 16.36 15.42 15.34 15.23 14.99 14.92 14.83 14.75 14.65 14.53 14.53 14.48 14.50 n.a
Quarter II-2010 Quarter III-2010 Quarter IV-2010 Quarter I-2011
Latest Macroeconomic and Monetary Developments
28

Monetary Policy Report - Quarter I-2011
stable growth compared to the preceding quarter at 18.6% (yoy).
In analysis by sector, credit for trade and business services provided
the main source of credit expansion during the quarter, while credit
growth in other sectors dropped back in line with consumption credit.
These developments show that credit expansion in early 2011 was
consistently followed by an improved composition of lending, which
is expected to have a positive impact on economic growth.
Economic liquidity maintained an upward trend. During February
2011, M1 and M2 growth strengthened to 18.8% and 19.2% (yoy)
from the previous quarter’s levels of 17.8% and 18.8% (yoy). M1
and M2 in Q1/2011 were recorded at Rp 599.8 trillion and Rp 2,487
trillion. The more robust M1 growth was bolstered mainly by the more
dominant growth in demand deposits compared to currency. This
offers a positive indication for economic activity in the real sector, as
reflected in the buoyant rate of credit expansion. Growth in rupiah
time deposits was again the leading component driving expansion
in M2 liquidity.
The Financial Market
Monetary policy aimed at anchoring inflation expectations on
the financial market met with positive response from market
actors, visible in a rebound after the first half of Q1/2011. While
financial markets dipped under pressure in early Q1/2011, market
performance embarked on a gradual recovery halfway through
Q1/2011. This was prompted, among others, by the Bank Indonesia
decision to raise the BI Rate by 25 bps to 6.75% in February 2011.
Other developments in macroeconomic indicators that contributed
to the rebound in the JCI included the positive outlook for economic
growth and exchange rate stability. Meanwhile, in analysis by
issuer fundamentals, strong earnings growth by listed companies
also contributed to the rebound in the JCI. In response to these
developments, the JCI closed at 3,678 (Graph 3.21).
The rebound in the JCI hit a snag from negative sentiment
over the impact of the disaster in Japan on Indonesia’s
financial market, which showed in the volatile movement in
the JCI. However, at the end of the quarter under review, the JCI
managed a rebound bolstered by positive sentiment among market
actors predicting only temporary or short-term impact from the
Japan disaster. Market players predict an upsurge in the mining
sector as a result of increased energy requirements brought on by
Graph 3.28
Funding, Credit Growth, and BI Rate
Graph 3.29
Credit Growth by Usage
��
��
��
��
��
��
��
�
�
���
�
�
�
�
�
�
�
���� ��� ��� ��� ��� ��� ��� ��� ������ ���
���� ����
������ ��� �������
����
�������
����
��� ��� ������ ��� ��� �������
����
����
����
���
�
��
��
��
��
��
��
���������������������� ����������������� ������������������
�����
������� ��� ���
������� ��� ���
������� ��� ���
������� ��� ���
������� ��� ���
������� ��� ��� ���
����
Graph 3.30
Growth of M1 and M2
�
�
�
��
��
��
��
��
�����������������
�������
�
�
�
�
�
��
��
��
���� ���� ���� ���� ���� ���� ����� � � � ��� � � � � ��� � � � � ���� � � � ��� � � � � ��� � � � � ���� �
Latest Macroeconomic and Monetary Developments
29

Monetary Policy Report - Quarter I-2011
the closure of the nuclear power plants in Japan and heightened
risks in the Middle East.
During Q1/2011, stock market players responded to widely
fluctuating movement in the JCI by cutting back exposure
to domestic equities. As a result, the JCI recorded a net foreign
sale in Q1/2011 of Rp 2.8 trillion. Net selling took place mainly in
January and March 2011, with levels reaching Rp 2.6 trillion and
Rp 2.2 trillion. During January 2011, negative sentiment emerged
in relation to potential for mounting inflationary pressure. Later, in
March 2011, negative sentiment was more closely linked to adverse
impact from the Japan disaster that prompted portfolio rebalancing
by global financial market actors. With sentiment from the Japan
disaster receding, foreigners resumed buying near the end of the
period under review.
The government securities market, which came under pressure
early in the quarter, began to recover performance in the wake
of the BI Rate hike. Early in Q1/2011, market sentiment took a
negative turn due to mounting inflation, which in turn widened yield
on Indonesian government securities. However, following the increase
in the BI Rate, the resulting anchoring of inflation expectations among
market actors resulted in a significant narrowing of yield by the end
of the period (Graph 3.33). However, for Q1/2011 as a whole, yield
on Indonesian government securities remained above levels reached
at the end of 2010. During this period, short, medium and long-term
yield widened by 104 bps, 64 bps and 1 bps.
The rebound on the government securities market in mid-
Q1/2011 was buoyed by fiscal risk managed at a prudent
level in the face of external dynamics. Fundamentals on the
government securities market were generally secure, capable of
withstanding the turbulence on global financial markets. This
was related to positive perceptions among market actors of fiscal
sustainability amid the mounting trend in oil prices. Nevertheless,
the disaster in Japan is also expected to have minimum impact on
fiscal performance.
Performance of mutual funds varied according to type of
product. Mutual funds performance in February 2011 was reflected
in overall 1.5% growth in Net Assets Value (NAV) compared to
December 2010. The rise in mutual funds NAV was bolstered by
equity-based fund products, while funds based on Indonesian
government securities in fact sustained correction.
Graph 3.31
JCI and BI Rate
Graph 3.32
JCI and Foreign Net Buying
�����
�����
�����
�����
�����
�����
�����
����������
�
�
���
�
���
�
���
��
���� ���� ���� ����
�
���
���
��� ������ ��� ��� ��� ��� ������ ��� ��� ��� ��� ������ ��� ��� ��� ��� ���
����������
Graph 3.33
Government Bond Yield and BI Rate
�������
�����������������������������
���� ���� ���� ������� ��� ��� ��� ��� ��� ��� ��� ��� ��� ��� ��� ��� ��� ��� ��� ��� ��� ��� ���
�
�
��
��
��
��
��
��
�
�
�����
�����
�����
�����
�����
�����
�������������������������������������
�����
�
���
���
����
����
����
���� ���� ���� ����
���
���
�����
���
�����������������������������������������
�����
���
� �� ��� �� � �� ��� �� � �� ��� �� � �� ��� �� �����
Latest Macroeconomic and Monetary Developments
30
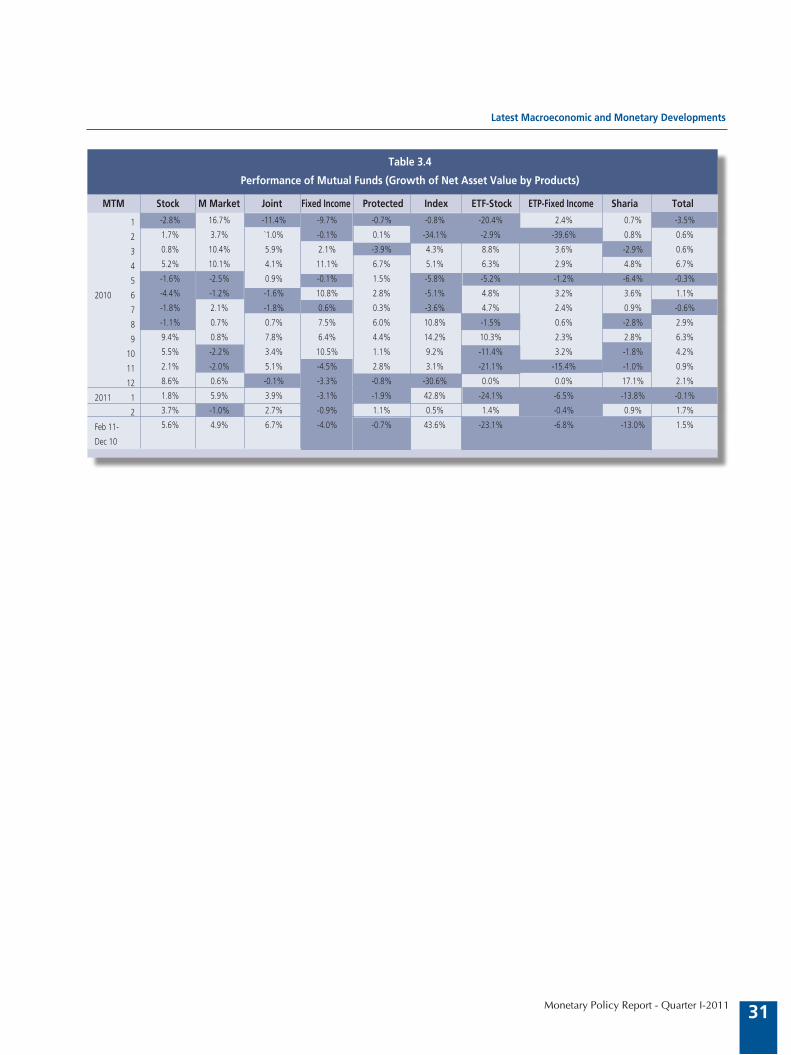
Monetary Policy Report - Quarter I-2011
MTM Stock M Market Joint Fixed Income Protected Index ETF-Stock ETP-Fixed Income Sharia Total
1
2
3
4
5
2010 6
7
8
9
10
11
12
2011 1
2
Feb 11-
Dec 10
Table 3.4
Performance of Mutual Funds (Growth of Net Asset Value by Products)
-2.8% 16.7% -11.4% -9.7% -0.7% -0.8% -20.4% 2.4% 0.7% -3.5%
1.7% 3.7% `1.0% -0.1% 0.1% -34.1% -2.9% -39.6% 0.8% 0.6%
0.8% 10.4% 5.9% 2.1% -3.9% 4.3% 8.8% 3.6% -2.9% 0.6%
5.2% 10.1% 4.1% 11.1% 6.7% 5.1% 6.3% 2.9% 4.8% 6.7%
-1.6% -2.5% 0.9% -0.1% 1.5% -5.8% -5.2% -1.2% -6.4% -0.3%
-4.4% -1.2% -1.6% 10.8% 2.8% -5.1% 4.8% 3.2% 3.6% 1.1%
-1.8% 2.1% -1.8% 0.6% 0.3% -3.6% 4.7% 2.4% 0.9% -0.6%
-1.1% 0.7% 0.7% 7.5% 6.0% 10.8% -1.5% 0.6% -2.8% 2.9%
9.4% 0.8% 7.8% 6.4% 4.4% 14.2% 10.3% 2.3% 2.8% 6.3%
5.5% -2.2% 3.4% 10.5% 1.1% 9.2% -11.4% 3.2% -1.8% 4.2%
2.1% -2.0% 5.1% -4.5% 2.8% 3.1% -21.1% -15.4% -1.0% 0.9%
8.6% 0.6% -0.1% -3.3% -0.8% -30.6% 0.0% 0.0% 17.1% 2.1%
1.8% 5.9% 3.9% -3.1% -1.9% 42.8% -24.1% -6.5% -13.8% -0.1%
3.7% -1.0% 2.7% -0.9% 1.1% 0.5% 1.4% -0.4% 0.9% 1.7%
5.6% 4.9% 6.7% -4.0% -0.7% 43.6% -23.1% -6.8% -13.0% 1.5%
Latest Macroeconomic and Monetary Developments
31

Statistics
32 Monetary Policy Report - Quarter I-2011
Statistics
Table 1
Interest Rate of Money Market, Deposits, and Credit
(Percent per Annum)
PeriodInterbank
MoneyMarket*
SBIDiscount
Rate
Time Deposit Interest Rate** Credit Interest Rate**
1month
3months
6months
12months
24months
WorkingCapital
Investment
2005Qtr. IV
2006Qtr. IQtr. IIQtr. IIIQtr. IV
2007Qtr. IQtr. IIQtr. IIIQtr. IV
2008Qtr. IQtr. IIQtr. IIIQtr. IV
2009Qtr. IQtr. IIQtr. IIIQtr. IV
2010Qtr. IQtr. IIQtr. IIIQtr. IV
2010Qtr. I
* Data per February 2011 ** Data per January 2011
9.44 12.75 11.98 11.75 10.17 10.95 12.39 16.23 15.66 10.28 12.73 11.61 12.19 12.10 12.02 12.64 16.35 15.90 10.23 12.50 11.34 11.70 12.09 12.28 12.61 16.15 15.94 8.90 11.25 10.47 11.05 11.52 12.36 12.47 15.82 15.66 5.97 9.75 8.96 9.71 10.70 11.63 11.84 15.07 15.10 7.52 9.00 8.13 8.52 9.29 10.17 11.73 14.49 14.53 5.58 8.75 7.46 7.87 8.40 9.54 11.73 13.88 13.99 6.83 8.25 7.13 7.44 7.80 8.91 11.24 13.31 13.45 4.33 8.00 7.19 7.42 7.65 8.24 10.83 13.00 13.01 8.01 7.96 6.88 7.26 7.57 7.79 10.06 12.88 12.59 8.43 8.73 7.19 7.49 7.79 7.78 9.91 12.99 12.51 9.37 9.71 9.26 9.45 9.14 9.34 9.83 13.93 13.32 9.40 10.83 10.75 11.16 10.34 10.43 8.62 15.22 14.40 8.04 8.21 9.42 10.65 10.45 11.31 8.33 14.99 14.05 6.96 6.95 8.52 9.25 9.75 11.37 9.03 14.52 13.78 6.30 6.48 7.43 8.35 8.71 10.80 9.14 14.17 13.20 6.28 6.46 6.87 7.48 7.87 9.55 9.10 13.69 12.96 6.17 6.27 6.77 6.99 7.31 8.49 8.48 13.54 12.72 6.19 6.26 6.79 6.95 6.99 7.87 8.11 13.17 12.70 6.19 n.a 6.72 6.95 6.96 7.64 7.92 13.00 12.41 5.58 n.a 6.83 7.06 7.20 7.88 8.11 12.83 12.28 6.10 n.a 6.72 6.88 6.95 7.20 7.89 12.75 12.25
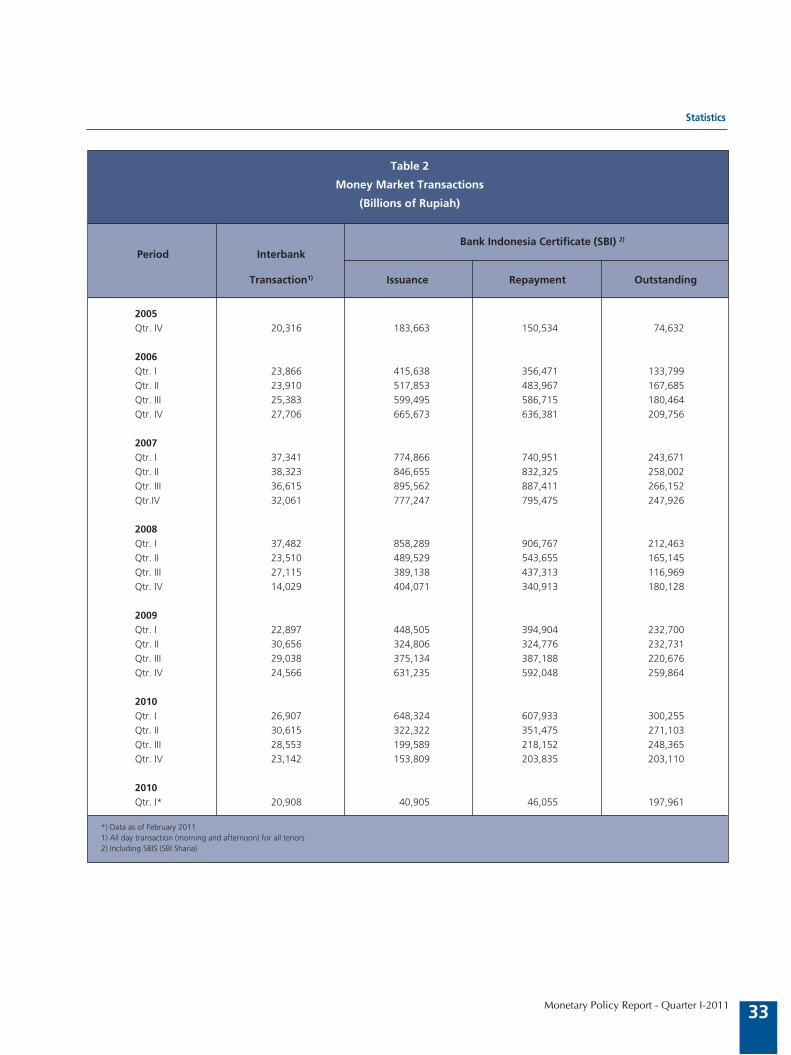
Statistics
33Monetary Policy Report - Quarter I-2011
Table 2
Money Market Transactions
(Billions of Rupiah)
Bank Indonesia Certificate (SBI) 2)
Period Interbank Transaction1) Issuance Repayment Outstanding
2005Qtr. IV
2006Qtr. I
Qtr. II
Qtr. III
Qtr. IV
2007Qtr. I
Qtr. II
Qtr. III
Qtr.IV
2008Qtr. I
Qtr. II
Qtr. III
Qtr. IV
2009Qtr. I
Qtr. II
Qtr. III
Qtr. IV
2010Qtr. I
Qtr. II
Qtr. III
Qtr. IV
2010Qtr. I*
*) Data as of February 2011 1) All day transaction (morning and afternoon) for all tenors2) Including SBIS (SBI Sharia)
20,316 183,663 150,534 74,632
23,866 415,638 356,471 133,799
23,910 517,853 483,967 167,685
25,383 599,495 586,715 180,464
27,706 665,673 636,381 209,756
37,341 774,866 740,951 243,671
38,323 846,655 832,325 258,002
36,615 895,562 887,411 266,152
32,061 777,247 795,475 247,926
37,482 858,289 906,767 212,463
23,510 489,529 543,655 165,145
27,115 389,138 437,313 116,969
14,029 404,071 340,913 180,128
22,897 448,505 394,904 232,700
30,656 324,806 324,776 232,731
29,038 375,134 387,188 220,676
24,566 631,235 592,048 259,864
26,907 648,324 607,933 300,255
30,615 322,322 351,475 271,103
28,553 199,589 218,152 248,365
23,142 153,809 203,835 203,110
20,908 40,905 46,055 197,961

Statistics
34 Monetary Policy Report - Quarter I-2011
I II III IV I II III IV I II III IV I*
* Data per February 20111) Excluded central government. non-resident. foreign counter part value. and managable credit.
Table 3
Outstanding of Credits in Rupiah and Foreign Currency of Commercial Banks by Group of Banks and Economic Sector1)
(Billions of Rupiah)
1 State Bank - Agriculture
- Mining
- Industry
- Trade
- Services
- Others
2 Private National Foreign Bank - Agriculture
- Mining
- Industry
- Trade
- Services
- Others
3 Regional Government Bank - Agriculture
- Mining
- Industry
- Trade
- Services
- Others
4 Foreign and Joint Bank - Agriculture
- Mining
- Industry
- Trade
- Services
- Others
5 Rurral Bank - Agriculture
- Mining
- Industry
- Trade
- Services
- Others
6 Sub total (1 until 5) - Agriculture
- Mining
- Industry
- Trade
- Services
- Others
350,232 394,065 432,850 461,877 466,605 495,440 504,649 533,945 536,336 578,587 595,131 630,148 625,126 30,711 32,381 35,153 37,409 38,367 42,041 41,313 45,091 39,140 45,520 49,215 48,438 48,462
13,371 14,922 14,778 13,807 13,363 11,923 14,205 16,795 17,863 21,512 20,736 25,560 25,007
72,706 81,038 88,181 96,838 98,660 99,825 92,634 92,485 89,314 100,237 93,060 93,695 92,937
79,209 92,719 98,865 102,017 103,408 113,130 118,580 129,497 84,616 90,411 114,918 110,981 104,238
55,271 64,182 77,295 87,505 83,540 88,540 91,532 93,320 137,568 140,494 130,444 156,264 149,504
98,964 108,823 118,578 124,301 129,267 139,981 146,385 156,757 114,970 105,306 112,242 117,866 126,196
451,967 500,718 534,599 552,617 530,642 529,687 549,349 593,400 611,861 672,798 715,217 775,323 787,388 15,571 18,298 18,169 19,150 18,722 19,353 19,112 21,359 20,379 24,939 26,403 30,199 29,654
9,621 10,137 10,850 11,137 8,979 9,697 10,861 15,013 14,696 18,389 19,827 21,247 22,812
77,952 84,610 90,896 97,042 93,414 84,488 86,575 92,738 92,277 97,012 103,688 114,203 116,607
111,756 123,057 125,908 130,687 120,114 121,956 124,949 134,434 141,275 158,600 164,959 185,508 182,004
115,400 131,115 143,486 148,332 144,072 145,936 151,281 162,535 155,932 188,608 201,904 209,957 213,976
121,667 133,501 145,290 146,269 145,341 148,257 156,571 167,321 74,659 63,076 65,673 79,140 74,485
75,065 85,339 93,991 96,440 100,817 110,968 119,552 120,701 122,958 132,757 138,961 143,067 145,493 2,379 2,710 3,067 3,182 3,143 3,289 3,749 3,706 3,651 3,713 4,359 4,488 4,875
53 182 187 270 312 388 615 675 628 710 755 992 903
710 770 787 814 829 943 1,082 1,146 2,040 2,394 2,751 2,890 2,749
10,191 11,504 12,042 12,055 12,638 14,006 14,898 15,278 15,975 15,786 16,263 17,337 17,380
8,615 10,831 13,456 13,356 13,153 15,716 18,790 17,565 17,295 19,954 21,507 20,949 19,644
53,117 59,342 64,452 66,763 70,742 76,626 80,418 82,331 71,932 78,994 82,237 84,220 87,420
151,908 161,998 178,061 189,245 184,654 168,614 168,509 170,748 170,328 189,463 195,410 201,368 201,185 7,449 6,425 6,505 6,419 7,020 6,669 5,535 5,236 5,410 6,703 6,803 6,797 6,809
4,591 3,910 4,478 5,327 6,081 4,712 6,235 9,076 8,602 10,567 11,567 12,660 12,655
60,265 65,896 68,739 74,458 71,358 61,420 58,833 59,314 55,601 62,368 58,905 63,065 62,790
11,383 13,022 14,256 13,246 15,113 13,598 13,364 12,873 16,476 18,943 20,176 21,848 19,672
43,878 46,763 56,523 60,766 57,418 53,919 55,326 52,828 51,811 60,183 66,363 66,988 68,603
24,342 25,982 27,560 29,029 27,664 28,296 29,216 31,421 29,259 26,882 27,981 26,081 26,488
21,592 23,856 25,706 25,413 25,333 26,382 27,434 28,014 29,476 31,491 32,832 33,695 34,801 1,498 1,672 1,769 1,733 1,774 1,915 1,934 2,002 2,125 2,302 2,390 2,602 2,614
0 0 0 0 0 0 0 0 0 0 0 36 42
367 391 436 426 433 456 486 505 531 545 589 476 499
7,973 8,866 9,516 9,307 8,998 9,368 9,746 9,801 10,255 10,845 11,233 10,553 10,883
2,185 2,433 2,684 2,672 2,705 2,861 2,935 3,054 3,247 3,561 3,823 4,954 5,162
9,569 10,494 11,301 11,275 11,423 11,782 12,333 12,652 13,317 14,238 14,795 15,072 15,600
1,038,912 1,148,891 1,249,970 1,313,873 1,308,051 1,331,091 1,369,493 1,446,808 1,470,959 1,605,095 1,677,551 1,783,601 1,793,993 57,562 61,413 64,623 67,828 69,026 73,267 71,643 77,394 70,705 83,178 89,170 92,525 92,415
27,634 29,151 30,293 30,541 28,735 26,720 31,916 41,559 41,789 51,178 52,885 60,495 61,418
212,000 232,705 249,039 269,578 264,694 247,132 239,610 246,188 239,763 262,556 258,993 274,330 275,582
211,719 235,898 249,762 259,953 260,271 272,058 281,537 301,883 268,597 294,584 327,549 346,226 334,177
221,123 249,700 286,740 306,141 300,888 306,972 319,864 329,302 365,852 412,800 424,041 459,112 456,890
308,874 340,024 369,513 379,832 384,437 404,942 424,923 450,482 304,138 288,495 302,929 322,378 330,189
2008 2009 2010 2011
```
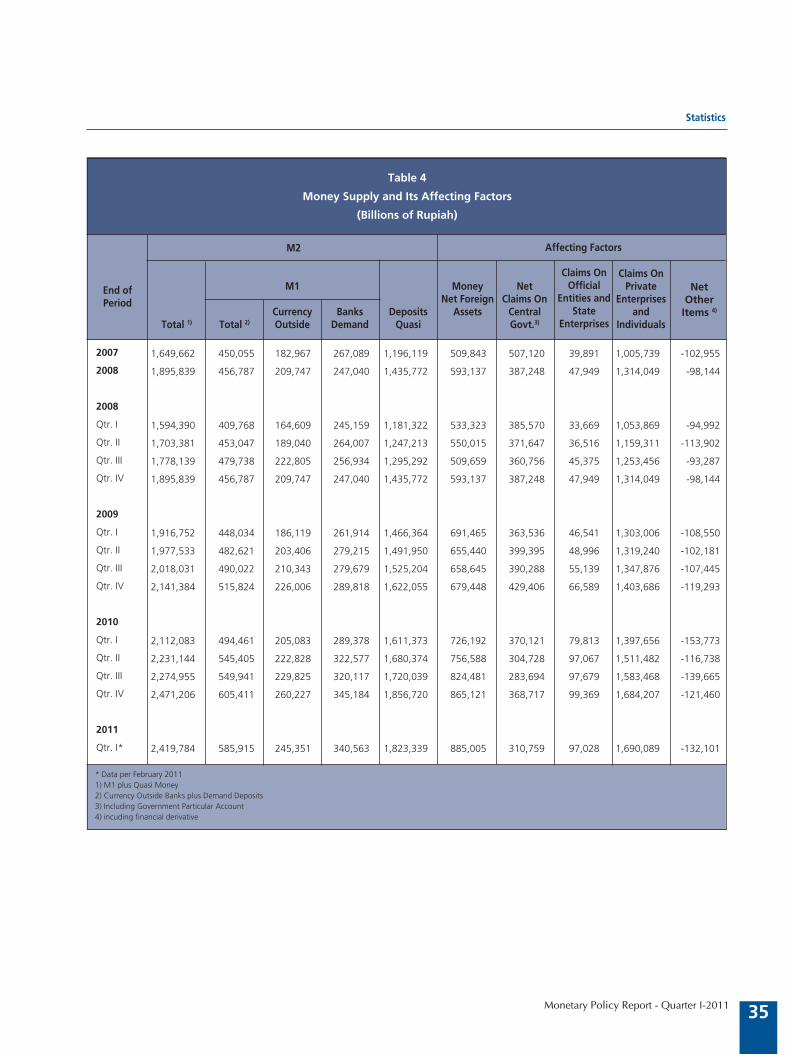
Statistics
35Monetary Policy Report - Quarter I-2011
* Data per February 2011 1) M1 plus Quasi Money2) Currency Outside Banks plus Demand Deposits3) Including Government Particular Account4) incuding financial derivative
Table 4
Money Supply and Its Affecting Factors
(Billions of Rupiah)
M2 Affecting Factors
End ofPeriod
Total 1) Total 2)
M1
CurrencyOutside
BanksDemand
DepositsQuasi
MoneyNet Foreign
Assets
NetClaims On
CentralGovt.3)
Claims OnOfficial
Entities andState
Enterprises
Claims OnPrivate
Enterprisesand
Individuals
NetOther
Items 4)
2007
2008
2008
Qtr. I
Qtr. II
Qtr. III
Qtr. IV
2009
Qtr. I
Qtr. II
Qtr. III
Qtr. IV
2010
Qtr. I
Qtr. II
Qtr. III
Qtr. IV
2011
Qtr. I*
1,649,662 450,055 182,967 267,089 1,196,119 509,843 507,120 39,891 1,005,739 -102,955
1,895,839 456,787 209,747 247,040 1,435,772 593,137 387,248 47,949 1,314,049 -98,144
1,594,390 409,768 164,609 245,159 1,181,322 533,323 385,570 33,669 1,053,869 -94,992
1,703,381 453,047 189,040 264,007 1,247,213 550,015 371,647 36,516 1,159,311 -113,902
1,778,139 479,738 222,805 256,934 1,295,292 509,659 360,756 45,375 1,253,456 -93,287
1,895,839 456,787 209,747 247,040 1,435,772 593,137 387,248 47,949 1,314,049 -98,144
1,916,752 448,034 186,119 261,914 1,466,364 691,465 363,536 46,541 1,303,006 -108,550
1,977,533 482,621 203,406 279,215 1,491,950 655,440 399,395 48,996 1,319,240 -102,181
2,018,031 490,022 210,343 279,679 1,525,204 658,645 390,288 55,139 1,347,876 -107,445
2,141,384 515,824 226,006 289,818 1,622,055 679,448 429,406 66,589 1,403,686 -119,293
2,112,083 494,461 205,083 289,378 1,611,373 726,192 370,121 79,813 1,397,656 -153,773
2,231,144 545,405 222,828 322,577 1,680,374 756,588 304,728 97,067 1,511,482 -116,738
2,274,955 549,941 229,825 320,117 1,720,039 824,481 283,694 97,679 1,583,468 -139,665
2,471,206 605,411 260,227 345,184 1,856,720 865,121 368,717 99,369 1,684,207 -121,460
2,419,784 585,915 245,351 340,563 1,823,339 885,005 310,759 97,028 1,690,089 -132,101
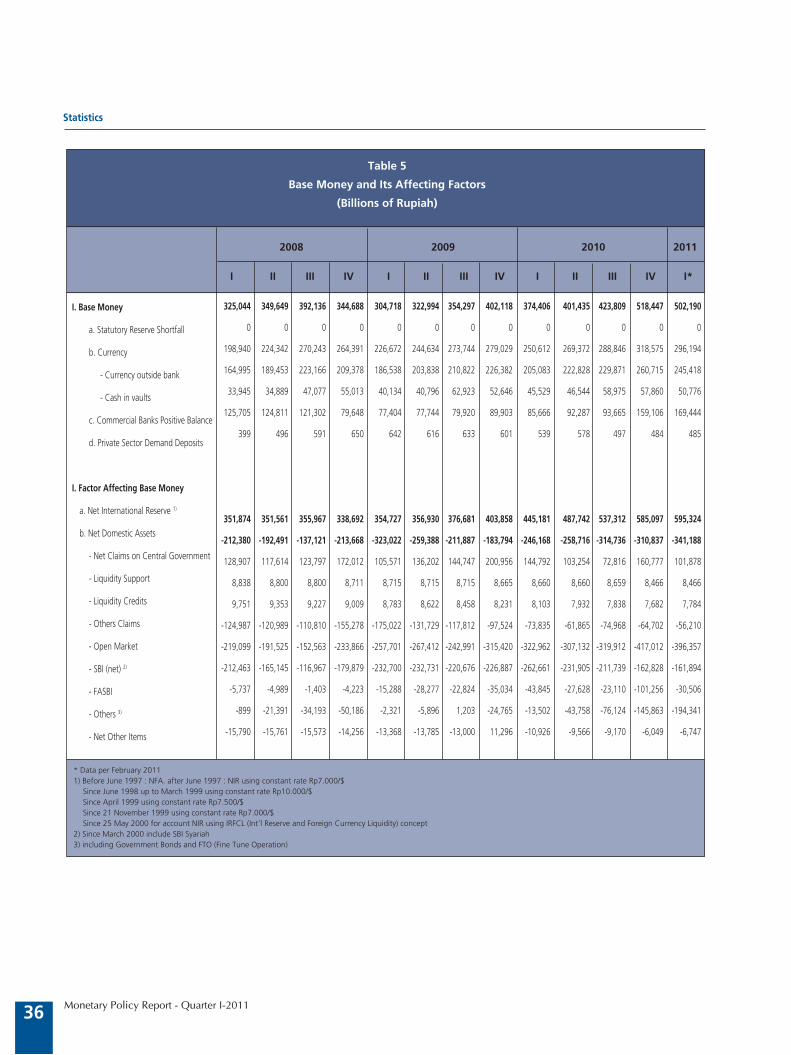
Statistics
36 Monetary Policy Report - Quarter I-2011
Table 5
Base Money and Its Affecting Factors
(Billions of Rupiah)
325,044 349,649 392,136 344,688 304,718 322,994 354,297 402,118 374,406 401,435 423,809 518,447 502,190
0 0 0 0 0 0 0 0 0 0 0 0 0
198,940 224,342 270,243 264,391 226,672 244,634 273,744 279,029 250,612 269,372 288,846 318,575 296,194
164,995 189,453 223,166 209,378 186,538 203,838 210,822 226,382 205,083 222,828 229,871 260,715 245,418
33,945 34,889 47,077 55,013 40,134 40,796 62,923 52,646 45,529 46,544 58,975 57,860 50,776
125,705 124,811 121,302 79,648 77,404 77,744 79,920 89,903 85,666 92,287 93,665 159,106 169,444
399 496 591 650 642 616 633 601 539 578 497 484 485
351,874 351,561 355,967 338,692 354,727 356,930 376,681 403,858 445,181 487,742 537,312 585,097 595,324
-212,380 -192,491 -137,121 -213,668 -323,022 -259,388 -211,887 -183,794 -246,168 -258,716 -314,736 -310,837 -341,188
128,907 117,614 123,797 172,012 105,571 136,202 144,747 200,956 144,792 103,254 72,816 160,777 101,878
8,838 8,800 8,800 8,711 8,715 8,715 8,715 8,665 8,660 8,660 8,659 8,466 8,466
9,751 9,353 9,227 9,009 8,783 8,622 8,458 8,231 8,103 7,932 7,838 7,682 7,784
-124,987 -120,989 -110,810 -155,278 -175,022 -131,729 -117,812 -97,524 -73,835 -61,865 -74,968 -64,702 -56,210
-219,099 -191,525 -152,563 -233,866 -257,701 -267,412 -242,991 -315,420 -322,962 -307,132 -319,912 -417,012 -396,357
-212,463 -165,145 -116,967 -179,879 -232,700 -232,731 -220,676 -226,887 -262,661 -231,905 -211,739 -162,828 -161,894
-5,737 -4,989 -1,403 -4,223 -15,288 -28,277 -22,824 -35,034 -43,845 -27,628 -23,110 -101,256 -30,506
-899 -21,391 -34,193 -50,186 -2,321 -5,896 1,203 -24,765 -13,502 -43,758 -76,124 -145,863 -194,341
-15,790 -15,761 -15,573 -14,256 -13,368 -13,785 -13,000 11,296 -10,926 -9,566 -9,170 -6,049 -6,747
2008 2009 2010 2011
I II III IV I II III IV I II III IV I*
I. Base Money
a. Statutory Reserve Shortfall
b. Currency
- Currency outside bank
- Cash in vaults
c. Commercial Banks Positive Balance
d. Private Sector Demand Deposits
I. Factor Affecting Base Money
a. Net International Reserve 1)
b. Net Domestic Assets
- Net Claims on Central Government
- Liquidity Support
- Liquidity Credits
- Others Claims
- Open Market
- SBI (net) 2)
- FASBI
- Others 3)
- Net Other Items
* Data per February 20111) Before June 1997 : NFA. after June 1997 : NIR using constant rate Rp7.000/$ Since June 1998 up to March 1999 using constant rate Rp10.000/$ Since April 1999 using constant rate Rp7.500/$ Since 21 November 1999 using constant rate Rp7.000/$ Since 25 May 2000 for account NIR using IRFCL (Int’l Reserve and Foreign Currency Liquidity) concept2) Since March 2000 include SBI Syariah3) including Government Bonds and FTO (Fine Tune Operation)
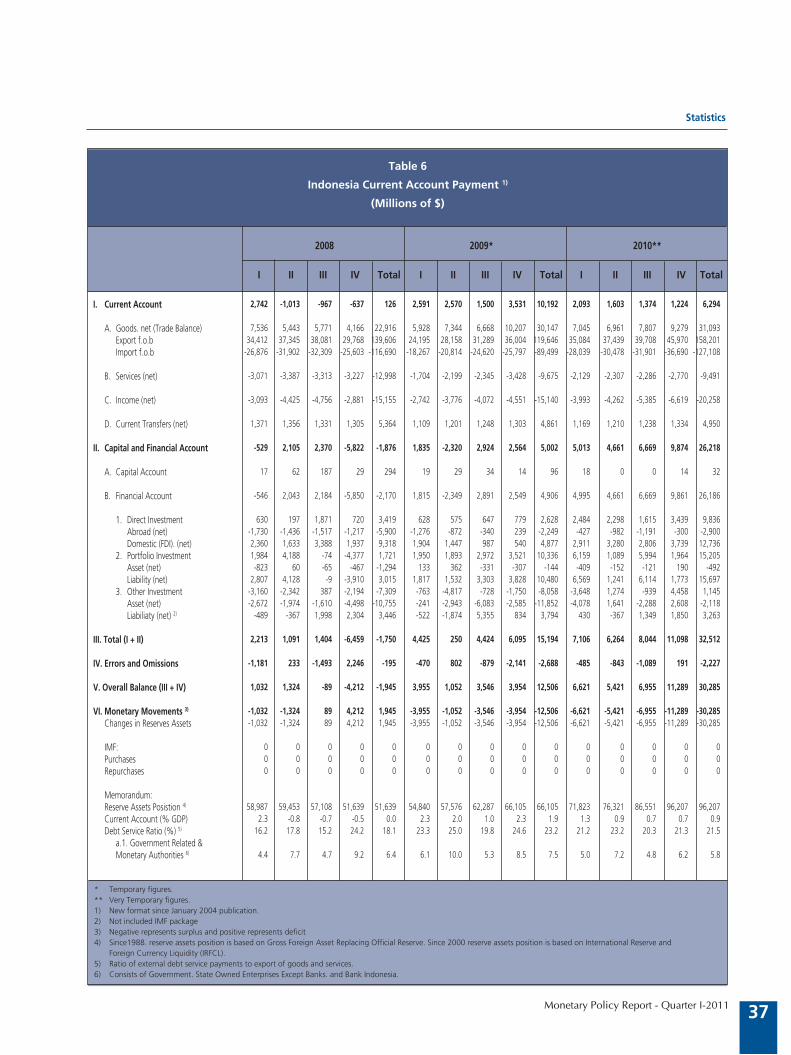
Statistics
37Monetary Policy Report - Quarter I-2011
* Temporary figures.** Very Temporary figures.1) New format since January 2004 publication.2) Not included IMF package3) Negative represents surplus and positive represents deficit4) Since1988. reserve assets position is based on Gross Foreign Asset Replacing Official Reserve. Since 2000 reserve assets position is based on International Reserve and Foreign Currency Liquidity (IRFCL).5) Ratio of external debt service payments to export of goods and services.6) Consists of Government. State Owned Enterprises Except Banks. and Bank Indonesia.
Table 6
Indonesia Current Account Payment 1)
(Millions of $)
2008 2009* 2010**
I II III IV Total I II III IV Total I II III IV Total
I. Current Account
A. Goods. net (Trade Balance) Export f.o.b Import f.o.b
B. Services (net)
C. Income (net)
D. Current Transfers (net)
II. Capital and Financial Account
A. Capital Account B. Financial Account
1. Direct Investment Abroad (net) Domestic (FDI). (net) 2. Portfolio Investment Asset (net) Liability (net) 3. Other Investment Asset (net) Liabiliaty (net) 2)
III. Total (I + II)
IV. Errors and Omissions
V. Overall Balance (III + IV)
VI. Monetary Movements 3)
Changes in Reserves Assets
IMF: Purchases Repurchases
Memorandum: Reserve Assets Posistion 4)
Current Account (% GDP) Debt Service Ratio (%) 5)
a.1. Government Related & Monetary Authorities 6)
2,742 -1,013 -967 -637 126 2,591 2,570 1,500 3,531 10,192 2,093 1,603 1,374 1,224 6,294 7,536 5,443 5,771 4,166 22,916 5,928 7,344 6,668 10,207 30,147 7,045 6,961 7,807 9,279 31,093 34,412 37,345 38,081 29,768 139,606 24,195 28,158 31,289 36,004 119,646 35,084 37,439 39,708 45,970 158,201 -26,876 -31,902 -32,309 -25,603 -116,690 -18,267 -20,814 -24,620 -25,797 -89,499 -28,039 -30,478 -31,901 -36,690 -127,108 -3,071 -3,387 -3,313 -3,227 -12,998 -1,704 -2,199 -2,345 -3,428 -9,675 -2,129 -2,307 -2,286 -2,770 -9,491 -3,093 -4,425 -4,756 -2,881 -15,155 -2,742 -3,776 -4,072 -4,551 -15,140 -3,993 -4,262 -5,385 -6,619 -20,258 1,371 1,356 1,331 1,305 5,364 1,109 1,201 1,248 1,303 4,861 1,169 1,210 1,238 1,334 4,950 -529 2,105 2,370 -5,822 -1,876 1,835 -2,320 2,924 2,564 5,002 5,013 4,661 6,669 9,874 26,218 17 62 187 29 294 19 29 34 14 96 18 0 0 14 32 -546 2,043 2,184 -5,850 -2,170 1,815 -2,349 2,891 2,549 4,906 4,995 4,661 6,669 9,861 26,186 630 197 1,871 720 3,419 628 575 647 779 2,628 2,484 2,298 1,615 3,439 9,836 -1,730 -1,436 -1,517 -1,217 -5,900 -1,276 -872 -340 239 -2,249 -427 -982 -1,191 -300 -2,900 2,360 1,633 3,388 1,937 9,318 1,904 1,447 987 540 4,877 2,911 3,280 2,806 3,739 12,736 1,984 4,188 -74 -4,377 1,721 1,950 1,893 2,972 3,521 10,336 6,159 1,089 5,994 1,964 15,205 -823 60 -65 -467 -1,294 133 362 -331 -307 -144 -409 -152 -121 190 -492 2,807 4,128 -9 -3,910 3,015 1,817 1,532 3,303 3,828 10,480 6,569 1,241 6,114 1,773 15,697 -3,160 -2,342 387 -2,194 -7,309 -763 -4,817 -728 -1,750 -8,058 -3,648 1,274 -939 4,458 1,145 -2,672 -1,974 -1,610 -4,498 -10,755 -241 -2,943 -6,083 -2,585 -11,852 -4,078 1,641 -2,288 2,608 -2,118 -489 -367 1,998 2,304 3,446 -522 -1,874 5,355 834 3,794 430 -367 1,349 1,850 3,263 2,213 1,091 1,404 -6,459 -1,750 4,425 250 4,424 6,095 15,194 7,106 6,264 8,044 11,098 32,512 -1,181 233 -1,493 2,246 -195 -470 802 -879 -2,141 -2,688 -485 -843 -1,089 191 -2,227 1,032 1,324 -89 -4,212 -1,945 3,955 1,052 3,546 3,954 12,506 6,621 5,421 6,955 11,289 30,285 -1,032 -1,324 89 4,212 1,945 -3,955 -1,052 -3,546 -3,954 -12,506 -6,621 -5,421 -6,955 -11,289 -30,285 -1,032 -1,324 89 4,212 1,945 -3,955 -1,052 -3,546 -3,954 -12,506 -6,621 -5,421 -6,955 -11,289 -30,285 0 0 0 0 0 0 0 0 0 0 0 0 0 0 0 0 0 0 0 0 0 0 0 0 0 0 0 0 0 0 0 0 0 0 0 0 0 0 0 0 0 0 0 0 0 58,987 59,453 57,108 51,639 51,639 54,840 57,576 62,287 66,105 66,105 71,823 76,321 86,551 96,207 96,207 2.3 -0.8 -0.7 -0.5 0.0 2.3 2.0 1.0 2.3 1.9 1.3 0.9 0.7 0.7 0.9 16.2 17.8 15.2 24.2 18.1 23.3 25.0 19.8 24.6 23.2 21.2 23.2 20.3 21.3 21.5 4.4 7.7 4.7 9.2 6.4 6.1 10.0 5.3 8.5 7.5 5.0 7.2 4.8 6.2 5.8

Statistics
38 Monetary Policy Report - Quarter I-2011
Notes :
1) Index quarterly changes.
CPI Calculated based on 2002 prices (2002 = 100).
* Started in 1 July 2008. CPI Calculated based on 2007 prices (2007 = 100). quarter II-2008 data is mtm inflation data (month to month) June 2008
Source : BPS-Statistic Indonesia (processed)
Table 7
Inflation Rate by Group of Goods and Services
(Percent)1
Sub Group
5.91 1.28 4.75 0.60 1.44 -1.76 4.94 -0.67 1.67 4.05 5.65 3.46 -0.12 2.59 2.11 0.60 0.91 2.76 -0.75 1.06 3.17 6.90 1.24 9.78 6.81 -2.42 4.14 0.29 13.94 -4.64 2.39 -0.26 6.47 -4.14 0.72 2.02 12.83 -7.24 -1.71 5.84 2.01 12.12 2.94 2.25 -2.52 4.63 -3.25 0.09 -1.92 7.47 -1.67 3.91 7.87 1.84 8.04 4.32 2.24 -0.88 1.60 0.14 0.44 0.55 1.41 0.74 4.05 6.88 -0.19 8.94 -2.51 -0.34 -0.54 1.57 -0.51 0.01 1.12 2.71 0.55 1.89 2.42 1.68 3.79 6.60 2.59 -5.97 6.34 -0.97 4.13 8.96 1.08 4.47 -2.92 28.51 1.84 5.93 0.42 0.18 -2.59 1.18 0.47 -18.67 24.27 3.27 0.66 3.83 1.38 0.89 7.30 1.68 0.71 3.11 8.14 -1.81 0.34 4.43 3.46 1.41 1.70 2.85 -0.07 -10.49 8.28 1.66 -8.24 23.17 0.07 -4.89 30.95 -1.06 20.90 -4.32 15.72 1.47 -1.65 -6.81 -0.81 0.12 -1.30 -1.57 0.85 -0.63 2.05 6.59 5.85 2.02 1.00 3.57 1.20 1.62 0.61 2.37 -1.40 0.67 1.14 2.96 0.62 0.44 4.02 1.33 2.62 2.43 2.40 1.18 2.12 1.90 2.62 1.00 1.86 1.31 1.28 5.50 1.63 2.83 2.35 1.59 1.03 1.46 1.42 2.69 1.32 1.92 1.08 1.19 1.47 1.06 2.15 1.50 5.39 2.15 5.61 2.46 2.86 -1.59 1.91 1.72 0.55 1.89 0.73 2.60 3.70 2.42 0.82 1.06 3.13 1.81 2.27 1.48 1.63 2.25 2.79 1.14 3.58 1.00 0.42 0.26 0.47 0.67 0.67 0.43 2.11 0.82 1.18 2.22 1.67 2.16 0.73 1.00 0.12 0.53 0.70 0.83 0.44 0.82 1.12 1.72 4.69 -0.12 8.94 1.66 -1.48 0.29 0.55 0.83 0.51 0.45 6.03 0.10 0.30 1.45 0.97 1.66 1.10 0.95 0.68 0.75 0.67 0.31 0.42 0.70 0.47 0.69 2.71 0.86 1.71 1.08 1.00 0.53 -0.21 0.25 0.62 0.32 0.90 1.05 0.99 4.30 0.49 0.77 2.58 4.48 -1.88 1.06 2.31 -0.66 2.28 1.05 3.75 0.45 0.81 0.27 3.02 0.35 0.38 0.55 2.49 0.45 1.02 0.74 1.78 0.56 1.11 0.68 0.46 2.15 0.30 0.44 0.29 1.24 0.49 0.44 0.61 1.20 0.35 0.28 0.56 0.64 2.13 0.23 0.26 0.39 1.67 0.37 0.69 0.98 1.64 0.31 0.25 12.66 0.59 -2.46 7.26 13.49 -6.30 -0.37 6.13 -2.88 5.39 0.61 9.44 0.31 3.00 0.83 1.64 1.10 1.27 1.20 0.77 0.59 0.58 0.33 0.77 0.49 1.54 5.12 0.47 1.07 0.69 1.60 1.72 0.85 0.69 0.52 0.32 0.51 0.50 1.79 1.96 1.31 2.19 1.60 1.14 1.39 0.42 0.86 0.65 0.18 0.41 0.47 1.56 1.15 1.10 2.36 1.61 1.39 0.73 1.38 1.38 0.84 0.34 2.07 0.75 2.35 2.32 0.90 1.76 1.26 1.01 0.42 0.83 0.41 0.57 0.43 1.01 0.50 1.36 0.14 0.44 3.77 0.82 0.22 0.22 2.94 0.48 0.18 0.09 2.39 0.60 0.72 0.09 0.18 6.76 0.70 0.04 0.06 4.86 0.62 0.03 0.02 4.42 0.64 0.51 0.72 0.45 4.95 0.32 0.59 0.46 1.27 0.77 0.77 0.17 0.69 0.73 0.50 0.30 0.72 1.14 1.11 0.37 0.16 0.74 0.19 0.30 0.24 1.06 -0.03 0.39 0.20 0.92 0.51 1.02 0.48 0.55 0.74 0.30 0.37 0.15 -0.03 0.56 1.18 0.47 0.20 0.91 0.49 0.51 0.33 0.52 0.75 0.87 0.23 0.53 0.47 1.89 0.37 8.72 0.92 -2.94 -4.66 0.32 1.16 -0.44 0.34 0.21 2.45 -0.32 0.55 0.27 12.98 1.03 -4.46 -6.95 0.54 1.70 -0.73 0.50 0.27 1.59 -0.51 0.81 0.01 -0.12 0.02 0.20 -0.07 -0.31 -0.32 -0.23 -0.40 -0.06 -0.10 -0.11 -0.16 1.40 0.84 1.34 1.64 1.38 0.34 0.87 1.07 0.96 0.55 15.77 0.42 0.64 4.90 0.01 3.89 0.00 0.00 0.00 0.65 0.00 0.00 0.04 0.00 0.00 0.09 3.41 2.46 2.88 0.54 0.36 -0.15 2.07 0.49 0.99 1.41 2.79 1.59 0.70
2008 2009 2010 2011
I II* III IV I II III IV I II III IV I
I. Food A. Cereal and Product B. Meat and Meat Product C. Fresh Fish D. Dried Fish E. Egg and Milk F. Vegetables G. Beans and Nuts H. Fruits I. Species J. Fat and Oil K. Others
II. Prepared Food. Beverage. Cigarettes and Cloves A. Prepared Food B. Non-alcoholic-Beverage C. Cigarettes. Cloves. and Alcoholic Beverage
III. Housing A. Home Owner Cost B. Fuel. Electricity. and Water C. Household Equipment D. Household Operation IV. Clothing A. Clothing for Men B. Clothing for Women C. Clothing for Children D. Personal Effect and Other Clothing
V. Health A. Medical Care and Medicine B. Medicine C. Personal Care D. Personal Care and Cosmetics
VI. Education. Culture. Sport. and Entertainment A. Education B. Courses and Training C. Education Equipment D. Recreation E. Sport
VII. Transportation and Communication A. Transportation B. Communication and Delivery C. Transport Facility D. Financial Service
GENERAL

Statistics
39Monetary Policy Report - Quarter I-2011
Table 8
Inflation Rate Contribution in 44 Cities (cont.)
(Percent)1
Cities
4.84 4.38 2.92 2.97 -0.56 -0.37 4.37 0.53 -0.09 1.17 0.05 5.99 0.62 3.49 2.75 1.36 1.39 0.35 0.14 4.12 -1.08 0.44 -0.33 1.47 3.01 0.26 4.65 2.53 1.27 1.56 -0.03 -1.07 2.66 0.33 0.38 2.13 0.82 3.92 0.87 4.63 2.31 3.06 2.22 -0.52 -0.01 3.45 -1.28 1.21 2.60 2.67 4.89 0.79 3.07 2.88 1.37 1.33 -0.20 0.10 3.26 -0.41 1.04 2.89 1.08 4.37 1.19 2.19 2.07 1.21 2.26 -0.84 -0.17 3.35 0.38 1.05 2.12 1.52 2.76 0.32 4.35 4.09 2.04 2.07 0.04 -1.34 2.79 0.59 1.02 2.41 0.74 3.47 1.46 4.15 2.46 3.17 0.55 0.48 -0.54 1.70 0.30 0.79 1.72 1.83 2.48 1.51 2.91 2.29 1.72 0.58 0.64 -0.43 1.76 -0.09 1.72 1.67 1.76 2.05 0.70 2.16 4.19 1.76 -0.19 0.26 -0.72 2.37 0.58 1.53 3.22 2.37 3.02 -0.80 3.11 3.41 3.20 -0.29 -0.06 0.09 1.57 0.25 0.58 1.18 2.50 1.65 -0.27 4.09 4.14 3.61 0.34 0.09 -0.74 4.06 -0.48 1.35 2.15 3.88 1.43 0.20 3.29 2.93 4.95 0.74 0.92 -1.29 4.85 -0.25 0.15 2.53 4.39 2.57 1.11 6.53 4.20 4.26 0.13 -0.78 -0.74 3.16 0.57 1.37 0.41 5.18 2.15 1.92 - 3.80 3.04 1.22 -0.74 -0.77 3.52 -1.14 0.26 2.60 2.21 3.71 -0.25 - 2.45 3.33 1.19 0.32 -0.73 1.29 0.55 0.80 2.12 1.66 1.45 1.28 3.51 1.94 2.54 - - - - 0.58 0.92 1.21 2.63 1.32 0.68 2.57 2.54 3.64 - - - - 1.15 1.33 0.82 1.80 1.48 0.77 - 2.21 4.50 - - - - -0.07 0.31 1.87 1.54 2.33 -0.40 - 3.04 3.21 0.00 0.32 -0.06 2.03 0.19 0.74 1.32 2.46 1.44 0.53 - 2.11 0.88 1.57 0.63 0.36 1.89 0.20 0.87 1.60 1.69 1.82 0.30 - 1.15 2.38 0.46 0.79 -0.27 1.72 -0.08 1.11 1.44 2.74 1.15 0.50 - 2.80 3.42 1.32 1.67 0.35 1.25 0.18 0.61 1.02 2.96 0.75 0.32 - 1.24 3.82 0.03 0.01 -0.26 1.76 0.41 1.26 2.08 2.85 1.47 0.94 - 2.45 3.49 0.18 -0.87 -0.20 2.43 -0.03 0.75 2.23 2.52 2.25 0.55 2.81 2.76 2.28 -0.07 0.11 -0.14 1.64 0.50 0.84 0.47 2.21 0.93 0.26 3.52 3.33 4.04 0.19 0.91 0.04 2.49 0.62 0.36 1.25 3.52 1.44 -0.31 3.60 2.75 3.53 1.16 0.78 0.11 1.17 0.73 1.11 1.23 2.20 1.37 0.69 2.74 2.13 1.74 0.13 1.06 0.19 1.21 0.14 0.68 1.58 1.91 2.33 -0.83 4.18 2.40 2.83 0.18 0.72 0.06 1.96 0.41 1.02 1.23 3.33 1.37 0.37 2.72 1.82 2.36 0.45 1.05 1.05 3.15 0.47 0.62 1.48 2.65 1.83 0.39 2.85 2.51 3.16 - - - - 0.30 1.00 1.65 2.91 1.63 1.14 2.73 3.46 2.77 - - - - 1.35 -0.02 1.99 2.35 2.60 0.80 - 1.62 2.83 1.05 0.25 0.14 1.90 0.42 0.52 1.44 3.69 0.97 0.11 2.94 2.11 3.10 -0.35 0.90 0.02 2.04 0.61 0.63 1.95 2.23 1.83 -0.15 4.06 2.77 2.93 0.38 1.28 0.16 1.38 0.54 1.00 1.23 2.57 1.75 0.73 - 1.81 3.85 0.00 0.60 0.07 1.84 1.00 0.72 1.82 3.46 0.54 1.20 - 4.05 2.27 -0.32 1.02 0.00 1.52 0.82 0.83 1.15 2.39 2.02 0.80 3.59 2.00 2.56 0.14 1.06 -0.41 1.97 0.74 0.63 1.29 3.93 1.32 1.25 3.35 1.78 3.14 - - - - 1.02 1.42 1.26 3.77 1.44 1.26 3.23 3.21 3.23 - - - - -0.65 2.33 2.70 3.34 2.28 -0.07 - 4.94 3.16 0.77 2.41 -1.12 2.06 0.71 1.53 1.15 2.23 1.31 0.63 - 2.24 6.66 -2.44 0.39 1.10 3.47 0.19 2.11 2.52 3.02 0.60 0.86 3.33 2.31 0.46 - - - - 2.39 3.25 2.24 3.08 1.06 2.32 4.21 2.27 3.21 - - - - -0.88 2.51 0.03 4.75 1.03 1.42 - 2.94 2.73 0.02 0.38 -0.90 2.44 -0.74 3.55 0.11 4.61 -1.24 2.31 1.60 2.87 1.72 - - - - 1.09 1.62 2.02 2.65 2.91 0.72 4.48 2.22 3.62 - - - - 1.66 1.32 2.21 3.64 2.01 0.06 4.12 2.48 2.23 - - - - 1.41 1.50 2.87 2.86 1.54 0.47 3.75 2.88 1.84 - - - - 0.69 2.55 0.76 4.14 -0.21 2.38 3.97 3.32 2.96 - - - - 0.29 2.07 0.74 3.28 0.75 2.77
2008 2009 2010 2011
I II* III IV I II III IV I II III IV I
1. Lhokseumawe2. Banda Aceh3. Padang Sidempuan4. Sibolga5. Pematang Siantar6. M e d a n7. Padang8. Pekanbaru9. Batam10. Jambi11. Palembang12. Bengkulu13. Bandar Lampung14. Pangkal Pinang15. Dumai16. Tanjung Pinang17. Jakarta18. Tasikmalaya19. Serang20. Tangerang21. Cilegon22. Bogor23. Sukabumi24. Bekasi25. Depok26. Bandung27. Cirebon28. Purwokerto29. Surakarta30. Semarang31. Tegal32. Yogyakarta33. Jember34. Sumenep35. Kediri36. Malang37. Probolinggo38. Madiun39. Surabaya40. Denpasar41. Mataram42. Bima43. Maumere44. Kupang45. Pontianak46. Singkawang47. Sampit48. Palangka Raya49. Banjarmasin50. Balikpapan51. Samarinda
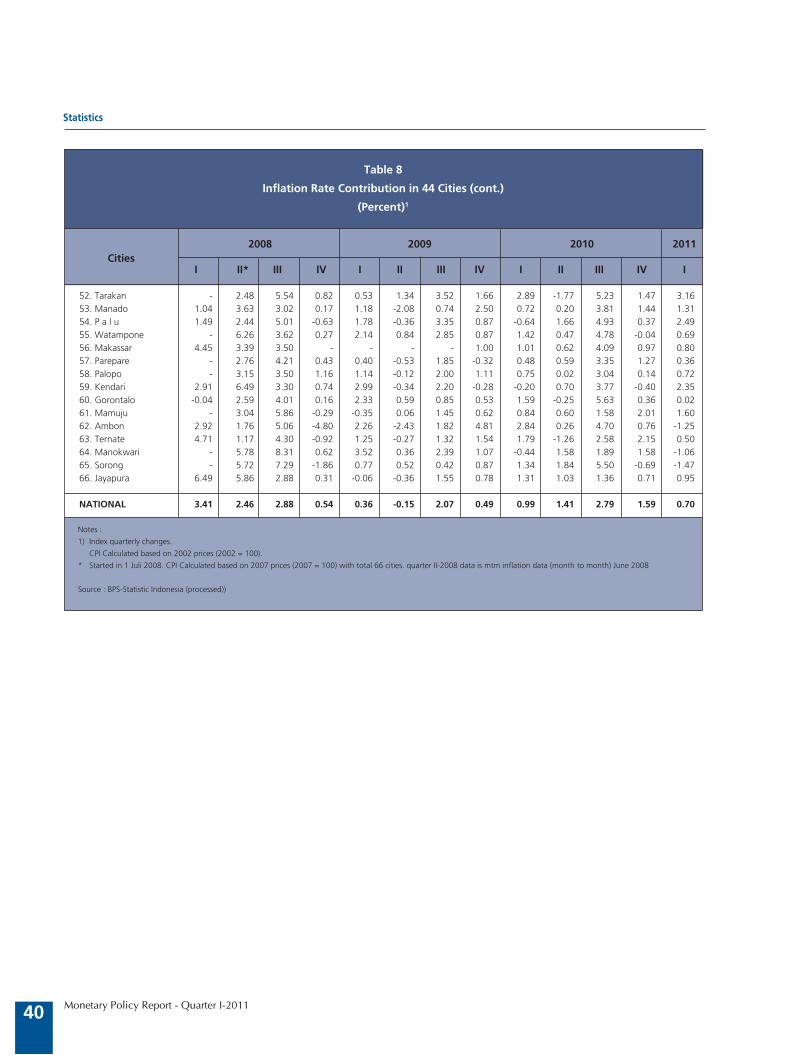
Statistics
40 Monetary Policy Report - Quarter I-2011
Notes :
1) Index quarterly changes.
CPI Calculated based on 2002 prices (2002 = 100).
* Started in 1 Juli 2008. CPI Calculated based on 2007 prices (2007 = 100) with total 66 cities. quarter II-2008 data is mtm inflation data (month to month) June 2008
Source : BPS-Statistic Indonesia (processed))
Table 8
Inflation Rate Contribution in 44 Cities (cont.)
(Percent)1
Cities
- 2.48 5.54 0.82 0.53 1.34 3.52 1.66 2.89 -1.77 5.23 1.47 3.16 1.04 3.63 3.02 0.17 1.18 -2.08 0.74 2.50 0.72 0.20 3.81 1.44 1.31 1.49 2.44 5.01 -0.63 1.78 -0.36 3.35 0.87 -0.64 1.66 4.93 0.37 2.49 - 6.26 3.62 0.27 2.14 0.84 2.85 0.87 1.42 0.47 4.78 -0.04 0.69 4.45 3.39 3.50 - - - - 1.00 1.01 0.62 4.09 0.97 0.80 - 2.76 4.21 0.43 0.40 -0.53 1.85 -0.32 0.48 0.59 3.35 1.27 0.36 - 3.15 3.50 1.16 1.14 -0.12 2.00 1.11 0.75 0.02 3.04 0.14 0.72 2.91 6.49 3.30 0.74 2.99 -0.34 2.20 -0.28 -0.20 0.70 3.77 -0.40 2.35 -0.04 2.59 4.01 0.16 2.33 0.59 0.85 0.53 1.59 -0.25 5.63 0.36 0.02 - 3.04 5.86 -0.29 -0.35 0.06 1.45 0.62 0.84 0.60 1.58 2.01 1.60 2.92 1.76 5.06 -4.80 2.26 -2.43 1.82 4.81 2.84 0.26 4.70 0.76 -1.25 4.71 1.17 4.30 -0.92 1.25 -0.27 1.32 1.54 1.79 -1.26 2.58 2.15 0.50 - 5.78 8.31 0.62 3.52 0.36 2.39 1.07 -0.44 1.58 1.89 1.58 -1.06 - 5.72 7.29 -1.86 0.77 0.52 0.42 0.87 1.34 1.84 5.50 -0.69 -1.47 6.49 5.86 2.88 0.31 -0.06 -0.36 1.55 0.78 1.31 1.03 1.36 0.71 0.95 3.41 2.46 2.88 0.54 0.36 -0.15 2.07 0.49 0.99 1.41 2.79 1.59 0.70
52. Tarakan53. Manado54. P a l u55. Watampone56. Makassar57. Parepare58. Palopo59. Kendari60. Gorontalo61. Mamuju62. Ambon63. Ternate64. Manokwari65. Sorong66. Jayapura
NATIONAL
2008 2009 2010 2011
I II* III IV I II III IV I II III IV I
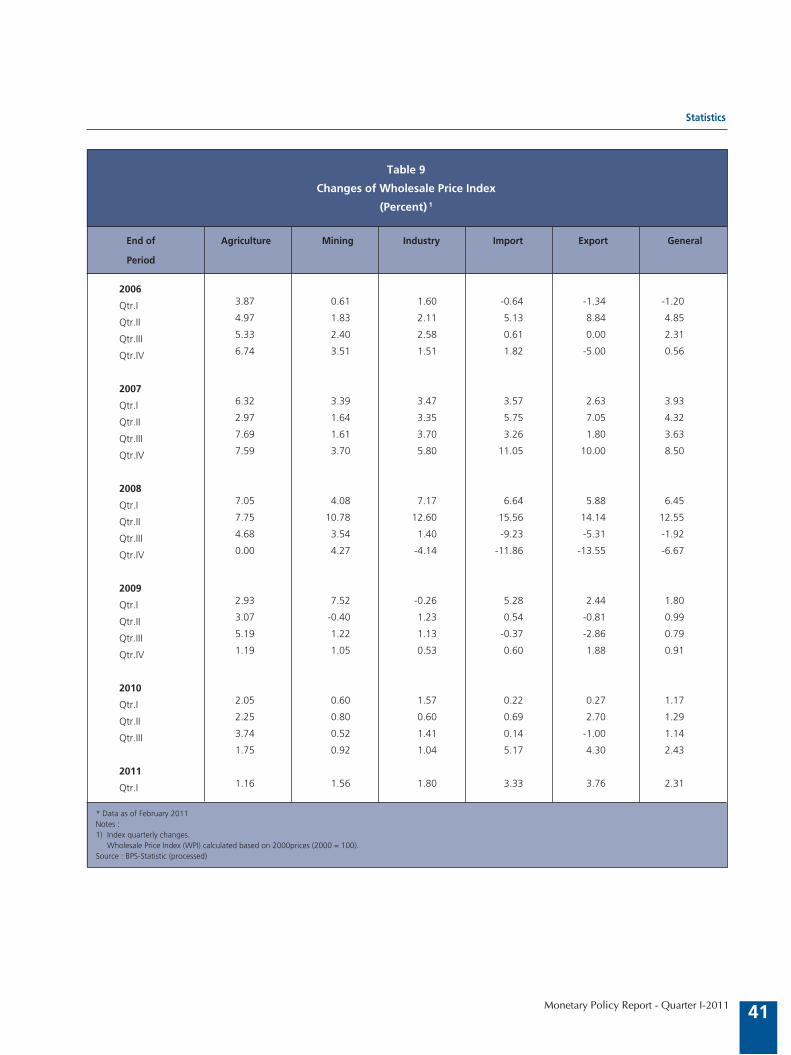
Statistics
41Monetary Policy Report - Quarter I-2011
* Data as of February 2011 Notes :1) Index quarterly changes. Wholesale Price Index (WPI) calculated based on 2000prices (2000 = 100).Source : BPS-Statistic (processed)
Table 9
Changes of Wholesale Price Index
(Percent) 1
End of Agriculture Mining Industry Import Export General
Period
3.87 0.61 1.60 -0.64 -1.34 -1.20
4.97 1.83 2.11 5.13 8.84 4.85
5.33 2.40 2.58 0.61 0.00 2.31
6.74 3.51 1.51 1.82 -5.00 0.56
6.32 3.39 3.47 3.57 2.63 3.93
2.97 1.64 3.35 5.75 7.05 4.32
7.69 1.61 3.70 3.26 1.80 3.63
7.59 3.70 5.80 11.05 10.00 8.50
7.05 4.08 7.17 6.64 5.88 6.45
7.75 10.78 12.60 15.56 14.14 12.55
4.68 3.54 1.40 -9.23 -5.31 -1.92
0.00 4.27 -4.14 -11.86 -13.55 -6.67
2.93 7.52 -0.26 5.28 2.44 1.80
3.07 -0.40 1.23 0.54 -0.81 0.99
5.19 1.22 1.13 -0.37 -2.86 0.79
1.19 1.05 0.53 0.60 1.88 0.91
2.05 0.60 1.57 0.22 0.27 1.17
2.25 0.80 0.60 0.69 2.70 1.29
3.74 0.52 1.41 0.14 -1.00 1.14
1.75 0.92 1.04 5.17 4.30 2.43
1.16 1.56 1.80 3.33 3.76 2.31
2006
Qtr.I
Qtr.II
Qtr.III
Qtr.IV
2007
Qtr.I
Qtr.II
Qtr.III
Qtr.IV
2008
Qtr.I
Qtr.II
Qtr.III
Qtr.IV
2009
Qtr.I
Qtr.II
Qtr.III
Qtr.IV
2010
Qtr.I
Qtr.II
Qtr.III
2011
Qtr.I