jk cement ltd
TRANSCRIPT

JK Cement Ltd.
Company Update January 02, 2019
Aspiring Pan-India Player

Co
mp
any
Up
dat
e
January 02, 2019
JK Cement Downside
Scenario
Current
Price
Price
Target
85919.4%
Upside
Scenario
STRONG BUY
719
Capacity Expansion to tap demand growth
JK Cement Limited is adding 4.2mt of cement capacity through the brownfieldroute in the North region by FY20. Post expansion, we believe the company willhave a higher presence in the adjoining states of Uttar Pradesh and Gujarat dueto the setting up of grinding units in the states. We initiate coverage on thestock with a STRONG BUY at a target price of INR 859, valuing at an average of$90 EV/Ton and 10x EV/EBITDA.
White cement performance continues to act as backbone• Being the third largest producer of white cement in the world, the company
has a significant proportion of its revenue (~33% in FY18) from thissegment.
• Although white cement consumes higher power and raw materials, itcommands significantly higher realization and EBITDA margin of 28-30%(with ~5x EBITDA/Ton of grey cement in FY18). Going forward, we believethe white cement business will act as a sustainable source of earnings witha growth of 7-8% between FY18-21E. Margins are expected to be stable dueto the company’s ability to pass through any hike in input costs.
One of the few mid cap companies with a diversified presence• JKCL is one of the few mid-cap companies with a diversified presence across
North, South and Central regions. This enables the company to focus moreon regions with improving utilization levels, such as the Northern region.
4.2mt capacity expansion to solidify market share in North• The company has initiated a capacity expansion of 4.2mt, which includes a
7500 TPD clinker unit and 1mt grinding unit each at Nimbahera andMangrol (through the brownfield route) as well as a grinding unit of 1.5mtin Aligarh, UP and 0.7mt in Balsinor, Gujarat.
ValuationsWe expect JKCL to report a revenue CAGR of 6.2% over FY18-21E to achieve INR6018cr of net sales in FY21E. This is mainly driven by a grey cement volumeCAGR of 7.8% on the back of capacity addition and consolidation of its presencein the North. We estimate contribution of white cement to the top-line toremain the same. EBITDA is expected to grow at a CAGR of 5.9% with marginsimprovement led by savings in logistics cost (post commissioning of GU) andP&F cost (post commissioning of 13MW WHRS). At CMP of INR 719/share, JKCLtrades at an EV/EBITDA of 8.7x on FY21E earnings and an EV/Ton of $80 onFY21E capacity (14.7mt). We value JKCL’s present capacity of 10.5mt at EV/Tonof $90 (asset-based) and EV/EBITDA at 10x (earnings-based) to reach at anaverage target price of INR 859/share, giving a potential upside of 19.4%.
Market Data
Industry Cement
Sensex 36198
Nifty 10869
Bloomberg Code JKCE:IN
Eq. Cap. (INR Crores) 72.2
Face Value (INR) 10
52-w H/L 649/1195
Market Cap (INR Crores) 5038
Valuation Data FY18 FY19E FY20E
P/E (x) 25.0 26.3 23.6
EV/EBITDA(x) 12.1 10.8 9.8
EV/Ton(x) 130.1 114.0 112.7
JK Cement vs SENSEX
Sep’18 Jun’18 Sep’17
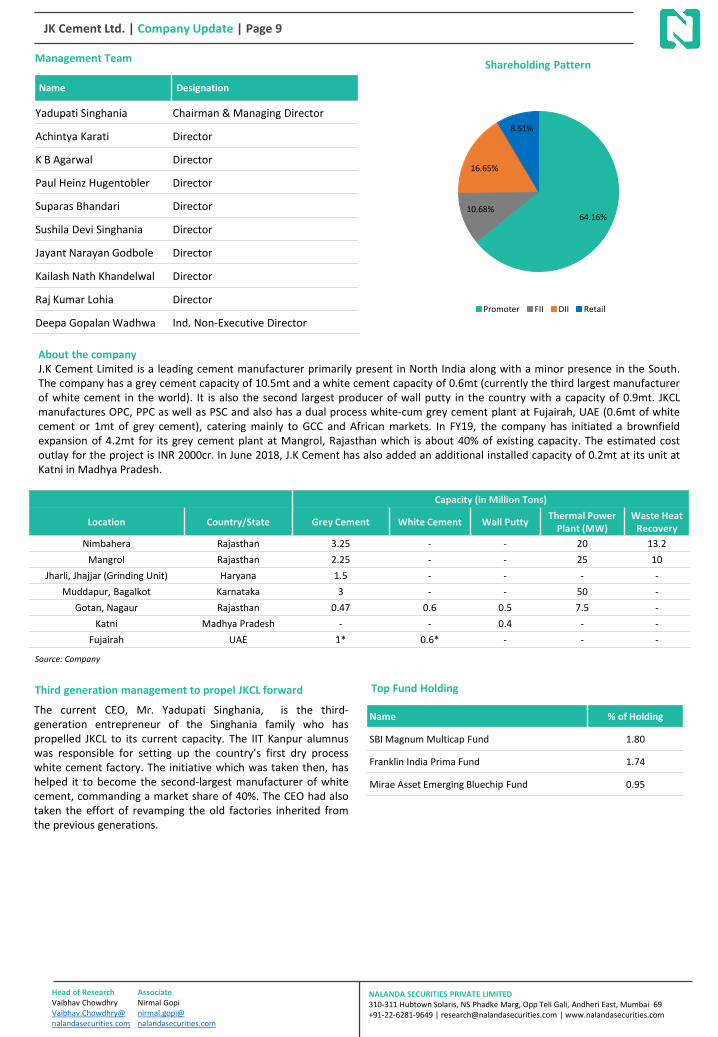
Promoters 64.16 64.16 64.16
FIIs 10.68 9.95 11.2
DIIs 16.65 17.17 16.35
Retail 8.51 8.72 8.29
Total 100.0 100.0 100.0
Shareholding Pattern (in %)
*
Revenue Growth CAGR FY18-FY21E : 6.2%
EBITDA Growth CAGR FY18-FY21E : 5.9%
PAT Growth CAGR FY18-FY21E : 1%
* Read last page for disclaimer & rating rationale
Particulars (INR Crores) FY17 FY18 FY19E FY20E FY21E
Net Sales 4654.0 5020.5 5168.7 5542.5 6018.5
Growth 6.5% 7.9% 3.0% 7.2% 8.6%
EBITDA 726.1 787.5 786.0 851.4 936.4
Growth 32.9% 8.4% -0.2% 8.3% 10.0%
PAT 172.0 285.6 224.8 219.7 294.0
Growth 213.6% 66.1% -21.3% -2.3% 33.8%
EBITDA Margin(%) 15.6% 15.7% 15.2% 15.4% 15.6%
PAT Margin(%) 3.7% 5.7% 4.4% 4.0% 4.9%
EPS 24.6 40.8 31.1 30.4 40.7
P/E 30.4 25.0 26.3 23.6 17.7
EV/EBITDA 11.2 12.1 10.8 9.8 8.7
EV/Ton 115.6 130.1 114.0 112.7 80.0Source: Company, NSPL Research
Head of ResearchVaibhav ChowdhryVaibhav.Chowdhry@ nalandasecurities.com
NALANDA SECURITIES PRIVATE LIMITED310-311 Hubtown Solaris, NS Phadke Marg, Opp Teli Gali, Andheri East, Mumbai 69+91-22-6281-9649 | [email protected] | www.nalandasecurities.com
AssociateNirmal Gopinirmal.gopi@ nalandasecurities.com
Institutional Research
0
100
200
300
400
500
600
700
12-2
013
04-2
014
08-2
014
12-2
014
04-2
015
08-2
015
12-2
015
04-2
016
08-2
016
12-2
016
04-2
017
08-2
017
12-2
017
04-2
018
08-2
018
12-2
018
JK Cement SENSEX

Investment Rationale
JK Cement Ltd. | Company Update | Page 3
Capacity Expansion on track to maintain market share• JKCL is undergoing a capacity expansion of 4.2mt in the
northern region. This entails a brownfield expansion ofits integrated facilities at Nimbahera and Mangrol inRajasthan (1mt each) as well as grinding units of 1.5mtat Aligarh, UP and 0.7mt at Balsinor, Gujarat. The overallcapital expenditure for the projects is estimated at INR2000cr which will be funded mainly through internalaccruals and a small portion through debt over a span of2 years. The project is on track and the capacities areexpected to be commissioned in phases (Nimbahera GUby Q1FY20, Mangrol GU by Q2FY20, Mangrol clinker unitand Aligarh GU by Q3FY20 and the Gujarat GU byQ4FY20).
• The Gujarat GU is expected to further increase itspresence in the Western markets which can improve itsrealization by INR200-300/ton.
• This expansion will also enable the company to partiallyoffset a dip in its market share in Rajasthan, due to theramp up of Binani assets by Ultratech (leading to supplypressure in the near term).
• The company also commissioned an additional line ofwhite-cement based wall putty of 0.2mt in Katni,Madhya Pradesh in FY19, leading to a total capacity of0.9mt.
White cement segment to continue to act as pillar forvolatile grey cement business• White cement is similar to grey cement in all aspects,
except for its high degree of whiteness. This is mainlyused for prestige construction projects and fordecorative purposes. White cement is combined withinorganic pigments to manufacture bright colouredconcretes and mortars.
Strong revenue growth expected going ahead
Consolidated Sales Volume (White and Grey Cement)
27
96
34
07
43
69
4654
50
20
51
69
55
42
60
18
-3.99%
21.87%
28.22%
6.53%7.87%
2.95%
7.23%8.59%
-5%
0%
5%
10%
15%
20%
25%
30%
35%
0
1000
2000
3000
4000
5000
6000
7000
FY1
4
FY1
5
FY1
6
FY1
7
FY1
8
FY1
9E
FY2
0E
FY2
1E
%
INR
Cro
res
Revenue % Growth YoY
857
941
1,30
5
1,48
3
1,58
5
1,67
9
1,78
6
1,92
11,92
5
2,39
6
2,46
0
2,48
9 3,21
2
3,43
8
3,69
9
4,03
8
31%
28%
35%
37%
33%
33% 33%32%
27%
29%
31%
33%
35%
37%
39%
0
1000
2000
3000
4000
5000
6000
7000
FY1
4
FY1
5
FY1
6
FY1
7
FY1
8
FY1
9E
FY2
0E
FY2
1E
%
INR
Cro
res
White Cement Grey Cement
White Cement as a % of Total
0.4
76
0.4
89
0.7
90
0.8
80
0.9
19
0.9
47
0.98
0
1.0
19
8.2%
2.7%
61.6%
11.4%
4.4% 3.0% 3.5% 4.0%
-10%
0%
10%
20%
30%
40%
50%
60%
70%
0.0
0.2
0.4
0.6
0.8
1.0
1.2
FY1
4
FY1
5
FY1
6
FY1
7
FY1
8
FY1
9E
FY2
0E
FY2
1E
%
Mill
ion
To
ns
Sales Volume (White Cement) % Growth YoY (WC)
5.36
6.29
6.86
6.79
7.88
8.72
9.24
9.88
-5.0%
17.4%
9.1%
-1.0%
16.1%
10.6%
6.0%7.0%
-10%
-5%
0%
5%
10%
15%
20%
0.0
2.0
4.0
6.0
8.0
10.0
12.0
FY1
4
FY1
5
FY1
6
FY1
7
FY1
8
FY1
9E
FY2
0E
FY2
1E
%
Mill
ion
To
ns
Sales Volume (Grey Cement) % Growth YoY (GC)
Source: Company, NSPL Research
Revenue share of white cement to remain largely constant
Head of ResearchVaibhav ChowdhryVaibhav.Chowdhry@ nalandasecurities.com
NALANDA SECURITIES PRIVATE LIMITED310-311 Hubtown Solaris, NS Phadke Marg, Opp Teli Gali, Andheri East, Mumbai 69+91-22-6281-9649 | [email protected] | www.nalandasecurities.com
AssociateNirmal Gopinirmal.gopi@ nalandasecurities.com

Foray into the lucrative central region post FY21• JKCL is also planning to enter the central region post its
Northern expansion, through a 3mt greenfield integratedcement unit at Panna, MP. The mining lease andenvironment clearance has been received and theestimated capex for the same is INR 1750-2000cr. Theproject is expected to begin post FY21.
• This is expected to boost the realization and in turnEBITDA/Ton for the company as the region has afavourable demand-supply gap with the top companieshaving utilization levels in the range of 85%-90%.
• This expansion will also make JK Cement a pan-Indiaplayer with plants in North, Central and South India.Through these plants, the company now caters todemand across all regions except East (company has GUin West India)
Premiumization to further aid realization• The company recently launched a premium brand of grey
cement called “JK Super Strong Cement” in South India
JK Cement Ltd. | Company Update | Page 4
• Since obtaining this whiteness requires a comprehensivemodification to the manufacturing process, the cost ofmanufacturing (including power and fuel costs) is higherwhich in turn leads to a higher realization for the product.
• JK Cement, being the second largest white cementproducer in the country, achieves significant pricingpower due to the limited number of substitutes available.JKCL is also the second largest wall putty producer in Indiawith an installed capacity of 0.9mt.
• This segment will offset the volatility of the grey cementbusiness (volatile due to higher competitive intensity, lowpricing power). To improve pricing power of grey cementand in turn EBITDA, the company has also taken efforts toimprove the trade mix, at the expense of reduction inmarket share. The trade mix as of Q2FY19 stood at 72% vs65% in Q2FY18 and the company aims to reduce the pricegap between trade and non-trade segments.
Higher mix of premium products and trade sales to improve realization
Source: Company, NSPL Research
Contribution of White Cement to Revenue and EBITDA
EBITDA/Ton of Product Segments
3591
3809
3471
3646
3906
3945
4004
4085
6.1%
-8.9%
5.0%
7.1%
1.0% 1.5% 2.0%
-10%
-8%
-6%
-4%
-2%
0%
2%
4%
6%
8%
10%
3100
3200
3300
3400
3500
3600
3700
3800
3900
4000
4100
4200
FY1
4
FY1
5
FY1
6
FY1
7
FY1
8
FY1
9E
FY2
0E
FY2
1E
%INR
GC Realization/Ton % Growth YoY (GC)
9877
9893
1036
4
1043
5
1032
1
1052
8
1075
9
1108
2
0.2%
4.8%
0.7%
-1.1%
2.0% 2.2%
3.0%
-2%
-1%
0%
1%
2%
3%
4%
5%
6%
9200
9400
9600
9800
10000
10200
10400
10600
10800
11000
11200
FY1
4
FY1
5
FY1
6
FY1
7
FY1
8
FY1
9E
FY2
0E
FY2
1E
%INR
WC Realization/Ton (Incl. Putty) % Growth YoY (WC)
253 309 315482 460 433 452 474
2501
2697
2514
27802672
2563 26162701
0
500
1000
1500
2000
2500
3000
FY1
4
FY1
5
FY1
6
FY1
7
FY1
8
FY1
9E
FY2
0E
FY2
1E
INR
Grey Cement White Cement (Incl. Wall Putty)
Head of ResearchVaibhav ChowdhryVaibhav.Chowdhry@ nalandasecurities.com
NALANDA SECURITIES PRIVATE LIMITED310-311 Hubtown Solaris, NS Phadke Marg, Opp Teli Gali, Andheri East, Mumbai 69+91-22-6281-9649 | [email protected] | www.nalandasecurities.com
AssociateNirmal Gopinirmal.gopi@ nalandasecurities.com
31%28%
35%37%
33% 33% 33% 32%
62%57% 59%
55%52% 52% 51% 50%
0%
10%
20%
30%
40%
50%
60%
70%
FY14 FY15 FY16 FY17 FY18 FY19E FY20E FY21E
%
EBITDA Revenue

JKCL expected to reduce leverage post expansion by FY21E
JK Cement Ltd. | Company Update | Page 5
• The product is priced INR~20-25 more than the traditionalproduct and is expected to be introduced in the North aswell, thus further improving realization.
Leverage to taper post commissioning of capacities• JKCL has reduced gross debt from INR 3320cr at the end of
FY16 to INR 2940cr at the end of FY18. The company hasrecently raised debt to the tune of ~INR 1300cr for itsexpansion.
• Post the expansion, the company is expected to generatea FCF of ~INR 665cr which will partially be used for therepayment of debt. Net debt-to-EBITDA and net debt-to-equity is expected to reduce to 3.1x and 1x respectively.
• ROCE and ROE are also expected to increase considerablypost expansion.
Key Risks• Input cost pressures may impact margins which may further lead to inability of debt repayment.• A delay in the commissioning of its on-going projects may impact growth.• Due to leverage in the balance sheet, the firm may be vulnerable to a rising interest rate environment• A slowdown in the demand recovery in JKCL’s key markets may affect pricing of its products.
Margins poised to increase with ease of input cost pressure Prudent use of capital to improve return ratios
6.76.3
5.4
4.0
3.0 3.33.7
3.1
1.7 1.61.3
2.02.4
2.1 1.92.3
0
1
2
3
4
5
6
7
8FY
14
FY1
5
FY1
6
FY1
7
FY1
8
FY1
9E
FY2
0E
FY2
1E
Rat
io (
x)
Net Debt-to-EBITDA Interest Coverage
5.9%
7.4%
8.1%
12.1%
13.9% 10.8% 10.4%
11.6%
4.3%
9.0%
3.5%
10.1%
14.5%
8.6%8.0%
9.9%
0%
2%
4%
6%
8%
10%
12%
14%
16%
FY1
4
FY1
5
FY1
6
FY1
7
FY1
8
FY1
9E
FY2
0E
FY2
1E
%
ROCE ROE
12.6%13.2%
12.5%
15.6% 15.7% 15.2% 15.4% 15.6%
2.7%
4.2%
1.3%
3.7%
5.7%4.4% 4.0%
4.9%
0%
2%
4%
6%
8%
10%
12%
14%
16%
18%
FY1
4
FY1
5
FY1
6
FY1
7
FY1
8
FY1
9E
FY2
0E
FY2
1E
EBITDA Margin PAT Margin
Source: NSPL Research
Head of ResearchVaibhav ChowdhryVaibhav.Chowdhry@ nalandasecurities.com
NALANDA SECURITIES PRIVATE LIMITED310-311 Hubtown Solaris, NS Phadke Marg, Opp Teli Gali, Andheri East, Mumbai 69+91-22-6281-9649 | [email protected] | www.nalandasecurities.com
AssociateNirmal Gopinirmal.gopi@ nalandasecurities.com
272
294
312
333
357
1%
8%
6%7%
7%
0%
1%
2%
3%
4%
5%
6%
7%
8%
9%
0
50
100
150
200
250
300
350
400
FY1
7
FY1
8
FY1
9E
FY2
0E
FY2
1E
%
Mill
ion
To
ns
Demand % Growth YoY
Industry Dynamics to favour future growth
JK Cement Ltd. | Company Update | Page 6
• The Indian cement industry is the second largest producerin the world after China with a capacity of ~414mt inFY18. This is expected to grow to ~477mt in FY21 as percapacity additions announced by companies.
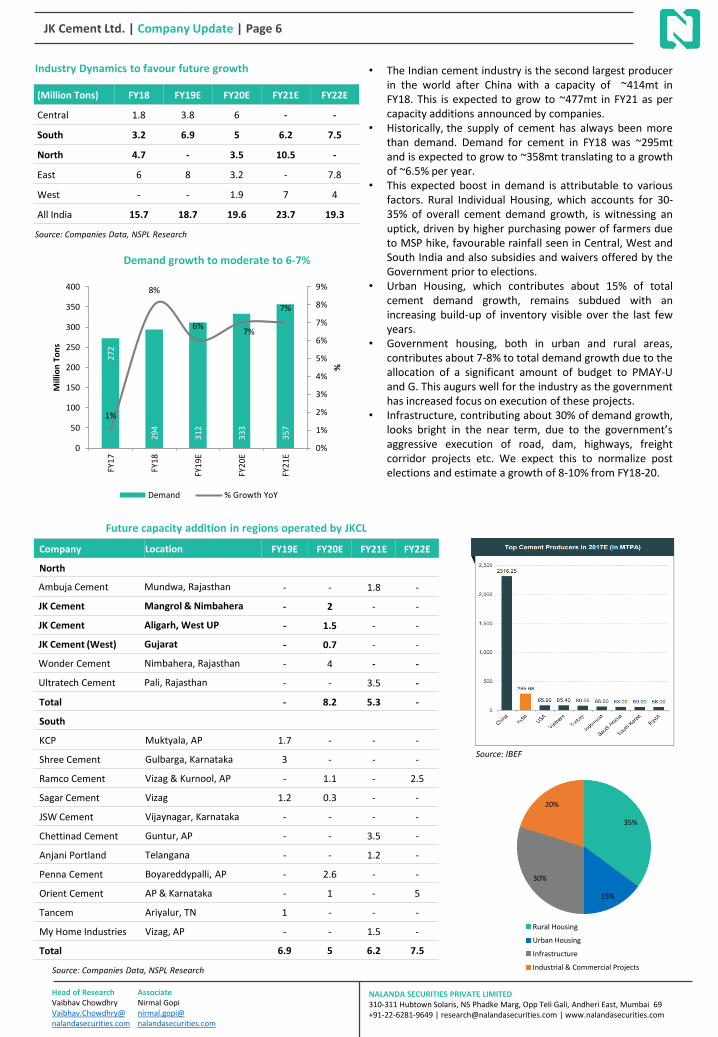
• Historically, the supply of cement has always been morethan demand. Demand for cement in FY18 was ~295mtand is expected to grow to ~358mt translating to a growthof ~6.5% per year.
• This expected boost in demand is attributable to variousfactors. Rural Individual Housing, which accounts for 30-35% of overall cement demand growth, is witnessing anuptick, driven by higher purchasing power of farmers dueto MSP hike, favourable rainfall seen in Central, West andSouth India and also subsidies and waivers offered by theGovernment prior to elections.
• Urban Housing, which contributes about 15% of totalcement demand growth, remains subdued with anincreasing build-up of inventory visible over the last fewyears.
• Government housing, both in urban and rural areas,contributes about 7-8% to total demand growth due to theallocation of a significant amount of budget to PMAY-Uand G. This augurs well for the industry as the governmenthas increased focus on execution of these projects.
• Infrastructure, contributing about 30% of demand growth,looks bright in the near term, due to the government’saggressive execution of road, dam, highways, freightcorridor projects etc. We expect this to normalize postelections and estimate a growth of 8-10% from FY18-20.
(Million Tons) FY18 FY19E FY20E FY21E FY22E
Central 1.8 3.8 6 - -
South 3.2 6.9 5 6.2 7.5
North 4.7 - 3.5 10.5 -
East 6 8 3.2 - 7.8
West - - 1.9 7 4
All India 15.7 18.7 19.6 23.7 19.3
Company Location FY19E FY20E FY21E FY22E
North
Ambuja Cement Mundwa, Rajasthan - - 1.8 -
JK Cement Mangrol & Nimbahera - 2 - -
JK Cement Aligarh, West UP - 1.5 - -
JK Cement (West) Gujarat - 0.7 - -
Wonder Cement Nimbahera, Rajasthan - 4 - -
Ultratech Cement Pali, Rajasthan - - 3.5 -
Total - 8.2 5.3 -
South
KCP Muktyala, AP 1.7 - - -
Shree Cement Gulbarga, Karnataka 3 - - -
Ramco Cement Vizag & Kurnool, AP - 1.1 - 2.5
Sagar Cement Vizag 1.2 0.3 - -
JSW Cement Vijaynagar, Karnataka - - - -
Chettinad Cement Guntur, AP - - 3.5 -
Anjani Portland Telangana - - 1.2 -
Penna Cement Boyareddypalli, AP - 2.6 - -
Orient Cement AP & Karnataka - 1 - 5
Tancem Ariyalur, TN 1 - - -
My Home Industries Vizag, AP - - 1.5 -
Total 6.9 5 6.2 7.5
Demand growth to moderate to 6-7%
Future capacity addition in regions operated by JKCL
Source: Companies Data, NSPL Research
Source: Companies Data, NSPL Research
35%
15%
30%
20%
Rural Housing
Urban Housing
Infrastructure
Industrial & Commercial Projects
Source: IBEF
Head of ResearchVaibhav ChowdhryVaibhav.Chowdhry@ nalandasecurities.com
NALANDA SECURITIES PRIVATE LIMITED310-311 Hubtown Solaris, NS Phadke Marg, Opp Teli Gali, Andheri East, Mumbai 69+91-22-6281-9649 | [email protected] | www.nalandasecurities.com
AssociateNirmal Gopinirmal.gopi@ nalandasecurities.com
JK Cement Ltd. | Company Update | Page 7
• The North and South region, which are JKCL’s key markets, historically has had a weak demand-supply dynamics. This is evidentwith average capacity utilization of companies hovering around 50% in South and 77% in North as compared to 84% in Central,85% in West and 76% in East in FY18. Going forward, with the slew of capacity additions proposed, we expect the averagecapacity utilization to slightly increase to 56% in the South region and 79% in the North by FY21E.
• With the increase in utilization and demand growth, the companies are also trying to improve their trade mix at the expense ofdip in market share (Shree & JK Cement). Companies with pricing power such as Ultratech, have also raised their non-tradeprices to tune of INR 20-30/bag to further improve realization.
• A ramp up of stressed plants such as Binani (in North), Murli Industries (in MP) and Kalyanpur cements (in East) may putpressure on pricing and utilization levels in select regions.
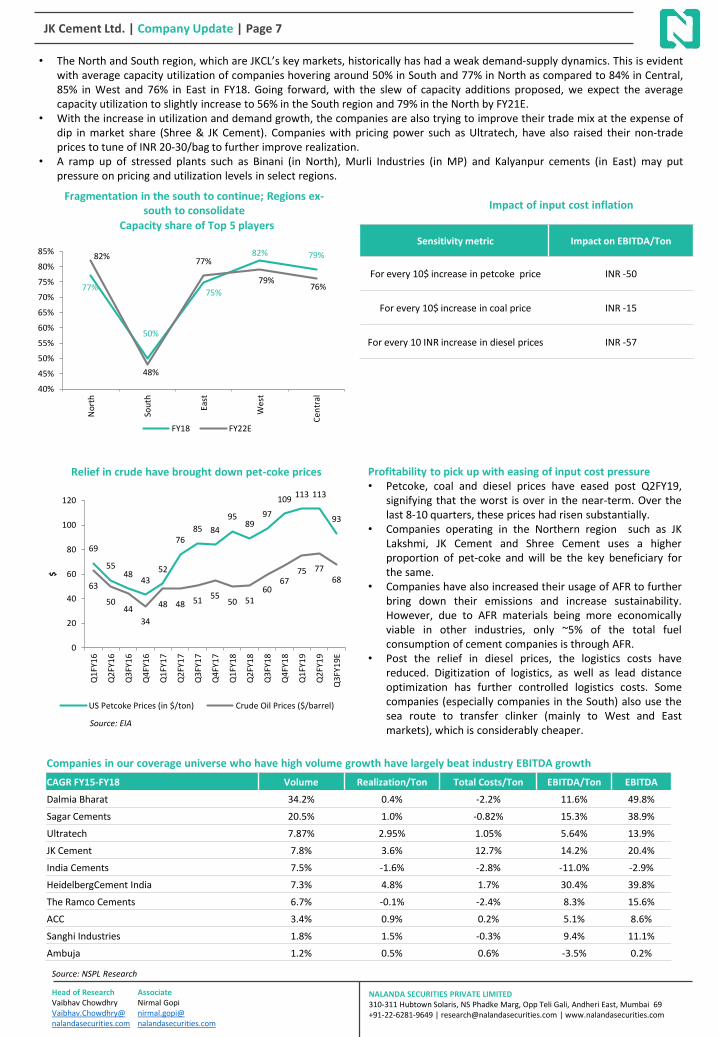
Profitability to pick up with easing of input cost pressure• Petcoke, coal and diesel prices have eased post Q2FY19,
signifying that the worst is over in the near-term. Over thelast 8-10 quarters, these prices had risen substantially.
• Companies operating in the Northern region such as JKLakshmi, JK Cement and Shree Cement uses a higherproportion of pet-coke and will be the key beneficiary forthe same.
• Companies have also increased their usage of AFR to furtherbring down their emissions and increase sustainability.However, due to AFR materials being more economicallyviable in other industries, only ~5% of the total fuelconsumption of cement companies is through AFR.
• Post the relief in diesel prices, the logistics costs havereduced. Digitization of logistics, as well as lead distanceoptimization has further controlled logistics costs. Somecompanies (especially companies in the South) also use thesea route to transfer clinker (mainly to West and Eastmarkets), which is considerably cheaper.
Fragmentation in the south to continue; Regions ex-south to consolidate
Relief in crude have brought down pet-coke prices
Source: NSPL Research
Source: EIA
69
5548
4352
7685 84
9589
97
109113 113
93
63
5044
34
48 48 5155
50 5160
6775 77
68
0
20
40
60
80
100
120
Q1
FY1
6
Q2
FY1
6
Q3
FY1
6
Q4
FY1
6
Q1
FY1
7
Q2
FY1
7
Q3
FY1
7
Q4
FY1
7
Q1
FY1
8
Q2
FY1
8
Q3
FY1
8
Q4
FY1
8
Q1
FY1
9
Q2
FY1
9
Q3
FY1
9E
$
US Petcoke Prices (in $/ton) Crude Oil Prices ($/barrel)
CAGR FY15-FY18 Volume Realization/Ton Total Costs/Ton EBITDA/Ton EBITDA
Dalmia Bharat 34.2% 0.4% -2.2% 11.6% 49.8%
Sagar Cements 20.5% 1.0% -0.82% 15.3% 38.9%
Ultratech 7.87% 2.95% 1.05% 5.64% 13.9%
JK Cement 7.8% 3.6% 12.7% 14.2% 20.4%
India Cements 7.5% -1.6% -2.8% -11.0% -2.9%
HeidelbergCement India 7.3% 4.8% 1.7% 30.4% 39.8%
The Ramco Cements 6.7% -0.1% -2.4% 8.3% 15.6%
ACC 3.4% 0.9% 0.2% 5.1% 8.6%
Sanghi Industries 1.8% 1.5% -0.3% 9.4% 11.1%
Ambuja 1.2% 0.5% 0.6% -3.5% 0.2%
Companies in our coverage universe who have high volume growth have largely beat industry EBITDA growth
77%
50%
75%
82% 79%82%
48%
77%
79%76%
40%
45%
50%
55%
60%
65%
70%
75%
80%
85%
No
rth
Sou
th
East
Wes
t
Cen
tral
FY18 FY22E
Sensitivity metric Impact on EBITDA/Ton
For every 10$ increase in petcoke price INR -50
For every 10$ increase in coal price INR -15
For every 10 INR increase in diesel prices INR -57
Impact of input cost inflation
Head of ResearchVaibhav ChowdhryVaibhav.Chowdhry@ nalandasecurities.com
NALANDA SECURITIES PRIVATE LIMITED310-311 Hubtown Solaris, NS Phadke Marg, Opp Teli Gali, Andheri East, Mumbai 69+91-22-6281-9649 | [email protected] | www.nalandasecurities.com
AssociateNirmal Gopinirmal.gopi@ nalandasecurities.com
Capacity share of Top 5 players

JK Cement Ltd. | Company Update | Page 8
Consolidation and brownfield expansion the way ahead• Two landmark Acts and their recent amendments (LARR and MMDR (Amendment) Act), have made it significantly tough for
companies to set up a greenfield project in terms of cost and time.• The new land acquisition act has brought about features such as rehabilitation of affected families, approval of ~70% of owners,
social impact assessment etc. This adds to the timeline and cost of the project. Moreover, stricter environmental clearanceprocesses, including obtaining approvals from State Pollution Control Boards, may take 9 months to a year to complete
• The Mines and Minerals (Development and Regulation) Amendment Act, 2015 was a game-changer for the cement industry as itchanged the process of acquiring limestone mines, the key raw material to manufacture cement. The act specifies that thelimestone mines may only be licensed through a bidding process, such as e-auction. This has created a level-playing field,however it has created an additional cost burden. The Act however, has also added a provision, to transfer limestone mines incase of acquisitions.
• With the IBC process making resolution of stressed assets easier and the MMDR Act making acquisition of limestone costlier,companies prefer going through inorganic mode of growth for future expansion.
• Although the industry witnessed 62% of the overall capacity expansion through the greenfield route from FY15-18, futurecapacity addition and consolidation is expected to be replaced by brownfield expansions and M&A activities due to lower leadtime as well as capex costs.
White Cement Industry overview• The white cement industry is expected to grow at a CAGR of 3.8% from FY15-20E as the global white cement consumption is
almost equal to the global white cement production. Global capacity of white cement is estimated to be 29.7mt, out of which~24% is in China. The consumption of white cement is also dominated by China with 26%, followed by Middle East with 21% andAsia (ex-China) with 12%.
• The global capacity of white cement is only 0.5% of the total grey cement, and consistent demand is visible due to the nichenature of the product. Companies also favour the product due to the consistent nature of the business as well as stablecontribution to the top and bottom line (EBITDA Margins in the range of 28-30%).
• The Indian white cement industry is dominated by two large players (Ultratech and JK Cement), representing 85% of the totalexisting capacity. These players sell their cement pan-India and also exports to many countries (JKCL exports to 34 countries).
State Name of Block Reserves in MT E-auction date Winner of bid
Gujarat Mudhvay Sub-block C, kachchh 325.00 26.05.2017 Adani Cementation
Maharashtra Nandgaon Ekodi, Dist. Chandrapur 42.10 20.06.2017 Ambuja Cements
Rajasthan 3D1, n/v Harima Pithsar Nagaur 199.15 26.09.2017 Ambuja Cements
Chattisgarh Kesla- II, Raipur 215.00 01.05.2017 Dalmia Bharat
Rajasthan Sindwari, Ramkhera,Block -B, Chittaurgarh 174.45 05.01.2017 Dalmia Bharat
Madhya Pradesh Hinauti-1, Satna 2.81 15.05.2018 Digiana Industries Pvt. Ltd
Madhya Pradesh Hinauti-2, Satna 1.67 16.05.2018 Digiana Industries Pvt. Ltd
Rajasthan Limestone block- 3B1-(a)n/v Deh ,Nagaur 126.95 06.01.2017 Emami Cement
Rajasthan Limestone block- 3B1-(b)n/v Deh, Nagaur 168.84 22.09.2016 Emami Cement
Gujarat Mudhvay Sub-block D, kachchh 125.00 30.05.2017 JSW Cement Ltd
Rajasthan 3B2, n/v Sarasani Tehsil & District Nagaur 205.54 05.02.2018 JSW Cement Ltd
Gujarat Mudhvay Sub-block B, kachchh 301.50 25.05.2017 Shree Cements
Rajasthan Rata-Mandha-1A (RM-1A), Dist. Jaisalmer 209.27 25.06.2018 Shree Cements
AP ErragudiHussainapuram –Yanakandla 9.03 26.09.2017 Sree Jayajothi Cements Pvt. Ltd
AP Nandavaram –Venkatapuram 1.66 26.09.2017 Sree Jayajothi Cements Pvt Ltd.
Chattisgarh Guma block, District Baloda Bazar -Bhatapara 124.00 12.03.2018 Ultratech Cement
Madhya Pradesh Deora-Sitapuri-Udiyapura, Dist. Dhar 61.96 15.05.2018 Ultratech Cement
Auctioned Limestone mines
Source: Ministry of Mines
Head of ResearchVaibhav ChowdhryVaibhav.Chowdhry@ nalandasecurities.com
NALANDA SECURITIES PRIVATE LIMITED310-311 Hubtown Solaris, NS Phadke Marg, Opp Teli Gali, Andheri East, Mumbai 69+91-22-6281-9649 | [email protected] | www.nalandasecurities.com
AssociateNirmal Gopinirmal.gopi@ nalandasecurities.com
Name Designation
Yadupati Singhania Chairman & Managing Director
Achintya Karati Director
K B Agarwal Director
Paul Heinz Hugentobler Director
Suparas Bhandari Director
Sushila Devi Singhania Director
Jayant Narayan Godbole Director
Kailash Nath Khandelwal Director
Raj Kumar Lohia Director
Deepa Gopalan Wadhwa Ind. Non-Executive Director
About the companyJ.K Cement Limited is a leading cement manufacturer primarily present in North India along with a minor presence in the South.The company has a grey cement capacity of 10.5mt and a white cement capacity of 0.6mt (currently the third largest manufacturerof white cement in the world). It is also the second largest producer of wall putty in the country with a capacity of 0.9mt. JKCLmanufactures OPC, PPC as well as PSC and also has a dual process white-cum grey cement plant at Fujairah, UAE (0.6mt of whitecement or 1mt of grey cement), catering mainly to GCC and African markets. In FY19, the company has initiated a brownfieldexpansion of 4.2mt for its grey cement plant at Mangrol, Rajasthan which is about 40% of existing capacity. The estimated costoutlay for the project is INR 2000cr. In June 2018, J.K Cement has also added an additional installed capacity of 0.2mt at its unit atKatni in Madhya Pradesh.
Management Team
JK Cement Ltd. | Company Update | Page 9
Third generation management to propel JKCL forward
The current CEO, Mr. Yadupati Singhania, is the third-generation entrepreneur of the Singhania family who haspropelled JKCL to its current capacity. The IIT Kanpur alumnuswas responsible for setting up the country’s first dry processwhite cement factory. The initiative which was taken then, hashelped it to become the second-largest manufacturer of whitecement, commanding a market share of 40%. The CEO had alsotaken the effort of revamping the old factories inherited fromthe previous generations.
Name % of Holding
SBI Magnum Multicap Fund 1.80
Franklin India Prima Fund 1.74
Mirae Asset Emerging Bluechip Fund 0.95
Top Fund Holding
Shareholding Pattern
64.16%10.68%
16.65%
8.51%
Promoter FII DII Retail
Capacity (in Million Tons)
Location Country/State Grey Cement White Cement Wall PuttyThermal Power
Plant (MW)Waste Heat
Recovery
Nimbahera Rajasthan 3.25 - - 20 13.2
Mangrol Rajasthan 2.25 - - 25 10
Jharli, Jhajjar (Grinding Unit) Haryana 1.5 - - - -
Muddapur, Bagalkot Karnataka 3 - - 50 -
Gotan, Nagaur Rajasthan 0.47 0.6 0.5 7.5 -
Katni Madhya Pradesh - - 0.4 - -
Fujairah UAE 1* 0.6* - - -
Head of ResearchVaibhav ChowdhryVaibhav.Chowdhry@ nalandasecurities.com
NALANDA SECURITIES PRIVATE LIMITED310-311 Hubtown Solaris, NS Phadke Marg, Opp Teli Gali, Andheri East, Mumbai 69+91-22-6281-9649 | [email protected] | www.nalandasecurities.com
AssociateNirmal Gopinirmal.gopi@ nalandasecurities.com
Source: Company

JK Cement Ltd. | Company Update | Page 10
Source: NSPL Research
Balance Sheet (INR Crores) FY17 FY18 FY19E FY20E FY21E
Share Capital 69.9 69.9 77.3 77.3 77.3
Reserves & Surplus 1640.8 1904.9 2045.5 2174.3 2377.4
QIP 0.0 0.0 500.0 500.0 500.0
Shareholder's Funds 1710.7 1974.9 2622.8 2751.6 2954.7
Minority Interest 4.0 0.0 0.0 0.0 0.0
Long term borrowings 2870.1 2574.1 2874.1 3274.1 2974.1
Deferred Tax Liability (Net) 259.9 267.0 267.0 267.0 267.0
Other long-term liabilities 263.0 299.1 269.3 337.8 321.6
Long term provisions 22.4 27.4 27.6 30.6 33.9
Non-current liabilities 3415.4 3167.6 3438.0 3909.5 3596.6
Short term borrowings 225.9 156.5 156.5 181.5 181.5
Trade payables 427.1 435.7 477.1 520.0 578.4
Other current liabilities 615.7 696.8 730.2 806.8 797.3
Short-term provisions 10.5 22.8 19.6 20.7 25.2
Current liabilities 1280.8 1311.8 1383.3 1528.9 1582.3
Total Equity and Liabilities 6410.9 6454.2 7444.0 8190.0 8133.6
Property, Plant and Equipment 4518.4 4421.2 4878.0 5900.6 5752.7
Capital work-in-progress 126.7 104.3 404.3 204.3 200.0
Intangible Assets 23.3 22.1 22.7 22.4 22.6
Non-current investments 15.0 41.4 45.5 49.9 54.9
Loans and Advances 134.8 38.0 51.7 55.4 60.2
Other Non Current Assets 113.4 123.4 129.2 138.6 150.5
Total Non-current Assets 4931.6 4750.4 5531.3 6371.2 6240.9
Current Investments 65.3 77.6 85.3 93.9 103.3
Inventories 560.9 589.8 640.8 682.1 751.3
Trade receivables 201.9 235.8 240.7 243.0 263.8
Cash and cash equivalents 130.1 198.4 340.0 172.2 127.8
Other Bank Balances 305.2 361.1 361.1 361.1 361.1
Other current financial assets 52.7 74.4 51.9 66.8 74.1
Other Current Assets 163.2 150.1 176.3 183.1 194.7
Assets held for sale 0.0 16.6 16.6 16.6 16.6
Total Current Assets 1479.3 1703.8 1912.7 1818.7 1892.7
Total Assets 6410.9 6454.2 7444.0 8190.0 8133.6
Profit & Loss (INR Crores) FY17 FY18 FY19E FY20E FY21E
Net sales 4654.0 5020.5 5168.7 5542.5 6018.5
COGS 701.9 801.4 870.6 939.6 1034.9
Employee Expenses 315.5 368.3 417.3 472.8 535.8
Power and Fuel Cost 664.5 952.1 1040.5 1078.3 1128.4
Selling and Distribution Expenses 812.8 1106.1 1198.9 1283.5 1387.1
Other Expenses 1433.2 1005.1 855.3 916.9 995.9
EBITDA 726.1 787.5 786.0 851.4 936.4
D&A 216.9 231.3 245.5 279.6 304.4
Other income 98.4 128.1 97.0 101.0 105.7
EBIT 607.6 684.3 637.5 672.8 737.7
Interest Expense 302.7 284.1 303.7 346.6 316.3
PBT 304.9 400.2 333.8 326.2 421.5
Tax 113.6 97.6 108.9 106.4 127.5
PAT 172.0 285.6 224.8 219.7 294.0
EPS in INR 24.6 40.8 32.2 31.4 42.0
Head of ResearchVaibhav ChowdhryVaibhav.Chowdhry@ nalandasecurities.com
NALANDA SECURITIES PRIVATE LIMITED310-311 Hubtown Solaris, NS Phadke Marg, Opp Teli Gali, Andheri East, Mumbai 69+91-22-6281-9649 | [email protected] | www.nalandasecurities.com
AssociateNirmal Gopinirmal.gopi@ nalandasecurities.com

JK Cement Ltd. | Company Update | Page 11
Source: NSPL Research
Cash Flow (INR Crores) FY17 FY18 FY19E FY20E FY21E
PBT 285.6 383.2 333.8 326.2 421.5
Depreciation 216.9 231.3 245.5 279.6 304.4
Net Change in Working Capital 41.6 207.5 275.0 -155.7 -179.1
Operating profit after working capital changes 835.2 982.7 845.9 999.0 945.1
Less income tax paid -63.3 -99.6 -108.9 -106.4 -127.5
Cash Flow from Operating 771.8 883.1 737.0 892.6 817.6
(Incr)/ Decr in Gross PP&E -403.7 -201.8 -1,002.8 -1,101.9 -152.4
(Purchase)/ Sale of Current Investments (net) 0.8 -36.9 -11.9 -13.0 -14.4
Cash Flow from Investing -649.2 -95.8 -1,014.7 -1,114.9 -166.8
(Decr)/Incr in Debt 32.8 -331.6 300.0 425.0 -300.0
Finance costs -297.1 -278.9 -303.7 -279.6 -304.4
(Decr)/Incr in Share Premium 0.0 0.0 507.3 0.0 0.0
Dividend Paid -33.7 -67.3 -84.3 -90.9 -90.9
Cash Flow from Financing -345.6 -735.8 419.3 54.5 -695.3
Cash at the Start of the Year 372.0 130.1 198.4 340.0 172.2
Incr/ (Decr) in Cash -241.9 68.3 141.6 -167.8 -44.4
Cash at the End of the Year 130.1 198.4 340.0 172.2 127.8
RATIOS FY17 FY18 FY19E FY20E FY21E
EBITDA/ton (GC) 481.6 460.2 432.9 451.6 473.7
EBITDA/Ton (WC Incl. Wall Putty) 2780.3 2671.9 2563.5 2615.9 2701.5
Grey Cement Sales Volume 6.79 7.88 8.72 9.24 9.88
White Cement Sales Volume (incl. Wall Putty) 1.42 1.54 1.59 1.66 1.73
Growth (%)
Total Sales 6.5% 7.9% 3.0% 7.2% 8.6%
EBITDA 32.9% 8.4% -0.2% 8.3% 10.0%
PAT 213.6% 66.1% -21.3% -2.3% 33.8%
Profitability (%)
EBITDA Margin 15.6% 15.7% 15.2% 15.4% 15.6%
NPM 3.7% 5.7% 4.4% 4.0% 4.9%
ROE 10.1% 14.5% 8.6% 8.0% 9.9%
ROCE 12.1% 13.9% 10.8% 10.4% 11.6%
Per share data
EPS 24.6 40.8 31.1 30.4 40.7
BPS 244.6 282.4 363.3 381.1 409.2
Valuations (x)
P/E (x) 30.4 25.0 26.3 23.6 17.7
EV/EBITDA (x) 11.2 12.1 10.8 9.8 8.7
EV/Ton ($) 115.6 130.1 114.0 112.7 80.0
Net Debt/EBITDA 4.0 3.0 3.3 3.7 3.1
Net Debt/Equity 1.7 1.2 1.0 1.2 1.0
Interest Coverage 2.0 2.4 2.1 1.9 2.3
Head of ResearchVaibhav ChowdhryVaibhav.Chowdhry@ nalandasecurities.com
NALANDA SECURITIES PRIVATE LIMITED310-311 Hubtown Solaris, NS Phadke Marg, Opp Teli Gali, Andheri East, Mumbai 69+91-22-6281-9649 | [email protected] | www.nalandasecurities.com
AssociateNirmal Gopinirmal.gopi@ nalandasecurities.com

OUR RECENT REPORTS
Dalmia Bharat Coromandel International
Meghmani Organics IndoStar Capital Minda Industries Sharda Cropchem
Heidelberg Cements Manappuram Finance Prataap SnacksIG Petrochemicals
Cummins India Ltd.
For more research reports, please visit www.nalandasecurities.com
Suprajit Engineering Ltd.
Disclaimer:This report has been prepared by Nalanda Securities Pvt. Ltd(“NSPL”) and published in accordance with the provisions of Regulation 18 of the Securities and Exchange Board ofIndia (Research Analysts) Regulations, 2014, for use by the recipient as information only and is not for circulation or public distribution. NSPL includes subsidiaries, group andassociate companies, promoters, directors, employees and affiliates. This report is not to be altered, transmitted, reproduced, copied, redistributed, uploaded, published or madeavailable to others, in any form, in whole or in part, for any purpose without prior written permission from NSPL. The projections and the forecasts described in this report arebased upon a number of estimates and assumptions and are inherently subject to significant uncertainties and contingencies. Projections and forecasts are necessarily speculativein nature, and it can be expected that one or more of the estimates on which the projections are forecasts were based will not materialize or will vary significantly from actualresults and such variations will likely increase over the period of time. All the projections and forecasts described in this report have been prepared solely by authors of this reportindependently. None of the forecasts were prepared with a view towards compliance with published guidelines or generally accepted accounting principles.This report should not be construed as an offer to sell or the solicitation of an offer to buy, purchase or subscribe to any securities, and neither this report nor anything containedtherein shall form the basis of or be relied upon in connection with any contract or commitment whatsoever. It does not constitute a personal recommendation or take intoaccount the particular investment objective, financial situation or needs of individual clients. The research analysts of NSPL have adhered to the code of conduct under Regulation24 (2) of the Securities and Exchange Board of India (Research Analysts) Regulations, 2014. The recipients of this report must make their own investment decisions, based on theirown investment objectives, financial situation or needs and other factors. The recipients should consider and independently evaluate whether it is suitable for its/ his/ her/theirparticular circumstances and if necessary, seek professional / financial advice as there is substantial risk of loss. NSPL does not take any responsibility thereof. Any such recipientshall be responsible for conducting his/her/its/their own investigation and analysis of the information contained or referred to in this report and of evaluating the merits and risksinvolved in securities forming the subject matter of this report. The price and value of the investment referred to in this report and income from them may go up as well as down,and investors may realize profit/loss on their investments. Past performance is not a guide for future performance. Actual results may differ materially from those set forth in theprojection.Except for the historical information contained herein, statements in this report, which contain words such as ‘will’, ‘would’, etc., and similar expressions or variations of suchwords may constitute ‘forward‐looking statements’. These forward‐looking statements involve a number of risks, uncertainties and other factors that could cause actual results todiffer materially from those suggested by the forward‐looking statements. Forward‐looking statements are not predictions and may be subject to change without notice. NSPLundertakes no obligation to update forward‐looking statements to reflect events or circumstances after the date thereof. NSPL accepts no liabilities for any loss or damage of anykind arising out of use of this report.This report has been prepared by NSPL based upon the information available in the public domain and other public sources believed to be reliable. Though utmost care has beentaken to ensure its accuracy and completeness, no representation or warranty, express or implied is made by NSPL that such information is accurate or complete and/or isindependently verified. The contents of this report represent the assumptions and projections of NSPL and NSPL does not guarantee the accuracy or reliability of any projection,assurances or advice made herein. Nothing in this report constitutes investment, legal, accounting and/or tax advice or a representation that any investment or strategy is suitableor appropriate to recipients’ specific circumstances. This report is based / focused on fundamentals of the Company and forward‐looking statements as such, may not match witha report on a company’s technical analysis report. This report may not be followed by any specific event update/ follow‐up.
Following table contains the disclosure of interest in order to adhere to utmost transparency in the matter;
Disclosure of Interest Statement
Details of Nalanda Securities Pvt. Limited (NSPL)
• NSPL is a Stock Broker registered with BSE, NSE and MCX ‐ SX in all the major segments
viz. Cash, F & O and CDS segments. Further, NSPL is a Registered Portfolio Manager and
is registered with SEBI
• SEBI Registration Number: INH000004617
Details of Disciplinary History of NSPL No disciplinary action is / was running / initiated against NSPL
Research analyst or NSPL or its relatives'/associates' financial interest in the
subject company and nature of such financial interest
No (except to the extent of shares held by Research analyst or NSPL or its
relatives'/associates')
Whether Research analyst or NSPL or its relatives'/associates' is holding the
securities of the subject companyNO
Research analyst or NSPL or its relatives'/associates' actual/beneficial
ownership of 1% or more in securities of the subject company, at the end of
the month immediately preceding the date of publication of the document
NO
Research analyst or NSPL or its relatives'/associates' any other material
conflict of interest at the time of publication of the documentNO
Has research analyst or NSPL or its associates received any compensation
from the subject company in the past 12 monthsNO
Has research analyst or NSPL or its associates managed or co‐managed public
offering of securities for the subject company in the past 12 monthNO
Has research analyst or NSPL or its associates received any compensation for
investment banking or merchant banking or brokerage services from the
subject company in the past 12 months
NO
Has research analyst or NSPL or its associates received any compensation for
products or services other than investment banking or merchant banking or
brokerage services from the subject company in the past 12 months
NO
Has research analyst or NSPL or its associates received any compensation or
other benefits from the subject company or third party in connection with the
document.
NO
Has research analyst served as an officer, director or employee of the subject
companyNO
Has research analyst or NSPL engaged in market making activity for the
subject companyNO
Other disclosures NO
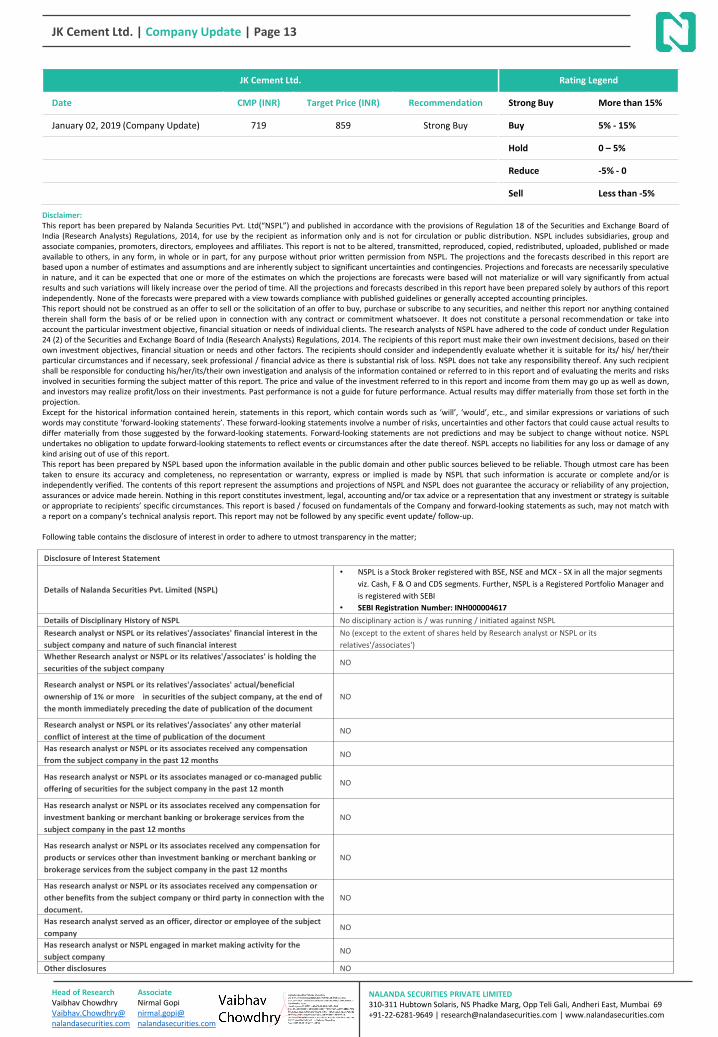
Rating Legend
Strong Buy More than 15%
Buy 5% - 15%
Hold 0 – 5%
Reduce -5% - 0
Sell Less than -5%
JK Cement Ltd.
Date CMP (INR) Target Price (INR) Recommendation
January 02, 2019 (Company Update) 719 859 Strong Buy
JK Cement Ltd. | Company Update | Page 13
Head of ResearchVaibhav ChowdhryVaibhav.Chowdhry@ nalandasecurities.com
NALANDA SECURITIES PRIVATE LIMITED310-311 Hubtown Solaris, NS Phadke Marg, Opp Teli Gali, Andheri East, Mumbai 69+91-22-6281-9649 | [email protected] | www.nalandasecurities.com
AssociateNirmal Gopinirmal.gopi@ nalandasecurities.com