jim swegle vice president, safeco personal...
TRANSCRIPT

Jim SwegleVice President, Safeco Personal Insurance
2008 Annual AIFA ConferenceMarch 3, 2008

Safe-Harbor StatementUNDER THE PRIVATE SECURITIES LITIGATION REFORM ACT OF 1995
Forward-looking information contained in this presentation is subject to risk and uncertainty. Information contained in this presentation that relates to Safeco’s anticipated financial performance, business prospects and plans, and similar matters are “forward-looking statements” as defined in the Private Securities Litigation Reform Act of 1995. Our business is subject to certain risks and uncertainties that may cause actual results to differ materially from those suggested by the forward-looking statements in this presentation, including changes in general economic and business conditions, changes in the insurance industry, and changes in our business strategies. Investors should bear this in mind as they consider forward-looking statements. Additional information on factors that may impact these forward-looking statements can be found in the "Management's Discussion and Analysis of Financial Condition and Results of Operations" and “Risk Factors” sections in our 2007 Annual Report on Form 10-K. The information contained in this presentation is as of the date indicated. We assume no obligation to update any forward-looking statements contained in this presentation as a result of new information or future events or developments.
We also may discuss various non-GAAP financial measures, including Operating Revenue, Operating Earnings and Operating Earnings per Share, Operating Return on Equity, Net Written Premiums and Underwriting Profits and Combined Ratios. Please refer to our 10-K filing of February 29, 2008, or our website for the most directly comparable GAAP measures together with our reconciliation of the two.
2

3
• Safeco overview
– Investments and capital
– Catastrophe management
• Personal lines
– Property
– Specialty
– Auto
• Expense management
Presentation Outline

7%
27%
26%
31%
9%
Personal Lines Property
Small Commercial
Personal Lines Auto
46%
23%
17%
7%7%
2007 Net Written Premium:
$5,640M
Other
Surety
2007 Underwriting Profit:
$480M
Safeco at a Glance
4

Safeco Has Outperformed the Industry with Few Exceptions
80%
85%
90%
95%
100%
105%
110%
115%
120%
125%
1980
1981
1982
1983
1984
1985
1986
1987
1988
1989
1990
1991
1992
1993
1994
1995
1996
1997
1998
1999
2000
2001
2002
2003
2004
2005
2006
Industry Combined Ratio Safeco's Combined Ratio
Source: Dowling & Partners for Industry data; GAAP-basis data for Safeco
5
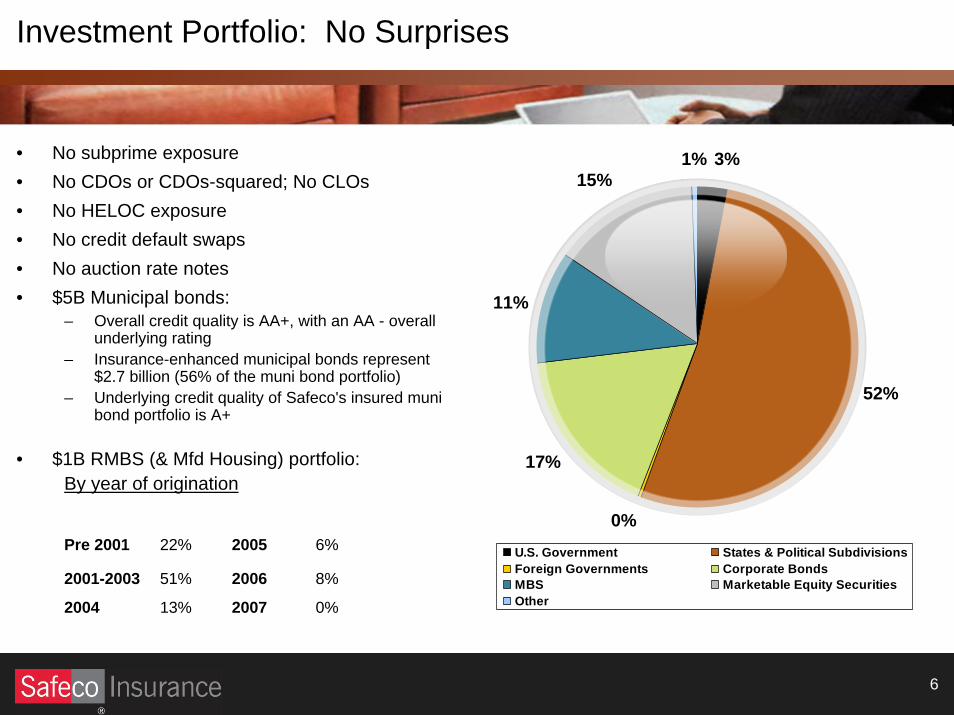
• No subprime exposure• No CDOs or CDOs-squared; No CLOs• No HELOC exposure• No credit default swaps • No auction rate notes• $5B Municipal bonds:
– Overall credit quality is AA+, with an AA - overall underlying rating
– Insurance-enhanced municipal bonds represent $2.7 billion (56% of the muni bond portfolio)
– Underlying credit quality of Safeco's insured muni bond portfolio is A+
• $1B RMBS (& Mfd Housing) portfolio:By year of origination
52%
0%
17%
11%
15%1% 3%
U.S. Government States & Political SubdivisionsForeign Governments Corporate BondsMBS Marketable Equity SecuritiesOther
Pre 2001 22% 2005 6%
2001-2003 51% 2006 8%
2004 13% 2007 0%
Investment Portfolio: No Surprises
6
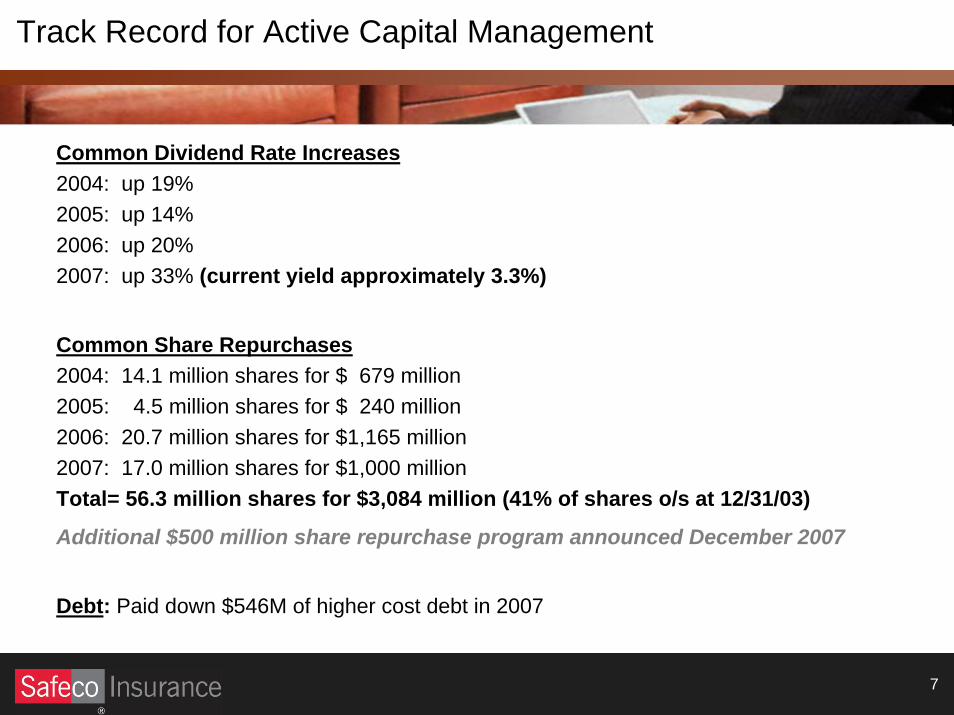
Track Record for Active Capital Management
7
Common Dividend Rate Increases2004: up 19%2005: up 14%2006: up 20%2007: up 33% (current yield approximately 3.3%)
Common Share Repurchases2004: 14.1 million shares for $ 679 million2005: 4.5 million shares for $ 240 million2006: 20.7 million shares for $1,165 million2007: 17.0 million shares for $1,000 millionTotal= 56.3 million shares for $3,084 million (41% of shares o/s at 12/31/03)
Additional $500 million share repurchase program announced December 2007
Debt: Paid down $546M of higher cost debt in 2007

18%
72%
10%
Property
Auto
70%
27%
3%
2007 Net Written Premium:
$3,674M
Specialty
2007 Underwriting Profit:
$176M
Safeco Personal Insurance
8

Safeco’s Superior Catastrophe Risk Management
2003 California wildfires $ 2.0B $ 16M 0.80% 3.03%
2004 Hurricanes $20.4B $232M 1.14% 1.26%
Hurricane Katrina $41.1B $114M 0.28% 0.99%
Hurricane Rita $ 5.1B $ 42M 0.83% 1.45%
Hurricane Wilma $10.3B $ 45M 0.44% 1.26%
2007 California wildfires $ 2.3B $ 27M 1.19% 2.75%
• Industry loss data from ISO’s Property Claim Services unit (except, California Department of Insurance estimate for 2007 California wildfires)
• Safeco market share estimates based on A.M. Best data and weighted for business mix of industry’s losses as reported by the Insurance Information Institute (market share for Wilma assumes average business mix of industry’s losses from the 2004 hurricanes)
• Safeco losses are pretax, before reinsurance
SAFECOLOSS
INDUSTRY LOSS
SAFECOLOSS SHARE
SAFECO MARKET SHARE
9

We Follow Strict Catastrophe Risk Underwriting Guidelines
10
• Product management approach– Cat load by product, by state, including allocated reinsurance, annual expected loss
and any assessment load– No subsidization of one product with another, or one state with another– Pricing and underwriting philosophy geared toward long-term market stability
• Examples of our strict underwriting guidelines
– Hurricane: ineligible risks within five miles of coast for personal lines; mandatory hurricane deductibles in coastal counties; began exit from Florida personal property market in 2005
– Earthquake - New Madrid: mandatory EQ deductibles since 2003 (minimum 15% for MO and IL); reduced commissions; further restrictions on older masonry structures; no new EQ coverage in AR
– Earthquake - West Coast: separate EQ mini-policies sold in CA (since 1997), WA and OR; mandatory 15%, 20%, 25% deductibles (minimum 20% in WA); 100 zip codes identified as high-severity zones
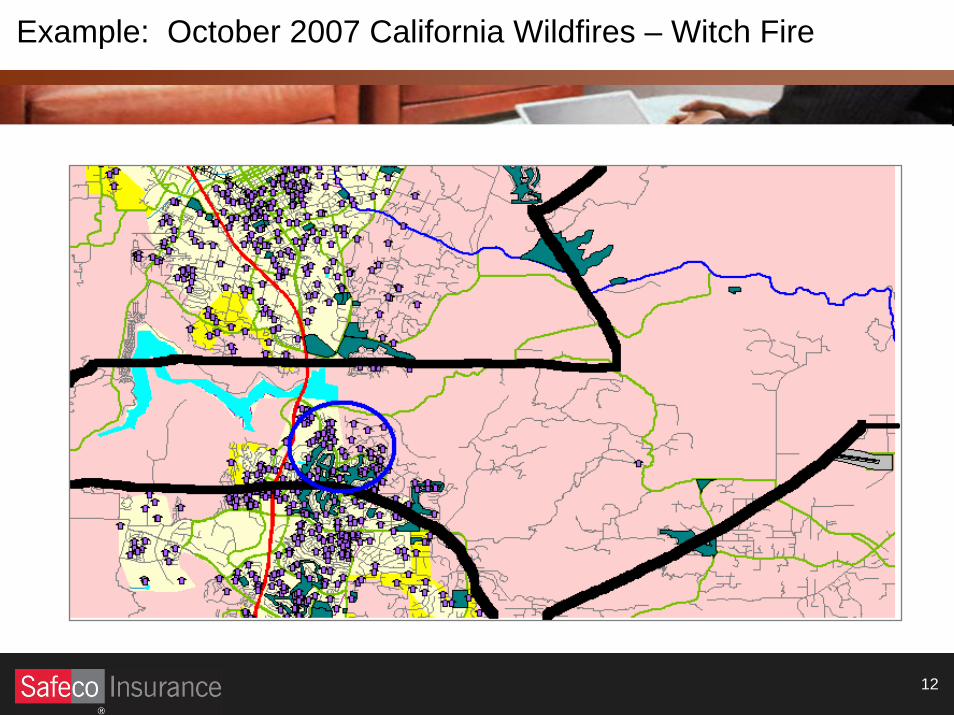
– Wildfire: extensive brush mapping since 1970; no dwellings with shake roofs in fire areas; no new business in hazard zones
– Wind & Hail: mandatory deductible in hail-prone states since 2002

11
Example: October 2007 California Wildfires
12
Example: October 2007 California Wildfires – Witch Fire

Strong Credit in Safeco Homeowners
13
• Credit and mortgage counts used in Safeco’s rating models since 1999
• Heavily tilted towards the Preferred market:
– 70% of our book has an Insurance Bureau Score [IBS] greater than 700
(= top 1/3 of IBS range)
– 99% of our book is at or above the IBS average
– Only 1% of our book has an IBS below 300 (= bottom 1/3 of IBS range)
• And, for higher risk segments, we get more rate…
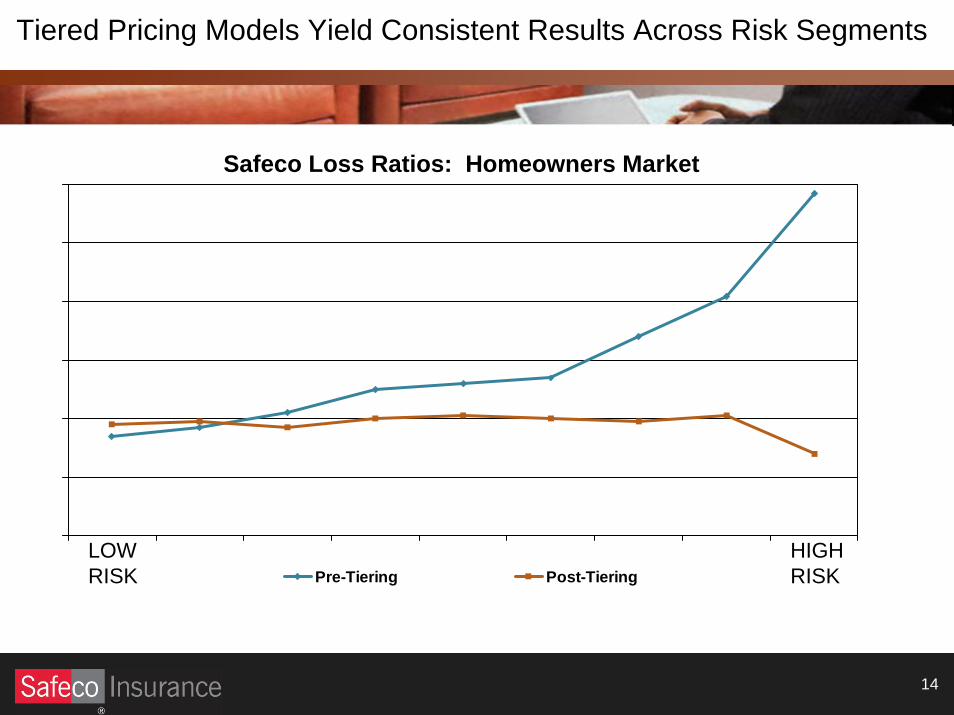
Tiered Pricing Models Yield Consistent Results Across Risk Segments
14
Pre-Tiering Post-TieringLOWRISK
HIGHRISK
Safeco Loss Ratios: Homeowners Market

H15 ~ .75
H20 ~ .85
H30 ~ 1.00
H35 ~ 1.20
H38 ~ 1.25
H45 ~ 1.30
H60 ~ 1.60
H70 ~ 1.95
H80 ~ 2.74
H15 ~ .75
H17 ~ .80
H21 ~ .85
H31 ~ 1.00
H34 ~ 1.10
H39 ~ 1.20
H45 ~ 1.30
H57 ~ 1.50
H67 ~ 1.75
H71 ~ 1.95
H80 ~ 2.74
H27 ~ .97
H15 ~ .75
H20 ~ .85
H30 ~ 1.00
H35 ~ 1.20
H38 ~ 1.25
H45 ~ 1.30
H60 ~ 1.60
H70 ~ 1.95
H80 ~ 2.74
H15 ~ .75
H17 ~ .80
H21 ~ .85
H31 ~ 1.00
H34 ~ 1.10
H39 ~ 1.20
H45 ~ 1.30
H57 ~ 1.50
H67 ~ 1.75
H71 ~ 1.95
H80 ~ 2.74
H27 ~ .97
Homeowners
H01 = .52
15 Tiers
15 Tiers
H90 = 4.50
v3.0 = “STP”v2.8v2.6
v3.0: ~8% average price difference between tiers
Safeco True Pricing for Home (3rd Generation Underwriting Model)

Personal Specialty Lines
16
Includes:
– Motorcycle
– RVs
– Watercraft
– Umbrella
• Full product offering, combined with ease-of-use for agents, is driving strong growth
• We offer a market for 95% of all riders and motorcycles
• We target the 12 million registered boats that are 26’ or smaller (95% of all watercraft), not on the Texas Gulf Coast
• Our umbrella provides protection up to $5 million

Expanding Customer Choices to a “Good, Better, Best” Approach
17
• Greater focus on consumer choice products across personal lines
• Safeco Optimum PackageTM for Auto – endorsement offering eight bundled coverages
to reward safe driving and provide extra protection for emergencies, repairs and personal
property:
– Up to $500 in deductible savings for safe driving with us
– Free replacement electronic keys
– Up to $1K in emergency expenses
– Up to $1K for stolen property, and four other features
• “Big 6” for Home:
– Safeco Optimum PackageTM offering all-risks contents coverage and higher internal policy limits
– Identity theft recovery
– 50% extended dwelling coverage

18
Open Seas R&D Unit: Focused on Innovation
Open Seas’ current innovation project portfolio (8 projects)
• Developing innovative products and services
• Focus is customer-centric, rather than product-driven
• TeensuranceTM, unique consumer solution for parents and their teen drivers, was launched in 2007
• Other products for Homeowners and Commercial are in the works
Consumer Observation Prototypes Market Test Implementation
Auto 1 1 1
Homeowners 1 1
Commercial 1 2
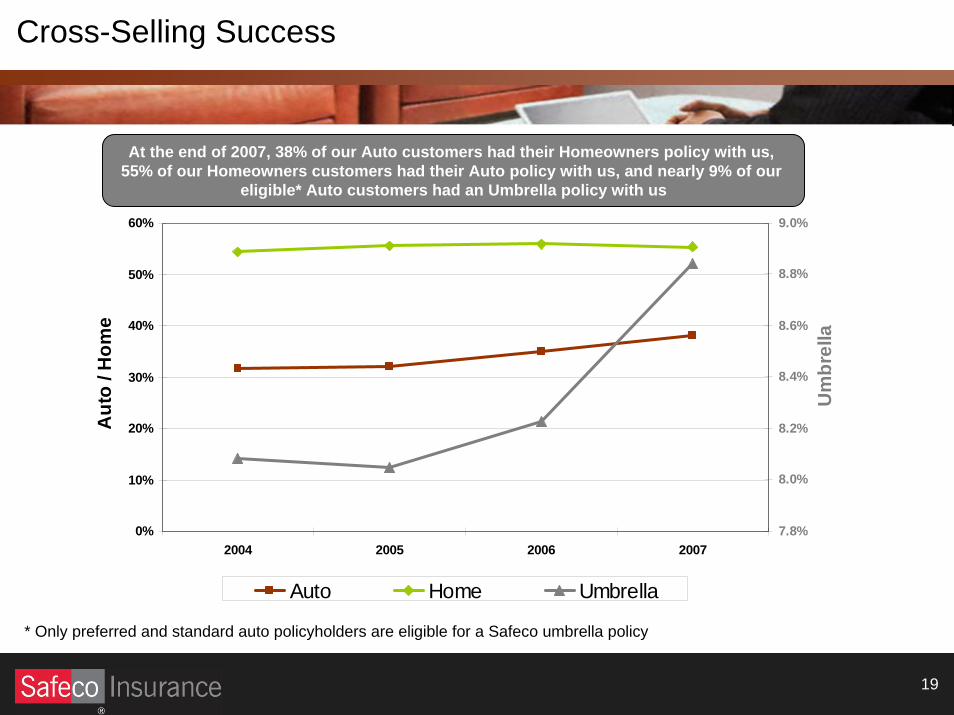
Cross-Selling Success
19
0%
10%
20%
30%
40%
50%
60%
2004 2005 2006 2007
Aut
o / H
ome
7.8%
8.0%
8.2%
8.4%
8.6%
8.8%
9.0%
Um
brel
la
Auto Home Umbrella
At the end of 2007, 38% of our Auto customers had their Homeowners policy with us, 55% of our Homeowners customers had their Auto policy with us, and nearly 9% of our
eligible* Auto customers had an Umbrella policy with us
* Only preferred and standard auto policyholders are eligible for a Safeco umbrella policy

Combined ratio 102.9% 92.7% 98.8% 91.0%
Net written premium -4.1% -4.8% -3.6% -5.0%
Policy retention rate 80.2% 79.5%
Ending policies in force -3.4% -4.1%
New business policy count -14.7% -5.7% -1.8% -23.6%
4Q07 4Q06 FY07 FY06
(Year-over year change, except combined ratio and retention rate)
>>> Auto Underperformed in 2007
Accident year run rate of 99% was 3+ points higher than long-term target of 96%
20

Industry’s Challenge: Auto Bodily Injury Severity Trends
21
U n ited S ta tes - B o d ily In ju ry
6 ,000
7 ,000
8 ,000
9 ,000
10 ,000
11 ,000
12 ,000
13 ,000
12/1999
06/2000
12/2000
06/2001
12/2001
06/2002
12/2002
06/2003
12/2003
06/2004
12/2004
06/2005
12/2005
06/2006
12/2006
06/2007
12/2007
Seve
rity
In d us try C a len d a r P a id S e ve rity 12 q F it In d us try C a le nd a r P a id S e ve rityS a fe co A cc Y r In c C a pp e d /E xc l. W th r. S e ve rity - 3 M o L a g 36 m F it S a fe co A cc Y r In c C a pp e d /E xc l. W th r. S e ve rity - 3 M o La gS a fe co A cc id e n t Y e ar In cu rre d S e ve rity - 3 M o L a g 3 6 m fit S a fe co A cc ide n t Y e a r Incu rre d S e ve rity - 3 M o La gS a fe co N e w ly R ep o rte d C a pp e d /E xc l. W th r. S e ve rity 36 m F it S a fe co N e w ly R ep o rte d C a p pe d /E xc l. W th r. S e ve rityS a fe co N e w ly R ep o rte d S e ve rity 3 6 m fit S a fe co N e w ly R ep o rte d S e verity

Insurance Research Council: Update on Claimed Medical Expenses
22
• Medical expenses reported by auto injury claimants rising faster than inflation
– 9% annualized growth from 2002 – 2007 in average claimed economic losses (medical care, lost wages, other out-of-pocket expenditures) for bodily injury (BI)
– 8% annualized growth from 2002 – 2007 in average claimed economic losses for personal injury protection (PIP)
– 3% annualized growth in overall CPI inflation; 4% CPI inflation rate for medical care over the same period
• Causes of more rapid growth in auto severity
– More frequent use of more expensive treatment alternatives
– Increased unit cost for claimed treatment
• Evidence suggests that medical providers may be reacting to cost pressures in other areas by increasing their charges to auto injury insurers
NOTE: IRC’s study was based on 42,000 auto injury claims closed by 22 insurers (representing 58% of the private passenger auto, or PPA, insurance market in the U.S. in 2006) with payment under the five principal PPA coverages
• Rate increases filed– 4.2% for full year 2007 (8% annualized run-rate of 4Q07 actions)– Another 6% increase planned for 2008 (front-end loaded)– 30 of our 44 states are “File and Use” states
• Rollout of Safeco True Pricing for Auto (next generation of Safeco’s automated underwriting model)– 23 states implemented in 2007– Remaining 20 states planned for 2008 (all Safeco’s Auto states, except California)
• Refined producer review process– 300 agent appointments cancelled – Another 350 identified for reunderwriting
• Executing on claims strategy to reduce loss costs through improved training and logistics management
Actions Taken to Restore Auto to Profitability Target
23
MonthTotal
RevisionsCountrywide
PremiumAverage
Rate ChangeCW Avg
Rate ChangeYTD
Change
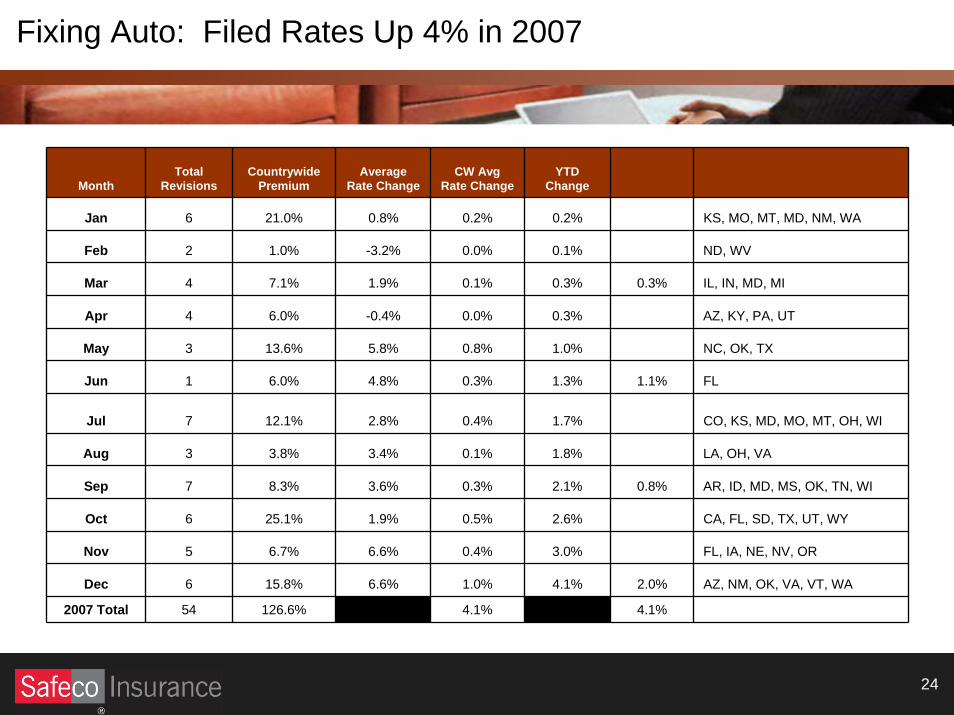
Jan 6 21.0% 0.8% 0.2% 0.2% KS, MO, MT, MD, NM, WA
Feb 2 1.0% -3.2% 0.0% 0.1% ND, WV
Mar 4 7.1% 1.9% 0.1% 0.3% 0.3% IL, IN, MD, MI
Apr 4 6.0% -0.4% 0.0% 0.3% AZ, KY, PA, UT
May 3 13.6% 5.8% 0.8% 1.0% NC, OK, TX
Jun 1 6.0% 4.8% 0.3% 1.3% 1.1% FL
Jul 7 12.1% 2.8% 0.4% 1.7% CO, KS, MD, MO, MT, OH, WI
Aug 3 3.8% 3.4% 0.1% 1.8% LA, OH, VA
Sep 7 8.3% 3.6% 0.3% 2.1% 0.8% AR, ID, MD, MS, OK, TN, WI
Oct 6 25.1% 1.9% 0.5% 2.6% CA, FL, SD, TX, UT, WY
Nov 5 6.7% 6.6% 0.4% 3.0% FL, IA, NE, NV, OR
Dec 6 15.8% 6.6% 1.0% 4.1% 2.0% AZ, NM, OK, VA, VT, WA
2007 Total 54 126.6% 4.1% 4.1%
Fixing Auto: Filed Rates Up 4% in 2007
24
Safeco True Pricing for Auto
25
Improving underwriting accuracy and retention:
• Third generation of our multivariate predictive underwriting tool
– Tiered prices by coverage (bodily injury, physical damage, collision, etc.)
– Increases dramatically the number of pricing tiers (from 13 to 150 tiers)
• Re-underwrites all policies at renewal (rate change caps reduce dislocation)
• Fixes a broken cell in our model (for drivers with MVR points – so that they’re
now placed in the appropriate pricing tier)
• Applies appropriate discounts to policyholders for tenure and multiple accounts

• It’s a fiercely competitive business
• Multi-variate modeling is “minimum table stakes”
– Visibility into data and early trend identification
– Automation of data feeds for verification
– Ability to protect tenured book through in-force re-pricing
• Continued vigilance and upgrading of claims practices
• Ability to package Auto and Home together
• We will continue to improve our performance
– Pricing sophistication
– Loss cost management
– Driving expense ratio down
– Enhancing distribution capabilities
How We Think about Auto
26

17 18 19 20 21 2226 27 27 28 28 27
57 55 54 52 52 52
0
10
20
30
40
50
60
2001 2002 2003 2004 2005 2006
Direct Independent Agents Captive Agents
Personal Lines Auto: Percent of Written Premium by Channel
Source: Safeco Market Research and A.M. Best
Independent Agents holding their own --Captive channel feeding growth in Direct
27

DirectPlatformAgencies
TraditionalAgencies
97%
2%
92%
8%
93%
5%
2004 2007
Total New Business
2004
Safeco Has Begun the Journey of Channel Diversification
28
82%
14%
5%
2007
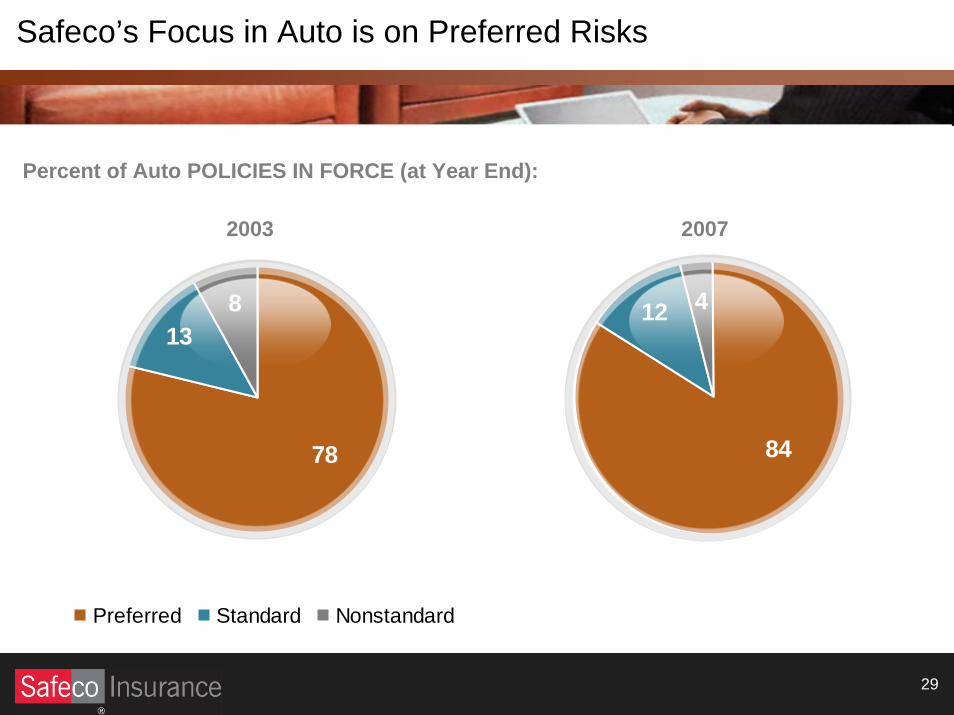
13
78
8
Preferred Standard Nonstandard
4
84
12
Percent of Auto POLICIES IN FORCE (at Year End):
2003 2007
Safeco’s Focus in Auto is on Preferred Risks
29
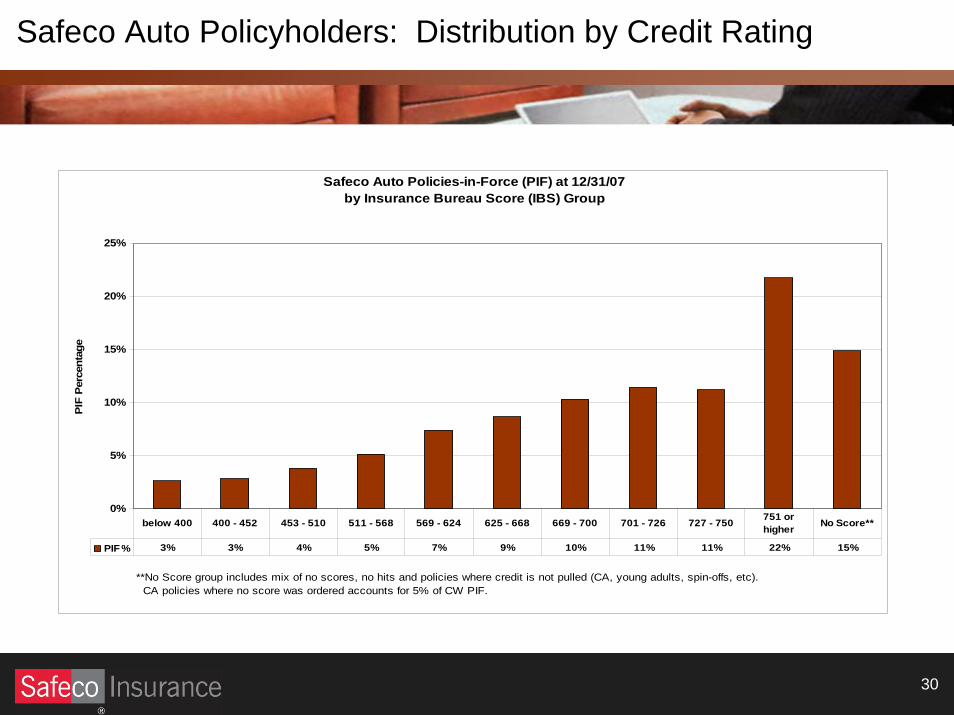
Safeco Auto Policyholders: Distribution by Credit Rating
30
Safeco Auto Policies-in-Force (PIF) at 12/31/07by Insurance Bureau Score (IBS) Group
0%
5%
10%
15%
20%
25%
PIF
Per
cent
age
PIF % 3% 3% 4% 5% 7% 9% 10% 11% 11% 22% 15%
below 400 400 - 452 453 - 510 511 - 568 569 - 624 625 - 668 669 - 700 701 - 726 727 - 750 751 or higher No Score**
**No Score group includes mix of no scores, no hits and policies where credit is not pulled (CA, young adults, spin-offs, etc). CA policies where no score was ordered accounts for 5% of CW PIF.

Auto Process Improvements: Comparative Rater Example
0%
5%
10%
15%
20%
25%
30%
35%
40%
45%
31
28%22%
0%
10%
20%
30%
40%
50%
60%
70%
80%
90%
100%
Feb '07 Mar '07 Apr '07 May '07 Jun '07 Jul '07 Aug '07 Sep '07 Oct '07 Nov '07 Dec '07
Traditional Q&I Retail Comparative Raters Virtual Producer Wholesale Platform
We’re reducing the rate of errors that occur when our agents use a comparative rating
tool to quote Safeco Auto
Sources for new Safeco Auto policies in 2007
Use of Comp. Raters is growing
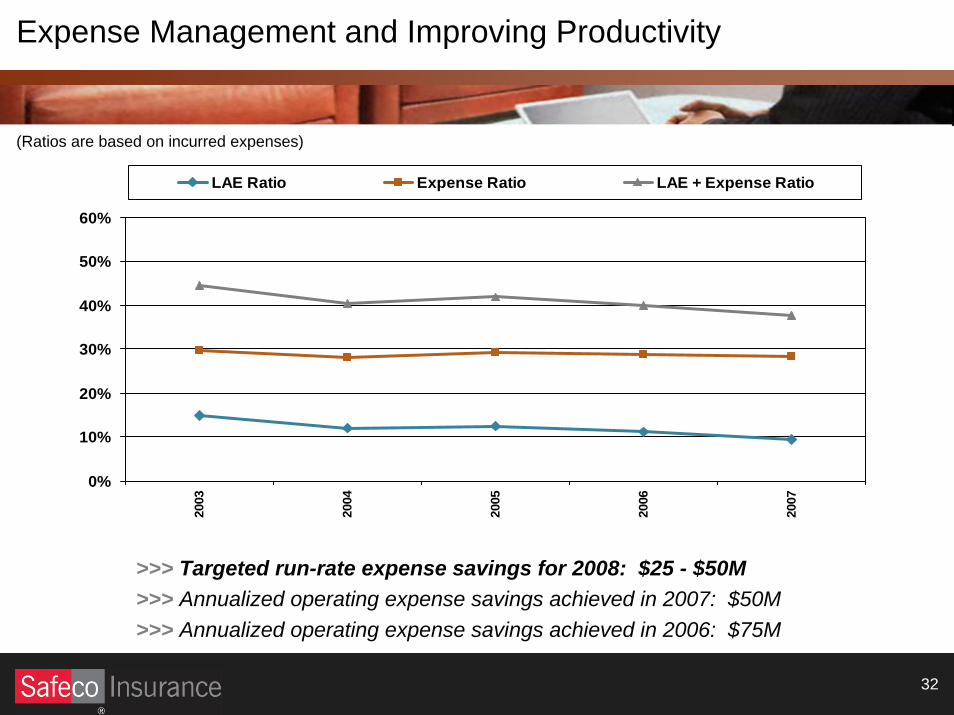
(Ratios are based on incurred expenses)
>>> Targeted run-rate expense savings for 2008: $25 - $50M>>> Annualized operating expense savings achieved in 2007: $50M>>> Annualized operating expense savings achieved in 2006: $75M
Expense Management and Improving Productivity
32
0%
10%
20%
30%
40%
50%
60%20
03
2004
2005
2006
2007
LAE Ratio Expense Ratio LAE + Expense Ratio
• Consistent underwriting with automated models for all core lines (auto,
property, small commercial, some surety)
• Commitment to continued upgrades to our pricing models
• Ongoing investment in state-of-the-art technology to promote ease of use
in multiple channels
• Sophisticated management of high-quality investment portfolio
• Aggressive balance sheet and capital management
• Relentless focus on improving operating costs
• Research & Development unit (Open Seas) devoted to developing
customer-centric, innovative products
Safeco’s Overall Strategy
33
