jennifer s. myers, md professor of clinical medicine teach ... · compliance with cvl bundle count...
TRANSCRIPT

Jennifer S. Myers, MD Professor of Clinical Medicine TEACH, August 2, 2017

To appreciate the synergy between quality improvement and evidence-based practice
To demonstrate when and how quality improvement tools can be used in the Knowledge to Action (K2A) Cycle

Evidence-Based practice?
Quality
improvement?

Safe Timely Efficient Effective Equitable Patient-Centered
IOM Crossing the Quality Chasm, 2001

Evidence-Based
Practice
Quality Improvement

0% of patients eligible for extended venous thromboembolism prophylaxis following surgery for an abdominal malignancy at our hospital were prescribed heparin at discharge.
Only 19% percent of severe sepsis/septic shock patients in our Emergency Department received all the interventions in the sepsis care bundle.

Evidence-Based
Practice
Quality Improvement

“If we do not like the current level of performance, we must choose between change and frustration.” - Don Berwick

IOM Domain of Quality
Quality Improvement Example
Safe
Timely
Effective
Efficient
Equitable
Patient-Centered
Value
No double-check for oral chemotherapy prescriptions
The time to critical value read-back & receipt is over 1 hour
Systolic heart failure patients are not receiving ACE inhibitors
New oncology patients must be seen in 3 different buildings
Hispanic patients are less likely to receive screening colonoscopies
Patients are not sure who the “doctor in charge” is in the hospital
Daily Chest X-rays in the ICU

“QI”
•Many associate QI with old-style,
punitive quality assurance
•QI programs do not provide clinicians
with the data they need
•QI experts do not emphasize the
academic potential of QI work
•QI gurus overemphasize the industrial
origins of QI

Frameworks for Quality Improvement
Model for Improvement
Six Sigma
LEAN
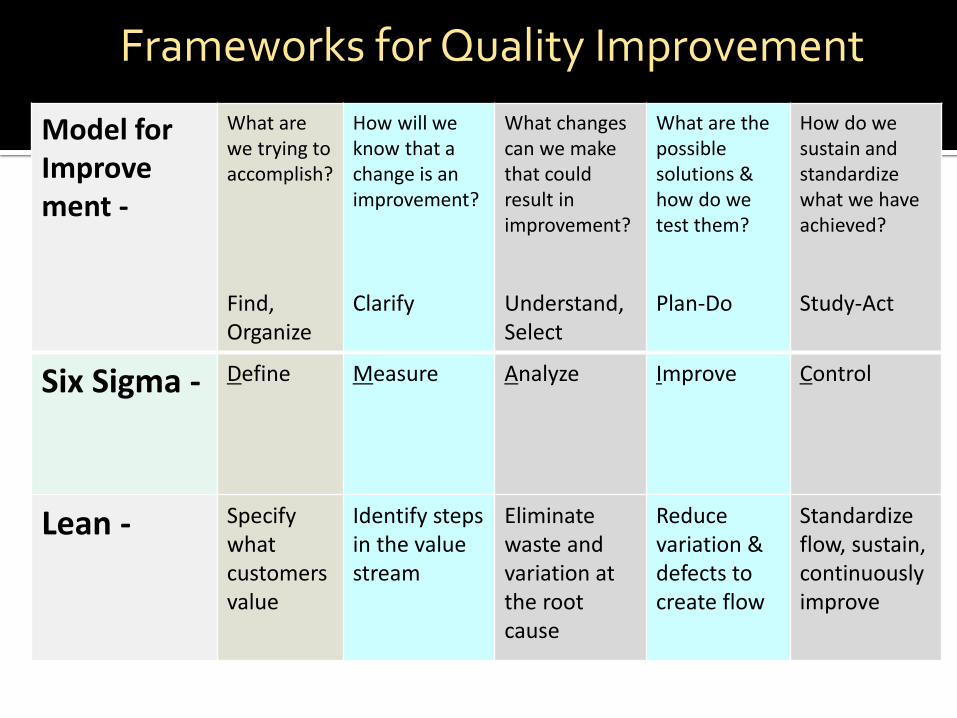
Model for Improve ment -
What are we trying to accomplish?
Find, Organize
How will we know that a change is an improvement?
Clarify
What changes can we make that could result in improvement?
Understand, Select
What are the possible solutions & how do we test them?
Plan-Do
How do we sustain and standardize what we have achieved?
Study-Act
Six Sigma -
Define Measure Analyze Improve Control
Lean -
Specify what customers value
Identify steps in the value stream
Eliminate waste and variation at the root cause
Reduce variation & defects to create flow
Standardize flow, sustain, continuously improve
Frameworks for Quality Improvement

Graham ID, et al. JHECP, 2006.

Model for Improve ment -
What are we trying to accomplish?
Find, Organize
How will we know that a change is an improvement?
Clarify
What changes can we make that could result in improvement?
Understand, Select
What are the possible solutions & how do we test them?
Plan-Do
How do we sustain and standardize what we have achieved?
Study-Act
Six Sigma Define Measure Analyze Improve Control
Lean
Specify what customers value
Identify steps in the value stream
Eliminate waste and variation at the root cause
Reduce variation & defects to create flow
Standardize flow, sustain, continuously improve
K2A Identify problem; know-do gap
Understand local context
Assess barriers / facilitators
Select, Tailor, Implement Intervention
Monitor, evaluate, sustain


Go see
Ask why
Show respect
Take notes!

What You Think It is . . .
What It Actually is . . .
What You Would Like it to Be . . .
The struggle is that this is where everyone wants to start.
You MUST GO AND SEE to verify what is really happening out there
Often difficult to persuade people that their BELIEF ≠ REALITY ON THE GROUND

Good problems are defined by going out and seeing for ourselves…
• Collect stories with humility
• Ask non-leading questions
What’s working well?
What’s not working well?
What would you change?
• Do not need 100 VOC, 5-10 is plenty to start


0%
10%
20%
30%
40%
50%
60%
70%
80%
90%
100%
0
1
2
3
4
5
6
7
8
9
10Compliance with CVL Bundle
Count
Cum %

1. Why is there lack of compliance with cap changes? Nurses do not know when the cap changes are due
2. Why don’t nurses know when the cap changes are due? The information is only located in the EMR and nurses rarely
document cap and dressing changes in the EMR 3. Why are cap changes rarely documented in the EMR? Nurses go to the patient’s line to find information that is needed
4. Why do nurses go to the patient’s line to find information? The information is easily visible (dressing changes and IV tubing
changes are written on the device) There is not a location for cap changes to be written
5. Why isn’t there a location on the line for cap changes? There is not room on the cap to write when it was changed


Good current state analysis and root cause analysis makes countermeasures obvious

Root Cause Countermeasure
Attending Surgeon perceptions of feasibility; perceptions of patient factors
Gather primary data from patients
Attending Surgeon Concern for adverse events
Rigorously track outcomes during PDSA cycles
Resident awareness of the guidelines
Include guidelines and new process in resident rotation orientation materials

Graham ID, et al. JHECP, 2006.

Test (verb): to find out the nature, quality, or value of something
Implement (verb): to take steps to put into practice


Adapted from Langley, et al. The Improvement Guide, 2009


Monitoring Plan
Statistical Process Control Charts
Control Plan
Visual Management Tools
Visual display (“job aide”)
Visual metrics

35
3128252219161310741
100
90
80
70
60
50
Day
Jo
urn
ey
Tim
e in
Min
ute
s

Displays To make staff
aware of data & information
Controls To guide the action
of staff members

“Implementing” instead of “testing”
Declaring victory too soon
Failure to assess the new process
Failure to adjust based on the assessment
Failing to plan for sustainability

Graham ID, et al. JHECP, 2006.

Process Map
Fishbone Diagram
Pareto Chart
Control Chart
39
PDSA Cycle Size
Visual Controls

