jefferies steel summit -...
TRANSCRIPT
Jefferies Steel Summit
April 10, 2013

Mike Thomson
President &
Chief Operating Officer

TM Forward-Looking Statements
Some of the information included in this presentation constitutes “forward-looking statements” as defined in Section 27A of the Securities Act of 1933, as amended and Section 21E of the Securities Exchange Act of 1934, as amended. All statements in this presentation that express opinions, expectations, beliefs, plans, objectives, assumptions or projections with respect to anticipated future performance of SunCoke or the Partnership, in contrast with statements of historical facts, are forward-looking statements. Such forward-looking statements are based on management’s beliefs and assumptions and on information currently available. Forward-looking statements include information concerning possible or assumed future results of operations, business strategies, financing plans, competitive position, potential growth opportunities, potential operating performance improvements, the effects of competition and the effects of future legislation or regulations. Forward-looking statements include all statements that are not historical facts and may be identified by the use of forward-looking terminology such as the words “believe,” “expect,” “plan,” “intend,” “anticipate,” “estimate,” “predict,” “potential,” “continue,” “may,” “will,” “should” or the negative of these terms or similar expressions. Although management believes that its plans, intentions and expectations reflected in or suggested by the forward-looking statements made in this presentation are reasonable, no assurance can be given that these plans, intentions or expectations will be achieved when anticipated or at all. Moreover, such statements are subject to a number of assumptions, risks and uncertainties. Many of these risks are beyond the control of SunCoke and the Partnership, and may cause actual results to differ materially from those implied or expressed by the forward-looking statements. Each of SunCoke and the Partnership has included in its filings with the Securities and Exchange Commission (including, in the case of the Partnership, its Form S-1) cautionary language identifying important factors (but not necessarily all the important factors) that could cause actual results to differ materially from those expressed in any forward-looking statement. For more information concerning these factors, see the Securities and Exchange Commission filings of SunCoke and the Partnership. All forward-looking statements included in this presentation are expressly qualified in their entirety by such cautionary statements. Although forward-looking statements are based on current beliefs and expectations, caution should be taken not to place undue reliance on any such forward-looking statements because such statements speak only as of the date hereof. SunCoke and the Partnership do not have any intention or obligation to update publicly any forward-looking statement (or its associated cautionary language) whether as a result of new information or future events or after the date of this presentation, except as required by applicable law. This presentation includes certain non-GAAP financial measures intended to supplement, not substitute for, comparable GAAP measures. Reconciliations of non-GAAP financial measures to GAAP financial measures are provided in the Appendix at the end of the presentation. Investors are urged to consider carefully the comparable GAAP measures and the reconciliations to those measures provided in the Appendix.
Jefferies Steel Summit - April 2013 3

ABOUT SUNCOKE
Jefferies Steel Summit - April 2013 4

TM About SunCoke
Largest independent producer of metallurgical coke in the Americas • Coke is an essential ingredient in blast
furnace production of steel
Cokemaking business generates ~89% of Adjusted EBITDA(1)
• 5.9 million tons of capacity in six facilities • 2012 U.S. coke production = 4.3m tons • General Partner and 58% owner of
SunCoke Energy Partners LP (SXCP)
Coal mining operations represents ~11% of Adjusted EBITDA(1)
• High quality mid-vol. metallurgical coal reserves in Virginia and West Virginia
• ~1.5 million tons mined in 2012
Jefferies Steel Summit - April 2013 5
(1)For a definition and reconciliation of Adjusted EBITDA, please see appendix.
Jewell Coke
17.1%
Other Domestic
Coke 67.5%
Int'l Coke 4.0% Coal
Mining 11.3%
SunCoke Business Segments
(excludes corporate costs)
12 months ended December 31, 2012 Revenue: $1.9 billion
Adjusted EBITDA: $265.7 million (includes corporate costs of $29.0 million)

TM
More than doubled capacity since 2006 with four new plants • Only company to design, build and
operate new greenfield developments in U.S. in more than a decade
• Supply nearly 20% of U.S. and Canada coke needs(1)
Secure, long-term take-or-pay contracts with leading steelmakers • Customers include ArcelorMittal, U.S.
Steel and AK Steel
Cokemaking operations are strategically located in proximity to customers’ facilities
The Leading Independent Cokemaker
Jefferies Steel Summit - April 2013 6
SunCoke Cokemaking Capacity
(In thousands of tons)
2006 2007 2008 2009 2010 2011 2012
Jewell Coke(Virginia)
Indiana Harbor(Indiana)
Haverhil l I(Ohio)
Vitór ia(Brazil )
Haverhil l II(Ohio)
Granite City(Illinois)
Middletown(Ohio)
2,490
4,190
4,740
5,390 5,390
5,940 5,940
(1) Source: Company estimates

TM 2012 Earnings Overview
7
(1) For a definition and reconciliation of Adjusted EBITDA, please see appendix.
(2) For a definition and reconciliation of free cash flow, please see appendix
Results driven by strong Coke business performance • Middletown startup has been a success • Entire U.S. cokemaking fleet delivering
strong results • 2012 cokemakeing Adjusted EBITDA per ton
was $57, solidly within targeted $55 to $60 per ton range
Coal remains a challenge • Higher than expected cash costs • Expect continued difficult demand/price
environment • Implementing aggressive coal action plan
Strong liquidity position • Cash balance of nearly $240 million and
virtually undrawn revolver of $150 million • FY 2012 free cash flow(2) of nearly $120
million
$0.87
$1.40
FY 2011 FY 2012
Earnings Per Share (diluted)
$138.8
$265.7
FY 2011 FY 2012
Adjusted EBITDA(1) (in millions)
Jefferies Steel Summit - April 2013

TM 2012 Accomplishments
8
• Executed successful Middletown startup
• Improved Indiana Harbor results
• Achieved solid operations across entire coke fleet
Proved our cokemaking
expertise
• Delivered positive coal Adjusted EBITDA and cash flow neutral results
• Implemented action plan to reduce costs and improve productivity
Took action to optimize coal
business
• Achieved 2012 financial targets
• Increased liquidity and generated free cash flow
Built financial strength and
flexibility
• Submitted permit application for potential new U.S. coke plant
• Executed SunCoke Energy Partners IPO in January 2013
• Initiated India entry strategy via VISA SunCoke JV, which closed in Q1 2013
Positioned for future growth
Jefferies Steel Summit - April 2013

TM Post SXCP IPO Organizational Structure
Domestic Coke Business
(Jewell & Other Domestic Coke)
International Coal Business
9
(1) Net to SXC and SXCP’s ownership interest in Haverhill and Middletown, respectively.
3 U.S. coking facilities with ~2.6 million tons of capacity
35% interest in 2 cokemaking facilities (Haverhill & Middletown) with ~0.6 million tons(1) of capacity
SXCP Coke Business
65% interest in 2 cokemaking facilities (Haverhill & Middletown) with ~1.1 million tons(1) of capacity
Represents ~25% of consolidated domestic cokemaking capacity at SXC
Vitoria, Brazil with 1.7 million tons of capacity
VISA SunCoke JV
~113 million ton coal reserves of primarily mid-vol coal
2013E production of 1.4 million tons
2% GP interest 56% LP interest 100% IDR
Jefferies Steel Summit - April 2013
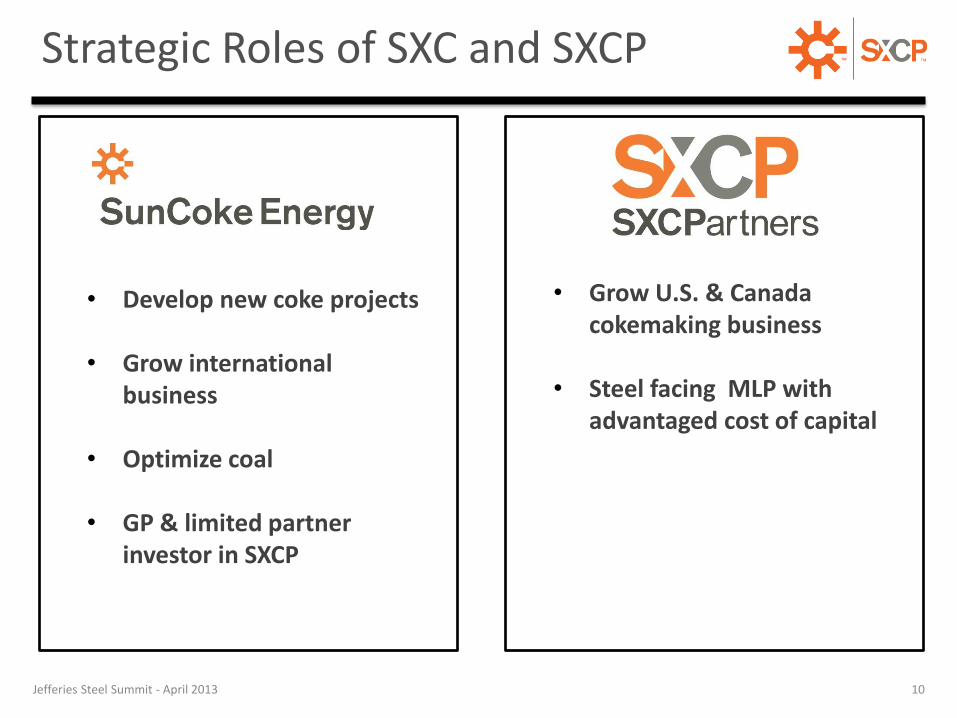
TM Strategic Roles of SXC and SXCP
• Grow U.S. & Canada cokemaking business
• Steel facing MLP with advantaged cost of capital
• Develop new coke projects
• Grow international business
• Optimize coal
• GP & limited partner investor in SXCP
Jefferies Steel Summit - April 2013 10

TM India Entry: VISA SunCoke
VISA SunCoke – Invested $67 million for 49% interest
–Approx. 1/3rd of coke and all steam production sold to VISA Steel
• Balance sold in merchant market, to customers such as SAIL and Tata
–Expect Adjusted EBITDA per ton to be similar to what we achieve in U.S.
–Near-term focus on execution in operations and management systems
– Long-term growth through development of new plants or acquisition of existing facilities
11
Photo courtesy of VISA Steel
VISA SunCoke JV positions us to capture coke demand growth in India, which is expected to more than double to 62 million mt by 2020
Chinese Heat Recovery
Coke: 400K tpy
Steam: 20 Mwhe
Built: 2007
Odisha, India
Jefferies Steel Summit - April 2013

SUNCOKE’S COKEMAKING TECHNOLOGY & COKE IN THE BLAST FURNACE
Jefferies Steel Summit - April 2013 12

TM SunCoke’s Cokemaking Technology
Jefferies Steel Summit - April 2013 13
Our industry-leading cokemaking technology meets U.S. EPA Maximum Achievable Control Technology (MACT) Standards
TM
Jefferies Steel Summit - April 2013 14
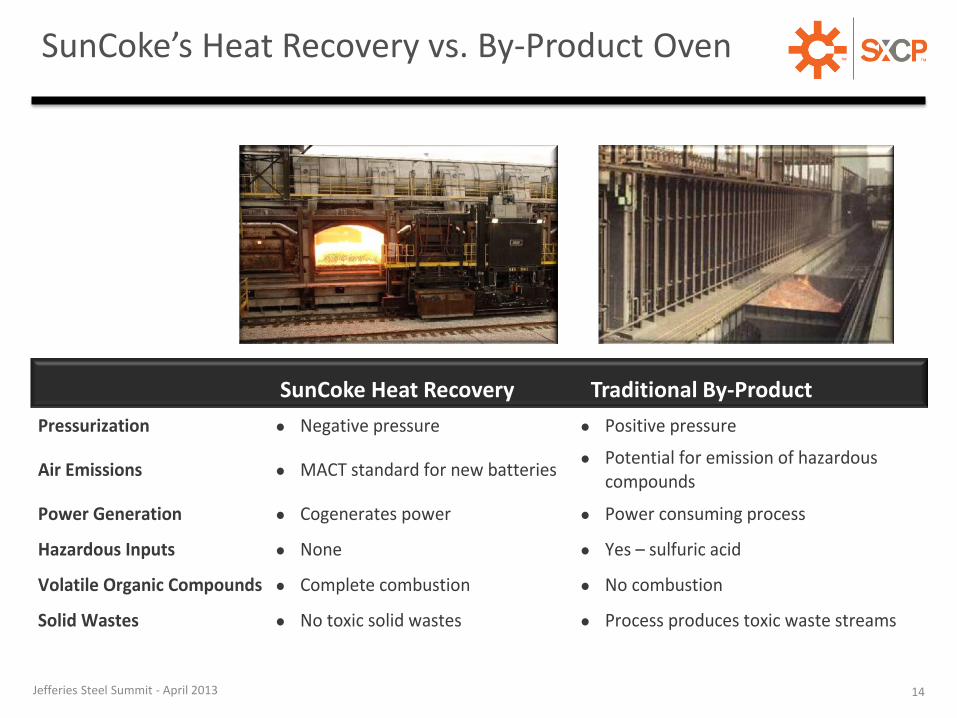
SunCoke’s Heat Recovery vs. By-Product Oven
SunCoke Heat Recovery Traditional By-Product
Pressurization Negative pressure Positive pressure
Air Emissions MACT standard for new batteries Potential for emission of hazardous
compounds
Power Generation Cogenerates power Power consuming process
Hazardous Inputs None Yes – sulfuric acid
Volatile Organic Compounds Complete combustion No combustion
Solid Wastes No toxic solid wastes Process produces toxic waste streams
SunCoke Heat Recovery Traditional By-Product
TM
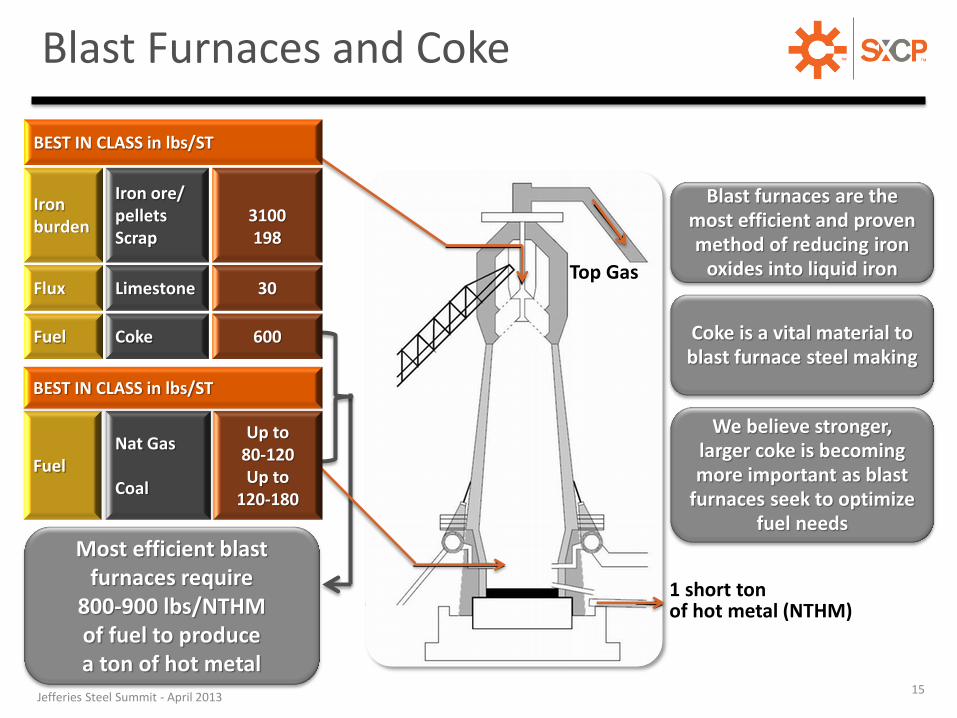
Most efficient blast furnaces require
800-900 lbs/NTHM of fuel to produce a ton of hot metal
Blast Furnaces and Coke
1 short ton of hot metal (NTHM)
Coke is a vital material to blast furnace steel making
Blast furnaces are the most efficient and proven method of reducing iron
oxides into liquid iron
We believe stronger, larger coke is becoming more important as blast
furnaces seek to optimize fuel needs
Top Gas
BEST IN CLASS in lbs/ST
Iron burden
Iron ore/ pellets Scrap
3100 198
Flux Limestone 30
Fuel Coke 600
BEST IN CLASS in lbs/ST
Fuel Nat Gas Coal
Up to 80-120 Up to
120-180
Jefferies Steel Summit - April 2013 15
SUNCOKE’S VALUE PROPOSITION & CONTRACT PROVISIONS
Jefferies Steel Summit - April 2013 16

TM SunCoke’s Value Proposition
Provide an assured supply of coke to steelmakers Larger, stronger coke for improved blast furnace performance
Demonstrated sustained 15% - 20% turndown capability
High quality coke with cheaper coal blends
Capital preservation and lower capacity cost per ton; particularly relative to greenfield investment
Stringent U.S. regulatory environment Power prices and reliability versus value of coke oven gas and
by-product "credits"
High Quality & Reliable
Coke Supply
Turndown Flexibility
Coal Flexibility
Capital Efficiency
& Flexibility
Environment/Economic Trade-offs
Jefferies Steel Summit - April 2013 17

TM Key Contract Provisions
Customers must take all our production up to a maximum or pay contract price for amount not taken −We are obligated to deliver a minimum quantity of coke annually
Represents profit and return on capital −Fixed fee is fixed for life of contract
Cost of coal is passed-through subject to achieving a contracted coal-to-coke yield standard
Operating costs are passed-through based on annually negotiated budget or a fixed budget adjusted for inflation
These costs are passed-through
Take-or-Pay
Fixed Fee
Coal Cost
Operating Costs
Transportation& Taxes
Jefferies Steel Summit - April 2013 18

OUR MARKET OPPORTUNITY
Jefferies Steel Summit - April 2013 19

TM
Jefferies Steel Summit - April 2013 20
U.S. & Canada Coke Supply
9
37
27% 24%
SunCoke U.S. &Canada
(excl SXC)
Column1 30-40 years 40+ years
Aging Cokemaking Facilities
Average Age % of U.S. & Canada coke production
Source: CRU, The Annual Outlook for Metallurgical Coke 2012.
Replace aging coke batteries operated by integrated steel producers
Source: CRU, The Annual Outlook for Metallurgical Coke 2012
51% of coke capacity is at facilities >30 years old
Integrated Steel
Producers 63%
SunCoke 18%
DTE 5%
Other Merchant & Foundry
6% Imports 8%
U.S. and Canada Opportunity
Total 2011 Coke Demand: 19.5 million tons

TM Coke Industry Fundamentals
Source: CRU, Metallurgical Coke Market Outlook 2012; Company analysis
We estimate nearly 4 million tons of capacity will be retired/replaced in coming years & another 4 million tons is potentially acquisition worthy
• Evaluation of all existing batteries in US & Canada • Customer quality
• Blast furnace competitiveness
• Battery condition
SXC Market Analysis
Facilities with Potential for Acquisition
• 6 batteries
• 4.1 million tons
Facilities with Potential for Replacement
• 19 batteries
• 4.0 million tons
Jefferies Steel Summit - April 2013 21
TM
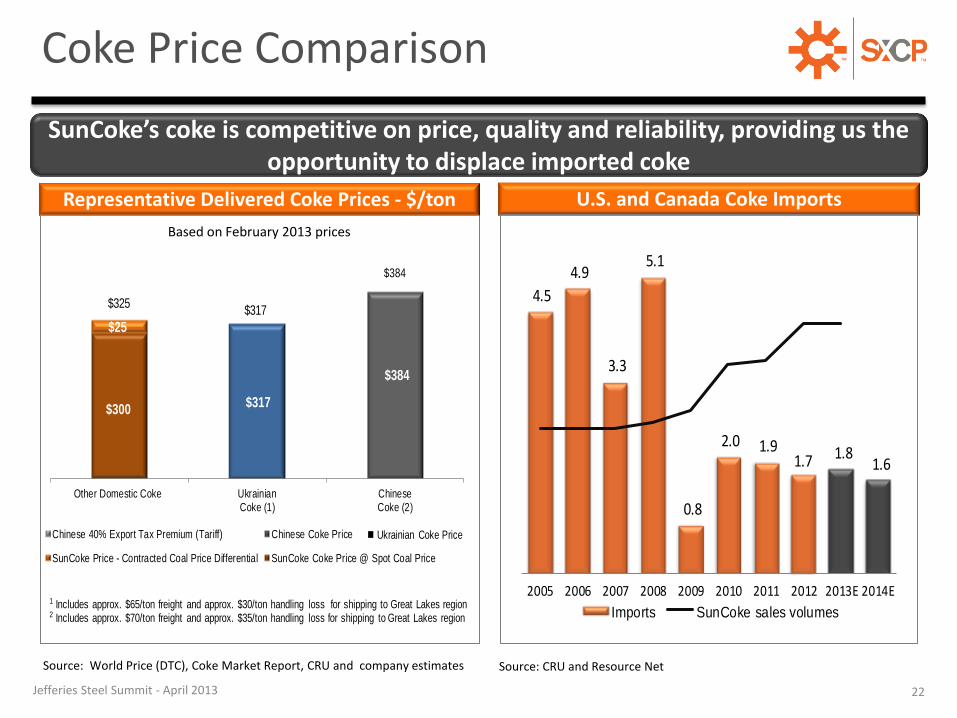
$300
$25
$317
$384
Other Domestic Coke UkrainianCoke (1)
ChineseCoke (2)
Chinese 40% Export Tax Premium (Tariff) Chinese Coke Price
SunCoke Price - Contracted Coal Price Differential SunCoke Coke Price @ Spot Coal Price
1 Includes approx. $65/ton freight and approx. $30/ton handling loss for shipping to Great Lakes region2 Includes approx. $70/ton freight and approx. $35/ton handling loss for shipping to Great Lakes region
$325$317
$384
Ukrainian Coke Price
Coke Price Comparison
Jefferies Steel Summit - April 2013 22
SunCoke’s coke is competitive on price, quality and reliability, providing us the opportunity to displace imported coke
Source: World Price (DTC), Coke Market Report, CRU and company estimates
Based on February 2013 prices
U.S. and Canada Coke Imports Representative Delivered Coke Prices - $/ton
4.5
4.9
3.3
5.1
0.8
2.0 1.9 1.7 1.8
1.6
2005 2006 2007 2008 2009 2010 2011 2012 2013E 2014E
Imports SunCoke sales volumes
Source: CRU and Resource Net

TM The India Growth Opportunity
23
Sources: CRU, Metallurgical Coke Outlook 2012, World Steel Association, Company estimates
India Steel/Coke
Market
Growing Steel Market
Coke Supply Deficit
Active Merchant Market
Electric Power Deficit 28
62
0
10
20
30
40
50
60
70
2012E 2020E
Mill
ion
s o
f M
etri
c To
ns
India Metallurgical Coke Demand
India offers attractive coke market fundamentals driven by growing steel demand
Per Capital Steel Demand (kg/yr)
India Brazil China
2011 57 123 460
Jefferies Steel Summit - April 2013

2013 PRIORITIES & OUTLOOK
Jefferies Steel Summit - April 2013 24

TM 2013 Priorities
Operational Excellence
•Sustain momentum at coke facilities
•Execute Indiana Harbor Plan
•Execute refurbishment
•Resolve NOV
•Renew coke contract with return on refurbishment capital
• Implement environmental project at Haverhill and Granite City
•Execute coal mining action plan to decrease cash costs
•Maintain top quartile safety performance
Grow The Coke Business
•Domestic
•Obtain permit for next potential U.S. facility
• Identify and pursue strategic acquisition opportunities in the U.S. and Canada
•Evaluate adjacent business lines to extend growth opportunities
• International
•Close VISA SunCoke joint venture transaction
• Identify potential follow-on opportunities in India
Strategically Optimize Assets
•SXCP
•Achieve smooth launch, governance and operation of SXCP
•Coal
•Reposition mining operations for near-term weakness and long-term strategic flexibility
•Efficient Capital Allocation
•Put SXC & SXCP balance sheets to work
Jefferies Steel Summit - April 2013 25

TM
$266 $205-$230
$0-$10 $0 - $10
($35-$50) ($5-$10)
FY 2012Adjusted
EBITDA (1)
DomesticCoke Business
(Jewell & OtherDomestic Coke)
International Coke Coal Mining CorporateCosts
2013E AdjustedEBITDA (1)
SXC: 2013 Adjusted EBITDA(1)
Outlook
Estimated 2013 results to be impacted by weak coal business, partly offset by continued solid coke operations and VISA SunCoke JV
($ in millions)
(1) For a definition and reconciliation of Adjusted EBITDA, please see the appendix.
Jefferies Steel Summit - April 2013 26
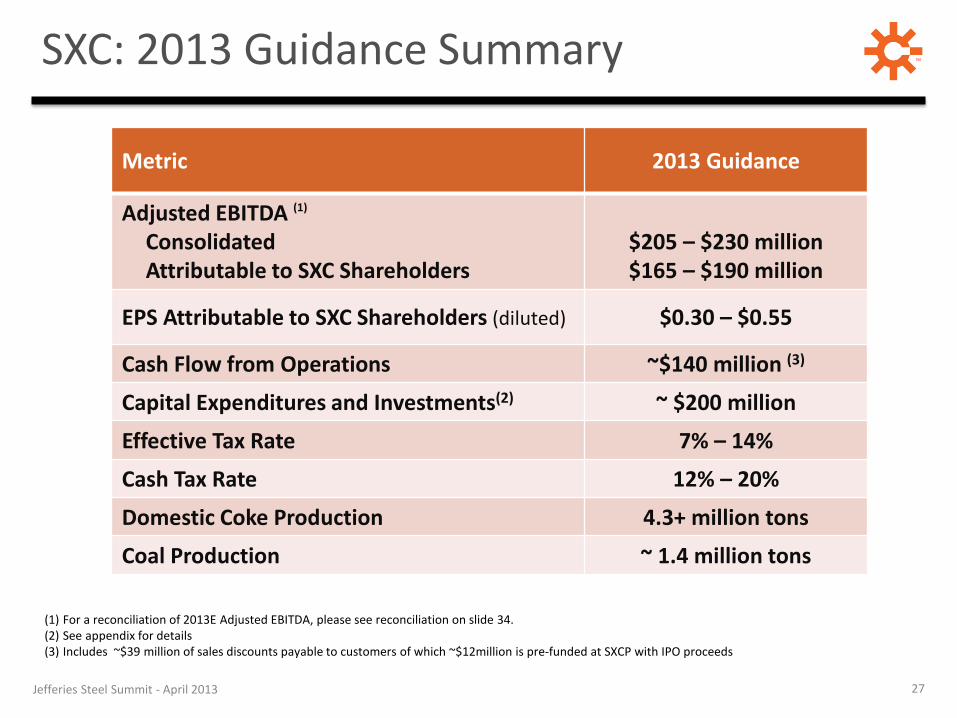
TM SXC: 2013 Guidance Summary
Metric 2013 Guidance
Adjusted EBITDA (1)
Consolidated Attributable to SXC Shareholders
$205 – $230 million $165 – $190 million
EPS Attributable to SXC Shareholders (diluted) $0.30 – $0.55
Cash Flow from Operations ~$140 million (3)
Capital Expenditures and Investments(2) ~ $200 million
Effective Tax Rate 7% – 14%
Cash Tax Rate 12% – 20%
Domestic Coke Production 4.3+ million tons
Coal Production ~ 1.4 million tons
(1) For a reconciliation of 2013E Adjusted EBITDA, please see reconciliation on slide 34. (2) See appendix for details (3) Includes ~$39 million of sales discounts payable to customers of which ~$12million is pre-funded at SXCP with IPO proceeds
Jefferies Steel Summit - April 2013 27

QUESTIONS?
Jefferies Steel Summit - April 2013 28

APPENDIX
Jefferies Steel Summit - April 2013 29

TM Definitions
• Adjusted EBITDA represents earnings before interest, taxes, depreciation, depletion and amortization (“EBITDA”) adjusted for sales discounts and the interest, taxes, depreciation, depletion and amortization attributable to equity earnings in our unconsolidated affiliates. EBITDA reflects sales discounts included as a reduction in sales and other operating revenue. The sales discounts represent the sharing with customers of a portion of nonconventional fuel tax credits, which reduce our income tax expense. However, we believe our Adjusted EBITDA would be inappropriately penalized if these discounts were treated as a reduction of EBITDA since they represent sharing of a tax benefit that is not included in EBITDA. Accordingly, in computing Adjusted EBITDA, we have added back these sales discounts. Our Adjusted EBITDA also includes EBITDA attributable to our unconsolidated affiliates. EBITDA and Adjusted EBITDA do not represent and should not be considered alternatives to net income or operating income under GAAP and may not be comparable to other similarly titled measures in other businesses. Adjusted EBITDA does not represent and should not be considered as an alternative to net income as determined by GAAP, and calculations thereof may not be comparable to those reported by other companies. We believe Adjusted EBITDA is an important measure of operating performance and provides useful information to investors because it highlights trends in our business that may not otherwise be apparent when relying solely on GAAP measures and because it eliminates items that have less bearing on our operating performance. Adjusted EBITDA is a measure of operating performance that is not defined by GAAP and should not be considered a substitute for net (loss) income as determined in accordance with GAAP.
• Adjusted EBITDA attributable to SXC/SXCP equals Adjusted EBITDA less Adjusted EBITDA attributable to noncontrolling interests.
• Adjusted EBITDA/Ton represents Adjusted EBITDA divided by tons sold. When applicable to Adjusted EBITDA attributable to SXC or SXCP, tons sold are prorated according to the respective ownership interest of SXC or SXCP as applicable.
• Free Cash Flow equals cash from operations less cash used in investing activities less cash distributions to non-controlling interests. Management believes Free Cash Flow information enhances an investor’s understanding of a business’ ability to generate cash. Free Cash Flow does not represent and should not be considered an alternative to net income or cash flows from operating activities as determined under GAAP and may not be comparable to other similarly titled measures of other businesses.
Jefferies Steel Summit - April 2013 30

TM Reconciliations
$ in millions FY 2012 FY 2011
Net Income 102.5 58.9
Subtract: Depreciation, depletion
and amortization (80.8) (58.4)
Subtract: Financing expense, net (47.8) (1.4)
Subtract: Income Tax (23.4) (7.2)
EBITDA 254.5 125.9
Add: Sales Discount 11.2 12.9
Add: Adjustment to
unconsolidated affiliate earnings - -
Adjusted EBITDA 265.7 138.8
Adjusted EBITDA attributable to
non controlling interests (3.0) 4.0
Adjusted EBITDA attributable to
SXC 262.7 142.8
Reconciliations from Net Income to
Adjusted EBITDA
Jefferies Steel Summit - April 2013 31

TM Free Cash Flow Reconciliation
Jefferies Steel Summit - April 2013 32
(in millions)
FY 2012
Cash from operations $206.1
Less cash used for investing activities (84.1)
Less payments to non controlling interest (2.3)
Free Cash Flow $119.7

TM Expected 2013E EBITDA Reconciliation
(in millions)
2013E
Low
2013E
High
Net Income $43 $60
Depreciation, Depletion and Amortization 97 95
Total financing costs, net 55 55
Income tax expense 3 10
EBITDA $198 $220
Sales discounts 7 7
Adjustment to unconsolidated affiliate earnings(1) – 3
Adjusted EBITDA $205 $230
EBITDA attributable to noncontrolling interests(2) (40) (40)
Adjusted EBITDA attributable to SXC $165 $190
Jefferies Steel Summit - April 2013 33
(1) Represents SXC share of India JV interest, taxes and depreciation expense (2) Represents Adjusted EBITDA attributable to SXCP public unitholders and to DTE’s interest in Indiana Harbor

TM 2013E Capital Expenditures and Investments
($ in millions) SXC SXCP Consolidated
On-Going Approx. $49 $9 $58
Environmental
RemediationApprox. - $15 $15
Expansion Approx. 60 - 60
Total CapEx Approx. $109 $24 $133
Investments Approx. $67 - $67
Total CapEx &
InvestmentsApprox. $176 $24 $200
• Expansion includes approx. $60m for Indiana Harbor
Refurbishment
• SXCP expenditures prefunded from IPO proceeds
• To fund investment in India JV (Visa SunCoke)
• SXC includes approximately $25m coke and $24m coal
• SXCP includes 65% of $14m expected at Haverhill and Middletown
Jefferies Steel Summit - April 2013 34

TM ProForma Liquidity & Debt Metrics
35
(1) SunCoke cash retained includes $33M of capital expenditures reimbursement from SXCP and $40M of accounts receivable retained from Haverhill and Middletown entities prior to contribution to SXCP; SXCP cash retained includes $67M and $12M for pre-funding of environmental remediation and sales discounts obligations and assumes $40M of cash retained is used to fund replenishment of working capital.
(2) SunCoke total debt equal to $720 million balance outstanding at 12/31/12 less $225 million term loan repayment completed in conjunction with SXCP IPO. SXCP total debt equal to $150 million from senior notes offering completed in conjunction with IPO. Net Debt is equal to Total Debt less Total ProForma cash (excluding cash retained for prefunding of obligations at SXCP).
(3) SunCoke 2013E Adjusted EBITDA based on mid-point of 2013E guidance range of $165 to $190 million ($177.5 million for Adjusted EBITDA attributable to SXC). SXCP 2013E Adjusted EBITDA based on $88.3 million forecast.
nm – Not meaningful For a definition and a reconciliation of Adjusted EBITDA, please see the appendix.
Jefferies Steel Summit - April 2013