2000web.pdx.edu/~jduh/courses/geog492w16/projects/11_finalposter_ar… · north 17.74% 13.14% 7.30%...
TRANSCRIPT
Map Layers:Portland RLIS: Streets, Rivers, City Boundary, ParksUS Census Bureau: Demographic DataAmerican Community Survey: Demographic DataResearch Sources:Caraeff, EA. 2011. The Oregonian Tackles the House Show Menace that is Plaguing the City of Portland. Blogtown PDX: The Portland Mercury. Blog.Fuller, D. 2012. Vanishing All-Ages Venues. Portland State Vanguard. Web article.Griffin, A. 2011. Home Based Music Clubs Popping Up in Portland Residential Neighborhoods. The Oregonian. Web article.Kroener, M. 2014. How to Survive as an All Ages Venue. Think Out Loud: Oregon Public Broadcasting. Web article.Troper, M. 2015. No Way to Kill It: The Portland All Ages Music Scene that Portland Doesn’t Want You to Know About. Portland Mercury. Web Article. Special Thanks:Nathan Backous, Maggie Morris, Jesse Laney, Geoffrey Duh, Toby Wickwire, Arya Imig, PC-PDX
American Community Survey: Demographic DataResearch Sources:Caraeff, EA. 2011. The Oregonian Tackles the House Show Menace that is Plaguing the City of Portland. Blogtown PDX: The Portland Mercury. Blog.Fuller, D. 2012. Vanishing All-Ages Venues. Portland State Vanguard. Web article.Griffin, A. 2011. Home Based Music Clubs Popping Up in Portland Residential Neighborhoods. The Oregonian. Web article.Kroener, M. 2014. How to Survive as an All Ages Venue. Think Out Loud: Oregon Public Broadcasting. Web article.Troper, M. 2015. No Way to Kill It: The Portland All Ages Music Scene that Portland Doesn’t Want You to Know About. Portland Mercury. Web Article. Special Thanks:Nathan Backous, Maggie Morris, Jesse Laney, Geoffrey Duh, Toby Wickwire, Arya Imig, PC-PDX
2000
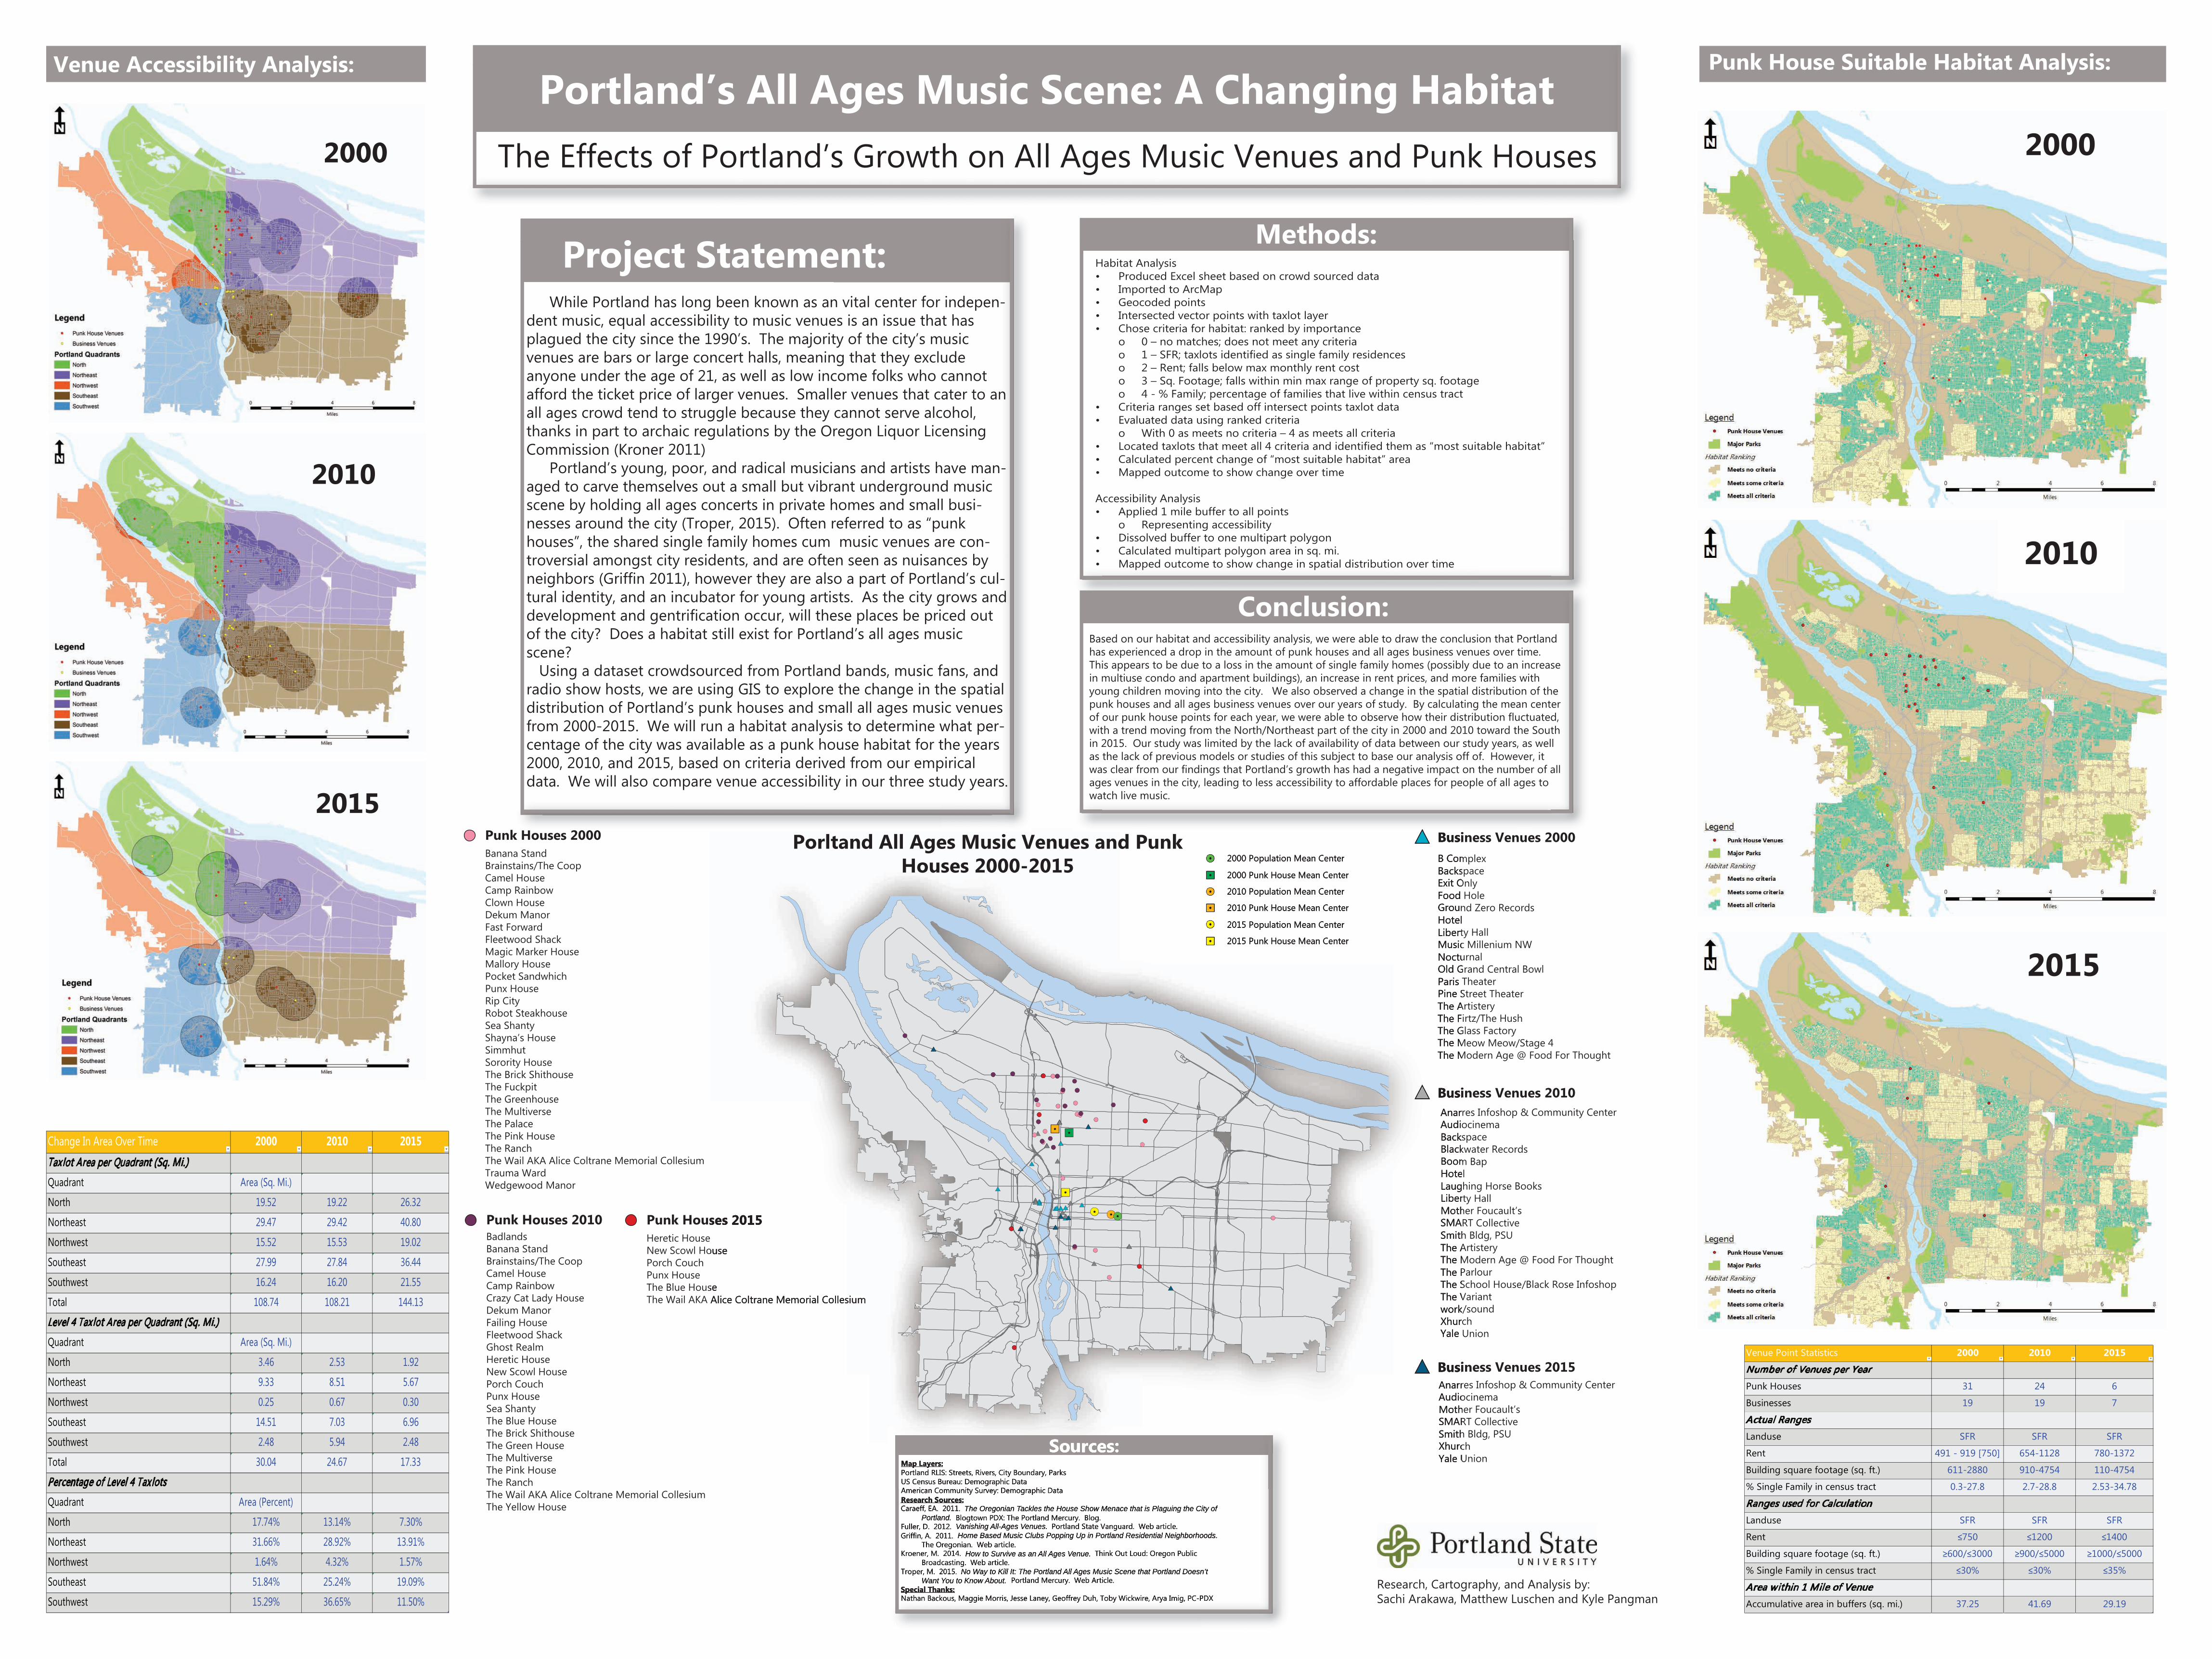
Venue Point Statistics 2000 2010 2015Number of Venues per YearPunk Houses 31 24 6Businesses 19 19 7Actual RangesLanduse SFR SFR SFRRent 491 - 919 [750] 654-1128 780-1372Building square footage (sq. ft.) 611-2880 910-4754 110-4754% Single Family in census tract 0.3-27.8 2.7-28.8 2.53-34.78Ranges used for CalculationLanduse SFR SFR SFRRent ≤750 ≤1200 ≤1400Building square footage (sq. ft.) ≥600/≤3000 ≥900/≤5000 ≥1000/≤5000% Single Family in census tract ≤30% ≤30% ≤35%Area within 1 Mile of VenueAccumulative area in buffers (sq. mi.) 37.25 41.69 29.19
Change In Area Over Time 2000 2010 2015Taxlot Area per Quadrant (Sq. Mi.)Quadrant Area (Sq. Mi.) North 19.52 19.22 26.32Northeast 29.47 29.42 40.80Northwest 15.52 15.53 19.02Southeast 27.99 27.84 36.44Southwest 16.24 16.20 21.55Total 108.74 108.21 144.13Level 4 Taxlot Area per Quadrant (Sq. Mi.)Quadrant Area (Sq. Mi.)North 3.46 2.53 1.92Northeast 9.33 8.51 5.67Northwest 0.25 0.67 0.30Southeast 14.51 7.03 6.96Southwest 2.48 5.94 2.48Total 30.04 24.67 17.33Percentage of Level 4 TaxlotsQuadrant Area (Percent)North 17.74% 13.14% 7.30%Northeast 31.66% 28.92% 13.91%Northwest 1.64% 4.32% 1.57%Southeast 51.84% 25.24% 19.09%Southwest 15.29% 36.65% 11.50%
While Portland has long been known as an vital center for indepen-dent music, equal accessibility to music venues is an issue that has plagued the city since the 1990’s. The majority of the city’s music venues are bars or large concert halls, meaning that they exclude anyone under the age of 21, as well as low income folks who cannot afford the ticket price of larger venues. Smaller venues that cater to an all ages crowd tend to struggle because they cannot serve alcohol, thanks in part to archaic regulations by the Oregon Liquor Licensing Commission (Kroner 2011) Portland’s young, poor, and radical musicians and artists have man-aged to carve themselves out a small but vibrant underground music scene by holding all ages concerts in private homes and small busi-nesses around the city (Troper, 2015). Often referred to as “punk houses”, the shared single family homes cum music venues are con-troversial amongst city residents, and are often seen as nuisances by neighbors (Griffin 2011), however they are also a part of Portland’s cul-tural identity, and an incubator for young artists. As the city grows and development and gentrification occur, will these places be priced out of the city? Does a habitat still exist for Portland’s all ages music scene? Using a dataset crowdsourced from Portland bands, music fans, and radio show hosts, we are using GIS to explore the change in the spatial distribution of Portland’s punk houses and small all ages music venues from 2000-2015. We will run a habitat analysis to determine what per-centage of the city was available as a punk house habitat for the years 2000, 2010, and 2015, based on criteria derived from our empirical data. We will also compare venue accessibility in our three study years.
Punk Houses 2015 Heretic HouseNew Scowl HousePorch CouchPunx HouseThe Blue HouseThe Wail AKA Alice Coltrane Memorial Collesium
Punk Houses 2010 BadlandsBanana StandBrainstains/The CoopCamel HouseCamp RainbowCrazy Cat Lady HouseDekum ManorFailing HouseFleetwood ShackGhost RealmHeretic HouseNew Scowl HousePorch CouchPunx HouseSea ShantyThe Blue HouseThe Brick ShithouseThe Green HouseThe MultiverseThe Pink HouseThe RanchThe Wail AKA Alice Coltrane Memorial CollesiumThe Yellow House
Punk Houses 2000Banana StandBrainstains/The CoopCamel HouseCamp RainbowClown HouseDekum ManorFast ForwardFleetwood ShackMagic Marker HouseMallory HousePocket SandwhichPunx HouseRip CityRobot SteakhouseSea ShantyShayna’s HouseSimmhutSorority HouseThe Brick ShithouseThe FuckpitThe GreenhouseThe MultiverseThe PalaceThe Pink HouseThe RanchThe Wail AKA Alice Coltrane Memorial CollesiumTrauma WardWedgewood Manor
Business Venues 2015 Anarres Infoshop & Community CenterAudiocinemaMother Foucault’sSMART CollectiveSmith Bldg, PSUXhurchYale Union
Business Venues 2010Anarres Infoshop & Community CenterAudiocinemaBackspaceBlackwater RecordsBoom BapHotelLaughing Horse BooksLiberty HallMother Foucault’sSMART CollectiveSmith Bldg, PSUThe ArtisteryThe Modern Age @ Food For ThoughtThe Parlour The School House/Black Rose InfoshopThe Variantwork/soundXhurchYale Union
Business Venues 2000B ComplexBackspaceExit OnlyFood HoleGround Zero RecordsHotelLiberty HallMusic Millenium NWNocturnalOld Grand Central BowlParis Theater Pine Street TheaterThe ArtisteryThe Firtz/The HushThe Glass FactoryThe Meow Meow/Stage 4The Modern Age @ Food For Thought
Habitat Analysis• Produced Excel sheet based on crowd sourced data• Imported to ArcMap• Geocoded points• Intersected vector points with taxlot layer• Chose criteria for habitat: ranked by importance o 0 – no matches; does not meet any criteria o 1 – SFR; taxlots identified as single family residences o 2 – Rent; falls below max monthly rent cost o 3 – Sq. Footage; falls within min max range of property sq. footage o 4 - % Family; percentage of families that live within census tract• Criteria ranges set based off intersect points taxlot data• Evaluated data using ranked criteria o With 0 as meets no criteria – 4 as meets all criteria• Located taxlots that meet all 4 criteria and identified them as “most suitable habitat”• Calculated percent change of “most suitable habitat” area• Mapped outcome to show change over time
Accessibility Analysis• Applied 1 mile buffer to all points o Representing accessibility• Dissolved buffer to one multipart polygon• Calculated multipart polygon area in sq. mi.• Mapped outcome to show change in spatial distribution over time
Based on our habitat and accessibility analysis, we were able to draw the conclusion that Portland has experienced a drop in the amount of punk houses and all ages business venues over time. This appears to be due to a loss in the amount of single family homes (possibly due to an increase in multiuse condo and apartment buildings), an increase in rent prices, and more families with young children moving into the city. We also observed a change in the spatial distribution of the punk houses and all ages business venues over our years of study. By calculating the mean center of our punk house points for each year, we were able to observe how their distribution fluctuated, with a trend moving from the North/Northeast part of the city in 2000 and 2010 toward the South in 2015. Our study was limited by the lack of availability of data between our study years, as well as the lack of previous models or studies of this subject to base our analysis off of. However, it was clear from our findings that Portland’s growth has had a negative impact on the number of all ages venues in the city, leading to less accessibility to affordable places for people of all ages to watch live music.
2000 Population Mean Center
2000 Punk House Mean Center
2010 Population Mean Center
2010 Punk House Mean Center
2015 Population Mean Center
2015 Punk House Mean Center
Map Layers:Portland RLIS: Streets, Rivers, City Boundary, ParksUS Census Bureau: Demographic DataAmerican Community Survey: Demographic Data
Punk Houses 2015
New Scowl House
The Blue HouseThe Wail AKA Alice Coltrane Memorial Collesium
Business Venues 2015 Anarres Infoshop & Community CenterAudiocinemaMother Foucault’sSMART CollectiveSmith Bldg, PSUXhurchYale Union
Business Venues 2010Anarres Infoshop & Community CenterAudiocinemaBackspaceBlackwater RecordsBoom BapHotelLaughing Horse BooksLiberty HallMother Foucault’sSMART CollectiveSmith Bldg, PSUThe ArtisteryThe Modern Age @ Food For ThoughtThe Parlour The School House/Black Rose InfoshopThe Variantwork/soundXhurchYale Union
Business Venues 2000B ComplexBackspaceExit OnlyFood HoleGround Zero RecordsHotelLiberty HallMusic Millenium NWNocturnalOld Grand Central BowlParis Theater Pine Street TheaterThe ArtisteryThe Firtz/The HushThe Glass FactoryThe Meow Meow/Stage 4The Modern Age @ Food For Thought
2000 Population Mean Center
2000 Punk House Mean Center
2010 Population Mean Center
2010 Punk House Mean Center
2015 Population Mean Center
2015 Punk House Mean Center
Porltand All Ages Music Venues and Punk Houses 2000-2015
Research, Cartography, and Analysis by:Sachi Arakawa, Matthew Luschen and Kyle Pangman