jay walsh northwestern university 10/05/2018 final report
TRANSCRIPT
AFRL-AFOSR-VA-TR-2018-0402
Air Force 2030 Science & Technology Organizational and Process Study at NorthwesternUniversity
Jay WalshNORTHWESTERN UNIVERSITY
Final Report10/05/2018
DISTRIBUTION A: Distribution approved for public release.
AF Office Of Scientific Research (AFOSR)/ RTB2Arlington, Virginia 22203
Air Force Research Laboratory
Air Force Materiel Command
REPORT DOCUMENTATION PAGE Form Approved OMB No. 0704-0188
The public reporting burden for this collection of information is estimated to average 1 hour per response, including the time for reviewing instructions, searching existing data sources, gathering and maintaining the data needed, and completing and reviewing the collection of information. Send comments regarding this burden estimate or any other aspect of this collection of information, including suggestions for reducing the burden, to Department of Defense, Washington Headquarters Services, Directorate for Information Operations and Reports (0704-0188), 1215 Jefferson Davis Highway, Suite 1204, Arlington, VA 22202-4302. Respondents should be aware that notwithstanding any other provision of law, no person shall be subject to any penalty for failing to comply with a collection of information if it does not display a currently valid OMB control number. PLEASE DO NOT RETURN YOUR FORM TO THE ABOVE ADDRESS.
1. REPORT DATE (DD-MM-YYYY)
28-09-20182. REPORT TYPEFINAL
3. DATES COVERED (From - To)
01-03-2018 - 28-09-20184. TITLE AND SUBTITLE
Northwestern University AFRL Science & Technology 2030 Initiative Business Organization and Process Study
5a. CONTRACT NUMBER
5b. GRANT NUMBER
FA9550-18-1-0302 5c. PROGRAM ELEMENT NUMBER
6. AUTHOR(S)
Walsh, Joseph, T.; Cao, Jian; Dhar, Lisa; Kumar, Prem; Lippitz, Michael, J.;Loffler, Alicia; Moore, Nicole; Sawhney, Mohanbir; Werwath, Mark, W.;Wolcott, Robert, C.; Yehiely, Fruma
5d. PROJECT NUMBER
5e. TASK NUMBER
5f. WORK UNIT NUMBER
7. PERFORMING ORGANIZATION NAME(S) AND ADDRESS(ES)NORTHWESTERN UNIVERSITY633 CLARK ST EVANSTONEVANSTON IL 60208-0001
8. PERFORMING ORGANIZATIONREPORT NUMBER
201809-NU01
9. SPONSORING/MONITORING AGENCY NAME(S) AND ADDRESS(ES)USAF, AFRL DUNS 143574726AF OFFICE OF SCIENTIFIC RESEARCH875 NORTH RANDOLPH STREET, RM 3112ARLINGTON VA 22203-1954JULIA A. CARRICO 7036966564
10. SPONSOR/MONITOR'S ACRONYM(S)AFRL
11. SPONSOR/MONITOR'S REPORTNUMBER(S)
12. DISTRIBUTION/AVAILABILITY STATEMENTunrestricted
13. SUPPLEMENTARY NOTES
14. ABSTRACTAs part of the United States Air Force (USAF) “Science and Technology (S&T) Strategy 2030” study, this report presentsthe Northwestern University team’s findings and recommendations on business processes and organizational structuresthat have proven effective at promoting, supporting, and managing early stage research. The recommendations areorganized around four themes, which were informed by: (1) interviews with AFRL personnel during an on-site visit toWright-Patterson Air Force Base, (2) a workshop composed of internal/external expert discussions, and (3) the expertiseand experience of the study team.15. SUBJECT TERMS
16. SECURITY CLASSIFICATION OF: 17. LIMITATION OFABSTRACT
18. NUMBEROFPAGES
64
19a. NAME OF RESPONSIBLE PERSON
Dr. Joseph Walsh a. REPORT
unclassified
b. ABSTRACT
unclassified
c. THIS PAGE
unclassified 19b. TELEPHONE NUMBER (Include area code)
847-491-3485Standard Form 298 (Rev. 8/98) Prescribed by ANSI Std. Z39.18 DISTRIBUTION A: Distribution approved for public release.
INSTRUCTIONS FOR COMPLETING SF 298
1. REPORT DATE. Full publication date, including day, month, if available. Must cite at least the year and be Year 2000 compliant, e.g. 30-06-1998; xx-06-1998; xx-xx-1998.
2. REPORT TYPE. State the type of report, such as final, technical, interim, memorandum, master's thesis, progress, quarterly, research, special, group study, etc.
3. DATE COVERED. Indicate the time during which the work was performed and the report was written, e.g., Jun 1997 - Jun 1998; 1-10 Jun 1996; May - Nov 1998; Nov 1998.
4. TITLE. Enter title and subtitle with volume number and part number, if applicable. On classified documents, enter the title classification in parentheses.
5a. CONTRACT NUMBER. Enter all contract numbers as they appear in the report, e.g. F33315-86-C-5169.
5b. GRANT NUMBER. Enter all grant numbers as they appear in the report. e.g. AFOSR-82-1234.
5c. PROGRAM ELEMENT NUMBER. Enter all program element numbers as they appear in the report, e.g. 61101A.
5e. TASK NUMBER. Enter all task numbers as they appear in the report, e.g. 05; RF0330201; T4112.
5f. WORK UNIT NUMBER. Enter all work unit numbers as they appear in the report, e.g. 001; AFAPL30480105.
6. AUTHOR(S). Enter name(s) of person(s) responsible for writing the report, performing the research, or credited with the content of the report. The form of entry is the last name, first name, middle initial, and additional qualifiers separated by commas, e.g. Smith, Richard, J, Jr.
7. PERFORMING ORGANIZATION NAME(S) AND ADDRESS(ES). Self-explanatory.
8. PERFORMING ORGANIZATION REPORT NUMBER. Enter all unique alphanumeric report numbers assigned by the performing organization, e.g. BRL-1234; AFWL-TR-85-4017-Vol-21-PT-2.
9. SPONSORING/MONITORING AGENCY NAME(S) AND ADDRESS(ES). Enter the name and address of the organization(s) financially responsible for and monitoring the work.
10. SPONSOR/MONITOR'S ACRONYM(S). Enter, if available, e.g. BRL, ARDEC, NADC.
11. SPONSOR/MONITOR'S REPORT NUMBER(S). Enter report number as assigned by the sponsoring/ monitoring agency, if available, e.g. BRL-TR-829; -215.
12. DISTRIBUTION/AVAILABILITY STATEMENT. Use agency-mandated availability statements to indicate the public availability or distribution limitations of the report. If additional limitations/ restrictions or special markings are indicated, follow agency authorization procedures, e.g. RD/FRD, PROPIN, ITAR, etc. Include copyright information.
13. SUPPLEMENTARY NOTES. Enter information not included elsewhere such as: prepared in cooperation with; translation of; report supersedes; old edition number, etc.
14. ABSTRACT. A brief (approximately 200 words) factual summary of the most significant information.
15. SUBJECT TERMS. Key words or phrases identifying major concepts in the report.
16. SECURITY CLASSIFICATION. Enter security classification in accordance with security classification regulations, e.g. U, C, S, etc. If this form contains classified information, stamp classification level on the top and bottom of this page.
17. LIMITATION OF ABSTRACT. This block must be completed to assign a distribution limitation to the abstract. Enter UU (Unclassified Unlimited) or SAR (Same as Report). An entry in this block is necessary if the abstract is to be limited.
Standard Form 298 Back (Rev. 8/98)
DISTRIBUTION A: Distribution approved for public release.
D
AFRL SCIENCE & TECHNOLOGY 2030 INITIATIVE
BUSINESS ORGANIZATION & PROCESS STUDY
REPORT
NORTHWESTERN UNIVERSITYEVANSTON, IL SEPTEMBER 28, 2018
Grant / AFRL FA9550-18-1-0302Principal Investigator / Jay T. Walsh
UNCLASSIFIED
DISTRIBUTION A: Distribution approved for public release.

This material is based upon work supported by the Air Force Office of Scientific Research
under award number FA9550-18-1-0302
DISTRIBUTION A: Distribution approved for public release.
FINAL TECHNICAL REPORT
AIR FORCE SCIENCE & TECHNOLOGY 2030 INITIATIVEBUSINESS ORGANIZATION & PROCESS STUDY
AFRL FA9550-18-1-0302
NORTHWESTERN UNIVERSITYEVANSTON, ILSEPTEMBER 28, 2018
STUDY PRINCIPAL INVESTIGATORJay T. Walsh // Vice President for Research, Northwestern University
CO-INVESTIGATORSJian Cao // Associate Vice President for Research Lisa Dhar // Director, New Business Ventures for Engineering, Innovation & New Ventures (INVO) Prem Kumar // Professor, Electrical Engineering and Computer ScienceMichael J. Lippitz // Principal, ClareoAlicia Loffler // Associate Provost, Innovation & New Ventures (INVO)Nicole M. Moore // Director, Office of Research DevelopmentMohanbir S. Sawhney // Clinical Professor, MarketingMark W. Werwath // Clinical Associate Professor, Industrial Engineering and Management SciencesRobert C. Wolcott // Clinical Professor, Innovation & Entrepreneurship, Kellogg at NorthwesternFruma Yehiely // Associate Vice President for Research
LIST OF PARTICIPANTSNicholas Angeloni // Director, Strategic Planning and Coordination, Office for Research, Northwestern Iqbal Arshad // Senior Vice President, Mobile Products, LenovoSuzanne Bell // Professor, Industrial & Organizational Psychology, DePaul UniversityJames Bellingham // Director, Center for Marine Robotics, Woods Hole Oceanographic InstitutePushpalatha Bhat // Senior Scientist, Particle Physics Division, FermilabKent Bostick // Deputy Director, National Security Programs, Argonne National LaboratoryJim Bray // Director, Corporate Engagement, Northwestern Karen Cielo // Senior Associate Director, Office of Research Development, NorthwesternTim Collins // Chief Technology Officer, RF IDeas, Inc. Paul Collopy // Professor, Industrial & Systems Engineering and Engineering Management, University of AlabamaClark Cooper // Senior Advisor for Science, Directorate for Mathematical and Physical Sciences, National Science FoundationThomas Day // Founder, Invent2026Frank Donnelly // Strategic Advisor, Financial Management, Air Force Research Laboratory
S&T Business Organization and Process Study Page 3
DISTRIBUTION A: Distribution approved for public release.
Mitra Dutta // Vice Chancellor for Research, University of Illinois at Chicago Gabi Edgerton // Technical Writer, Red Pen Scientific, Inc. Dan Friend // Senior Army Fellow, Kellogg at Northwestern Jay Harrison // Chief Innovation Officer, Army Futures Command Task Force, US ArmyGretchen Jordan // Principal, 360 Innovation LLCLuciano Kay // Research Associate, Institute for Social, Behavioral, and Economic Research, University of California Santa BarbaraSteven Lauver // Deputy Director, A8XP Innovation Branch, US Air ForcePeggy Matson // Director & Clinical Professor, Graduate Studies in Engineering Management and Project Management, Washington University in St. LouisMegan McConnell // Program Assistant, Office of Research Development, NorthwesternRebecca McNaughton // Assistant Director, Office of Research Development, NorthwesternRobert Mittman // Founder, Facilitation | Foresight | Strategy Kirt Moser // Deputy Director, Center for Rapid Innovation, Air Force Research LaboratoryRuth Moser // Director, Sensors Directorate, Air Force Research LaboratoryDavid Rosen // CEO & Founder, TechX FoundryRudyard Sadleir // Business Development Executive, Argonne National LaboratoryBill Seng // Manager, AS&T Portfolio Deputy/Assurance, Sandia National LaboratoriesNed Smith // Associate Professor, Management and Organizations, Kellogg at NorthwesternMichael Stroscio // Professor, Electrical & Computer Engineering, Bioengineering, and Physics, University of Illinois at ChicagoMark Tschopp // Regional Director, ARL-Central, Army Research LaboratoryAnthony Weeks // Graphic Recorder, Five Elements Consulting GroupGerald Whittaker // Strategy Consultant, Scoop & Associates, LTD / Air Force Research Laboratory, Phillips Research Site at Kirtland, NMBrian Zuckerman // Research Staff Member, Science and Technology Policy Institute, Institute for Defense Analyses
Page 4 S&T Business Organization and Process Study
DISTRIBUTION A: Distribution approved for public release.
S&T Business Organization & Process Study Page 5
EXECUTIVE SUMMARY
Background & Methodology
As part of the United States Air Force (USAF) “Science and Technology (S&T) Strategy 2030” study, this
report presents the Northwestern University (NU) team’s findings and recommendations on business
processes and organizational structures that have proven effective at promoting, supporting, and managing
early stage research. The recommendations are organized around the four themes listed below, which were
informed by: (1) interviews with AFRL personnel during an on-site visit to Wright-Patterson Air Force
Base, (2) a workshop composed of internal/external expert discussions, and (3) the expertise and experience
of the NU study team.
Identifying Research Areas and adjusting as S&T evolve and new goals/missions emerge.
Measuring Return on Investment (ROI) in diverse research fields and project types.
Optimizing Organization Structure (governance, leadership, and recruitment) to facilitate agility
and support innovation.
Optimizing S&T Strategy based on mission, opportunities, and resources.
A Call for Change
USAF Site Visit. USAF personnel emphasized the need for flexibility to establish and adjust the S&T
portfolio in response to changing technology and missions. Challenges include insufficient communication
and program coordination, absence of standardized project evaluation criteria, unclear high-level strategy,
and suboptimal personnel recruitment.
Identifying Research Areas. The competitiveness of the USAF relies on accurately identifying early
stage research areas that align with strategic goals and readily evolve in response to scientific progress and
discovery (as well as new goals). The NU team recommends an integrated approach that blends 3 models:
(1) a problem-focused model that supports applied research directly aligned with well-specified challenges;
(2) a discovery-based model that supports exploratory projects in new fields relevant to the USAF mission;
and (3) a challenge current thinking model based on fostering an organizational culture that questions
assumptions to identify new directions of potentially breakthrough research.
Measuring Return on Investment. Novel or emerging technologies will not always have clear
applications, and the “value” of a given technology may be differently assessed by funders versus users.
The NU team recommends a broad approach to measuring ROI using metrics from leading research
institutions. Metrics should accommodate technologies developed in response to a requirement (problem-
focused research), as well as those developed in anticipation of future needs or those that have no clear
current application (discovery-based research). In addition, such metrics, must consider the impact of the
technology on resource and personnel pipelines. Relevant models identified include overall S&T strategy
assessment, key performance indicators, and contribution analysis.
Optimizing Organization Structure. Organization structures can simplify access to knowledge and
intelligence, help attract and engage a world-class workforce, and enhance synergy among various efforts.
Structures should be selected based on different project types, goals, and objectives and may overlay the
existing organization structure and foundation. The NU team identified 3 models that each encourage
innovation in different ways: (1) the challenge-driven teams model, in which groups are assembled with a
clear purpose or strategic direction; (2) the enabler model, in which leadership directly supports
entrepreneurial efforts by employees; and (3) the affinity networks model, in which virtual organizations
are created via a shared immersive or inspirational experience to establish connections and valuable
collaborations.
DISTRIBUTION A: Distribution approved for public release.
Page 6 S&T Business Organization & Process Study
Optimizing S&T Strategy. The overall S&T strategy for USAF requires an interconnected approach that
allows for the continuous reevaluation of future needs and identification of weaknesses, disruptive
opportunities, and threats. The NU team identified 3 strategic approaches that can be applied in combination
to achieve USAF goals: (1) trend mapping to define the future landscape of needs and influences; (2)
backcasting to develop a roadmap that proactively moves towards a desired future; and (3) establishing and
supporting institutionalized dissent (i.e., “red teams”) aimed at identifying risks and guarding against group-
think.
The identified models for each theme fall into 4 broad, cross-cutting ideas:
1. Problem-focused approaches should be used to develop a roadmap that proactively moves towards
a desired future. These approaches support applied research that is directly aligned with well-
defined challenges, and should be implemented with (among other methods) challenge-driven
teams and, where appropriate, backcasting.
2. Discovery-based approaches should be used to support exploratory projects in new fields relevant
to the USAF mission, using trend mapping as needed to define the future landscape of needs and
influences and, as appropriate, creating and leveraging affinity networks.
3. Challenge current thinking approaches should be used to foster an organizational culture that
questions assumptions. These approaches should include red teams aimed at identifying risks.
Supporting entrepreneurial efforts by employees, i.e., the enabler model, can play an important role
in changing the organizational culture by creating an outlet for ideas that are out of the scope of
existing programs.
4. Broad approaches to measuring ROI, based on metrics from leading research institutions, should
be used to support decision making in all of the above approaches. ROI models must cover not only
outcomes but also general innovation capabilities, including people (research talent), tools, patents,
and knowledge communities/networks.
Transformational Necessities
Collectively, these various models and approaches support 3 overriding, mutually reinforcing objectives
for USAF:
Remove obstacles that stifle innovation. Specific recommendations include: lightening the touch
of programmatic oversight, streamlining and improving contracting and external partnerships, and
enhancing linkages with commercial venturing mechanisms like accelerators and incubators.
Be a learning organization. Specific recommendations include: encouraging an environment of
psychological safety through programs offering incentives and recognition, implementing
sunsetting mechanisms to standardize the ways programs are evaluated over time and to support
institutional “unlearning” of inhibitory standard practices, and developing narratives that trace
breakthroughs back to basic research.
Attract the best people. Specific recommendations include: increasing diversity through enhanced
outward facing communication and networking efforts, funding people rather than projects to
facilitate long-term relationships with high-performing researchers, offering graduate education
fellowships in exchange for a commitment to serve within USAF research organizations, and
bringing USAF research organization to the talent via urban outposts or similar efforts.
Removing obstacles to innovation and proactively implementing structures and processes that facilitate
continuous learning will help USAF attract the best people—those most likely to drive innovative outcomes
and breakthrough and sustain a learning, agile culture. The team recognizes that USAF may be
implementing aspects of these models already.
DISTRIBUTION A: Distribution approved for public release.
S&T Business Organization & Process Study Page 7
TABLE OF CONTENTS
EXECUTIVE SUMMARY ........................................................................................................................ 5
1. INTRODUCTION AND STUDY METHODOLOGY ........................................................................ 9 1.1 Overview and Objectives ................................................................................................................... 9 1.2 Definition of Terms ........................................................................................................................... 9 1.3 Site Visit .......................................................................................................................................... 10 1.4 Workshop Methodology .................................................................................................................. 10
2. A CALL FOR CHANGE: IDENTIFYING RESEARCH AREAS ................................................... 13 2.1 Introduction...................................................................................................................................... 13 2.2 Problem-Focused Research.............................................................................................................. 13 2.3 Discovery-Based Research .............................................................................................................. 15 2.4 Challenge Current Thinking ............................................................................................................ 17
3. A CALL FOR CHANGE: RETURN ON INVESTMENT ................................................................ 19 3.1 Introduction...................................................................................................................................... 19 3.2 Measuring Effectiveness of S&T Strategy ...................................................................................... 20 3.3 Using Key Performance Indicators to Measure the Effectiveness of Research Organizations ....... 21 3.4 Contribution Analysis ...................................................................................................................... 25
4. A CALL FOR CHANGE: ORGANIZATION STRUCTURE & CULTURE ................................. 27 4.1 Introduction...................................................................................................................................... 27 4.2 Challenge-Driven Teams ................................................................................................................. 27 4.3 The Enabler Model .......................................................................................................................... 29 4.4 Affinity Networks ............................................................................................................................ 32
5. A CALL FOR CHANGE: FORMULATING STRATEGY .............................................................. 35 5.1 Introduction...................................................................................................................................... 35 5.2 Trend Mapping ................................................................................................................................ 36 5.3 Backcasting (Normative Scenario Planning) ................................................................................... 37 5.4 Red Teaming .................................................................................................................................... 39
6. TRANSFORMATIONAL NECESSITIES AND CONCLUSIONS ................................................. 43 6.1 Remove Obstacles that Stifle Innovation ......................................................................................... 43 6.2 Be a Learning Organization ............................................................................................................. 44 6.3 Attract the Best People .................................................................................................................... 46
APPENDIX A. WRIGHT-PATTERSON AIR FORCE BASE VISIT AGENDA .............................. 47
APPENDIX B. WORKSHOP AGENDA ................................................................................................ 49
APPENDIX C. GRAPHICAL RECORDS OF WORKSHOP .............................................................. 53
DISTRIBUTION A: Distribution approved for public release.

Page 8 S&T Business Organization & Process Study
Page intentionally left blank
DISTRIBUTION A: Distribution approved for public release.
S&T Business Organization & Process Study Page 9
1. INTRODUCTION AND STUDY METHODOLOGY
1.1 Overview and Objectives
In September 2017, Secretary of the Air Force Heather Wilson announced inception of the “Science and
Technology (S&T) Strategy 2030” study aimed at updating US Air Force (USAF) methods for conducting
research and development to meet projected security challenges. Northwestern University (NU)
participated by identifying appropriate business processes and structures to manage organizations like the
Air Force Research Laboratory (AFRL), based on interviews with USAF personnel on site at Wright-
Patterson Air Force Base, a workshop composed of internal/external expert discussions, and the expertise
and experience of the NU study team.
The NU study focused on 4 themes identified by the AFRL, as applied to early stage research:
Identifying Research Areas and adjusting as S&T evolve and new goals/missions emerge.
Measuring Return on Investment (ROI) in diverse research fields and project types.
Optimizing Organization Structure (governance, leadership, and recruitment) to facilitate agility
and support innovation.
Optimizing S&T Strategy based on mission, opportunities, and resources.
1.2 Definition of Terms
The USAF tasking for this study asked for input on processes and organizational structures to support early-
stage research. In the Department of Defense (DOD), these early stages are categorized as Budget Activity
1 (BA1), BA2, and BA3. BA1 (sometimes denoted as 6.1) is referred to as “basic research”. BA1 research
is defined by DOD as “systematic study directed toward greater knowledge or understanding of the
fundamental aspects of phenomena and/or observable facts without specific applications…in mind.”1 BA2
(or 6.2) is “applied research” for the “systematic study to gain knowledge or understanding necessary to
determine the means by which a recognized and specific need may be met.” BA3 (“advanced technology
development”) is about the “development and integration (of technology)…for field experiments and tests.”
“Science and Technology” (S&T), as defined by the US government, includes BA1, BA2, and BA3.
Within the context of S&T research, we use the term innovation to refer to research results that are
groundbreaking, unexpected, novel, or that otherwise advance knowledge beyond existing paradigms.2
Innovation is key to maintaining a competitive edge to best respond to future needs. This study focused on
practices that support innovative early-stage research. Therefore, this report’s use of the term innovation
is distinct from its definition in a commercial context (i.e., the creation of value, not just
invention/discovery).
Ensuring a high level of agility at the institutional level became a cross-cutting theme of our discussions.
Within this context, agility refers to the ability to rapidly and effectively respond to a changing landscape,
recognizing emerging factors that suggest a shift in course and then having the flexibility to devote
resourced attention to support the new direction.
Our recommendations focus on models that describe effective business processes and/or organizational
structures that work to promote agility or innovativeness. The models—drawn largely from the private
1 DOD Financial Management Regulation, DOD 7000.14-R, Vol 2B, Ch 5. 2 Elsewhere in the literature such innovation might be referred to as “radical” or “breakthrough” to distinguish it from “incremental” or “sustaining” innovations that represent extensions and refinements of known approaches and understandings that fit existing organizational divisions.
DISTRIBUTION A: Distribution approved for public release.
Page 10 S&T Business Organization & Process Study
sector—are meant to serve as examples that can be adapted to the AFRL context as part of a portfolio of
strategies to achieve USAF goals. We recognize the USAF may already be implementing aspects of these
models.
This report summarizes the findings into 2 areas “A Call for Change” and “Transformational Necessities”
as requested by the USAF. A Call for Change includes examples of business processes and organizational
structures best suited to managing early-stage research and rapidly adopt technologies. Transformational
Necessities are practices necessary to adopt the systems/processes laid out in these examples.
1.3 Site Visit
Seven members of the NU study team, divided into 2 groups, interviewed 28 USAF personnel at Wright-
Patterson Air Force Base on April 9, 2018 (See Appendix A for agenda and participants). Interviewees
identified several strengths and challenges in each of the 4 thematic areas, and these were discussed at
weekly meetings with the broader NU study team and during the workshop to help identify and prioritize
recommendations within the four thematic areas.
1.4 Workshop Methodology
On June 1 and June 2, 2018, the NU team convened 45 participants with diverse backgrounds and expertise
from the academic, commercial, and government sectors (see Appendix B for workshop agenda).
Participants were chosen based on their academic expertise, professional background and experience,
specialized knowledge of DOD and other federal research enterprises, and a commitment to assisting the
USAF to identify key ideas, concepts, and approaches for managing early stage research and exploiting the
rapidly changing S&T landscape.
The group was charged with generating recommendations for how the USAF should design their research
efforts today to most effectively anticipate and meet national security requirements in the year 2030 and
beyond. Participants were asked to organize their thoughts and feedback around 2 main objectives:
1. Identify best practices and/or next practices that can be adopted at an institutional level to encourage
innovation and agility;
2. Think about how examples from other sectors might be applied to the practice of research within
the USAF.
Following a roundtable discussion, participants were led in structured brainstorming sessions around the 4
focus themes. Then 4 breakout groups (one for each theme) of ~10 people (and at least 2 participant-
facilitators) came up with 2-5 models or approaches that could be used to support the USAF in meeting its
research goals. For each model, groups specified advantages and disadvantages, examples from other
sectors of how the model has been implemented in the past, and key considerations regarding the models’
scope and applicability.
On day 2, the larger group reconvened to view the output of each breakout session. Breakout group
facilitators presented to small groups during a “round-robin” period so that all participants had the
opportunity to provide specific feedback on the models being developed within each focus theme. This also
set the stage for a larger group discussion of priorities and cross-cutting themes.
Immediately following the round-robin session, participants were invited to “vote” for up to 3 models across
all themes that they felt best support institutional agility or best support mission-driven research scenarios.
Some models had strengths in one or the other category while others received roughly equal votes for both
categories. The results served as a jumping-off point for the final roundtable discussion.
DISTRIBUTION A: Distribution approved for public release.
S&T Business Organization & Process Study Page 11
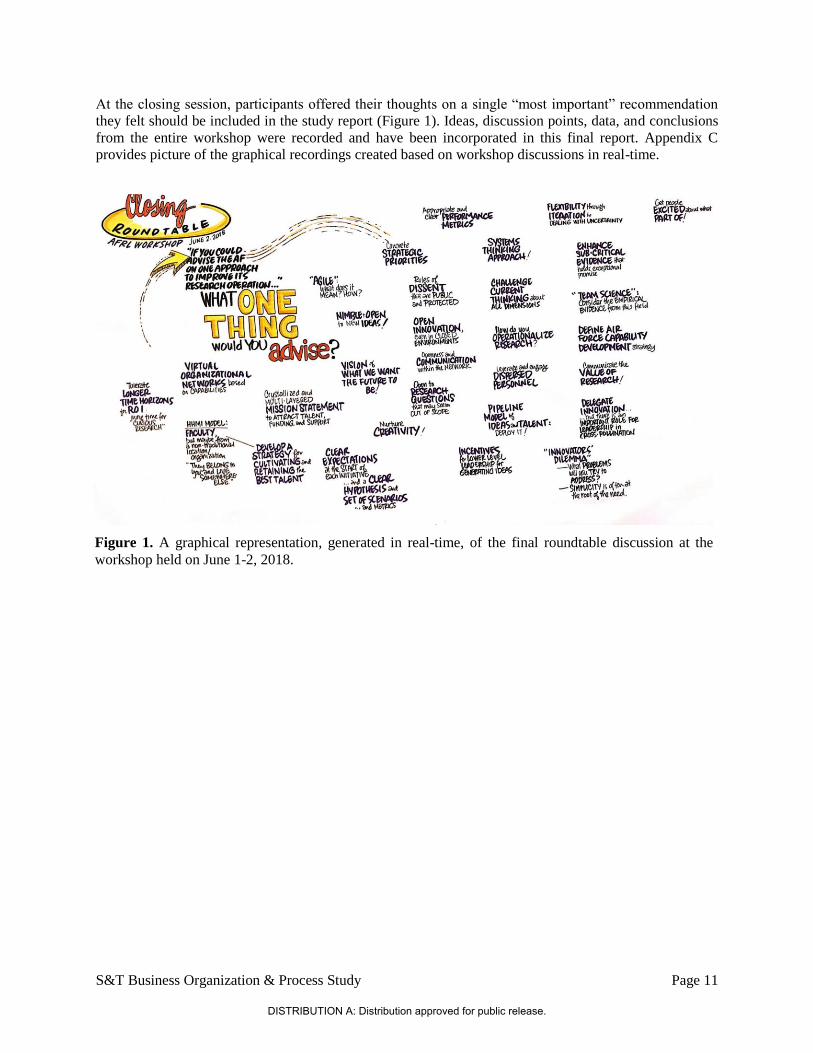
At the closing session, participants offered their thoughts on a single “most important” recommendation
they felt should be included in the study report (Figure 1). Ideas, discussion points, data, and conclusions
from the entire workshop were recorded and have been incorporated in this final report. Appendix C
provides picture of the graphical recordings created based on workshop discussions in real-time.
Figure 1. A graphical representation, generated in real-time, of the final roundtable discussion at the
workshop held on June 1-2, 2018.
DISTRIBUTION A: Distribution approved for public release.

Page 12 S&T Business Organization & Process Study
Page intentionally left blank
DISTRIBUTION A: Distribution approved for public release.
S&T Business Organization & Process Study Page 13
2. A CALL FOR CHANGE: IDENTIFYING RESEARCH AREAS
2.1 Introduction
Effectively managing a research portfolio—including initiating new research areas and ramping down
efforts in others—is key to an agile and innovative S&T organization. This section describes best practices
to determine and prioritize research areas that continually evolve based on progress in science and,
technology, as well as societal, and customer needs. It identifies 3 models that research enterprises,
including AFRL, are using to inform their decision as to when to ramp up/down investments in particular
research areas. The hope is that this discussion will help inform the balance of such approaches in the future
and help identify ways to transition successes in basic research into applied research projects with well-
defined milestones and timelines.
The first model addresses on-the-ground challenges; the second focuses on emerging research areas and
technologies; and the third involves building a culture that fosters and protects innovative thinking. All 3
require a partnership among the military, research institutions, and industry, for each brings a unique set of
perspectives and skills to the table: the military branches know their unmet needs, research institutions
know scientific and technological advances that have promise in addressing those needs, and industry has
the insight into how to best commercialize for rapid deployment in the field. While these models can stand
individually, each has a set of strengths that compensates for the weaknesses of the others. Thus, the team
recommends an integrated and combined approach that leverages the strengths of each model to manage
the research portfolio. These models, tightly coupled to a larger goal, will result in a whole that is
substantially more than the sum of its parts.
2.2 Problem-Focused Research
This first model is highly problem-focused and involves applied research dedicated to current, on-the-
ground challenges faced by personnel in the field. Scouts identify field challenges, then research areas and
teams are chartered to address those specific problems or needs. This is a top-down approach, within which
needs and priorities are dictated from leadership while maintaining a customer-present strategic vision.
There is clear alignment between this approach and AFRL needs and objectives.
2.2.1 Scope and Applicability
This model is designed to solve immediate problems and is most appropriate for BA2 applied research.
Discoveries will tend to be incremental—mostly adapting existing technology—but will more quickly
translate to the field. Immersing researchers or technology scouts in the field increases communication and
bridges the gap between research advancements and needs.
2.2.2 Advantages and Disadvantages
The value of problem-focused research is easy to appreciate, as it has direct relevance to problems faced
by personnel in the field. This focus allows for more rapid technology advancement. In addition, success
and failure are clear: either the project solves an on-the-ground problem or it does not. Work here may lead
into advanced technology development (BA3) if there is inherent commercial value.
Problem-focused research comes with the disadvantage of potentially missing emerging, so-called “blue
skies” research areas, as it does not leave much room for exploratory studies or truly open innovation. In
addition, this type of research output is generally iterative, refining or expanding upon existing processes,
rather than disruptive. Thus, the potential to trigger paradigm shifts or reveal completely new ways of
approaching a problem is limited, though there is always the possibility of serendipitous discovery.
DISTRIBUTION A: Distribution approved for public release.
Page 14 S&T Business Organization & Process Study
2.2.3 Best Practices and Next Practices
There are several examples from both the government and the private sector of how to best implement
problem-focused research. In problem-focused research, cross-disciplinary teams actively engage the
customer and are given room to create a solution to a technological challenge (see Section 4.2 for
information on best practices for the organization structure of challenge-driven teams). In examples below,
“scouts” or groups of people familiar with the challenges are surveyed to gather intimate knowledge of
acute research needs and problems. These are communicated to research teams via solicitations or strategic
reports. Within the context of AFRL, this could take the form of scouting teams comprising: (1) a
representative of AFRL or similar research institution to relate the current state of research and current
research projects to AFRL goals and objectives; (2) a senior USAF official or officer familiar with current
USAF technology challenges; and (3) an industry representative familiar with the market who can speak to
commercialization potential. The goal of these teams would be to identify precise technology challenges,
address the challenges in the laboratory, and build out a solution quickly to equip the warfighter as rapidly
as possible. Below are some specific examples of best practices from industry and government.
General Electric's Fastworks Program. The Fastworks program is based on the "The Lean Startup"
methodology3. This program devotes a significant amount of time to customer discovery and understanding
the customer’s needs. Problems to solve are drawn from this customer input. A team develops hypotheses
relevant to possible solutions, and then conducts targeted tests of these hypotheses.
National Cancer Institute’s (NCI) Provocative Questions Program. In 2011 the National Cancer Institute
(NCI) established the Provocative Questions Initiative to support research projects that solve specific
problems and paradoxes in cancer research. NCI identifies so-called "Provocative Questions" (PQs)
through a series of workshop seminars hosted around the nation and through the website. The call for
research in response to PQs is funded via grants awarded to single-investigators or research teams.
BP Grand Challenges. In 2012, BP’s office of the chief technology officer (CTO) undertook the first of
what became known as “Grand Challenges:” extremely difficult business problems with the potential to
create hundreds of millions—or billions—of dollars in business value if solved.4 After searching various
online solutions and IP markets (NineSigma, OmniCompete, and Iprova), BP hosted an ideation and
collaboration workshop with external experts and internal leaders carefully chosen for their complementary
skillsets and viewpoints. The group included distinguished professors and scientists from a variety of
disciplines and organizations, as well as out-of-the box thinkers, inventors, and pragmatic corporate
leaders.5 The workshop was designed around the concept that important, innovative solutions lie at the
intersection of multiple domains and perspectives, and that such solutions can best be found by creating an
environment in which basic beliefs, assumptions, and conventional thinking can be constructively
challenged. The workshop produced 42 new ideas. After rigorous evaluation, the ideas were prioritized and
shortlisted. The most promising and executable ideas were incorporated into the top tier of BP’s five-year
technology plan. This ideation event was successful because it clearly defined the problem to be solved,
3 Kellner, Tomas. “The Biggest Startup: Eric Ries and GE Team Up to Transform Manufacturing,” GE Reports, December 9, 2013. (https://www.ge.com/reports/post/82723688100/the-biggest-startup-eric-ries-and-ge-team-up-to/) 4 This section is excerpted from Robert C. Wolcott and Michael J. Lippitz, “BP’s Office of the Chief Technology Officer (B): Driving Open Innovation Through an Advocate Team” (Kellogg School of Management Business Case and Teaching Note 5-407-752(B), 2015). 5 Participants were not paid, other than reimbursement for travel expenses. The attraction of the event was the caliber of the attendees and the opportunity to interact with an interesting and diverse group with a passion for advancing and applying knowledge. Egos were put aside as minds opened and people became engrossed in finding creative solutions. As one workshop participant expressed it, “[This workshop was] very different from those I normally attend: highly informative, stimulating, and energetic.”
DISTRIBUTION A: Distribution approved for public release.
S&T Business Organization & Process Study Page 15
involved a highly curated team of participants, provided the necessary stimulus for ideation, encouraged
free thinking and trust among participants, and ended with clearly defined next actions.
Defense Advanced Research Projects Agency (DARPA). DARPA programs are examples of high-risk,
problem-driven research. Rotating DARPA program managers act as scouts on the ground assessing
problems and needs. Teams are established with clear milestones and goals in mind, and research progress
is assessed regularly. Through the DARPA Young Investigator Program (YIP), extramurally-funded
researchers can gain on-the-ground experience through DOD site visits. These visiting programs have
added tremendous value, leading other institutions to try to copy this model.
2.3 Discovery-Based Research
The discovery-based research approach is designed to balance pure discovery with mission-driven research.
The expectation is that “blue skies” research projects in fields relevant to an organization’s mission will
lead to advances and novel technologies that can be translated to relevant applications. Brainstorming and
creative thinking is highly encouraged. The larger goal is still important and informs the supported research
areas, but there is greater latitude in the types of projects supported. Within the context of AFRL, this
approach addresses the need to stay ahead of the competition/adversary. A constant infusion of new ideas
is critical to achieving that goal.
As in the previous model, technology scouts are important in implementing discovery-based research.
However, in this case scouts identify new/emerging areas of research. Rotating the individuals used as
scouts can help maintain a fresh perspective and promote cross-pollination among different fields. In
addition to scouting, it is especially important to benchmark the competition—an adversary—to anticipate
their strengths and what fields may be necessary to counter them. Disruptive rather than iterative ideas are
encouraged to best maintain competitiveness. To implement these processes, it is crucial to have leadership
that understands these challenges.
2.3.1 Scope and Applicability
This model is amenable to basic research, including research contracted out to universities and research
groups that maintain ties to the military. Researchers must still have an understanding of on-the-ground
problems and research fields should be chosen with the end user in mind. However, within those fields,
basic studies with no defined application should be encouraged to maximize the potential for discovery.
Flexibility and time needs to be given to researchers for these more open-ended, discovery-based research
projects (see enabler model in section 4.3).
2.3.2 Advantages and Disadvantages
Advantages of discovery-based research include a high likelihood of breakthroughs in unexpected places.
Focusing on new fields of research will generate significant new knowledge. In addition, this approach can
strengthen an organization’s workforce, as it tends to attract particularly creative thinkers by providing an
unrestrained environment. Freedom to pursue one’s own ideas and interests is attractive from a recruiting
standpoint and allows an organization to more effectively compete for the best talent.
Disadvantages of this model include a high and/or ambiguous failure rate. Projects may never generate
actionable output or any results relevant to current needs or problems. For this reason, the metrics of success
are challenging to outline and hard to track.
DISTRIBUTION A: Distribution approved for public release.
Page 16 S&T Business Organization & Process Study
2.3.3 Best Practices and Next Practices
Below we describe 3 distinct examples of approaches that fall under the discovery-based research model
for identifying research areas. Each approach solicits input from experts, cross-disciplinary teams, or data
to identifying emerging research areas.
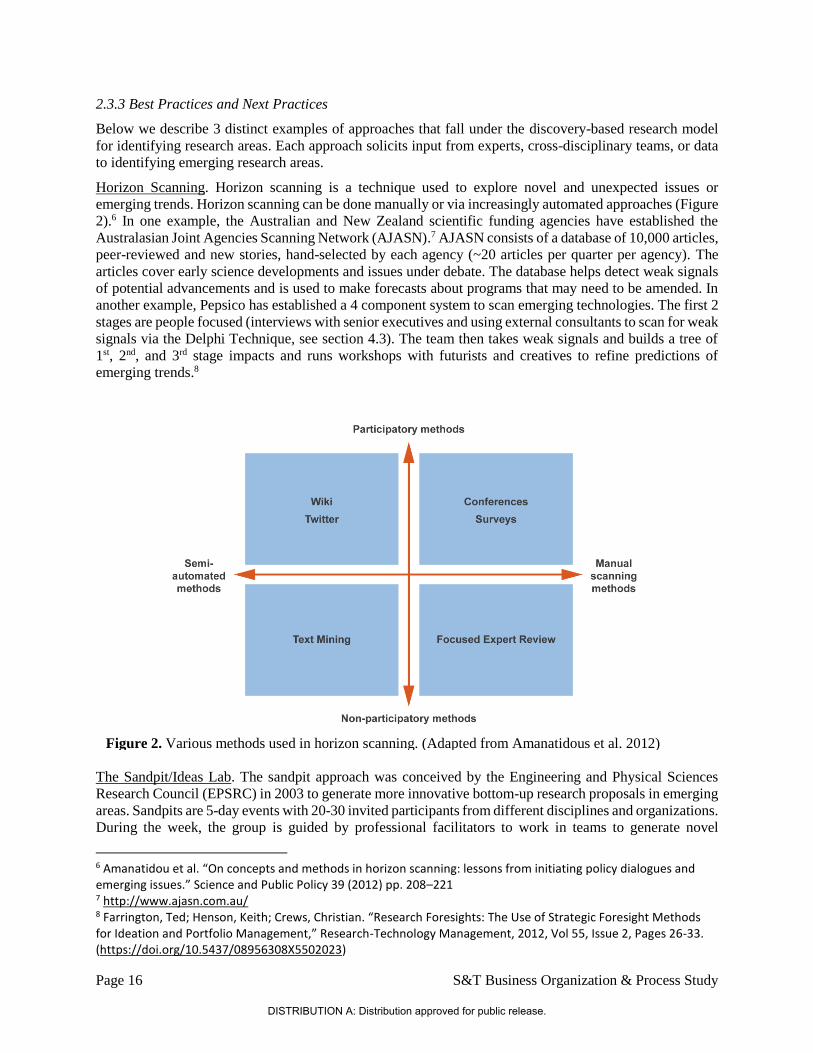
Horizon Scanning. Horizon scanning is a technique used to explore novel and unexpected issues or
emerging trends. Horizon scanning can be done manually or via increasingly automated approaches (Figure
2).6 In one example, the Australian and New Zealand scientific funding agencies have established the
Australasian Joint Agencies Scanning Network (AJASN).7 AJASN consists of a database of 10,000 articles,
peer-reviewed and new stories, hand-selected by each agency (~20 articles per quarter per agency). The
articles cover early science developments and issues under debate. The database helps detect weak signals
of potential advancements and is used to make forecasts about programs that may need to be amended. In
another example, Pepsico has established a 4 component system to scan emerging technologies. The first 2
stages are people focused (interviews with senior executives and using external consultants to scan for weak
signals via the Delphi Technique, see section 4.3). The team then takes weak signals and builds a tree of
1st, 2nd, and 3rd stage impacts and runs workshops with futurists and creatives to refine predictions of
emerging trends.8
The Sandpit/Ideas Lab. The sandpit approach was conceived by the Engineering and Physical Sciences
Research Council (EPSRC) in 2003 to generate more innovative bottom-up research proposals in emerging
areas. Sandpits are 5-day events with 20-30 invited participants from different disciplines and organizations.
During the week, the group is guided by professional facilitators to work in teams to generate novel
6 Amanatidou et al. “On concepts and methods in horizon scanning: lessons from initiating policy dialogues and emerging issues.” Science and Public Policy 39 (2012) pp. 208–221 7 http://www.ajasn.com.au/ 8 Farrington, Ted; Henson, Keith; Crews, Christian. “Research Foresights: The Use of Strategic Foresight Methods for Ideation and Portfolio Management,” Research-Technology Management, 2012, Vol 55, Issue 2, Pages 26-33. (https://doi.org/10.5437/08956308X5502023)
Figure 2. Various methods used in horizon scanning. (Adapted from Amanatidous et al. 2012)
DISTRIBUTION A: Distribution approved for public release.
S&T Business Organization & Process Study Page 17
interdisciplinary proposals. This approach tends to generate innovative, high-risk research proposals that
would be unlikely to get funded through traditional study sections. Previous sandpits have addressed topics
such as ensuring digital privacy and consent, using big data to obtain knowledge, understanding uncertainty
in climate predictions, and detecting terrorist activity. Other UK- and US-based research organizations have
adopted the process, including the Technology Strategy Board (now known as Innovate UK), the Natural
Environment Research Council (NERC), the National Science Foundation (NSF), and the National
Institutes of Health (NIH).9
Open Calls for High Risk Proposals. In 2004, the National Institutes of Health (NIH) started a high-risk,
high-reward research program to accelerate the pace of discovery by supporting exceptionally creative
scientists pursuing highly innovative research. The program seeks to identify scientists with high-impact
ideas that may be risky or at a stage too early to fare well in the traditional peer review process. The program
is independent of any specific institute or program, thus encouraging out-of-the box ideas relevant to any
part of the NIH mission.10
2.4 Challenge Current Thinking
The challenge current thinking model focuses on organizational attitudes that can help identify promising,
or ill-fated, research areas with an emphasis on a “bottom-up” approach. Assumptions can drive the
implementation of technology, and often the direction of research moving forward. Some these assumptions
are long-held and deeply embedded in current practice even though they may no longer be relevant.
Challenging such assumptions can lead research in new directions, increasing the potential for breakthrough
technologies. While a top-down approach is useful in identifying broad research areas, innovative solutions
often come from the bottom-up. They arise from individuals or units who are empowered to challenge
assumptions. Thus, the likelihood of revealing a novel or paradigm-shifting idea increases when more
people have a chance to participate and offer their ideas. Many DARPA programs are based on this
approach.
The challenge current thinking model relies on an established culture of perceived psychological safety.
Interestingly, when Google studied hundreds of their teams to figure out why some stumbled while others
thrived (Project Aristotle)11, they found that psychological safety, more than anything else, was critical to
making a team work. Psychological safety has been an important discussion area in the fields of psychology,
management, healthcare, and behavioral management. It should be noted that leadership buy-in is critical
to establish and maintain a culture of psychological safety.
2.4.1 Scope and Applicability
This model can be applied to both basic and applied research. The practice of challenging current thinking
would benefit both defined, applied research and “blue skies” basic research. Within the context of AFRL,
any successful strategy will need to involve regular, systematic reevaluation and realignment of priorities.
A method through which current ideas can be challenged is crucial to that process.
2.4.2 Advantages and Disadvantages
Challenging existing thinking enables breakthroughs by exposing research paths that may not have been
considered previously. This approach can also help promote recruitment and retention of talent because all
9 https://knowinnovation.com/expertise/facilitating/ 10 https://commonfund.nih.gov/highrisk/ 11 Duhigg, Charles. “What Google Learned From Its Quest to Build the Perfect Team,” New York Times, February 25, 2016. (https://www.nytimes.com/2016/02/28/magazine/what-google-learned-from-its-quest-to-build-the-perfect-team.html)
DISTRIBUTION A: Distribution approved for public release.
Page 18 S&T Business Organization & Process Study
team members feel like they have a voice in the process. In implementing this type of approach, an
institution will likely take on more high-risk, high-reward research projects, which are, by definition, both
potentially advantageous and disadvantageous. It also requires a more long-term shift in culture towards
one in which individuals feel psychologically safe enough to offer ideas, questions, concerns, or make
mistakes without fear of punishment or humiliation.12 Thus, this shift involves significant investments of
time and other resources to achieve. Leadership at the highest levels must support this model for it to
succeed.
2.4.3 Best Practices and Next Practices
This model is best implemented by focusing, engaging, and listening to talent. Diverse and inclusive teams
are a must; everyone in the organization must have an opportunity to participate. New ideas come from
fresh perspectives, which is why boundary spanners—individuals who can provide a bridge across different
disciplines—are essential, as are rotating non-experts who may ask questions not apparent to those fully
involved in the field. Eric Ries’s “The Lean Startup” describes how this model can be implemented. He
suggests that it is not possible to obtain “unfiltered” truth from the top levels of the organization. Thus, it
is necessary to involve everyone from the bottom-up to thoroughly consider all aspects of the research
process.13
Breaking into new research areas and changing paradigms often requires a critical mass of resources and
people. The idea is that a few years later, as more people recognize the value and promise of the new area,
this activity will start attracting other money or begin generating useful output. Two national labs have
developed systems to protect and support emerging and provocative ideas. The high energy physics research
group at FermiLab periodically conducts a community-wide process to identify investments for the next
20-50 years. Simulations and calculations are performed in a sandbox environment to achieve consensus
on research directions. In a novel approach, the Pacific Northwest National Laboratory (PNNL) established
an internal research and development (IR&D) fund to support a hub of more than a dozen internal principal
investigators (most devoting part time to the effort with the exception of a single full-time lead PI) to explore
new areas for research. In addition to the PIs, an external advisory committee reviews the exploratory
activities, and in the end, recommends a set of activities to fund.
Bringing in fresh perspectives also helps to challenge current thinking within the organization. The two-
year Defense Science Study Group (DSSG) program invites mentee-mentor pairs with no previous
experience conducting defense-funded research to attend immersive, secret-cleared site visits to various
DOD installations. Through these visits researchers gain first-hand knowledge of the challenges faced by
frontline troops that will ultimately inform their thinking when coming up with research proposals. With
this external perspective, DSSG scientists will ideally be more likely to challenge current paradigms.
12 Edmondson, Amy. “Psychological safety and learning behavior in work teams,” Administrative Science Quarterly, 1999, Vol 44, Issue 2, Pages 350-383. 13 Ries, Eric. (2011) The Lean Startup. New York, NY: Random House, Inc.
DISTRIBUTION A: Distribution approved for public release.
S&T Business Organization & Process Study Page 19
3. A CALL FOR CHANGE: RETURN ON INVESTMENT
3.1 Introduction
Carefully made investment decisions at key decision points in the S&T process are the essence of good
stewardship and good portfolio planning. Return on investment (ROI) techniques, tailored to measure
performance of research programs or organizations, help inform these decision-making processes.
The key to a satisfactory ROI is assessing research alongside its applications or objectives. Towards this
end, it is useful to distinguish types of research programs, such as discovery-based (section 2.3) or problem-
focused research programs (section 2.4). Discovery-based research is proactive: research and technology
development precedes application understanding. Hence, not all the applications will be apparent or
relevant to the organization. Indeed, discovery-based research often leads to unforeseen outcomes. In
contrast, problem-focused research is more reactive and assures better mission alignment. However, the
impact on applications may still be difficult to quantify, particularly when the value to the mission does not
relate to more traditional commercial measures of success. Moreover, reactive efforts are likely to lead to
technology discoveries that are narrower and perhaps less valuable overall.
In addition to considering the type of research, the method for developing and evaluating ROI will vary
depending on the following factors:
Audience. The definition of value changes depending on the audience (i.e. U.S. Congress, AFRL,
the warfighter, the scientific community). For example, congress may focus on technology
applications—particularly those that impact businesses in their districts or states—and make
funding decisions on that basis, while AFRL needs to consider its innovative capacity as a whole;
perhaps valuing such contributions over individual innovations.
Value of direct vs. indirect outputs. In addition to direct research outputs, such as publications,
patents, and technology, laboratories develop general capabilities: people (researchers), tools,
knowledge, and communities of practice that are indirect outputs of research efforts. These general
“innovation capacities” underlie future technology discoveries and impact the economy but do not
have a direct impact on the research objective. The importance of these outputs needs to be defined.
Scale. Time (short vs. long) and scale within the organization (single project vs. organization as a
whole) should be clearly defined and considered when evaluating ROI. These factors influence the
choice of approach and/or indicators used to measure ROI.
The team identified 3 different types of models to address these factors. To be successful, any approach
must also align with research areas (section 2) and strategy formulation (section 4). A multi-faceted
approach ensures that measurements of ROI help facilitate the decision-making process. Thus, integrating
these models is recommended.
1. Measuring the effectiveness of the overall S&T strategy. In this approach, the ROI is developed
and evaluated in connection with the overall S&T strategy of the organization. This model assesses
the organization as a whole, is applicable to multiple audiences, accommodates different types of
research programs, and can focus on both short term and long term progress.
2. Using Key Performance Indicators (KPIs). In this approach, ROI is based on key performance
indicators highly tailored to specific programs, objectives, or values. KPIs are measurable outputs
ideally identified at the start of each new program or objective. Different evaluation processes can
be established based on specific KPIs.
3. Contribution Analysis. Contribution analysis is used to attribute outcomes or value to initial
discoveries or organizational approaches.
DISTRIBUTION A: Distribution approved for public release.
Page 20 S&T Business Organization & Process Study
3.2 Measuring Effectiveness of S&T Strategy
This model entails developing and regularly evaluating performance objectives and indicators based on the
organization’s strategic plan. The ability to measure performance is linked to making good management
decisions, thus an engaged leadership is required. Management and stakeholder feedback are incorporated
into the review process to refine the organization’s strategy. Performance objectives embedded in the
organization’s strategic plan are used to measure progress. Performance objectives for research will be
stated as scientific questions to answer and/or technological challenges to overcome. Reviews can focus on
either short term (e.g., quarterly) or long-term (e.g., annual) progress. In all cases, performance evaluations
must take into account the inherent uncertainty of S&T research.
3.2.1 Scope and Applicability
Evaluating ROI based on organizational strategy can be applied to discovery-based or problem-focused
research programs. The key is that the metrics are based on the nature of the activities as well as their
relationship to the larger innovation system.
3.2.2 Advantages and Disadvantages
Performance monitoring and additional in-depth evaluations provide information for planning/investment
decisions and program improvement. It holds people and the organization accountable for achieving stated
strategies/goals/objectives. In turn, achievement of specified goals can serve as incentives for researcher
performance. However, constant thorough evaluations can be resource-intensive; the organization needs to
define the logical framework to evaluate the right metrics, analyze the data, and provide feedback to inform,
report, and improve its strategy. This investment is critical, as the wrong set of metrics can cause behaviors
that work against achieving goals of the organization.
3.2.3 Best Practices and Next Practices
Various laws—Managing for Results; Government Performance and Results Act (GPRA); and more
recently, Evidence-Based Decision Making—required the Executive Branch (through the Office of
Management and Budget, OMB) to implement strategic assessments for all federal agencies.14 Thru GPRA,
for instance, the Department of Health and Human Services (HHS) evaluates their strategy for scientific
discovery through pre-identified programs and metrics over five-year periods. Several research programs
are identified each year to be monitored via GPRA. Anticipated outcomes for each year are visualized in a
table format and year-by-year results are compared to anticipated outcomes. The collection of programs
subject to GPRA evaluation reflect the entire HHS strategy, ranging from support of trainees, to biomarker
discovery, to data sharing, demonstrating the adaptability of the approach.15
The National Science Foundation (NSF) develops an annual performance plan against which it evaluates
ROI. Each year selected programs are evaluated against a common set of indicators. For example, the fiscal
year 2018 plan included 6 performance goals: ensure that key program investments (1) and infrastructure
investments (2) are on track, (3) use evidence to guide management decisions, (4) make timely award
decisions, (5) improve the review quality, and (6) foster an inclusive culture through change management.
Each goal is supported by appropriate target measures, milestones, or deliverables.16
14 OMB Circular No. A–11: Preparation, Submission, And Execution of the Budget, Part 6. Related approaches used by industry include Plan-Do-Check-Act, Total Quality Management, and Balanced Scorecard. 15 FY 2017 Annual Performance Plan and Report - Goal 2 Objective A. (https://www.hhs.gov/about/budget/fy2017/performance/performance-plan-goal-2-objective-a/index.html) 16 NSF FY 2018 Annual Performance Plan ( https://www.nsf.gov/about/budget/fy2018/pdf/55_fy2018.pdf)
DISTRIBUTION A: Distribution approved for public release.
S&T Business Organization & Process Study Page 21
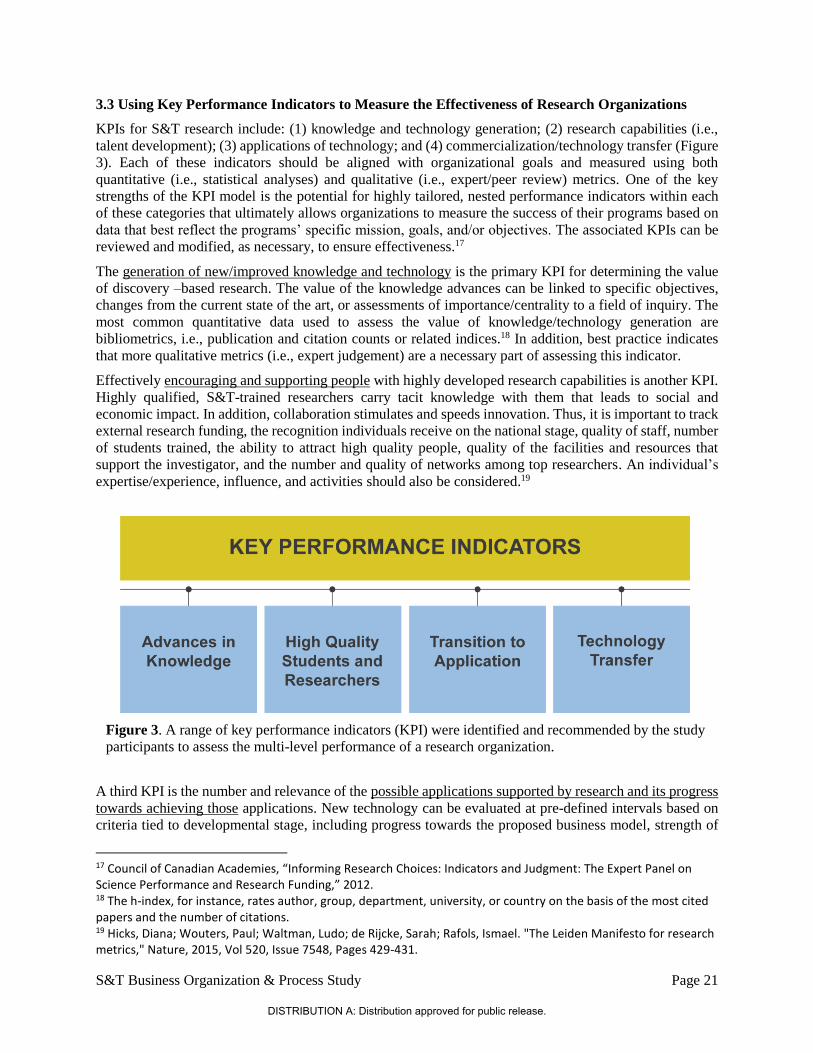
3.3 Using Key Performance Indicators to Measure the Effectiveness of Research Organizations
KPIs for S&T research include: (1) knowledge and technology generation; (2) research capabilities (i.e.,
talent development); (3) applications of technology; and (4) commercialization/technology transfer (Figure
3). Each of these indicators should be aligned with organizational goals and measured using both
quantitative (i.e., statistical analyses) and qualitative (i.e., expert/peer review) metrics. One of the key
strengths of the KPI model is the potential for highly tailored, nested performance indicators within each
of these categories that ultimately allows organizations to measure the success of their programs based on
data that best reflect the programs’ specific mission, goals, and/or objectives. The associated KPIs can be
reviewed and modified, as necessary, to ensure effectiveness.17
The generation of new/improved knowledge and technology is the primary KPI for determining the value
of discovery –based research. The value of the knowledge advances can be linked to specific objectives,
changes from the current state of the art, or assessments of importance/centrality to a field of inquiry. The
most common quantitative data used to assess the value of knowledge/technology generation are
bibliometrics, i.e., publication and citation counts or related indices.18 In addition, best practice indicates
that more qualitative metrics (i.e., expert judgement) are a necessary part of assessing this indicator.
Effectively encouraging and supporting people with highly developed research capabilities is another KPI.
Highly qualified, S&T-trained researchers carry tacit knowledge with them that leads to social and
economic impact. In addition, collaboration stimulates and speeds innovation. Thus, it is important to track
external research funding, the recognition individuals receive on the national stage, quality of staff, number
of students trained, the ability to attract high quality people, quality of the facilities and resources that
support the investigator, and the number and quality of networks among top researchers. An individual’s
expertise/experience, influence, and activities should also be considered.19
A third KPI is the number and relevance of the possible applications supported by research and its progress
towards achieving those applications. New technology can be evaluated at pre-defined intervals based on
criteria tied to developmental stage, including progress towards the proposed business model, strength of
17 Council of Canadian Academies, “Informing Research Choices: Indicators and Judgment: The Expert Panel on Science Performance and Research Funding,” 2012. 18 The h-index, for instance, rates author, group, department, university, or country on the basis of the most cited papers and the number of citations. 19 Hicks, Diana; Wouters, Paul; Waltman, Ludo; de Rijcke, Sarah; Rafols, Ismael. "The Leiden Manifesto for research metrics," Nature, 2015, Vol 520, Issue 7548, Pages 429-431.
Figure 3. A range of key performance indicators (KPI) were identified and recommended by the study
participants to assess the multi-level performance of a research organization.
DISTRIBUTION A: Distribution approved for public release.
Page 22 S&T Business Organization & Process Study
the business case, alignment with the organization’s mission, readiness of the technology for the
marketplace or deployment, and the risks associated with continued development. These KPI are often used
in stage gate analysis. Each gate represents a go/no go decision based on the projected net income, risks,
and progress. Thus, the organization can build a decision tree identifying all possible outcomes at each
branch point, including estimated probabilities and expected monetary or mission value.
Finally, a fourth KPI of research effectiveness is the extent to which research projects lead to successful
commercialization or technology transfer. Measuring this is relatively straightforward. Project success can
be measured quantitatively in terms of the intellectual property produced (i.e., patents, licensing
agreements), revenue generated, discussions with venture capital firms, emerging companies, connections
or acquisition with a larger company.20 More qualitative metrics might include counting the number of
companies whose business models rely on a given idea or piece of technology and stakeholder surveys. To
stimulate entrepreneurship, some federal laboratories developed programs that allow employees to leave
the laboratory to establish or expand a company (see section 3.3.3 for examples). Such programs generate
additional indicators that can be used to assess research effectiveness and technology transfer.
3.3.1 Scope and Applicability
Overall, these 4 key indicators can be applied to all levels of S&T research. Assessments of knowledge
generation are particularly applicable to mission oriented research organizations, including those
developing discovery-based and problem-focused research portfolios. Bibliometric methods may be used
for single investigators or groups of researchers (i.e., by unit, by organizations, or within a specific
field/discipline). This latter approach can increase the validity of the metric.21 In contrast, stage gate analysis
is most appropriate for problem-focused research (i.e., subset of BA2 projects) and beyond. Since the
process looks at ROI prospectively (i.e., the likelihood of success and potential payoff), it could also be
used to decide what projects should transition from BA1 to BA2, and from BA2 to BA3. Because costs
increase during development and scale-up of a new technology, many organizations use the stage gate
analysis to make decisions at multiple points along the basic-applied research continuum. Indicators based
on people or technology transfer are more widely applicable as research capabilities can be built via work
at any stage of research.
3.3.2 Advantages and Disadvantages
One of the major strengths of this model is that it covers all reasonable expectations of discovery-based and
problem-focused research, while at the same time offers the potential to tailor metrics according to the goals
of the organization or even individual research efforts. For example, if a goal is discovery for unidentified
future purposes, assessments of the value of applications and/or commercial potential can be defined
accordingly. If the goal is to answer specific scientific questions related to accomplishing some part of the
mission, the assessments can be shifted to focus on those goals.
There are specific strengths associated with each indicator as well. A focus on knowledge generation
indicators holds scientists accountable to their research objectives, which is an appropriate measure of ROI
for discovery-based research. Moreover, bibliometrics used in aggregate can identify the relative impact of
the research compared to other units or other organizations (i.e., percentage of total publications from an
institution compared to the field). Evaluating people relates directly to the nature of research and its
sustainability. Indeed, most organizations already recognize the value of knowledge embedded in the S&T
trained workforce. Applying a stage-gate analysis makes the decision-making process exceptionally well-
20 Zuckerman, Brian; Hautala, Judith; Nek, Rashida. Technology Development at the National Institutes of Health (NIH): Summary Report, 2015. (https://www.ida.org/idamedia/Corporate/Files/Publications/STPIPubs/2016/D-5712.pdf) 21 Council of Canadian Academies, op. cit.
DISTRIBUTION A: Distribution approved for public release.
S&T Business Organization & Process Study Page 23
defined. Unlike analyses based on technology readiness level (TRL), stage-gate analysis helps build a more
comprehensive case for research to continue, including technical, business, and strategic considerations.
The disadvantage in using KPIs is that there is a tendency is to measure what is easy to quantify instead of
what is important. Key resource-intensive qualitative indicators must also be included (subject matter expert
review, tracking over time). In addition, this model does not include input and process indicators, such as
“quality of research environment”, despite how important these are for enabling research.
Specific disadvantages of knowledge generation-based indicators include:
Bibliometrics are unable to measure the qualitative value of knowledge produced (except to the
extent that peer review selects for quality/new ideas).22,23
Qualitative evaluations are complicated, resource intensive, may favor lower risk and single
discipline research, and have the potential for bias.
Measuring against research objectives requires a research project plan that takes time, resources,
and may stifle creativity.
It is difficult to determine credit for scientific advances, as many build on past work.
The value of research is not always obvious in the near-term.
Specific disadvantages of people-based indicators include:
Tracking the movement of people can be challenging to perform systematically.
Indicators must be measured over years.
Metrics can be subjective and difficult to quantify.
3.3.3 Best Practices and Next Practices
The 4 KPIs we present align well with how federal science organizations measure performance, relevance
to mission, and impact. For example, NSF measured “ideas, people, and tools” in response to GPRA in the
1990s. It has since added broader, more qualitative societal impacts to its metrics. In addition, many S&T
organizations, including public and private organizations, measure advances in knowledge and tools using
the methods we describe. The Institute for Research on Innovation and Science (IRIS) extends the analysis
by integrating data on people, research outputs (including grants and publications), and expenditures with
economic data to more fully assess the public value of research.24 Specifically, relevant to the research
capabilities indicator, all US federal science agencies/offices measure the number of students trained,
degrees held by staff, awards, and recognition received. Indeed, all but the latter are among the indicators
routinely collected by the National Science Board. Industry and universities also collect and advertise
statistics on S&T staff and students (i.e., Silicon Valley, Microsoft, MIT, Stanford). Analyses include
movement of staff/students to startups.
Real-time technology assessment (TA) is an example of a KPI approach applied to research projects that
present significant uncertainty. Used to evaluate the National Nanotechnology Initiative, the approach
integrates viewpoints from scientists, social scientists, and a range of potential stakeholders interacting on
the impact of the technology. The real-time TA model has 4 components and uses a number of anecdotal
and quantitative performance indicators. The first component uses analogical case studies of past
transformational innovations to develop frameworks for anticipating future interactions between society
and new technologies. The second component uses bibliometrics to identify research trends, participants,
organizations, and relationships. The third component monitors changing knowledge, perceptions, and
22 Hicks, Diana, et al. "The Leiden Manifesto for research metrics." Nature 520.7548 (2015): 429. 23 DORA: San Francisco Declaration on Research Assessment, College & Research Libraries News, 2014, Vol 75. (https://crln.acrl.org/index.php/crlnews/article/view/9104/9996). 24 http://iris.isr.umich.edu/
DISTRIBUTION A: Distribution approved for public release.
Page 24 S&T Business Organization & Process Study
attitudes among stakeholders. The fourth component gauges society’s preparedness for the anticipated
societal impact.25
The stage gate analysis method, as referenced above, was developed by industry.26 Exxon/Mobil later added
a stage for discovery-based research. The Department of Energy (DOE) Office of Biomass Program (OBP)
has used stage gate analysis since 1998 to guide decision-making on research and development efforts to
support portfolio development/management, project alignment with program objectives, and project
evaluation. Projects on a commercial track must have a vision for commercialization, whereas projects on
the research track should contribute to new knowledge or capabilities that can be applied to commercially-
focused projects. Projects move along each track in distinct stages (i.e., work that is required to achieve the
objectives) that are marked by gates (i.e., project review and decision points) that differ by track and project.
Projects at each gate are evaluated for strategic fit, market/customer, technological feasibility/risks,
competitive advantage, legal/regulatory compliance, critical success factors and show stoppers, and plan to
proceed. There are 4 possible outcomes for each gate: pass (criteria met; project moves forward), recycle
(progress made, keep working at previous stage), hold (suspend the project pending changes in market
needs), and stop (permanent halt to the project). If the project passes the gate, a new work plan for the next
stage (i.e., objectives, milestones, work breakdown and schedule, resources) must be developed and
approved before moving to the next stage. Ultimately, the stage gate process enables OBP to perform high
quality work, assess multiple aspects of each project simultaneously, and increase potential commercial
impact. The entire process requires engagement from DOE Headquarters, DOE-Project Management
Center, project leaders, and investigators.27
Sandia National Laboratory’s Entrepreneurial Separation to Transfer Technology (ESTT) is a valuable
program that allows Sandia to monitor and enhance transfer technology to the private sector by permitting
its employees to leave the labs to establish or expand technology companies. Entrepreneurs are guaranteed
reinstatement for up to 2-years with the option to request a third year. ESTT proposals may be based on a
requestor’s intent to license Sandia intellectual property (IP) or use his/her “unique expertise” rather than
Sandia IP. ESTT must be consistent with Sandia’s business development plans and tech transfer mission.
Since its inception in 1994, the program’s evaluation metrics show that over 150 Sandian employees have
taken advantage of the program. Fifty-four companies have been established, 53 companies have expanded,
44 technologies have been licensed.
One intriguing example of a potential next practice in applying performance indicators for technology
breakthroughs is described in ‘A Dynamic Network Approach to Breakthrough Innovation’.28 This is a
newly validated approach with novel metrics for measuring the extent to which newly patented innovations
disrupt the status quo. The study found that disruptive patents decrease the use (i.e., citation) of their
predecessors by an average of 60%. Using network approaches, disruptive technologies can be identified
retrospectively and used to measure ROI.
25 Guston, David; Sarewitz, Daniel. “Real-time technology assessment,” Technology in Society, 2002, Vol 24, Issue 1-2, Pages 93-109. (https://doi.org/10.1016/S0160-791X(01)00047-1) 26 Cooper Robert; Edgett, Scott; Kleinschmidt, Elko. “Optimizing the Stage-Gate Process: What Best-Practice Companies Do,” Research-Technology Management, 2012, Vol 45, Issue 6, Pages 43-49. (https://doi.org/10.1080/08956308.2002.11671532) 27 US Department of Energy, “Stage Gate Management in the Biomass Program,” 2005. (https://www.energy.gov/sites/prod/files/2015/05/f22/stage_gate_management_guide.pdf) 28 Funk, Russell; Owen-Smith, Jason. “A Dynamic Network Approach to Breakthrough Innovation” (https://arxiv.org/abs/1212.3559)
DISTRIBUTION A: Distribution approved for public release.
S&T Business Organization & Process Study Page 25
3.4 Contribution Analysis
In industry, ROI is traditionally defined as the ratio of sales to investment costs; the organization takes
100% of the credit for the ROI. Contribution analysis attributes broader societal or mission impact to a
discovery or organization, including events and influence collected along the way. It considers research
contribution as a “causal package”. Contribution analysis comprises 6th steps: (1) set out the cause-effect
issue to be addressed; (2) develop the postulated theory of change and risks to it, including rival
explanations; (3) gather the existing evidence on the theory of change; (4) assemble and assess the
contribution claim and challenges to it; (5) seek out additional evidence; and (6) revise and strengthen the
contribution story.29 This approach can be used proactively or retroactively to determine the contribution
of basic research investments to applications and/or their impact by examining each point of knowledge
transfer along the research continuum.
3.4.1 Scope and Applicability
Contribution analysis can be used for all S&T investments. Its applicability depends on the target audience
(i.e., Congress may prefer this model over other approaches). If the models described above are
implemented concurrently, the accumulated data from indicator monitoring and more in-depth evaluation
of performance indicators will be sufficient for impact assessment.
3.4.2 Advantages and Disadvantages
The primary advantage of this model is the ability to map the contribution of research to its impact;
understanding the role of each element at its knowledge transfer point. This method is more credible than
undocumented claims of impact. The analysis also provides information on success factors that can inform
program design. It is important to note that alterative formal attribution methods, such as random controlled
trials, are not feasible for basic research.30
A disadvantage of contribution analysis is that it requires a historical tracing study, which can be expensive
and complicated. Further, it is hard to assess technologies with wide-ranging impacts; scientists may not be
able to predict all potential applications, and key technologies are often missed. Adding to the challenges
of this approach is that it is more qualitative than quantitative (i.e., need to build a case for how the
investment lead to outcome/technology), and there is thus a greater potential for bias. Finally, it would be
burdensome and expensive to have a tracking system like this for research projects beyond AFRL and the
USAF, although it may be feasible to track a few projects that appear to be “winners” based on early
indicators.
3.4.3 Best Practices and Next Practices
Most organizations already value historical tracing studies, but a broader evaluation methodology is also
needed. In addition, marketing is key to promoting the results of the contribution analysis and demonstrating
ROI to invested audiences. Within DOE, The Office of Energy Efficiency and Renewable Energy (EERE)
posts success stories on their website that highlight the positive impact of research supported via EERE on
the effectiveness and use of new energy technologies. The stories include a map to show geographical
impact as well.31 In addition to the success stories, DOE conducts a cost-benefit analysis for the research
programs.
29Mayne, John. “Contribution analysis: Coming of age?,” Evaluation, 2012, Vol 18, Issue 3, Pages 270-280. (https://doi.org/10.1177/1356389012451663) 30 Government Accountability Office. Designing Evaluations: 2012 Revision. Report No.: GAO-12-208G 31 https://www.energy.gov/eere/eere-success-stories-projects-map/
DISTRIBUTION A: Distribution approved for public release.
Page 26 S&T Business Organization & Process Study
Contribution analysis has been applied in numerous contexts, including developmental aid, agriculture,
employment, and governance. In 1 example, the Evaluation Reference Group, evaluated the impact of aid
provided by the European Union to the country of Jordan over a 10-year period. The group developed a
logic model that included 3 causal claims relevant to the intended impact (i.e., increase Jordanian exports
to the EU). Using available information, including possible other contributing factors, the group came to
the conclusion that the intervention was insufficient to explain the expected impact. However, their analysis
revealed that an alternative causative issue (i.e., the intervention led to growth in exports around the world)
would have yielded a positive contribution.32 In developing best practices for contribution analysis, this
example highlights the importance of appropriately defining the causative issue during the assessment (see
also a full issue of the journal Evaluation which provides a comprehensive overview of contribution
analysis33).
32 Delahais, Thomas; Toulemonde, Jacques. “Applying contribution analysis: Lessons from five years of practice,” Evaluation, 2012, Vol 18, Issue 3, Pages 281–293. (https://doi.org/10.1177/1356389012450810) 33 Special Issue: Contribution analysis, Evaluation, 2012, Vol 18, Issue 3. (http://journals.sagepub.com/toc/evia/18/3)
DISTRIBUTION A: Distribution approved for public release.
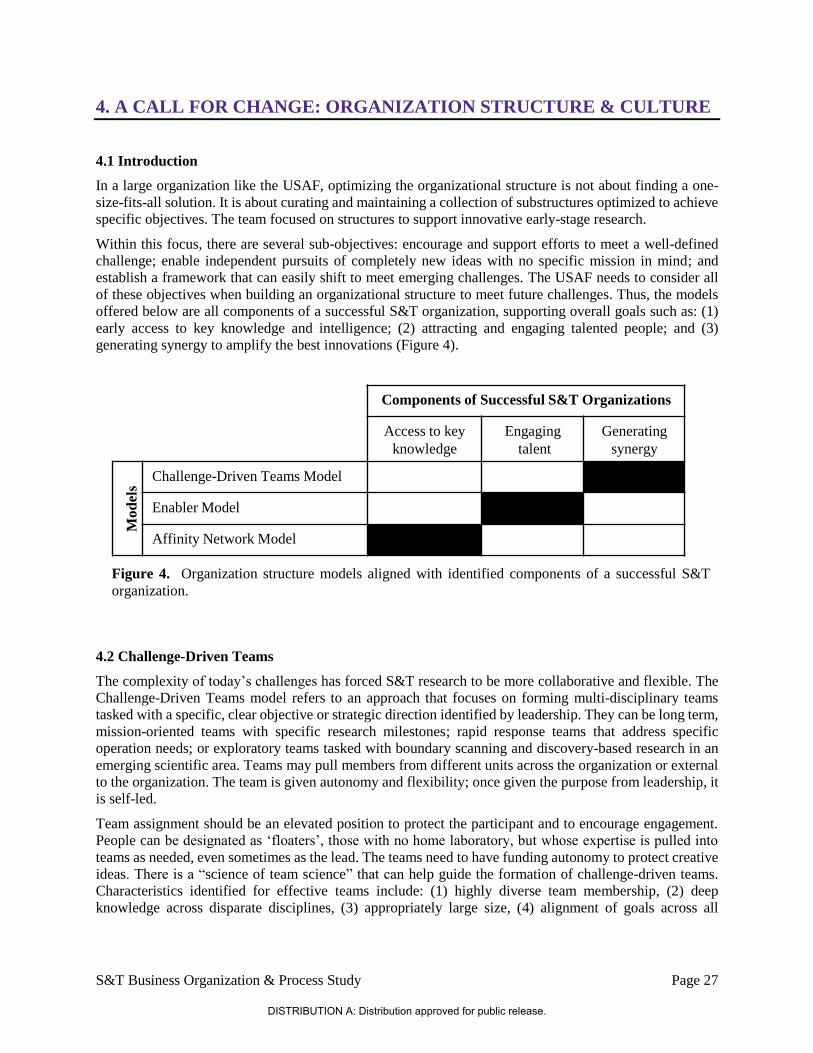
S&T Business Organization & Process Study Page 27
4. A CALL FOR CHANGE: ORGANIZATION STRUCTURE & CULTURE
4.1 Introduction
In a large organization like the USAF, optimizing the organizational structure is not about finding a one-
size-fits-all solution. It is about curating and maintaining a collection of substructures optimized to achieve
specific objectives. The team focused on structures to support innovative early-stage research.
Within this focus, there are several sub-objectives: encourage and support efforts to meet a well-defined
challenge; enable independent pursuits of completely new ideas with no specific mission in mind; and
establish a framework that can easily shift to meet emerging challenges. The USAF needs to consider all
of these objectives when building an organizational structure to meet future challenges. Thus, the models
offered below are all components of a successful S&T organization, supporting overall goals such as: (1)
early access to key knowledge and intelligence; (2) attracting and engaging talented people; and (3)
generating synergy to amplify the best innovations (Figure 4).
4.2 Challenge-Driven Teams
The complexity of today’s challenges has forced S&T research to be more collaborative and flexible. The
Challenge-Driven Teams model refers to an approach that focuses on forming multi-disciplinary teams
tasked with a specific, clear objective or strategic direction identified by leadership. They can be long term,
mission-oriented teams with specific research milestones; rapid response teams that address specific
operation needs; or exploratory teams tasked with boundary scanning and discovery-based research in an
emerging scientific area. Teams may pull members from different units across the organization or external
to the organization. The team is given autonomy and flexibility; once given the purpose from leadership, it
is self-led.
Team assignment should be an elevated position to protect the participant and to encourage engagement.
People can be designated as ‘floaters’, those with no home laboratory, but whose expertise is pulled into
teams as needed, even sometimes as the lead. The teams need to have funding autonomy to protect creative
ideas. There is a “science of team science” that can help guide the formation of challenge-driven teams.
Characteristics identified for effective teams include: (1) highly diverse team membership, (2) deep
knowledge across disparate disciplines, (3) appropriately large size, (4) alignment of goals across all
Figure 4. Organization structure models aligned with identified components of a successful S&T
organization.
Components of Successful S&T Organizations
Access to key
knowledge
Engaging
talent
Generating
synergy
Mod
els
Challenge-Driven Teams Model
Enabler Model
Affinity Network Model
DISTRIBUTION A: Distribution approved for public release.
Page 28 S&T Business Organization & Process Study
members, (5) wide geographic dispersion, (6) permeable team boundaries, and (7) high task
interdependence.34
4.2.1 Scope and Applicability
Challenge-driven teams can be most effective when their objective is clearly defined. This includes specific
operational problems or exploratory challenges where the final solution is not clear, but the project is still
mission oriented and highly cross-disciplinary. The success of such teams relies on knowledgeable
participants. Further, the organization must be flexible enough to allow people to move between teams as
needed.
4.2.2 Advantages and Disadvantages
Challenge-driven teams that overlay the formal organization can integrate disparate units within the
organization and generate synergy. Teams often look different from the overall organization, providing an
opportunity for cross-pollination and exposure to different perspectives. The disadvantage of this approach
is that it relies heavily on defining the “right” problem, or the one that best aligns with the organization’s
priorities and objectives. Time and money may be lost if the wrong problem is selected, as moving people
and resources can be rigid and disruptive. Moreover, people may tire of being constantly moved among
teams, worry about falling short on their regular duties, or their attention may become fragmented from
working across too many units. Thus, this approach must include a system to protect people who are being
pulled off of regular duties and a reward structure that recognizes people working on multiple projects. This
ultimately requires the full engagement of senior leadership to select and direct the teams.
4.2.3 Best Practices and Next Practices
There are best practices of the challenge-driven team model in industry, government, and academia. Below
are examples from the RAND Corporation, NSF, Government Services Administration (GSA), and
Northwestern University. In these examples, the challenge-driven teams are pulled from across the
organization structure and supported by funding or changes to the physical workplace to facilitate the teams.
The RAND Corporation. The researchers at RAND, mostly PhDs, are free agents: principal investigators
pull together small teams to tackle a specific problem. The teams then dissolve when the work is done. The
result is a relatively flat organizational structure consisting of a constantly changing network of challenge-
based teams. The RAND Corporation recently transformed 10,000 sq. ft. of office space from 100% closed,
assigned offices and cubicles to nearly 100% open, unassigned seating. An independent study found that
the new design increases unplanned interactions among researchers and improves teamwork, while at the
same time sustaining or improving the environment for deep concentration. It also increased space
utilization by 30-35%.35
GSA: 18F Digital Services. 18F is an office within the GSA tasked with fixing technical problems, building
products, and improving how government serves the public through technology.36 Staff members include
200 designers, software engineers, strategists, and product managers, all of whom are federal employees.
They effectively form challenge-based teams with each agency, working to identify the problem and then
34 National Research Council, “Enhancing Effectiveness of Team Science,” 2015. (https://www.nap.edu/catalog/19007/enhancing-the-effectiveness-of-team-science) 35 Wesel, Lisa. “RAND Develops IT Solutions to Enable the Transition to Unassigned Office Space” May 30, 2018. (https://www.tradelineinc.com/reports/2018-5/rand-develops-it-solutions-enable-transition-unassigned-office-space) 36 https://18f.gsa.gov/
DISTRIBUTION A: Distribution approved for public release.
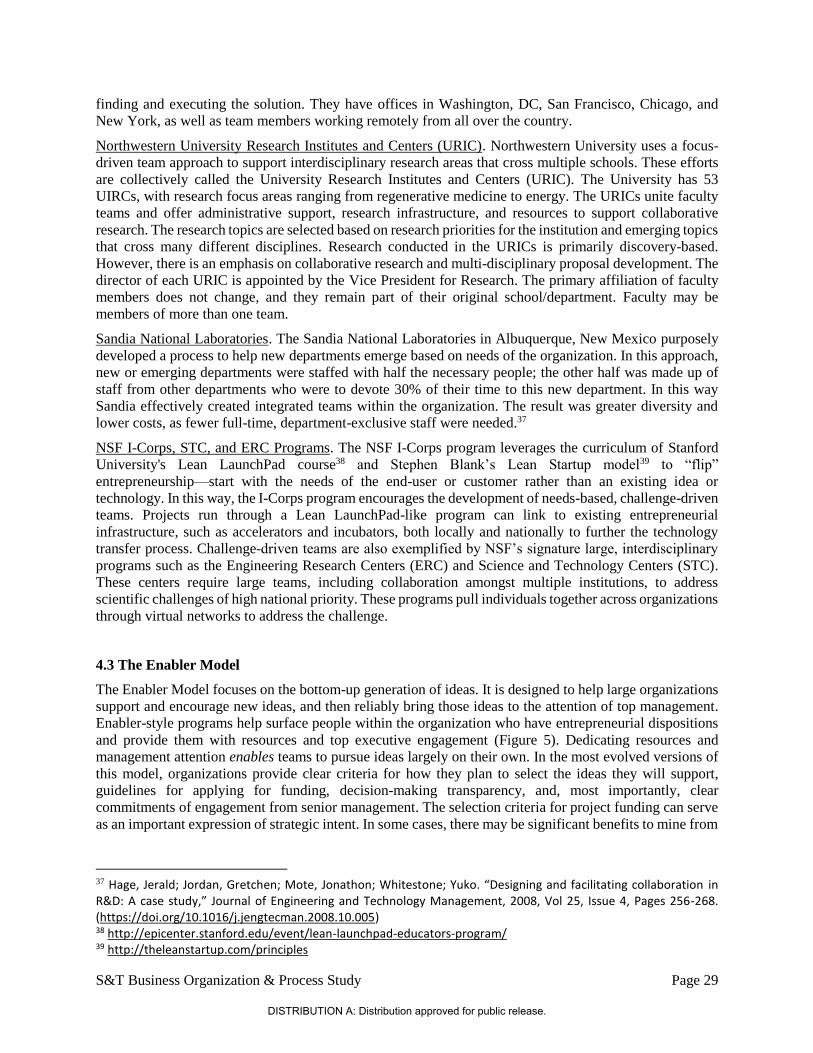
S&T Business Organization & Process Study Page 29
finding and executing the solution. They have offices in Washington, DC, San Francisco, Chicago, and
New York, as well as team members working remotely from all over the country.
Northwestern University Research Institutes and Centers (URIC). Northwestern University uses a focus-
driven team approach to support interdisciplinary research areas that cross multiple schools. These efforts
are collectively called the University Research Institutes and Centers (URIC). The University has 53
UIRCs, with research focus areas ranging from regenerative medicine to energy. The URICs unite faculty
teams and offer administrative support, research infrastructure, and resources to support collaborative
research. The research topics are selected based on research priorities for the institution and emerging topics
that cross many different disciplines. Research conducted in the URICs is primarily discovery-based.
However, there is an emphasis on collaborative research and multi-disciplinary proposal development. The
director of each URIC is appointed by the Vice President for Research. The primary affiliation of faculty
members does not change, and they remain part of their original school/department. Faculty may be
members of more than one team.
Sandia National Laboratories. The Sandia National Laboratories in Albuquerque, New Mexico purposely
developed a process to help new departments emerge based on needs of the organization. In this approach,
new or emerging departments were staffed with half the necessary people; the other half was made up of
staff from other departments who were to devote 30% of their time to this new department. In this way
Sandia effectively created integrated teams within the organization. The result was greater diversity and
lower costs, as fewer full-time, department-exclusive staff were needed.37
NSF I-Corps, STC, and ERC Programs. The NSF I-Corps program leverages the curriculum of Stanford
University's Lean LaunchPad course38 and Stephen Blank’s Lean Startup model39 to “flip”
entrepreneurship—start with the needs of the end-user or customer rather than an existing idea or
technology. In this way, the I-Corps program encourages the development of needs-based, challenge-driven
teams. Projects run through a Lean LaunchPad-like program can link to existing entrepreneurial
infrastructure, such as accelerators and incubators, both locally and nationally to further the technology
transfer process. Challenge-driven teams are also exemplified by NSF’s signature large, interdisciplinary
programs such as the Engineering Research Centers (ERC) and Science and Technology Centers (STC).
These centers require large teams, including collaboration amongst multiple institutions, to address
scientific challenges of high national priority. These programs pull individuals together across organizations
through virtual networks to address the challenge.
4.3 The Enabler Model
The Enabler Model focuses on the bottom-up generation of ideas. It is designed to help large organizations
support and encourage new ideas, and then reliably bring those ideas to the attention of top management.
Enabler-style programs help surface people within the organization who have entrepreneurial dispositions
and provide them with resources and top executive engagement (Figure 5). Dedicating resources and
management attention enables teams to pursue ideas largely on their own. In the most evolved versions of
this model, organizations provide clear criteria for how they plan to select the ideas they will support,
guidelines for applying for funding, decision-making transparency, and, most importantly, clear
commitments of engagement from senior management. The selection criteria for project funding can serve
as an important expression of strategic intent. In some cases, there may be significant benefits to mine from
37 Hage, Jerald; Jordan, Gretchen; Mote, Jonathon; Whitestone; Yuko. “Designing and facilitating collaboration in R&D: A case study,” Journal of Engineering and Technology Management, 2008, Vol 25, Issue 4, Pages 256-268. (https://doi.org/10.1016/j.jengtecman.2008.10.005) 38 http://epicenter.stanford.edu/event/lean-launchpad-educators-program/ 39 http://theleanstartup.com/principles
DISTRIBUTION A: Distribution approved for public release.
Page 30 S&T Business Organization & Process Study
cross-divisional collaboration. In other cases, an organization may want to encourage innovation in the
spaces between units or apply its capabilities in new areas.
One of the unique aspects of enabler programs is that people can be part of a broader, long-term plan to
change the culture of an organization; that is, an effort to transform an organization that lacks a strong
tradition of innovation into one in which entrepreneurship is encouraged and facilitated. This can be hugely
beneficial for organizations with particular strategic visions. However, the process of broad cultural change
also requires a substantial and consistent commitment of top leadership, along with concomitant changes
in many corporate management processes, from development processes to recruiting and human resources
management.
4.3.1 Scope and Applicability
The enabler model helps recruit and engage top talent within the organization. AFRL has already begun
taking important steps toward implementing enabler-style processes. The Innovation Fund and
Commander’s R&D Fund support cross-cutting S&T research teams. The Entrepreneurial Opportunities
Program provides selected researchers a 12-month sabbatical to lay the foundations of a business based on
AFRL technology, with the possibility of taking an additional 5 years to launch the business (and returning
to AFRL afterwards). These entrepreneurs can also take advantage of a new “444” maker space and USAF-
sponsored commercial accelerators.
These current programs are relatively small-scale; the budget is a few tens of millions of dollars (out of a
>$4 billion-dollar AFRL budget) and fewer than a dozen sabbaticals have been awarded to date. However,
such programs do not necessarily need to be large. The critical effort is not to expand the programs, but
rather to make sure that leadership remains engaged so that successful projects continue to move forward.
In the case of AFRL, this might mean continuing to support projects during the 2-3 years it takes to have a
Figure 5. The enabler method is 1 of 4 models of corporate entrepreneurship identified by Lippitz
and Wolcott. These models emerge from the 2 dimensions under the direct control of management
and differentiate how companies approach corporate entrepreneurship. Adapted from
https://sloanreview.mit.edu/article/the-four-models-of-corporate-entrepreneurship/
DISTRIBUTION A: Distribution approved for public release.
S&T Business Organization & Process Study Page 31
new PE established, or establishing new offices to support small businesses that want to link to the defense
contracting base.
4.3.2 Advantages and Disadvantages
Enabler-style programs can provide important time and space for innovative employees to self-select and
explore possibly valuable new directions. If senior leadership is engaged and organizational roadblocks are
removed, successful concepts can advance quickly. Over time, examples of people successfully developing
ideas and receiving top-level support can change the culture of an organization; people begin to believe that
true innovation is possible. However, without this kind of engagement, enabler programs can degenerate
into employees “bowling for dollars”, or seeking an alternative source of funds for ordinary projects that
did not receive funding through standard channels. Failure to follow through with successful projects can
also send a message that leadership is not serious about implementation. Finally, such programs tend to be
small-scale and do not usually contribute substantive improvements to complex major systems, which
represent the bulk of USAF development spending.
4.3.3 Best Practices and Next Practices
Best practices of the enabler model focus on people and not projects. In industry, examples of the enabler
model critically include protected time for staff and dedicated funds to support the process. Psychological
safety (as mentioned in section 2.4) is key.
Google is a poster child for the enabler model. Despite tremendous growth, Google maintains the open and
freewheeling culture of a much smaller company. Employees are allowed to spend 20% of their time
promoting their ideas to colleagues, assembling teams, exploring concepts, and building prototypes. If a
project team believes that it has a promising idea, it appeals to the Google Product Council for formal
project funding. The Product Council, which includes the company founders, top executives, and
engineering team leaders, provides broad strategic direction and initial resources. If a team successfully
demonstrates proof of concept and consumer interest, the Product Strategy Forum may begin to play a more
active role in oversight and support, including applying more significant resources, directing formal and
regular engineering reviews, acquiring outside capabilities, or making some other part of Google work with
the project team. If a project succeeds, team members can receive substantial bonuses (called Founder’s
Awards), sometimes amounting to millions of dollars. These bonuses do not match what entrepreneurs
might make if they were successful on their own, but most employees see the benefits of remaining within
Google where they can receive significant and reliable support of their ideas to increase the probability of
success.
Google’s entrepreneurial culture, dynamic market, and extraordinary access to capital make the company’s
success difficult to replicate. Nonetheless, other companies have had success using the enabler model.
Boeing, for example, has found that dedicated funds for innovation combined with clear, disciplined
processes for allocating those funds can go a long way toward unlocking latent entrepreneurial potential.40
Whirlpool began its entrepreneurship journey from a baseline that was considered practically non-
innovative. Beginning in 1999, Whirlpool transformed itself over the course of a decade from a conservative
company in a slow-moving, commodity-based business into a creative engine spawning significant new
revenue from differentiated products and new businesses. Among other efforts—new processes for product
development, personnel evaluation, knowledge management, financial accounting, resource allocation and
project reviews—the CEO mandated that Whirlpool’s business units and regional offices set aside a fixed
percentage of the capital expenditure budget for innovation projects. He also maintained corporate seed
money to fund worthy ideas that had been rejected by business units or regional offices. Mid-stage funding
40 Wolcott, Robert; Lippitz, Michael. (2010) Grow From Within: Mastering Corporate Entrepreneurship and Innovation. McGraw-Hill. (Page 104)
DISTRIBUTION A: Distribution approved for public release.
Page 32 S&T Business Organization & Process Study
for innovation or corporate entrepreneurship projects are controlled primarily by new oversight and review
bodies known as I-boards, consisting of business leaders, senior executives, or brand teams. People with
innovative project concepts are free to shop their ideas around to different I-boards for funding.
Non-profits and foundations have also used the enabler model to organize research programs with
intramural and extramural scientists. The Monterey Bay Aquarium Research Institute (MBARI), founded
by David Packard, offers significant flexibility to its scientists. Through lessons learned, MBARI found it
has to implement institutional mechanisms for setting direction (in a general sense) and encouraging
alignment and teaming as part of the model.
The Howard Hughes Medical Institutes’ (HHMI) Investigator Program is a “person focused” model that
employs and supports nearly 300 investigators, who are based at over 60 universities, colleges, and other
research institutions across the US. Total direct costs are approximately $650,000 per investigator, per year
with the option of applying for additional equipment funds as needed. The investigators’ time is also
protected, as they are required to spend at least 75% of their time conducting biomedical research.
Consistent with the belief that transformative research is accomplished over long periods of time, the
program is designed to provide long-term support. Investigators are evaluated every 5 years and stay with
HHMI for an average of 15 years.41 As evidence of the success of this approach, 28 current or former HHMI
investigators have been awarded the Nobel Prize to date.
The MacArthur Fellowship is a $625,000, no-strings-attached prize awarded to extraordinarily talented and
creative individuals as an investment in their potential. The program is intended to give investigators the
option to pursue their own ideas. Nominees are brought to the Program's attention through a constantly
changing pool of invited external nominators chosen from a broad a range of fields and areas of interest. 42
Thus, the MacArthur Fellowship is another example of an award that supports people rather than projects.
4.4 Affinity Networks
The third organizational model offered by the team is the idea of affinity networks. An affinity network is
a virtual organization or network of people united by a shared immersive or inspiring experience that
establishes a connection. The specific advantage of such networks is that it is infinitely flexible and can
broaden the knowledge base of the organization far beyond that offered by its employees. The focus of the
team’s discussion was on bounded networks, i.e., those that are intentionally established based on organizer
invitation or specific criteria. However, affinity networks can also be unbounded (think crowd-sourcing or
open hack-a-thons). Most networks have hubs or cores that organize the work being done. A single hub
promotes more centralized decision-making, while multiple hubs can lead the self-organization of
information sharing or strategy. The affinity network model is ultimately based on the importance of loose
ties, and includes consideration of network edges or peripheries made up of people who are involved in the
work of the group to a lesser extent.43 The key to this idea is that such networks generally create value for
individual members as well as for the network as a whole and the organization it serves. Thus, incentives
are suitably aligned. Affinity networks are known to be extraordinarily inclusive and rich in their diversity.
They can be temporary or permanent, planned or spontaneous.
41 Institute for Defense Analyses, Science and Technology Policy Institute, “Outcome Evaluation of the National Institutes of Health (NIH) Director’s Pioneer Award (NDPA), FY 2004–2006,” August 2012, Paper P-4899. (https://www.ida.org/idamedia/Corporate/Files/Publications/STPIPubs/ida-p-4899.pdf ) 42 MacArthur Fellows Program: Summary of 2012-2013 Review, MacArthur Foundation, August 2013. (https://www.macfound.org/media/files/MacArthur_Fellows_Program_Review_final_1.pdf) 43 “A Network Way of Working: A Compilation of Considerations about Effectiveness in Networks,” Nonprofit Quarterly, December 30, 2013. (https://nonprofitquarterly.org/2013/12/30/a-network-way-of-working-a-compilation-of-considerations-about-effectiveness-in-networks/)
DISTRIBUTION A: Distribution approved for public release.
S&T Business Organization & Process Study Page 33
4.4.1 Scope and Applicability
The purpose of initiating an affinity network is to gather data and intelligence from multiple sources. This
would be followed by a more detailed analysis of the data to mine for promising research opportunities.
Success of the network model relies on a shared experience or interest that can be initiation by the host,
such as an annual workshop. There can be an incentive to join the network, which can be internal or external
to the sponsoring organization, such as resources, data, or accessibility. Technology platforms and email
listservs are often used to communicate across the network. Cross-institution research teams, student
sharing, internships, or visiting scholars could be initiated through network activities to support downstream
work.
4.4.2 Advantages and Disadvantages
The affinity network model offers a potentially cost-effective way to build a community of trust that brings
a diverse group together as needed to meet specific objectives. It is an infinitely agile approach that
effectively increases the breadth of available expertise. Networks that include people external to the
organization diversify capabilities without the need to support a standing research team.
The affinity network model does require significant effort to initiate, manage, and sustain over time. Though
new technologies can help facilitate connections between members, organizers need to carefully consider
mutual incentives and benefits at the outset to ensure success. In addition, the affinity network can become
an echo-chamber, homogenous, and assumption-based if the membership is not actively managed. There
are also challenges around managing intellectual property and confidentiality. Some choose to apply the
so-called “Chatham house rule”: anything that is said can be used, but its source may not be attributed to
any one person.
4.4.3 Best Practices and Next Practices
Best practices of the affinity network model are present in government, professional societies, and industry.
The Dephi Technique is a specific example of how an affinity network model can be used to gain
information. 44 The technique uses a structure of group communication processes (i.e. surveys and forms)
to enable a group of individuals to collectively address a complex problem. Other affinity network
approaches unite disparate groups of people via websites, high profile events, and funding mechanisms.
The AFOSR supported Centers of Excellence are an example of how AFRL has established collaborative
networks of investigators with institutions to work on specific projects. Below are some additional
examples:
Canadian Institute for Advanced Research (CIFAR). CIFAR unites leading experts worldwide to work
together across disciplines to improve human health and quality of life, create successful societies, and
sustain life on earth. The CIFAR Network consists of more than 400 fellows and advisors from more than
130 institutions in 17 countries. Participants are charged with addressing specific programmatic areas.45
NCI Collaborative Research Networks. Starting in 2009, NCI initiated the Physical Sciences-Oncology
Centers (PS-OC) Network, a collaborative research network consisting of 10-12 independently funded
Centers. The resulting network includes 300+ investigators, advocates, and trainees affiliated with the
centers who gather for annual meetings, have access to set-aside trans-network seed funds, and shared data,
and participate in specific projects managed by NCI program officials.
44 Hasson, Felicity; Keeney, Sinead; McKenna, Hugh. “Research guidelines for the Delphi survey technique,” 2000, Journal of Advanced Nursing, Vol. 32, Issue 4, Pages 1008-1015. (https://doi.org/10.1046/j.1365-2648.2000.t01-1-01567.x) 45 https://www.cifar.ca/about/
DISTRIBUTION A: Distribution approved for public release.
Page 34 S&T Business Organization & Process Study
Allen and Company Investment Firm. Within the private sector, Allen and Company has forged long-lasting
and lucrative relationships with corporate leaders, media moguls, politicians, and celebrities by hosting an
annual extravaganza in Sun Valley, Idaho. The event sponsors riveting events that make for an unforgettable
experience and long lasting bonds between participants. Interestingly, Allen and Company focuses on the
network and the relationships fostered through the annual event, rather than housing an in-house research
department like many other investment firms.
GitHub. GitHub is an effective way to collaborate on software development projects. Using GitHub, anyone
with an internet connection can share code with the world for free—an unbounded affinity network of
computer coders working on similar problems. All stored code is open access; anyone can download and/or
modify for free. Any and all resulting code remains linked to the original code (and its creator). GitHub has
been adopted as the primary home for source code collaboration and storage by many large open-source
projects.
Professional societies, such as the American Physical Society, seek input from its membership and the
broader community in a number of ways: from various levels of elected representatives, from their Boards,
from a network of leaders/officers of division/section/units within various sub-fields (perhaps via an annual
convocation and/or annual meetings), and from surveys of its membership and other committees involving
members of the scientific research community. Engaging the entire membership can bring diverse expertise
and ideas from other organizations (their own home institutions as well as from other professional societies
that they belong to).
DISTRIBUTION A: Distribution approved for public release.
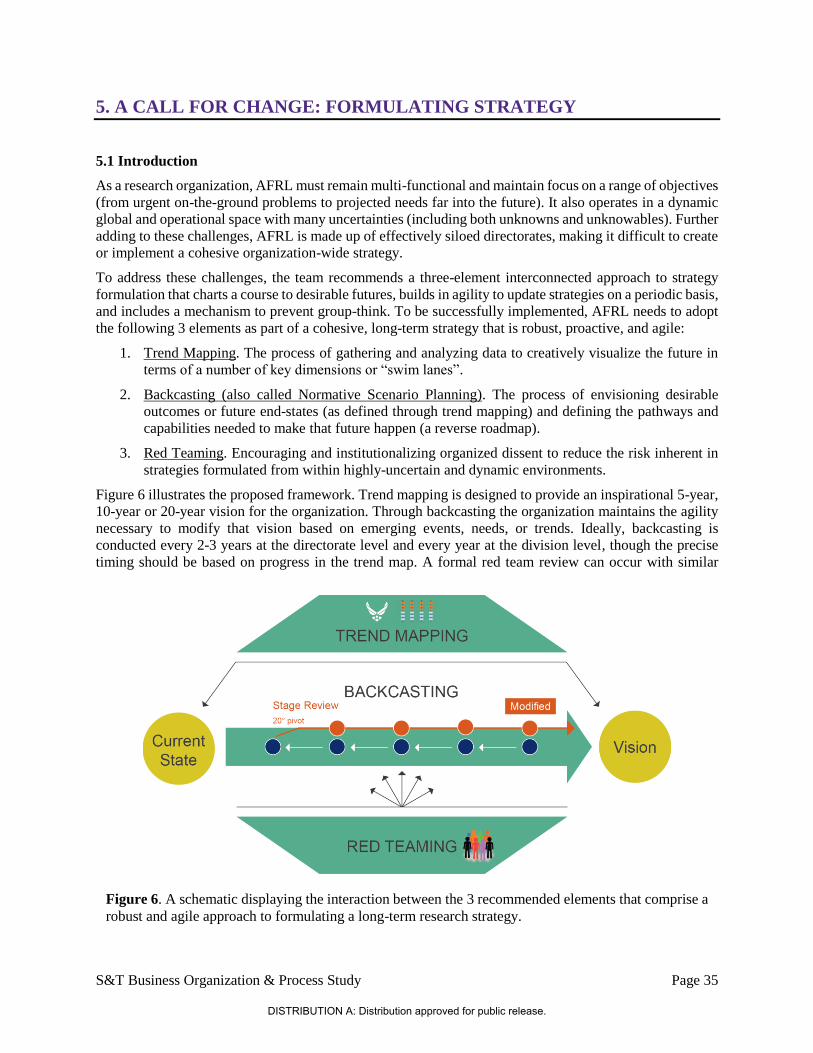
S&T Business Organization & Process Study Page 35
5. A CALL FOR CHANGE: FORMULATING STRATEGY
5.1 Introduction
As a research organization, AFRL must remain multi-functional and maintain focus on a range of objectives
(from urgent on-the-ground problems to projected needs far into the future). It also operates in a dynamic
global and operational space with many uncertainties (including both unknowns and unknowables). Further
adding to these challenges, AFRL is made up of effectively siloed directorates, making it difficult to create
or implement a cohesive organization-wide strategy.
To address these challenges, the team recommends a three-element interconnected approach to strategy
formulation that charts a course to desirable futures, builds in agility to update strategies on a periodic basis,
and includes a mechanism to prevent group-think. To be successfully implemented, AFRL needs to adopt
the following 3 elements as part of a cohesive, long-term strategy that is robust, proactive, and agile:
1. Trend Mapping. The process of gathering and analyzing data to creatively visualize the future in
terms of a number of key dimensions or “swim lanes”.
2. Backcasting (also called Normative Scenario Planning). The process of envisioning desirable
outcomes or future end-states (as defined through trend mapping) and defining the pathways and
capabilities needed to make that future happen (a reverse roadmap).
3. Red Teaming. Encouraging and institutionalizing organized dissent to reduce the risk inherent in
strategies formulated from within highly-uncertain and dynamic environments.
Figure 6 illustrates the proposed framework. Trend mapping is designed to provide an inspirational 5-year,
10-year or 20-year vision for the organization. Through backcasting the organization maintains the agility
necessary to modify that vision based on emerging events, needs, or trends. Ideally, backcasting is
conducted every 2-3 years at the directorate level and every year at the division level, though the precise
timing should be based on progress in the trend map. A formal red team review can occur with similar
Figure 6. A schematic displaying the interaction between the 3 recommended elements that comprise a
robust and agile approach to formulating a long-term research strategy.
DISTRIBUTION A: Distribution approved for public release.
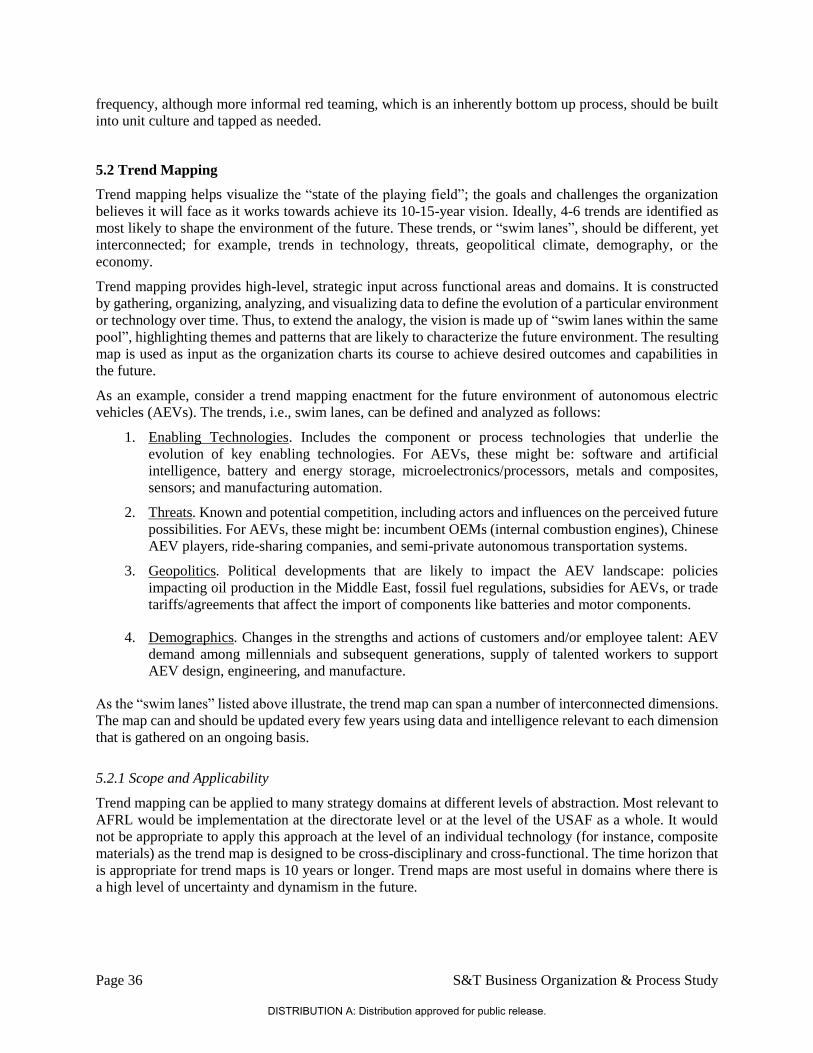
Page 36 S&T Business Organization & Process Study
frequency, although more informal red teaming, which is an inherently bottom up process, should be built
into unit culture and tapped as needed.
5.2 Trend Mapping
Trend mapping helps visualize the “state of the playing field”; the goals and challenges the organization
believes it will face as it works towards achieve its 10-15-year vision. Ideally, 4-6 trends are identified as
most likely to shape the environment of the future. These trends, or “swim lanes”, should be different, yet
interconnected; for example, trends in technology, threats, geopolitical climate, demography, or the
economy.
Trend mapping provides high-level, strategic input across functional areas and domains. It is constructed
by gathering, organizing, analyzing, and visualizing data to define the evolution of a particular environment
or technology over time. Thus, to extend the analogy, the vision is made up of “swim lanes within the same
pool”, highlighting themes and patterns that are likely to characterize the future environment. The resulting
map is used as input as the organization charts its course to achieve desired outcomes and capabilities in
the future.
As an example, consider a trend mapping enactment for the future environment of autonomous electric
vehicles (AEVs). The trends, i.e., swim lanes, can be defined and analyzed as follows:
1. Enabling Technologies. Includes the component or process technologies that underlie the
evolution of key enabling technologies. For AEVs, these might be: software and artificial
intelligence, battery and energy storage, microelectronics/processors, metals and composites,
sensors; and manufacturing automation.
2. Threats. Known and potential competition, including actors and influences on the perceived future
possibilities. For AEVs, these might be: incumbent OEMs (internal combustion engines), Chinese
AEV players, ride-sharing companies, and semi-private autonomous transportation systems.
3. Geopolitics. Political developments that are likely to impact the AEV landscape: policies
impacting oil production in the Middle East, fossil fuel regulations, subsidies for AEVs, or trade
tariffs/agreements that affect the import of components like batteries and motor components.
4. Demographics. Changes in the strengths and actions of customers and/or employee talent: AEV
demand among millennials and subsequent generations, supply of talented workers to support
AEV design, engineering, and manufacture.
As the “swim lanes” listed above illustrate, the trend map can span a number of interconnected dimensions.
The map can and should be updated every few years using data and intelligence relevant to each dimension
that is gathered on an ongoing basis.
5.2.1 Scope and Applicability
Trend mapping can be applied to many strategy domains at different levels of abstraction. Most relevant to
AFRL would be implementation at the directorate level or at the level of the USAF as a whole. It would
not be appropriate to apply this approach at the level of an individual technology (for instance, composite
materials) as the trend map is designed to be cross-disciplinary and cross-functional. The time horizon that
is appropriate for trend maps is 10 years or longer. Trend maps are most useful in domains where there is
a high level of uncertainty and dynamism in the future.
DISTRIBUTION A: Distribution approved for public release.
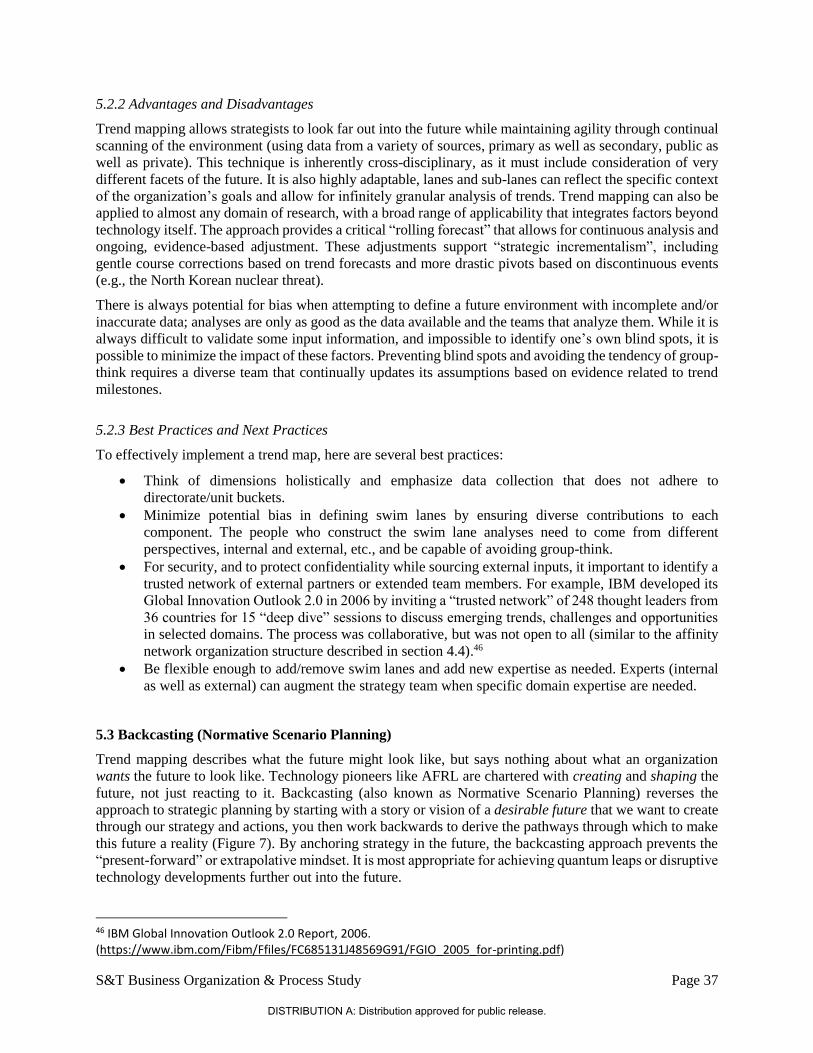
S&T Business Organization & Process Study Page 37
5.2.2 Advantages and Disadvantages
Trend mapping allows strategists to look far out into the future while maintaining agility through continual
scanning of the environment (using data from a variety of sources, primary as well as secondary, public as
well as private). This technique is inherently cross-disciplinary, as it must include consideration of very
different facets of the future. It is also highly adaptable, lanes and sub-lanes can reflect the specific context
of the organization’s goals and allow for infinitely granular analysis of trends. Trend mapping can also be
applied to almost any domain of research, with a broad range of applicability that integrates factors beyond
technology itself. The approach provides a critical “rolling forecast” that allows for continuous analysis and
ongoing, evidence-based adjustment. These adjustments support “strategic incrementalism”, including
gentle course corrections based on trend forecasts and more drastic pivots based on discontinuous events
(e.g., the North Korean nuclear threat).
There is always potential for bias when attempting to define a future environment with incomplete and/or
inaccurate data; analyses are only as good as the data available and the teams that analyze them. While it is
always difficult to validate some input information, and impossible to identify one’s own blind spots, it is
possible to minimize the impact of these factors. Preventing blind spots and avoiding the tendency of group-
think requires a diverse team that continually updates its assumptions based on evidence related to trend
milestones.
5.2.3 Best Practices and Next Practices
To effectively implement a trend map, here are several best practices:
Think of dimensions holistically and emphasize data collection that does not adhere to
directorate/unit buckets.
Minimize potential bias in defining swim lanes by ensuring diverse contributions to each
component. The people who construct the swim lane analyses need to come from different
perspectives, internal and external, etc., and be capable of avoiding group-think.
For security, and to protect confidentiality while sourcing external inputs, it important to identify a
trusted network of external partners or extended team members. For example, IBM developed its
Global Innovation Outlook 2.0 in 2006 by inviting a “trusted network” of 248 thought leaders from
36 countries for 15 “deep dive” sessions to discuss emerging trends, challenges and opportunities
in selected domains. The process was collaborative, but was not open to all (similar to the affinity
network organization structure described in section 4.4).46
Be flexible enough to add/remove swim lanes and add new expertise as needed. Experts (internal
as well as external) can augment the strategy team when specific domain expertise are needed.
5.3 Backcasting (Normative Scenario Planning)
Trend mapping describes what the future might look like, but says nothing about what an organization
wants the future to look like. Technology pioneers like AFRL are chartered with creating and shaping the
future, not just reacting to it. Backcasting (also known as Normative Scenario Planning) reverses the
approach to strategic planning by starting with a story or vision of a desirable future that we want to create
through our strategy and actions, you then work backwards to derive the pathways through which to make
this future a reality (Figure 7). By anchoring strategy in the future, the backcasting approach prevents the
“present-forward” or extrapolative mindset. It is most appropriate for achieving quantum leaps or disruptive
technology developments further out into the future.
46 IBM Global Innovation Outlook 2.0 Report, 2006. (https://www.ibm.com/Fibm/Ffiles/FC685131J48569G91/FGIO_2005_for-printing.pdf)
DISTRIBUTION A: Distribution approved for public release.
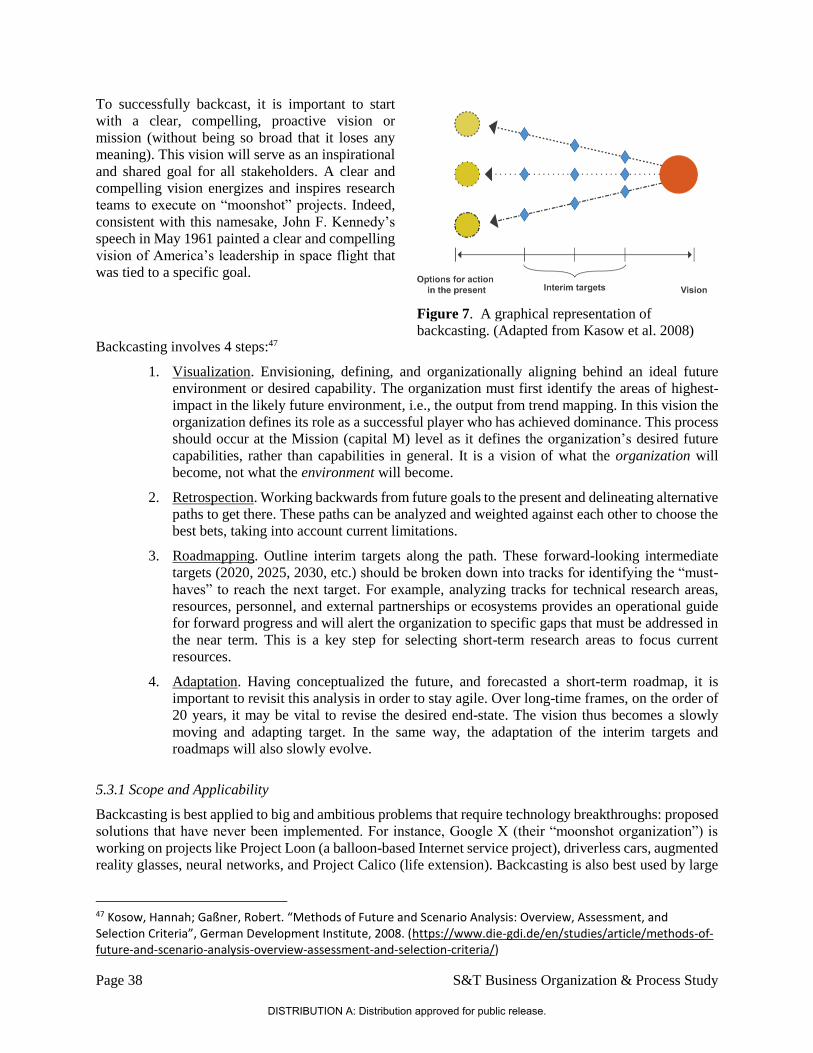
Page 38 S&T Business Organization & Process Study
To successfully backcast, it is important to start
with a clear, compelling, proactive vision or
mission (without being so broad that it loses any
meaning). This vision will serve as an inspirational
and shared goal for all stakeholders. A clear and
compelling vision energizes and inspires research
teams to execute on “moonshot” projects. Indeed,
consistent with this namesake, John F. Kennedy’s
speech in May 1961 painted a clear and compelling
vision of America’s leadership in space flight that
was tied to a specific goal.
Backcasting involves 4 steps:47
1. Visualization. Envisioning, defining, and organizationally aligning behind an ideal future
environment or desired capability. The organization must first identify the areas of highest-
impact in the likely future environment, i.e., the output from trend mapping. In this vision the
organization defines its role as a successful player who has achieved dominance. This process
should occur at the Mission (capital M) level as it defines the organization’s desired future
capabilities, rather than capabilities in general. It is a vision of what the organization will
become, not what the environment will become.
2. Retrospection. Working backwards from future goals to the present and delineating alternative
paths to get there. These paths can be analyzed and weighted against each other to choose the
best bets, taking into account current limitations.
3. Roadmapping. Outline interim targets along the path. These forward-looking intermediate
targets (2020, 2025, 2030, etc.) should be broken down into tracks for identifying the “must-
haves” to reach the next target. For example, analyzing tracks for technical research areas,
resources, personnel, and external partnerships or ecosystems provides an operational guide
for forward progress and will alert the organization to specific gaps that must be addressed in
the near term. This is a key step for selecting short-term research areas to focus current
resources.
4. Adaptation. Having conceptualized the future, and forecasted a short-term roadmap, it is
important to revisit this analysis in order to stay agile. Over long-time frames, on the order of
20 years, it may be vital to revise the desired end-state. The vision thus becomes a slowly
moving and adapting target. In the same way, the adaptation of the interim targets and
roadmaps will also slowly evolve.
5.3.1 Scope and Applicability
Backcasting is best applied to big and ambitious problems that require technology breakthroughs: proposed
solutions that have never been implemented. For instance, Google X (their “moonshot organization”) is
working on projects like Project Loon (a balloon-based Internet service project), driverless cars, augmented
reality glasses, neural networks, and Project Calico (life extension). Backcasting is also best used by large
47 Kosow, Hannah; Gaßner, Robert. “Methods of Future and Scenario Analysis: Overview, Assessment, and Selection Criteria”, German Development Institute, 2008. (https://www.die-gdi.de/en/studies/article/methods-of-future-and-scenario-analysis-overview-assessment-and-selection-criteria/)
Figure 7. A graphical representation of
backcasting. (Adapted from Kasow et al. 2008)
.
DISTRIBUTION A: Distribution approved for public release.
S&T Business Organization & Process Study Page 39
organizations that have the capital, technical capability, talent and patience to engage in breakthrough
research. It is not suitable for short-term business and revenue goals.
5.3.2 Advantages and Disadvantages
Backcasting is powerful because it is proactive rather than reactive. It views strategy as shaping and creating
the future we want. It is flexible, allowing for many paths that are not constrained by current capabilities or
assets. Backcasting is also inspiring because it involves telling stories about the future. Such stories provide
teams with a sense of a larger purpose and aligns people toward a unified goal. However, to the extent there
may be competing and conflicting visions of the desirable future, the strategy team may have trouble
converging on a common vision. Or a team may converge too quickly on one vision, without fully
considering all possibilities. There may also be conflicting and competing pathways and roadmaps for
arriving at the end state. The team has to bet on the best pathway based on the information available at the
time. A safeguard against betting on the wrong future vision or the wrong pathway is to adapt the future
vision on a periodic basis, similar to the approach in adapting trend maps as data about how the future
become available.
5.3.3 Best Practices and Next Practices
Best practices in backcasting are similar those of trend mapping. The team that creates the vision of the
ideal future should consist of diverse domain experts from inside and outside the organization. Diversity in
expertise and experiences will reduce the probability of groupthink or blind spots. As in trend mapping,
backcasting should be revisited on a periodic basis (every 2 to 3 years) to validate the desired future and
evaluate feasibility. Finally, backcasting should be informed by trend maps as an input at the outset as well
as while updating the roadmaps on a periodic basis.
5.4 Red Teaming
Trend mapping and backcasting address likely futures and desirable futures, respectively. However, as the
saying goes, “making predictions is difficult, especially when it comes to predicting the future!” How does
an organization prevent biases and current mental models from limiting its ability to formulate a robust
strategy? A powerful approach to mitigate risk and to encourage debate is red teaming. This approach is an
independent application of a range of critical techniques designed to mitigate risk and create a more robust
strategy by challenging an organization and its assumptions. Red teaming allows an organization to
encourage dissent through a structured process, thereby strengthening the overall strategy by identifying
weak spots.
Red teaming is consistently applied in defense operations strategy.48 However, this team believes that the
technique is also applicable to AFRL. It is an important concept for the USAF because military
organizations are hierarchical, with a deeply rooted “command and control” culture that discourages dissent
and can predispose an organization towards accepting the viewpoints of higher authorities. Within the
context of strategy, conforming to a system where the higher officer/dominant idea is always correct is
dangerous and limiting. While obeying the orders of commanders is essential for warfighters in the
battlefield, the same mindset is not appropriate for an S&T research organization like AFRL. In S&T
research is inherently uncertain; there is rarely a single, clear right answer. Thus, leadership must remain
open to alternative viewpoints. Moreover, the environment that defines the USAF’s world tends to send
weak signals about disruption. These weak signals are usually ignored because they come from the
periphery, where the signal to noise ratio is relatively high. Red teaming helps amplify weak signals by
48 Defense Science Board, “Challenges to Military Operations in Support of U.S. Interests”, Vol II, Main Report, December 2008. (https://www.acq.osd.mil/dsb/reports/2000s/ADA491393.pdf)
DISTRIBUTION A: Distribution approved for public release.
Page 40 S&T Business Organization & Process Study
bringing people in who sit at the peripheries (similar to the challenge current thinking model described in
section 2.4).
The red team plays the role of a “thinking enemy” (or challenger). By design, red teams are an independent
group that is small, underfunded, and placed at a disadvantage relative to the main team. This gives them
strength; they need to be more creative, do more lateral thinking, maximize surprise, and attack dogma to
succeed. Red teaming is an approach that recognizes, celebrates, and institutionalizes dissenting points of
view to reduce the probability that the dominant logic of an organization is built on flawed or outdated
assumptions.
5.4.1 Scope and Applicability
Red teaming is best employed when an organization is at a strategic crossroads and faced with important
choices (see 3G example in section 5.4.3). Red teaming is also appropriate when there is “false consensus”,
often the result of a culture of passive aggression within an organization. Dissenters are driven underground
or are even expelled from the organization, thus eliminating their potentially valuable perspectives. This
tends to happen in organizations that have been very successful in the past, have long-tenured employees,
and/or have a strong dominant culture. Recognizing these characteristics in an organization and
implementing the red teaming strategy could save the organization from dangerous group-think.
5.4.2 Advantages and Disadvantages
Red teaming can help create a culture of respecting thinking that may be heretical or disruptive to the
dominant world view. Indeed, such a culture is essential to successful red teaming, as only then can
individuals play the devil’s advocate role effectively without worrying about sanctions or being seen as
disrespecting hierarchy. Red teams can help avoid blind spots, improve the peripheral vision of an
organization and identify opportunities that may not be in clear view because they are not yet mainstream
or widely accepted. However, if it is not executed well, the red team will not be heard. There must be a
transparent process for listening and acting on red team recommendations. Leaders must support the
formation of red teams and create a culture of respect for the minority opinion. There is also a danger that
red teams be over-used and over-resourced; too many minority opinions and too much emphasis on second-
guessing the mainstream strategy can ultimately lead an organization down the wrong path.49
5.4.3 Best Practices and Next Practices
Red teams must be staffed with those not considered established subject-area experts or those on the main
strategy team. It is important to bring in points of view that differ from the mainstream organization. Also,
red teams need to be supported by senior leaders. They need to be officially blessed and resourced, and
there needs to be a process for feedback that ensures leadership receives the input. Leadership needs to
honor dissent and respect the minority opinion. Red teams are psychological “safe places” for dissent and
they should be treated as such so that people can offer dissenting points of views without fear of retribution
or ridicule. Other best practices include:
Establish “rules for dissent”: Members must be trained to dissent in constructive ways.
Establish red teams at the outset: Plan red teams proactively as an integral component of the strategy
formulation process.
Match teams to the tasks: The skills and experience of team members should be task-specific and
must include those whose opinions and points of view are respected in the broader organization.
49 Zenko, Micah. (2015) Red Team: How to Succeed by Thinking Like the Enemy. New York, NY: Basic Books
DISTRIBUTION A: Distribution approved for public release.
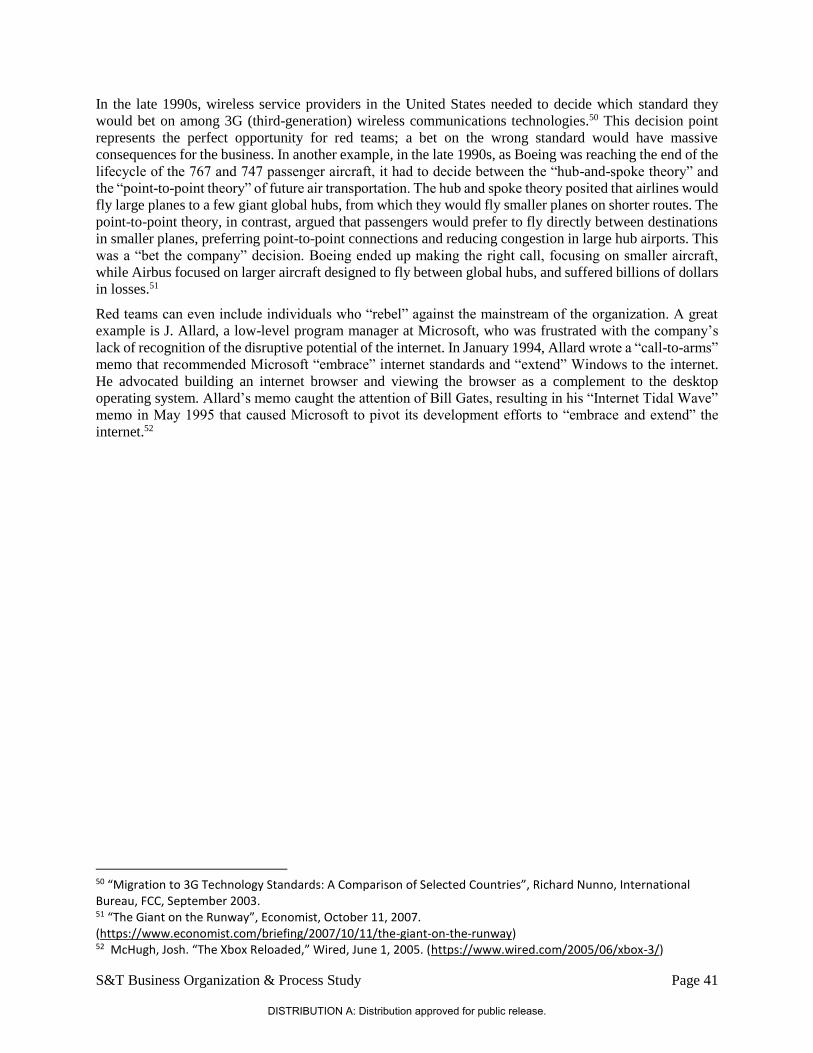
S&T Business Organization & Process Study Page 41
In the late 1990s, wireless service providers in the United States needed to decide which standard they
would bet on among 3G (third-generation) wireless communications technologies.50 This decision point
represents the perfect opportunity for red teams; a bet on the wrong standard would have massive
consequences for the business. In another example, in the late 1990s, as Boeing was reaching the end of the
lifecycle of the 767 and 747 passenger aircraft, it had to decide between the “hub-and-spoke theory” and
the “point-to-point theory” of future air transportation. The hub and spoke theory posited that airlines would
fly large planes to a few giant global hubs, from which they would fly smaller planes on shorter routes. The
point-to-point theory, in contrast, argued that passengers would prefer to fly directly between destinations
in smaller planes, preferring point-to-point connections and reducing congestion in large hub airports. This
was a “bet the company” decision. Boeing ended up making the right call, focusing on smaller aircraft,
while Airbus focused on larger aircraft designed to fly between global hubs, and suffered billions of dollars
in losses.51
Red teams can even include individuals who “rebel” against the mainstream of the organization. A great
example is J. Allard, a low-level program manager at Microsoft, who was frustrated with the company’s
lack of recognition of the disruptive potential of the internet. In January 1994, Allard wrote a “call-to-arms”
memo that recommended Microsoft “embrace” internet standards and “extend” Windows to the internet.
He advocated building an internet browser and viewing the browser as a complement to the desktop
operating system. Allard’s memo caught the attention of Bill Gates, resulting in his “Internet Tidal Wave”
memo in May 1995 that caused Microsoft to pivot its development efforts to “embrace and extend” the
internet.52
50 “Migration to 3G Technology Standards: A Comparison of Selected Countries”, Richard Nunno, International Bureau, FCC, September 2003. 51 “The Giant on the Runway”, Economist, October 11, 2007. (https://www.economist.com/briefing/2007/10/11/the-giant-on-the-runway) 52 McHugh, Josh. “The Xbox Reloaded,” Wired, June 1, 2005. (https://www.wired.com/2005/06/xbox-3/)
DISTRIBUTION A: Distribution approved for public release.

Page 42 S&T Business Organization & Process Study
Page intentionally left blank
DISTRIBUTION A: Distribution approved for public release.
S&T Business Organization & Process Study Page 43
6. TRANSFORMATIONAL NECESSITIES AND CONCLUSIONS
In summary, this report has proposed the following models/approaches for USAF to implement (adapted
to its particular circumstances):
Problem-focused approaches that support applied research directly aligned with well-specified
challenges, implemented with (among other methods) challenge-driven teams and, where
appropriate, backcasting to develop a roadmap that proactively moves towards a desired future.
Discovery-based approaches that support exploratory projects in new fields relevant to the USAF
mission, using trend mapping as needed to define the future landscape of needs and influences and,
as appropriate, creating and leveraging affinity networks.
Challenge current thinking approaches based on fostering an organizational culture that questions
assumptions, including, as warranted, red teams aimed at identifying risks and guarding against
group-think. The enabler model can support the entrepreneurial efforts of employees by creating
an outlet for ideas that do not fit existing programs. These approaches can also play an important
role in changing the organizational culture.
Broad approaches to measuring ROI, using metrics from leading research institutions, can support
decision-making in all of the above approaches. ROI models need to cover not only outcomes but
also general innovation capabilities: people (research talent), tools, patents, and knowledge
communities/networks.
Collectively, these various models and approaches support 3 overriding ideas that form the basis for the
NU team’s specific recommendations:
Remove obstacles that stifle innovation.
Be a learning organization.
Attract the best people.
Removing obstacles to innovation and proactively implementing structures and processes that facilitate
continuous learning will help USAF attract the best people, who will then drive innovation and sustain an
agile culture from which breakthrough solutions are most likely to emerge.
6.1 Remove Obstacles that Stifle Innovation
The models described in this report for selecting research areas, measuring results, organizing teams, and
setting strategy will go a long way toward facilitating the kind of agility and autonomy sought by USAF
leadership and researchers. Lightening the touch of oversight can encourage high performance and greater
employee engagement. Most of the suggested models, such as challenge current thinking, enabler model,
and red teams, may be implemented on a small scale at first and then expanded as USAF gains experience
with the various approaches.
Beyond these models, it is important to eliminate various potential impediments to innovation such as
inefficient contracting processes or incommodious IT systems (most notably, videoconferencing). The NU
team endorses the idea, raised during our site visit, to embed acquisition staff in directorates and enable
communication with potential vendors earlier in the contracting process. Leading organizations,
particularly in the IT space, are now using “smart buyer” organizations (sometimes referred to as “strategic
sourcing groups”) with exactly these features in order to streamline and improve contracting and external
DISTRIBUTION A: Distribution approved for public release.
Page 44 S&T Business Organization & Process Study
partnerships.53 The USAF’s Air Combat Command, Acquisition Management and Integration Center
(AMIC) is an excellent example of such an organization. It describes itself as:
“an integrated team of 270 acquisition professionals…(with) an integrated culture model that links
those responsible for setting the requirements and overseeing the execution with those who are experts
in the contracting mechanisms. Projects are managed as multi-functional teams with functional
expertise on location (i.e., Logistics, Quality Assurance, Civil Engineer, and Communications)…. Program managers and contracting officers work side-by-side, speak the same language,
understand each other’s constraints.54
Finally, during our site visit the NU team learned about various programs and resources—the
Entrepreneurial Opportunities Program, Partnership Intermediary Agreements, the 444 maker space, the i2i
(intellect to intellect) exchange program with industry—that are providing new pathways for
entrepreneurial people at AFRL to develop innovative ideas. The USAF has recently been leading the DOD
in the use of commercial venturing mechanisms, such as accelerators and incubators. Greater linkages with
these sister organizations, such as AFWERX,55 should be encouraged. The team advocates for the
continuation and expansion of the Entrepreneurial Opportunities Program to attract highly skilled and
motivated individuals, and to build an external community familiar with and invested in helping to fulfill
USAF needs.
The NSF I-Corps model, described in section 4.2, is a particularly suitable model for AFRL. Linking basic
and applied research programs to downstream applications can inspire design-thinking approaches and
imbue research programs with agility as needs and technologies evolve. Many academic institutions have
found that their entrepreneurial faculty benefit tremendously from programs such as the I-Corps. Projects
run through a Lean LaunchPad-like program can link to existing entrepreneurial infrastructure both locally
and nationally such as accelerators and incubators to further the technology transfer process. Additionally,
as these types of programs advance the principal investigators in the initial stages of technology transfer,
follow-on programs are often necessary to insure researchers can fully advance the technologies. Principal
investigators who have enrolled in the I-Corps program have found the curriculum beneficial not only for
their immediate entrepreneurial endeavors, but also for their research programs, grant applications, and
relationships with corporate partners.
6.2 Be a Learning Organization
The “learning organization” concept was popularized by Peter Senge in his book, The Fifth Discipline.
According to his view, learning organizations share 5 key characteristics:56
Systems thinking. A focus on measuring the performance of the whole organization as well as its
various components.
Personal mastery. Individuals committed to continuous self-improvement.
Mental model. Commitment to challenging practices dictated by institutional memory in an open
and constructive way.
53 Graham, David; Johnson, Hansford; Kelly, Julie; Lippitz, Michael; Richmann, James; Van Atta, Richard. “Improving Department of Defense (DoD) Contracting for Services,” Institute for Defense Analyses Paper P-5010, July 2013. 54 Ibid., Pages 30-31. 55 From the website http://afwerxdc.org/: Established in 2017…AFWERX is a catalyst for agile Air Force engagement across industry, academia, and non-traditional contributors to create transformative opportunities and foster an Air Force culture of innovation. 56 Excerpted from Wikipedia, “Learning Organization,” June 20, 2018. (https://en.wikipedia.org/wiki/Learning_organization)
DISTRIBUTION A: Distribution approved for public release.
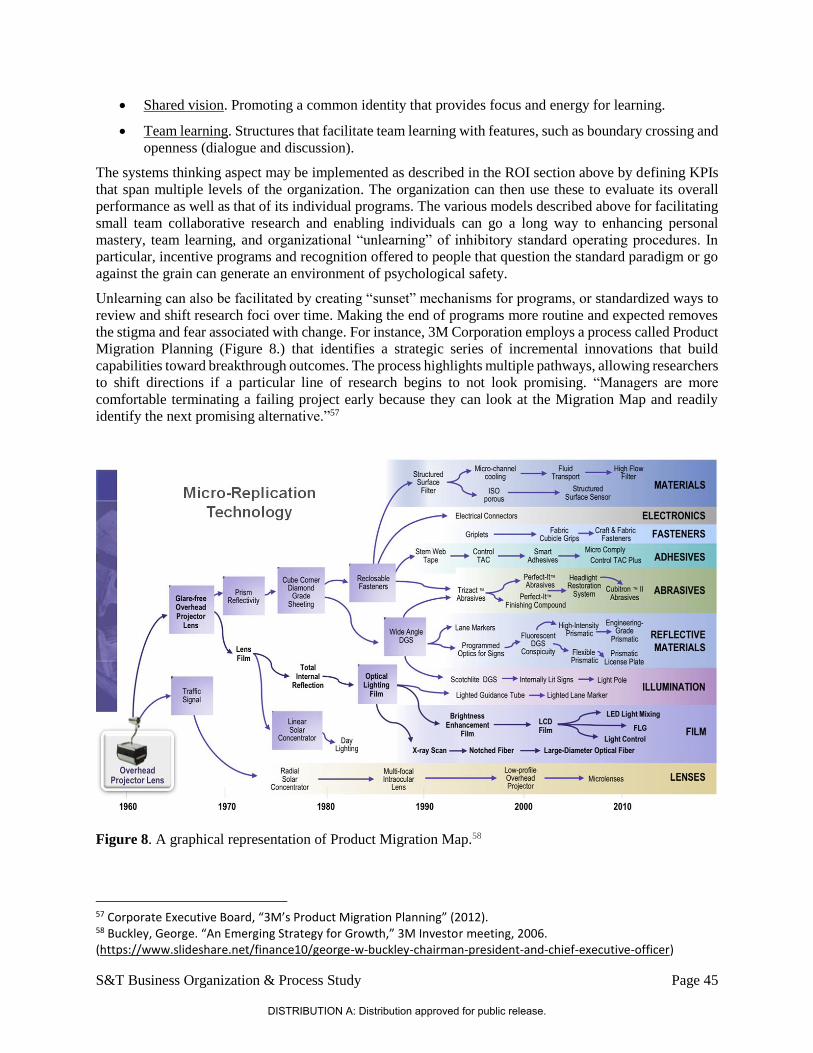
S&T Business Organization & Process Study Page 45
Shared vision. Promoting a common identity that provides focus and energy for learning.
Team learning. Structures that facilitate team learning with features, such as boundary crossing and
openness (dialogue and discussion).
The systems thinking aspect may be implemented as described in the ROI section above by defining KPIs
that span multiple levels of the organization. The organization can then use these to evaluate its overall
performance as well as that of its individual programs. The various models described above for facilitating
small team collaborative research and enabling individuals can go a long way to enhancing personal
mastery, team learning, and organizational “unlearning” of inhibitory standard operating procedures. In
particular, incentive programs and recognition offered to people that question the standard paradigm or go
against the grain can generate an environment of psychological safety.
Unlearning can also be facilitated by creating “sunset” mechanisms for programs, or standardized ways to
review and shift research foci over time. Making the end of programs more routine and expected removes
the stigma and fear associated with change. For instance, 3M Corporation employs a process called Product
Migration Planning (Figure 8.) that identifies a strategic series of incremental innovations that build
capabilities toward breakthrough outcomes. The process highlights multiple pathways, allowing researchers
to shift directions if a particular line of research begins to not look promising. “Managers are more
comfortable terminating a failing project early because they can look at the Migration Map and readily
identify the next promising alternative.”57
Figure 8. A graphical representation of Product Migration Map.58
57 Corporate Executive Board, “3M’s Product Migration Planning” (2012). 58 Buckley, George. “An Emerging Strategy for Growth,” 3M Investor meeting, 2006. (https://www.slideshare.net/finance10/george-w-buckley-chairman-president-and-chief-executive-officer)
DISTRIBUTION A: Distribution approved for public release.
Page 46 S&T Business Organization & Process Study
Beyond these 5 characteristics, the NU team recommends that AFRL develop narratives that trace
breakthroughs and technologies back to basic research. Stories are a very effective method for
communicating the impact of research. Thus, it is important to continually trace technologies and
breakthroughs back to original scientific discoveries. Several narratives should be constructed for each
directorate. These narratives could even be part of the sunset provisions of programs, thereby honoring the
people and efforts involved.
6.3 Attract the Best People
To realize the desired future for 2030 and beyond, one must also anticipate the future of research
organizations and business processes. The next-generation of research organizations will need to have fewer
boundaries and be more agile, global, and transparent.59 The workplace environment is expected to go
through major changes that will reshape how organizations operate, including new technologies, high
workforce turnover, and a focus on teams. Widespread internet access and cloud-based applications will
change how and where work is performed.60 The strict corporate organization structures will disappear, and
projects will be identified to meet specific objectives with teams forming and disbanding dynamically.61
Organizations will embrace and optimize the use of smart technology for enhancing communication and
research. Keeping these likely scenarios in mind will help AFRL compete for talent in 2030 and burnish its
already good reputation for quality research. Beyond this, the NU team recommends the following:
Increase diversity. (1) Enhance AFRL’s public-facing website to bring more awareness to scientific
challenges, research programs, and interests most relevant to the USAF mission; and (2) engage a
diverse scientific community through networking events or scientific professional societies.
Fund “people” not “projects”. Develop a program like the HHMI Investigator Program (see section
4.3) to facilitate long-term relationships with high performing researchers. These people would be
employed by the USAF but reside at universities.
Initiate an ROTC-type program. Offer graduate education fellowships in exchange for a
commitment to serve within the USAF research organizations for a period after graduation.
Develop “urban outposts”. Many top people may be reluctant to relocate to an AFRL site versus
better-known, more vibrant innovation hubs, such as Silicon Valley, California. AFRL should
experiment with setting up offices in various innovation hubs and attractive urban centers where
locals can learn about the AFRL research agenda, interact with personnel on temporary duty
assignment, and make other contributions.
59 Boudreaux, J. ‘Work in the Future Will Fall into These 4 Categories’ Harvard Business Review. 2016 60 ‘Cisco Connected Workplace. The Workplace of Tomorrow’, Cisco Systems Inc. White Paper. 2013 61 Hansen, T. ‘The Future of Knowledge Work’, Intel Corporation White Paper. 2014
DISTRIBUTION A: Distribution approved for public release.
APPENDIX A
Agenda for Site Visit to Wright-Patterson Air Force Base
On April 9, 2018, seven members of the NU study team interviewed twenty-eight AFRL personnel at Wright-Patterson Air Force Base to identify strengths and challenges in each of the four thematic areas. The participating NU study team members were Jay Walsh, Prem Kumar, Mark Werwath, Lisa Dhar, Michael Lippitz, Mohanbir Sawhney, and Jian Cao.
S&T Business Organization and Process Study Page 47
DISTRIBUTION A: Distribution approved for public release.
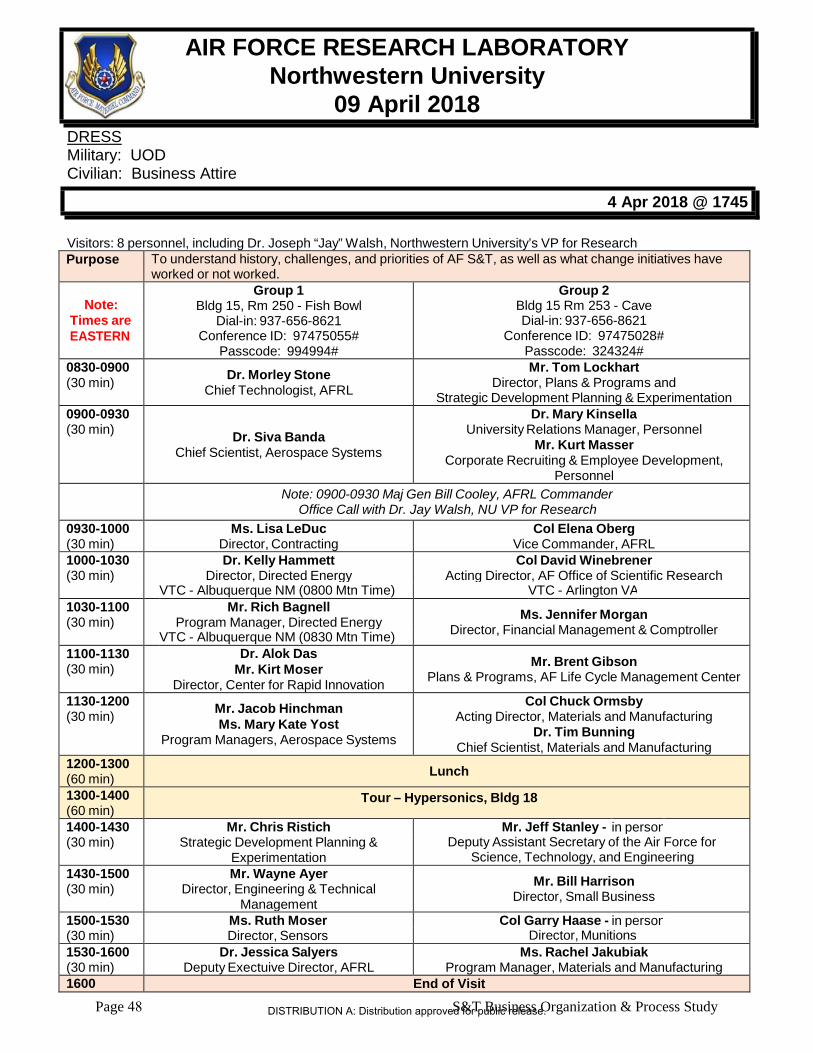
DRESS Military: UOD
AIR FORCE RESEARCH LABORATORY Northwestern University
09 April 2018
Civilian: Business Attire
Visitors: 8 personnel, including Dr. Joseph “Jay” Walsh, Northwestern University’s VP for Research Purpose To understand history, challenges, and priorities of AF S&T, as well as what change initiatives have
worked or not worked.
Note: Times are EASTERN
Group 1 Bldg 15, Rm 250 - Fish Bowl
Dial-in: 937-656-8621 Conference ID: 97475055#
Passcode: 994994#
Group 2 Bldg 15 Rm 253 - Cave Dial-in: 937-656-8621
Conference ID: 97475028# Passcode: 324324#
0830-0900 (30 min) Dr. Morley Stone
Chief Technologist, AFRL
Mr. Tom Lockhart Director, Plans & Programs and
Strategic Development Planning & Experimentation 0900-0930 (30 min) Dr. Siva Banda
Chief Scientist, Aerospace Systems
Dr. Mary Kinsella University Relations Manager, Personnel
Mr. Kurt Masser Corporate Recruiting & Employee Development,
Personnel Note: 0900-0930 Maj Gen Bill Cooley, AFRL Commander
Office Call with Dr. Jay Walsh, NU VP for Research 0930-1000 (30 min)
Ms. Lisa LeDuc Director, Contracting
Col Elena Oberg Vice Commander, AFRL
1000-1030 (30 min)
Dr. Kelly Hammett Director, Directed Energy
Col David Winebrener Acting Director, AF Office of Scientific Research
VTC - Albuquerque NM (0800 Mtn Time) VTC - Arlington VA 1030-1100 (30 min)
Mr. Rich Bagnell Program Manager, Directed Energy Ms. Jennifer Morgan
Director, Financial Management & Comptroller VTC - Albuquerque NM (0830 Mtn Time) 1100-1130 (30 min)
Dr. Alok Das Mr. Kirt Moser
Director, Center for Rapid Innovation
Mr. Brent Gibson Plans & Programs, AF Life Cycle Management Center
1130-1200 (30 min) Mr. Jacob Hinchman
Ms. Mary Kate Yost Program Managers, Aerospace Systems
Col Chuck Ormsby Acting Director, Materials and Manufacturing
Dr. Tim Bunning Chief Scientist, Materials and Manufacturing
1200-1300 (60 min) Lunch
1300-1400 (60 min)
Tour – Hypersonics, Bldg 18
1400-1430 (30 min)
Mr. Chris Ristich Strategic Development Planning &
Experimentation
Mr. Jeff Stanley - in person Deputy Assistant Secretary of the Air Force for
Science, Technology, and Engineering 1430-1500 (30 min)
Mr. Wayne Ayer Director, Engineering & Technical
Management
Mr. Bill Harrison Director, Small Business
1500-1530 (30 min)
Ms. Ruth Moser Director, Sensors
Col Garry Haase - in person Director, Munitions
1530-1600 (30 min)
Dr. Jessica Salyers Deputy Exectuive Director, AFRL
Ms. Rachel Jakubiak Program Manager, Materials and Manufacturing
1600 End of Visit
4 Apr 2018 @ 1745
Page 48 S&T Business Organization & Process Study DISTRIBUTION A: Distribution approved for public release.
APPENDIX B
Agenda for the Northwestern University Business Organization and Processes Study Workshop
On June 1 and June 2, 2018, the NU study team convened 45 participants with diverse backgrounds and expertise from academic, commercial, and government sectors to identify key challenges and approaches to manage an early-stage research enterprise. The agenda was organized around the four study themes and included both full-group brainstorming sessions, small-group breakout sessions, and inter-theme sessions.
S&T Business Organization and Process Study Page 49
DISTRIBUTION A: Distribution approved for public release.
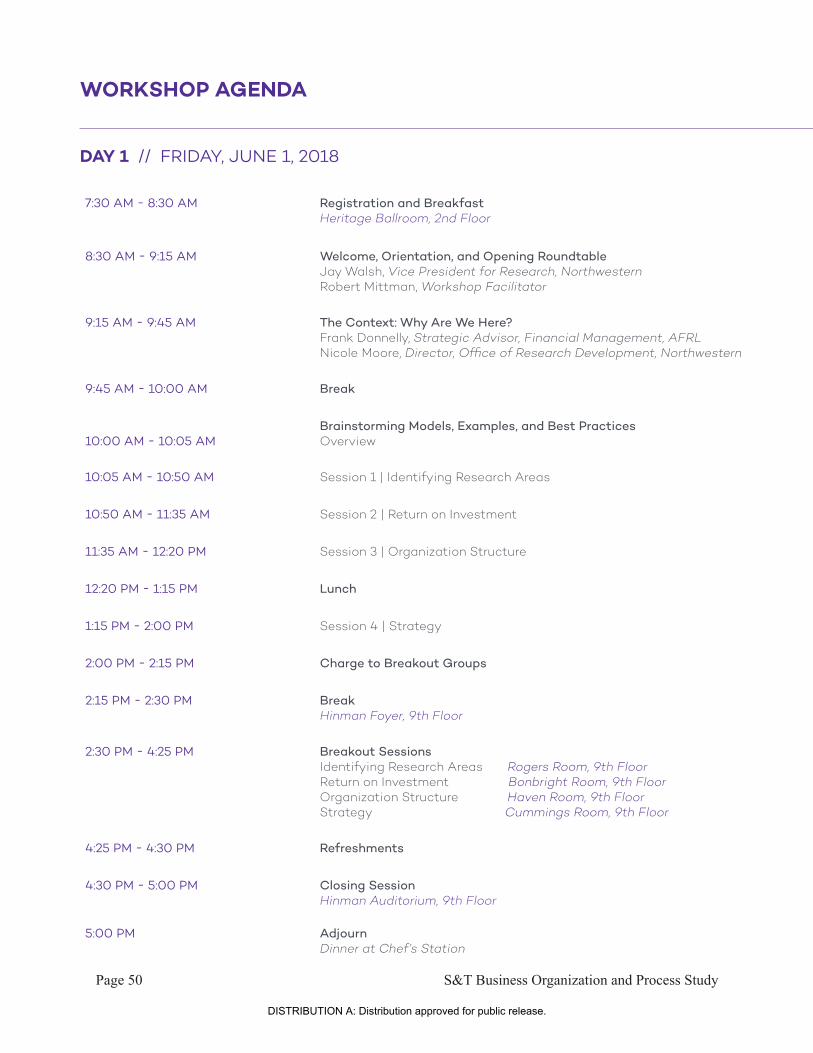
WORKSHOP AGENDA
DAY 1 // FRIDAY, JUNE 1, 2018
7:30 AM - 8:30 AM Registration and Breakfast Heritage Ballroom, 2nd Floor
8:30 AM - 9:15 AM Welcome, Orientation, and Opening Roundtable Jay Walsh, Vice President for Research, Northwestern Robert Mittman, Workshop Facilitator
9:15 AM - 9:45 AM The Context: Why Are We Here? Frank Donnelly, Strategic Advisor, Financial Management, AFRL Nicole Moore, Director, Office of Research Development, Northwestern
9:45 AM - 10:00 AM Break
10:00 AM - 10:05 AM Brainstorming Models, Examples, and Best Practices Overview
10:05 AM - 10:50 AM Session 1 | Identifying Research Areas
10:50 AM - 11:35 AM Session 2 | Return on Investment
11:35 AM - 12:20 PM Session 3 | Organization Structure
12:20 PM - 1:15 PM Lunch
1:15 PM - 2:00 PM Session 4 | Strategy
2:00 PM - 2:15 PM Charge to Breakout Groups
2:15 PM - 2:30 PM Break Hinman Foyer, 9th Floor
2:30 PM - 4:25 PM Breakout Sessions Identifying Research Areas Rogers Room, 9th Floor Return on Investment Bonbright Room, 9th Floor Organization Structure Haven Room, 9th Floor Strategy Cummings Room, 9th Floor
4:25 PM - 4:30 PM Refreshments
4:30 PM - 5:00 PM Closing Session Hinman Auditorium, 9th Floor
5:00 PM Adjourn Dinner at Chef’s Station
Page 50 S&T Business Organization and Process Study
DISTRIBUTION A: Distribution approved for public release.

WORKSHOP AGENDA
DAY 2 // SATURDAY, JUNE 2, 2018
7:30 AM - 8:00 AM Breakfast Heritage Ballroom, 2nd Floor
8:00 AM - 8:30 AM Opening Session: Reflect and Recalibrate
8:30 AM - 10:00 AM Gallery Walk and Cross-Fertilization Session
10:00 AM - 10:20 AM Break
10:20 AM - 11:10 AM Prioritization of Models
11:10 AM - 12:00 PM Closing Discussion and Roundtable
12:00 PM Adjourn Boxed Lunches Available
S&T Business Organization and Process Study Page 51
DISTRIBUTION A: Distribution approved for public release.

Page 52 S&T Business Organization & Process Study
Page intentionally left blank
DISTRIBUTION A: Distribution approved for public release.
APPENDIX C
Graphical Records of the Northwestern University Business Organization and Processes Study Workshop Sessions
During the workshop held on June 1-2, 2018, the primary discussion points were captured in real time by a graphical artist who created pictographic records of each of the full-group sessions on large (8’x4’) poster boards displayed in the front of the room. These images are photographs of the resulting graphical records.
S&T Business Organization and Process Study Page 53
DISTRIBUTION A: Distribution approved for public release.
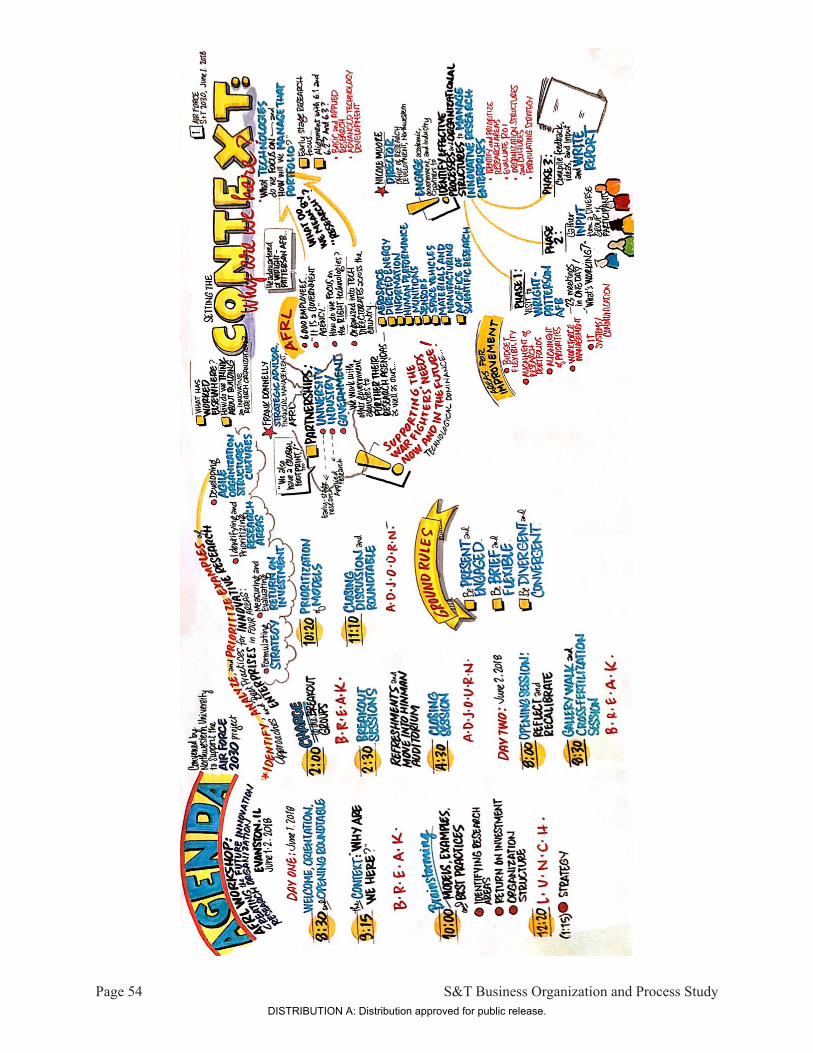
Page 54 S&T Business Organization and Process Study DISTRIBUTION A: Distribution approved for public release.
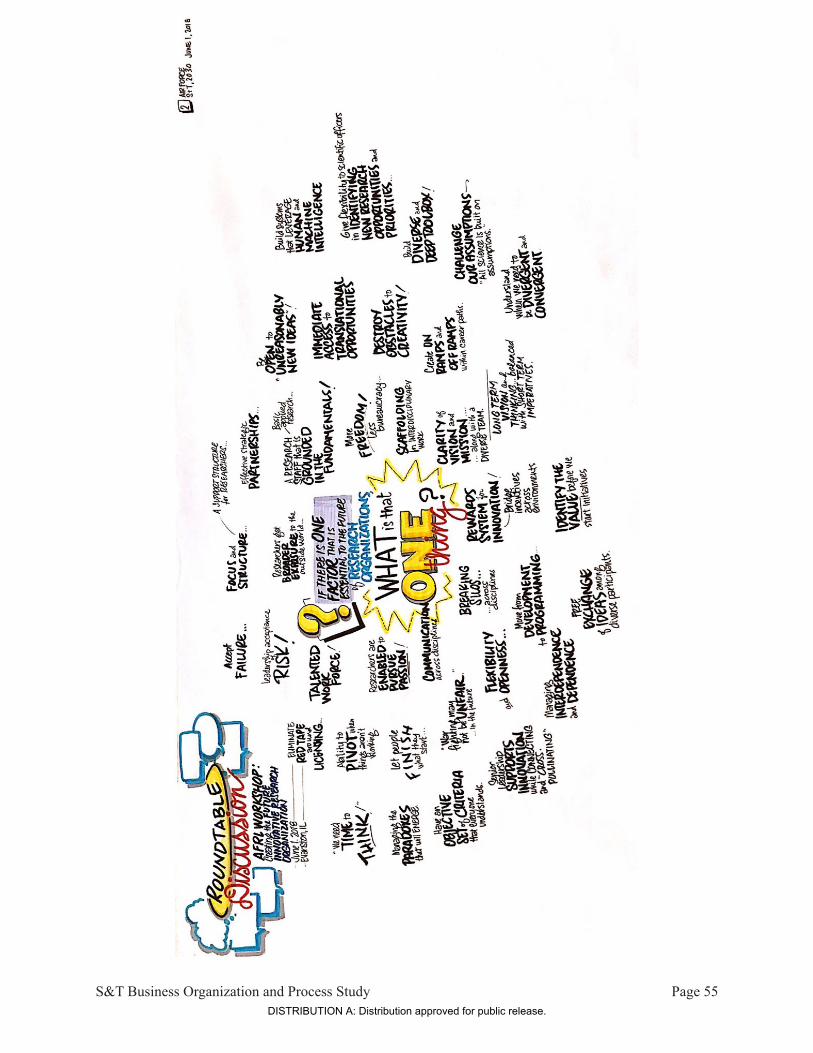
S&T Business Organization and Process Study Page 55DISTRIBUTION A: Distribution approved for public release.
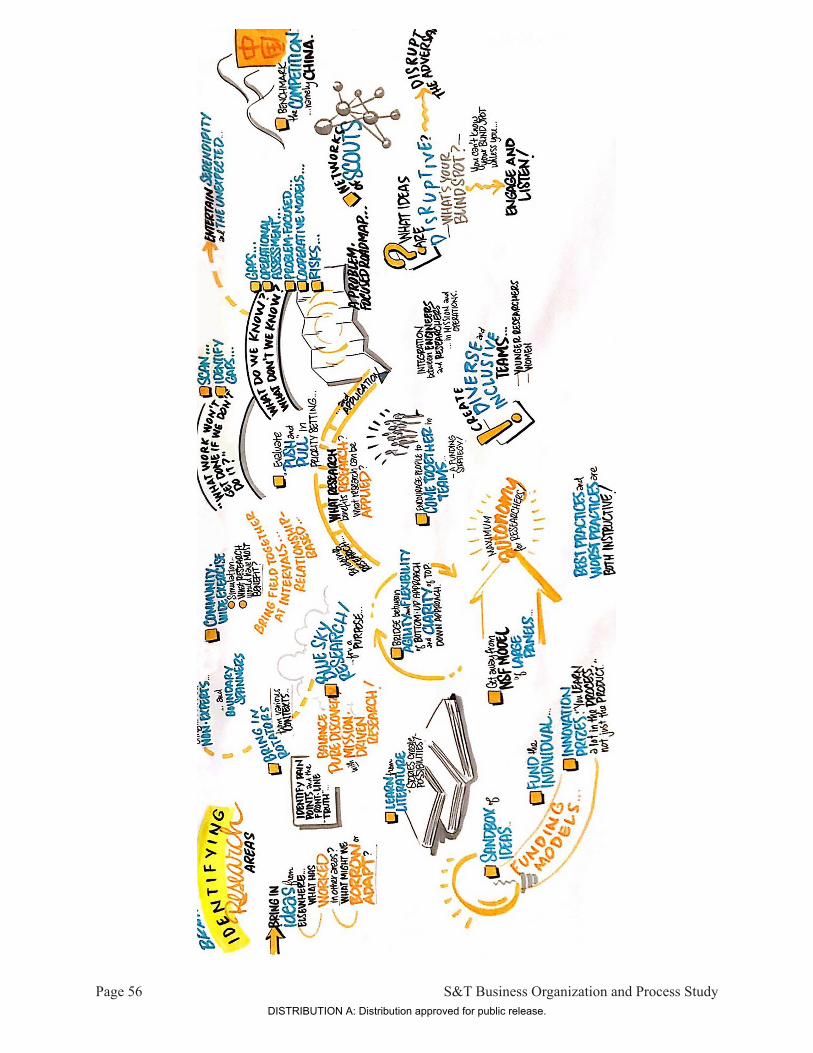
Page 56 S&T Business Organization and Process Study DISTRIBUTION A: Distribution approved for public release.
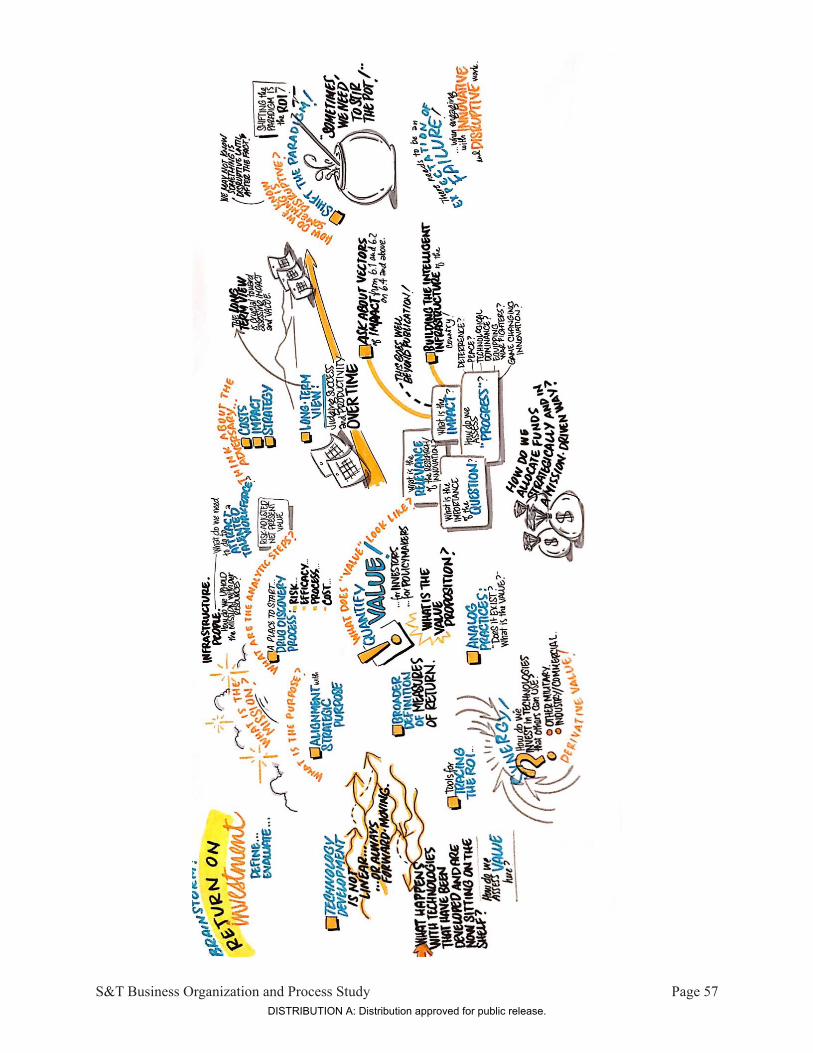
S&T Business Organization and Process Study Page 57DISTRIBUTION A: Distribution approved for public release.
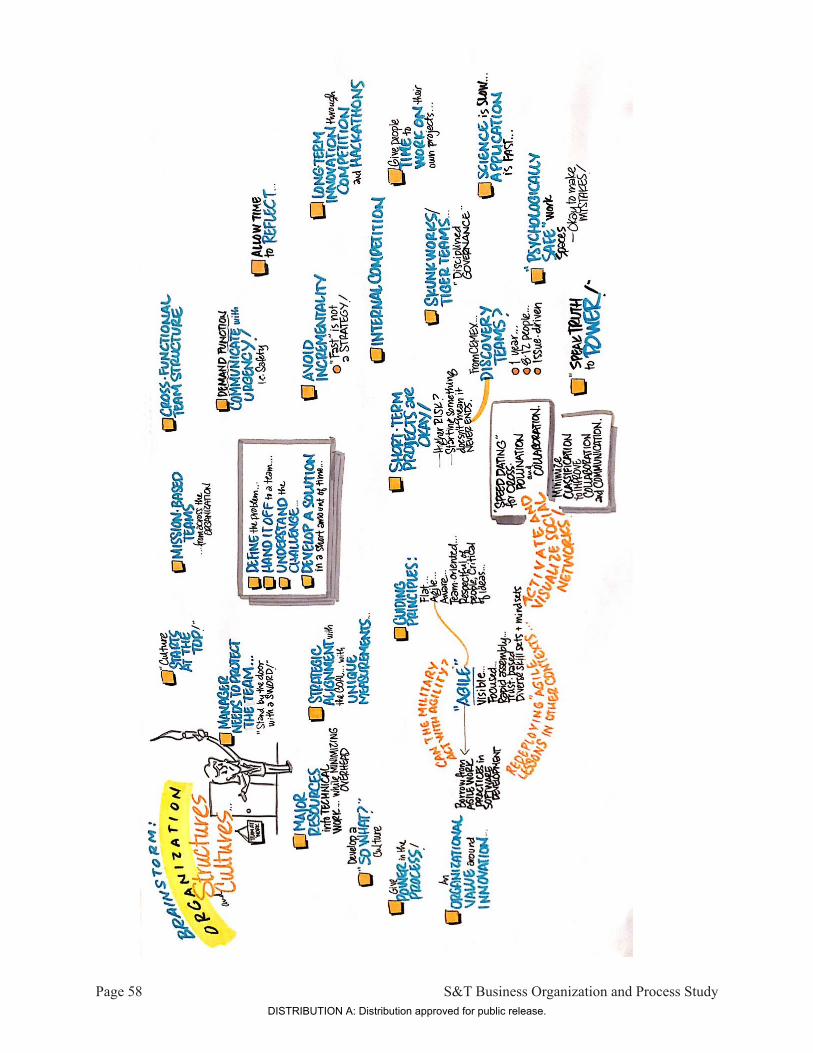
Page 58 S&T Business Organization and Process Study DISTRIBUTION A: Distribution approved for public release.
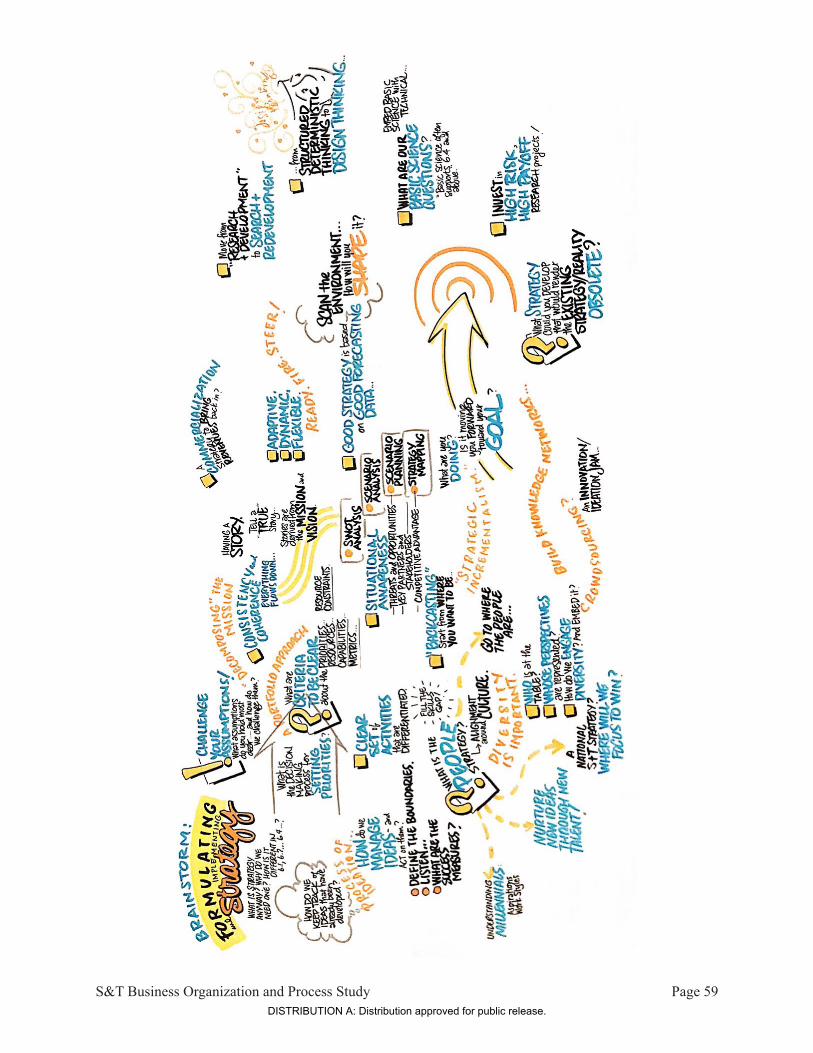
S&T Business Organization and Process Study Page 59DISTRIBUTION A: Distribution approved for public release.
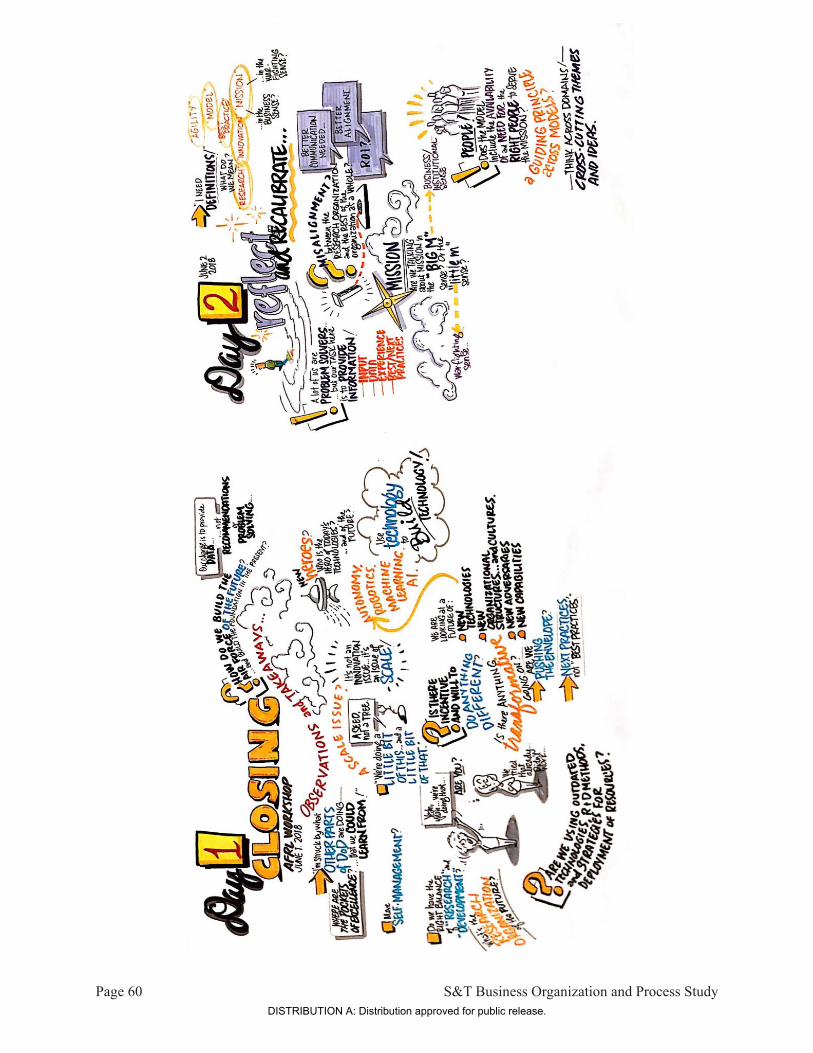
Page 60 S&T Business Organization and Process Study DISTRIBUTION A: Distribution approved for public release.
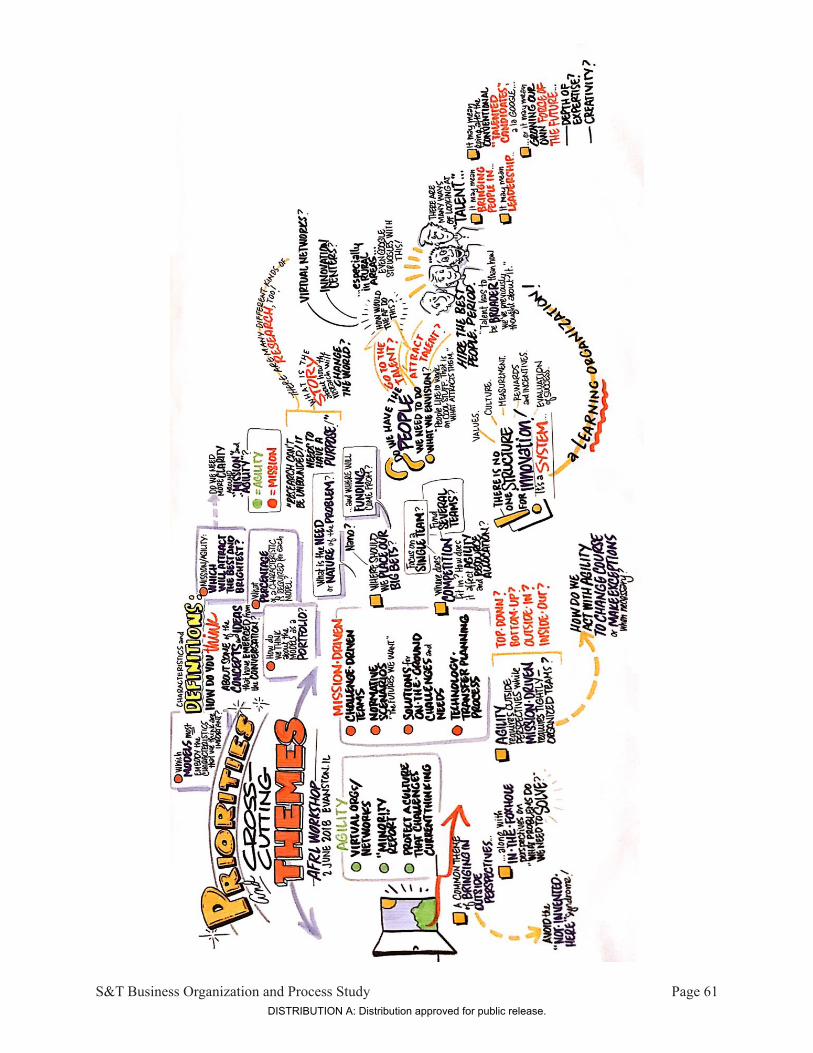
S&T Business Organization and Process Study Page 61DISTRIBUTION A: Distribution approved for public release.
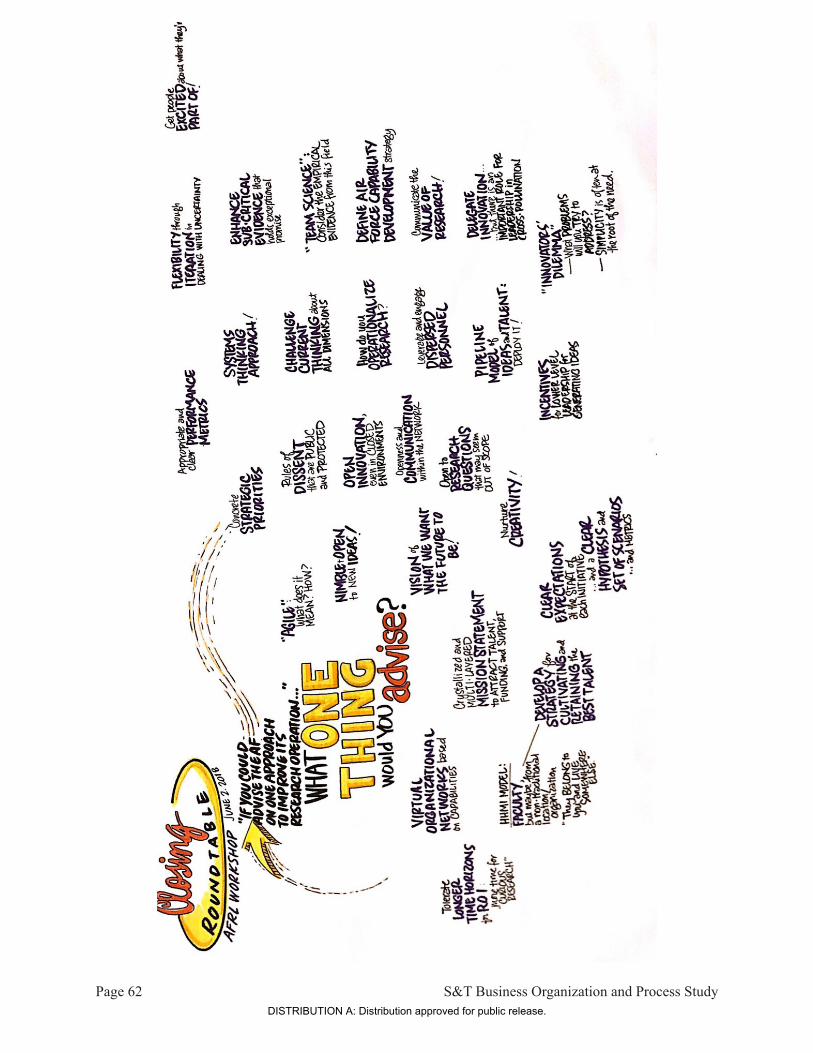
Page 62 S&T Business Organization and Process Study DISTRIBUTION A: Distribution approved for public release.

PARTICIPANTS
Any opinions, findings, and conclusions or recommendations expressed in this material are those of the author(s) and do not necessarily
reflect the views of the United States Air Force.
DISTRIBUTION A: Distribution approved for public release.

DISTRIBUTION A: Distribution approved for public release.