jan randall - concord hospital - the patients journey – everyone’s business
TRANSCRIPT

Jan Randall - CNC
Patient Flow Coordinator
Demand Management Unit
Concord Hospital
23rd June 2015
Transfer of Care Conference: Improving the patient journey across the
continuum of care.
The Patient Journey Everyones Business
Park Royal – Darling Harbour
Sydney : Informa Health Care

Presentation content
My Hospital Concord
The Hospital Journey – Electronic Connection
The Patient Journey
The Patient Flow Portal “Wait for What”
Delays along the way
Community Connection

Concord Repatriation General Hospital

The Hospital Journey
Electronic enhancements:
o Medications – Geriatric wards (7yrs) – Mental
Health complete, OPD and ED are in process, and
all inpatient wards on track - by March 2016
o eMR Emergency medical and nursing notes 2015
o Community Nursing referrals online to SLHD 2012
and SSWLHD 2013
o eMR for Community Nursing referrals July 2015
with the go live for My Aged Care (MAC)
o Online referrals – Specialty Services

The Patient Journey
Whole of Hospital Project February 2015: Discharge Planning – June
2015 “Patient Flow Coordinator”
Patient and Carer/Family centred care
E.g Discharge risk screen on admission
Daily monitoring of the Patient Flow Portal: EDDs and Waiting for
What (WFW) generated by the NUM
Engagement and collaboration with the Multidisciplinary Team
continue (MDT)

2013 to May 2015
0.00%
20.00%
40.00%
60.00%
80.00%
100.00%
120.00%
Ax
is T
itle
EDD Compliance by Month for the years - 2013, 2014, 2015
2015
2014
2013
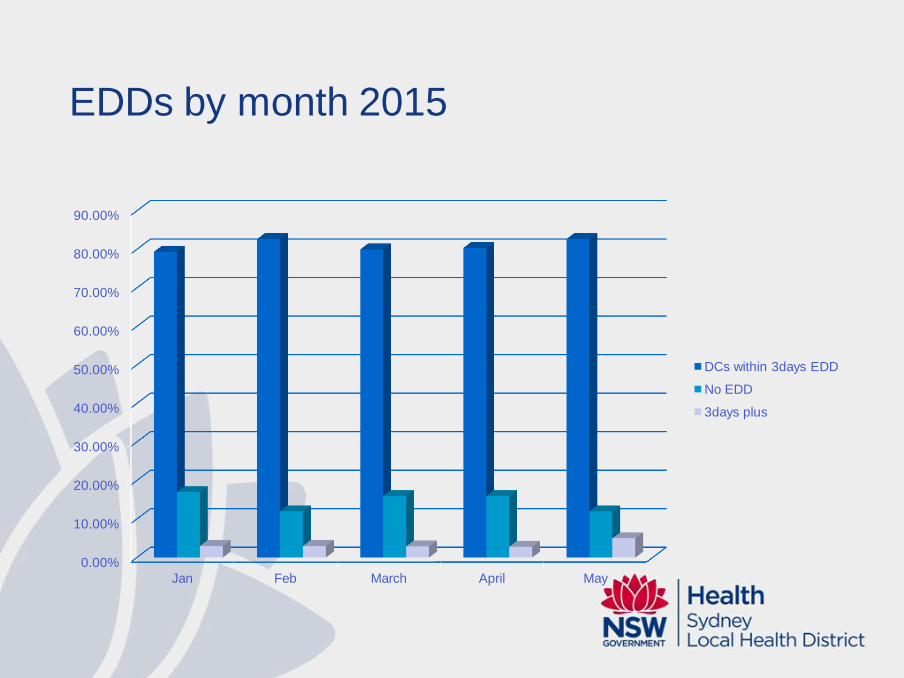
EDDs by month 2015
0.00%
10.00%
20.00%
30.00%
40.00%
50.00%
60.00%
70.00%
80.00%
90.00%
Jan Feb March April May
DCs within 3days EDD
No EDD
3days plus

Patient Flow Portal (1)
Wait for What – Definitions & Timeframes
Consults – Next working day. Except Social Work – 2
working days
Diagnostics / Treatment - AMO Review 2hours, Others
Next working day. Bone scan, MRI, Specific pathology – 2
working days
Discharge Process – Once confirmed – 24 hours. Except
Family Carer Conference – 3 working days

Patient Flow Portal (2)
Wait for What – Definitions & Timeframes
Out of Hospital Referrals – 12 hours for community
packages /nursing. 24 hour Homecare, 72 hours post
ACAT referral, Others - Next working day, TACP / TCU 2
working days, Family looking for RACF 10 working days
Transfer / Transport - 2 hours Inter-ward, 24 hours Inter-
facility accepted and waiting. Waiting for facility to accept -
Next working day. Ambulance NSW 4 hours. Others - Next
working day

0-4 Days
33%
20-49
Days 24%
5-9 Days
21%
15-19
Days 8%
10-14
Days 7%
50-99
Days 4%
Over 99
Days 3%
LOS
0
1
2
3
4
5
6
7
Waiting For What
Count
Avg No Pts
with LOS >24 Hrs &
Clinician Defined EDD
80%
Avg No Pts
with LOS >24 Hrs & No
Clinician Defined EDD
20%
Clinician Defined EDD Compliance - Week Commencing 04/06/15
(EG: 1. 2 wards closed due to norovirus)
1. High demand for single rooms due to MROs, RSV
and TB
2. High demand for Neurology beds (28 inpatients
causing access block on other wards)
3. ICU at full capacity consistently due to high acuity,
however eased now
4. Ongoing management of mental health Pts
Top 5 Patient
Access Issues

Delays to the
Pts Journey
Patients not in their HOME wards (Outlier pts) can lead to
flow obstruction. e.g No discussion between medical and
NUM re: DC plan
Follow up medical team and provide feedback - RE:
Discharge plan
Liaise with the patient and their nominated carer as
required – Community Nursing
Escalate to Senior Nurse Manager for Demand
Management Unit who will escalate further if required
Policy – Delayed Discharges...

Hospital / Patient / Community
Connection
Electronic tools/forms: all require medical signature then
print, fax.
o Medications – complete online then print
o Authority for clinical procedures
o Fax system for Other LHDs (email require encryption
code system to protect patient information – Privacy
Policy)
o Discharge Planning Manual online and updated twice
annually

2015
0
200
400
600
800
1000
1200
1400
1600
1800
Jan Feb March April May
Admissions and Discharges Jan 12th to May 31st 2015
Total - 95% DCs
DCs
Admission

Submitted by Medical Teams 2012 to 2015
0
100
200
300
400
500
600
700
800
900
2012 2013 2014 2015
886
641
829
275
Recommendation for Admission (RFAs) LOS/EDDs 2012 to March 2015
96% compliance
RFAs
Non compliant

Question Time