everyone’s here
TRANSCRIPT

2021 HALF YEAR RESULTS
Six months to 30 June 2021
24 August 2021 EVERYONE’S HERE.

2
AGENDA
Results Summary 3
Market Dynamics 4
Divisional Performance and Strategy 8
2021 Half Year Financial Results 22
Capital Management 27
Outlook 29
Q&A 30
Supplementary Information 31
3
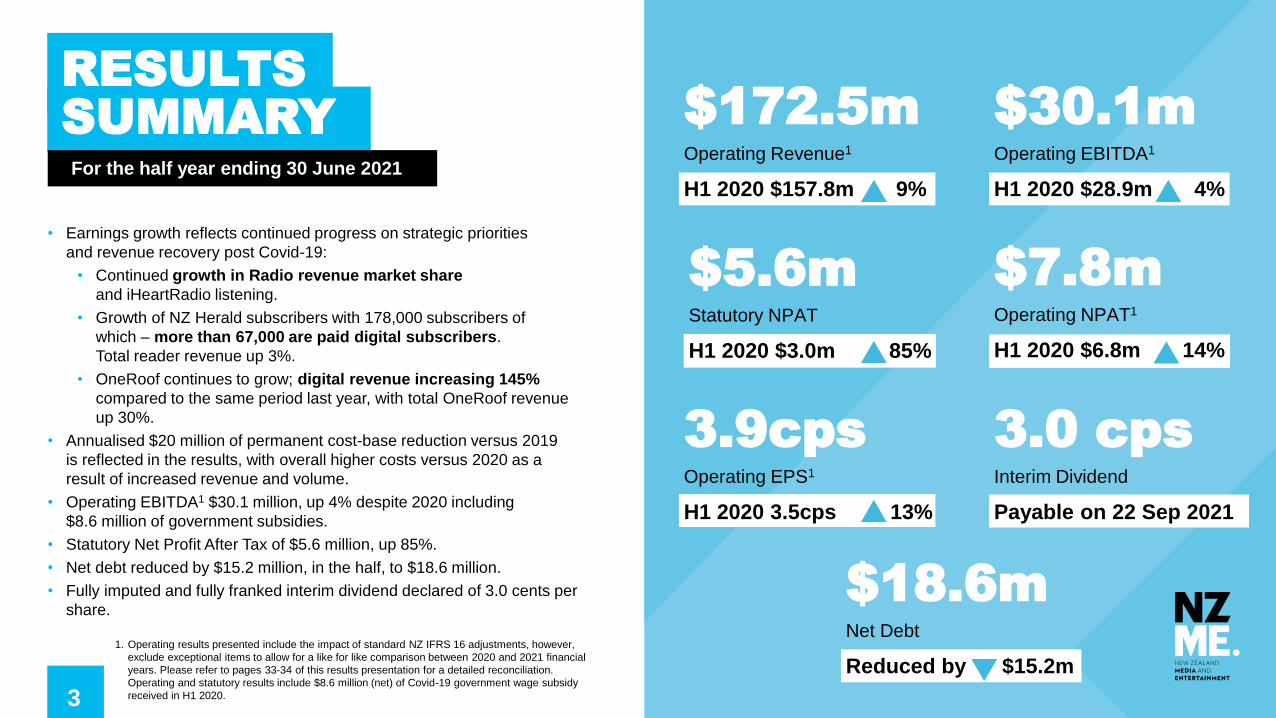
3.0 cpsInterim Dividend
Payable on 22 Sep 2021
$172.5mOperating Revenue1
H1 2020 $157.8m 9%
1. Operating results presented include the impact of standard NZ IFRS 16 adjustments, however,
exclude exceptional items to allow for a like for like comparison between 2020 and 2021 financial
years. Please refer to pages 33-34 of this results presentation for a detailed reconciliation.
Operating and statutory results include $8.6 million (net) of Covid-19 government wage subsidy
received in H1 2020.
• Earnings growth reflects continued progress on strategic priorities
and revenue recovery post Covid-19:
• Continued growth in Radio revenue market share
and iHeartRadio listening.
• Growth of NZ Herald subscribers with 178,000 subscribers of
which – more than 67,000 are paid digital subscribers.
Total reader revenue up 3%.
• OneRoof continues to grow; digital revenue increasing 145%
compared to the same period last year, with total OneRoof revenue
up 30%.
• Annualised $20 million of permanent cost-base reduction versus 2019
is reflected in the results, with overall higher costs versus 2020 as a
result of increased revenue and volume.
• Operating EBITDA1 $30.1 million, up 4% despite 2020 including
$8.6 million of government subsidies.
• Statutory Net Profit After Tax of $5.6 million, up 85%.
• Net debt reduced by $15.2 million, in the half, to $18.6 million.
• Fully imputed and fully franked interim dividend declared of 3.0 cents per
share.
RESULTS SUMMARYFor the half year ending 30 June 2021
$30.1mOperating EBITDA1
H1 2020 $28.9m 4%
$7.8mOperating NPAT1
H1 2020 $6.8m 14%
$5.6mStatutory NPAT
H1 2020 $3.0m 85%
3.9cpsOperating EPS1
H1 2020 3.5cps 13%
$18.6mNet Debt
Reduced by $15.2m

4
MARKETDYNAMICS
5
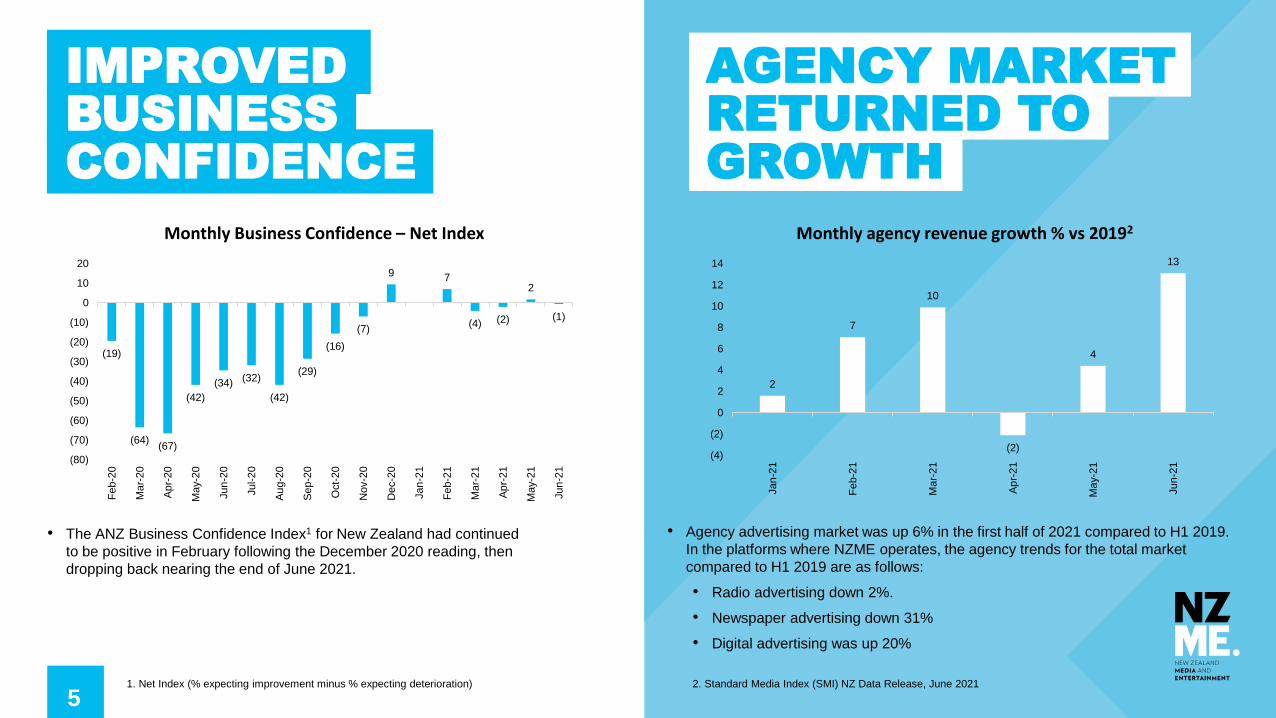
• Agency advertising market was up 6% in the first half of 2021 compared to H1 2019.
In the platforms where NZME operates, the agency trends for the total market
compared to H1 2019 are as follows:
• Radio advertising down 2%.
• Newspaper advertising down 31%
• Digital advertising was up 20%
2. Standard Media Index (SMI) NZ Data Release, June 2021
AGENCY MARKET RETURNED TO GROWTH
2
7
10
(2)
4
13
(4)
(2)
0
2
4
6
8
10
12
14
Jan
-21
Fe
b-2
1
Ma
r-21
Ap
r-21
Ma
y-2
1
Jun
-21
Monthly agency revenue growth % vs 20192
• The ANZ Business Confidence Index1 for New Zealand had continued
to be positive in February following the December 2020 reading, then
dropping back nearing the end of June 2021.
1. Net Index (% expecting improvement minus % expecting deterioration)
(19)
(64)(67)
(42)
(34)(32)
(42)
(29)
(16)
(7)
9 7
(4) (2)
2
(1)
(80)
(70)
(60)
(50)
(40)
(30)
(20)
(10)
0
10
20
Fe
b-2
0
Ma
r-20
Ap
r-20
Ma
y-2
0
Jun
-20
Jul-2
0
Au
g-2
0
Se
p-2
0
Oct-
20
Nov-2
0
Dec-2
0
Jan
-21
Fe
b-2
1
Ma
r-21
Ap
r-21
Ma
y-2
1
Jun
-21
Monthly Business Confidence – Net Index
IMPROVED BUSINESS CONFIDENCE
6
-
5.0
10.0
15.0
20.0
25.0
Jan Feb Mar Apr May Jun
2019 2020 2021
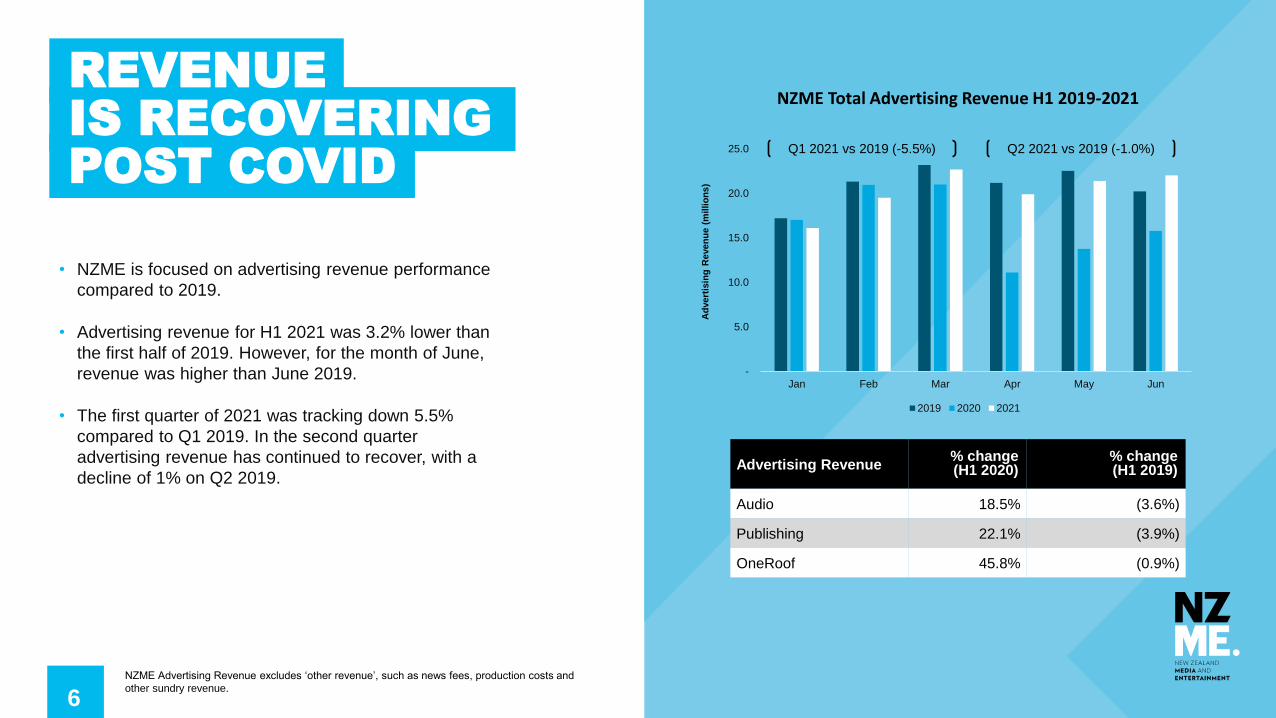
• NZME is focused on advertising revenue performance
compared to 2019.
• Advertising revenue for H1 2021 was 3.2% lower than
the first half of 2019. However, for the month of June,
revenue was higher than June 2019.
• The first quarter of 2021 was tracking down 5.5%
compared to Q1 2019. In the second quarter
advertising revenue has continued to recover, with a
decline of 1% on Q2 2019.
REVENUE IS RECOVERING POST COVID
NZME Advertising Revenue excludes ‘other revenue’, such as news fees, production costs and
other sundry revenue.
Ad
vert
isin
g R
even
ue (
millio
ns
)
NZME Total Advertising Revenue H1 2019-2021
Advertising Revenue% change (H1 2020)
% change (H1 2019)
Audio 18.5% (3.6%)
Publishing 22.1% (3.9%)
OneRoof 45.8% (0.9%)
Q1 2021 vs 2019 (-5.5%) Q2 2021 vs 2019 (-1.0%)
7
NZME CONTINUES TO OUTPERFORM THE MARKET
1. Nielsen CMI Fused Q2 20 – Q1 21, People 15+.
2. PwC NPA quarterly performance comparison report, 6 months to June 2021 compared to 2020, rolling 4-quarter average for market share.
3. PwC Radio advertising market benchmark report, 6 months to June 2021 compared to 2020, rolling 12-month average for market share. Note: report excludes independent broadcasters and contra revenue.
4. IAB NZ Digital advertising revenue report – Total Display, Q1 2021 compared to Q1 2020, rolling 4-quarter average for market share up till Q1 2021. Q2 report not available yet. Note: excludes digital audio
5. This includes publishing and OneRoof print advertising revenue
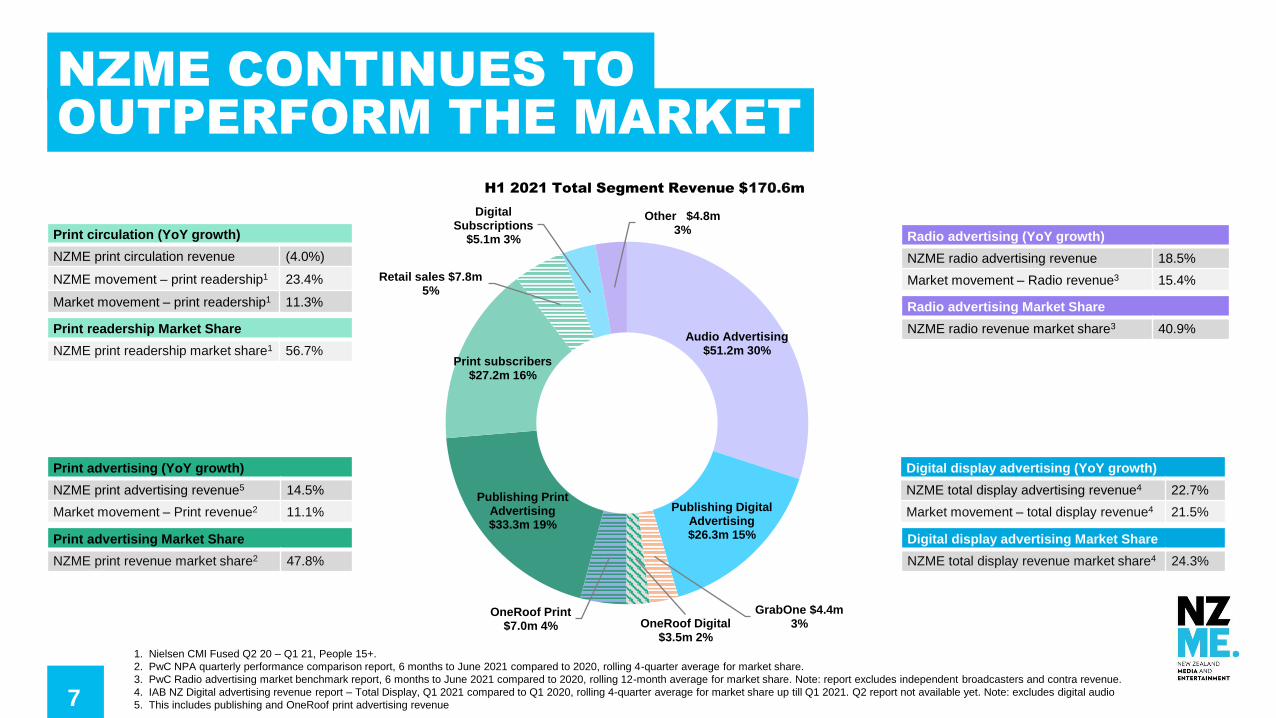
H1 2021 Total Segment Revenue $170.6m
Audio Advertising$51.2m 30%
Publishing Digital Advertising$26.3m 15%
GrabOne $4.4m 3%OneRoof Digital
$3.5m 2%
OneRoof Print$7.0m 4%
Publishing Print Advertising$33.3m 19%
Print subscribers$27.2m 16%
Retail sales $7.8m 5%
Digital Subscriptions
$5.1m 3%
Other $4.8m 3%
Print advertising (YoY growth)
NZME print advertising revenue5 14.5%
Market movement – Print revenue2 11.1%
Print circulation (YoY growth)
NZME print circulation revenue (4.0%)
NZME movement – print readership1 23.4%
Market movement – print readership1 11.3%
Print readership Market Share
NZME print readership market share1 56.7%
Print advertising Market Share
NZME print revenue market share2 47.8%
Radio advertising (YoY growth)
NZME radio advertising revenue 18.5%
Market movement – Radio revenue3 15.4%
Digital display advertising (YoY growth)
NZME total display advertising revenue4 22.7%
Market movement – total display revenue4 21.5%
Digital display advertising Market Share
NZME total display revenue market share4 24.3%
Radio advertising Market Share
NZME radio revenue market share3 40.9%

8
DIVISIONALPERFORMANCE
9
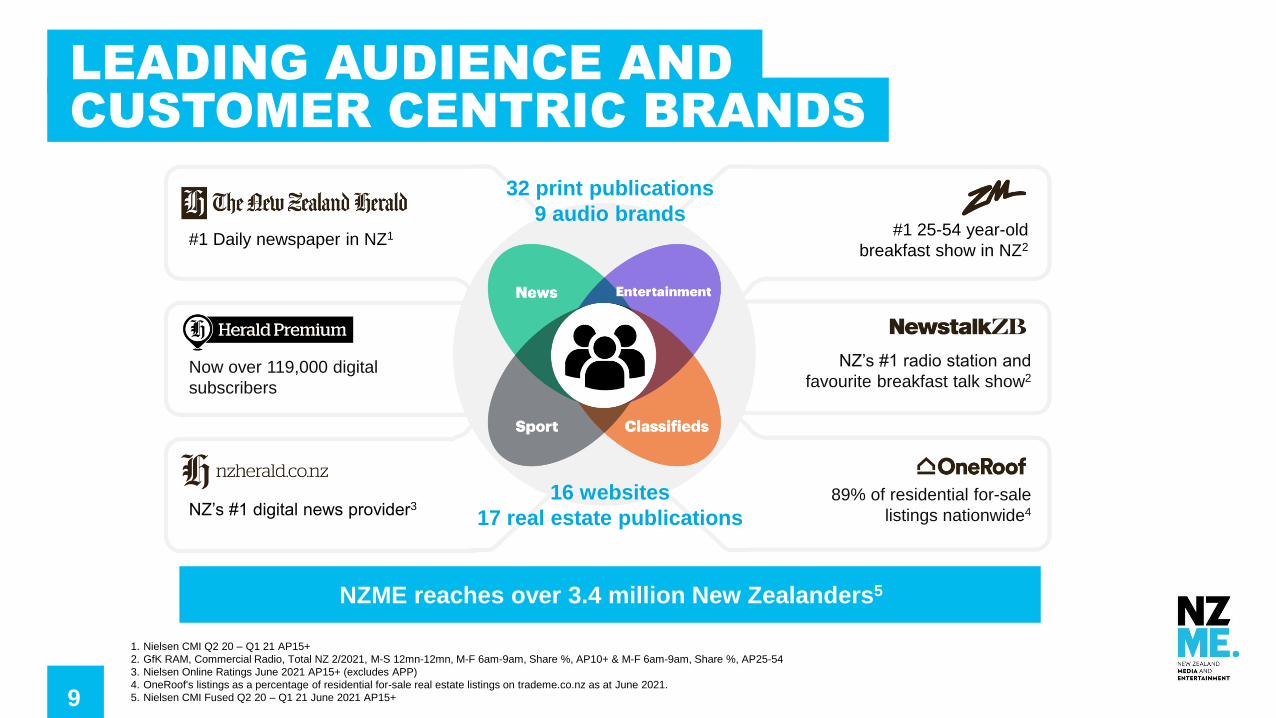
89% of residential for-sale
listings nationwide4
#1 25-54 year-old
breakfast show in NZ2#1 Daily newspaper in NZ1
NZ’s #1 radio station and
favourite breakfast talk show2
NZ’s #1 digital news provider3
Now over 119,000 digital
subscribers
1. Nielsen CMI Q2 20 – Q1 21 AP15+
2. GfK RAM, Commercial Radio, Total NZ 2/2021, M-S 12mn-12mn, M-F 6am-9am, Share %, AP10+ & M-F 6am-9am, Share %, AP25-54
3. Nielsen Online Ratings June 2021 AP15+ (excludes APP)
4. OneRoof's listings as a percentage of residential for-sale real estate listings on trademe.co.nz as at June 2021.
5. Nielsen CMI Fused Q2 20 – Q1 21 June 2021 AP15+
LEADING AUDIENCE AND CUSTOMER CENTRIC BRANDS
32 print publications
9 audio brands
16 websites
17 real estate publications
NZME reaches over 3.4 million New Zealanders5
10
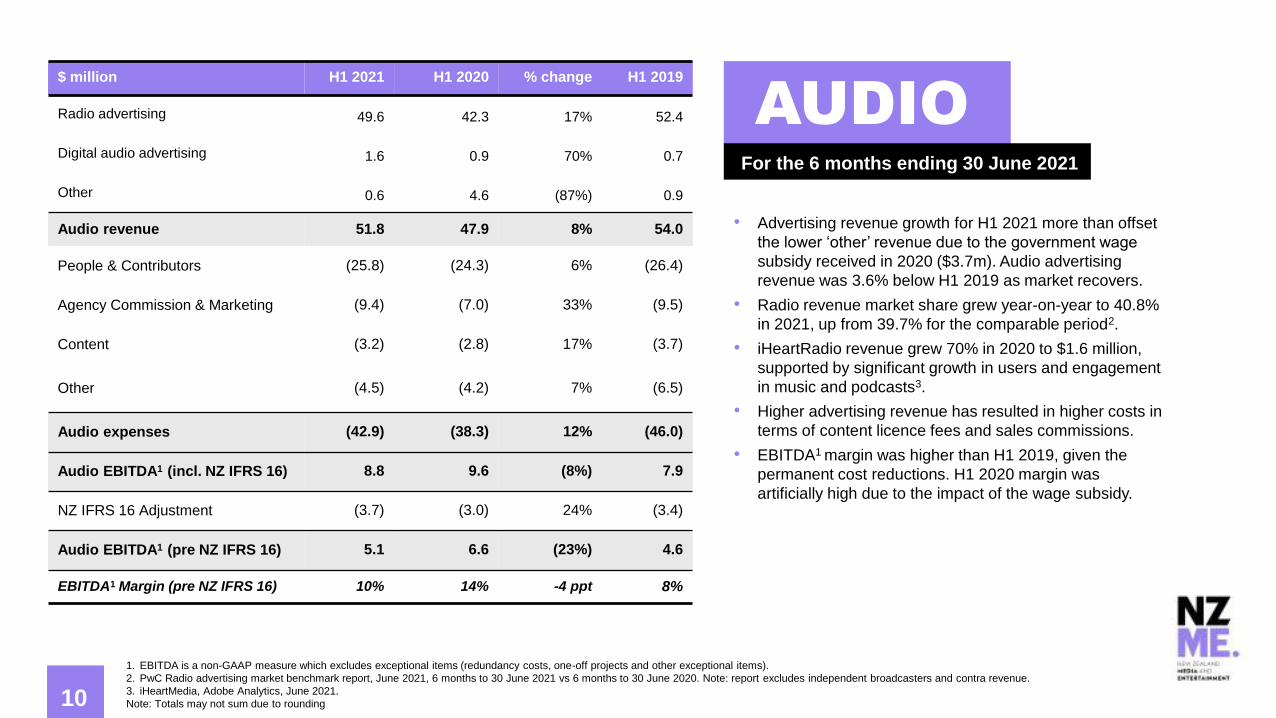
$ million H1 2021 H1 2020 % change H1 2019
Radio advertising 49.6 42.3 17% 52.4
Digital audio advertising 1.6 0.9 70% 0.7
Other 0.6 4.6 (87%) 0.9
Audio revenue 51.8 47.9 8% 54.0
People & Contributors (25.8) (24.3) 6% (26.4)
Agency Commission & Marketing (9.4) (7.0) 33% (9.5)
Content (3.2) (2.8) 17% (3.7)
Other (4.5) (4.2) 7% (6.5)
Audio expenses (42.9) (38.3) 12% (46.0)
Audio EBITDA1 (incl. NZ IFRS 16) 8.8 9.6 (8%) 7.9
NZ IFRS 16 Adjustment (3.7) (3.0) 24% (3.4)
Audio EBITDA1 (pre NZ IFRS 16) 5.1 6.6 (23%) 4.6
EBITDA1 Margin (pre NZ IFRS 16) 10% 14% -4 ppt 8%
1. EBITDA is a non-GAAP measure which excludes exceptional items (redundancy costs, one-off projects and other exceptional items).
2. PwC Radio advertising market benchmark report, June 2021, 6 months to 30 June 2021 vs 6 months to 30 June 2020. Note: report excludes independent broadcasters and contra revenue.
3. iHeartMedia, Adobe Analytics, June 2021.
Note: Totals may not sum due to rounding
• Advertising revenue growth for H1 2021 more than offset
the lower ‘other’ revenue due to the government wage
subsidy received in 2020 ($3.7m). Audio advertising
revenue was 3.6% below H1 2019 as market recovers.
• Radio revenue market share grew year-on-year to 40.8%
in 2021, up from 39.7% for the comparable period2.
• iHeartRadio revenue grew 70% in 2020 to $1.6 million,
supported by significant growth in users and engagement
in music and podcasts3.
• Higher advertising revenue has resulted in higher costs in
terms of content licence fees and sales commissions.
• EBITDA1 margin was higher than H1 2019, given the
permanent cost reductions. H1 2020 margin was
artificially high due to the impact of the wage subsidy.
AUDIOFor the 6 months ending 30 June 2021
10
11
Ma
rke
t S
ha
re (
%)
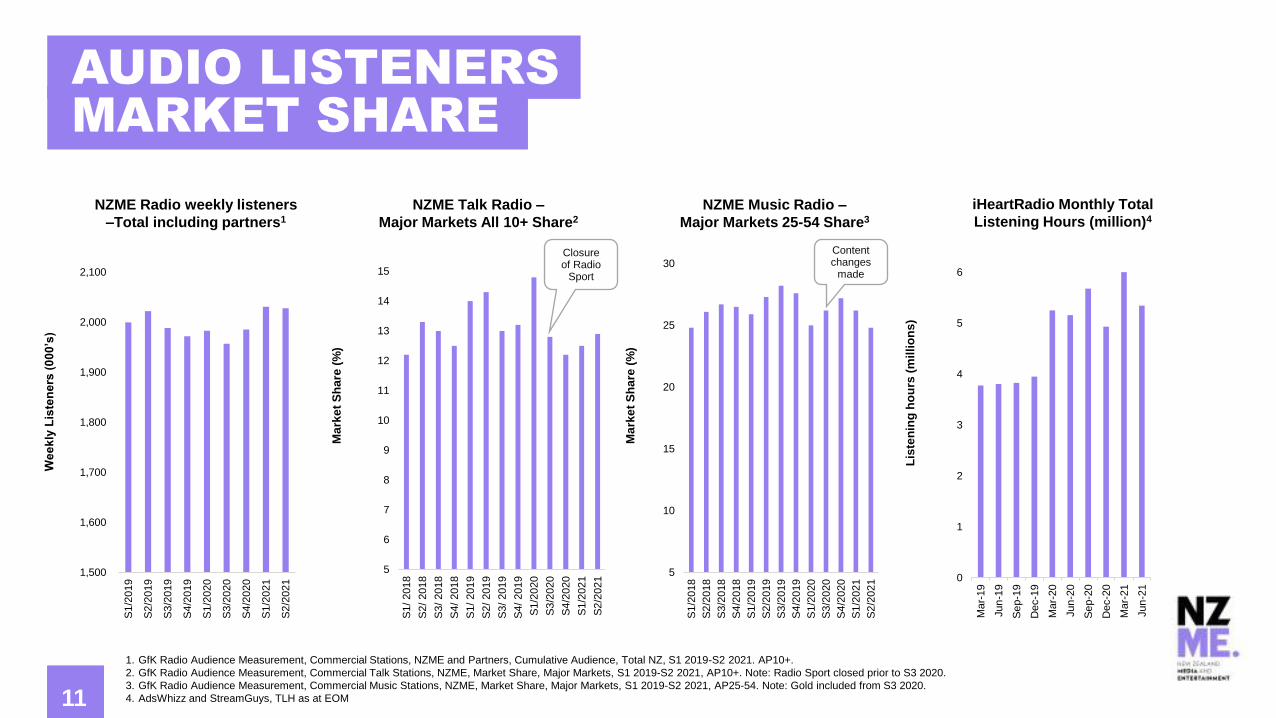
1. GfK Radio Audience Measurement, Commercial Stations, NZME and Partners, Cumulative Audience, Total NZ, S1 2019-S2 2021. AP10+.
2. GfK Radio Audience Measurement, Commercial Talk Stations, NZME, Market Share, Major Markets, S1 2019-S2 2021, AP10+. Note: Radio Sport closed prior to S3 2020.
3. GfK Radio Audience Measurement, Commercial Music Stations, NZME, Market Share, Major Markets, S1 2019-S2 2021, AP25-54. Note: Gold included from S3 2020.
4. AdsWhizz and StreamGuys, TLH as at EOM
We
ek
ly L
iste
ne
rs (
00
0’s
)
NZME Radio weekly listeners
–Total including partners1
Ma
rke
t S
ha
re (
%)
NZME Talk Radio –
Major Markets All 10+ Share2
NZME Music Radio –
Major Markets 25-54 Share3
iHeartRadio Monthly Total
Listening Hours (million)4
Lis
ten
ing
ho
urs
(m
illi
on
s)
AUDIO LISTENERS MARKET SHARE
11
5
10
15
20
25
30
S1
/2018
S2
/2018
S3
/2018
S4
/2018
S1
/2019
S2
/2019
S3
/2019
S4
/2019
S1
/2020
S3
/2020
S4
/2020
S1
/2021
S2
/2021
5
6
7
8
9
10
11
12
13
14
15
S1
/ 2018
S2
/ 2018
S3
/ 2018
S4
/ 2018
S1
/ 2019
S2
/ 2019
S3
/ 2019
S4
/ 2019
S1
/2020
S3
/2020
S4
/2020
S1
/2021
S2
/2021
1,500
1,600
1,700
1,800
1,900
2,000
2,100
S1
/2019
S2
/2019
S3
/2019
S4
/2019
S1
/2020
S3
/2020
S4
/2020
S1
/2021
S2
/2021 0
1
2
3
4
5
6
Ma
r-19
Jun
-19
Se
p-1
9
Dec-1
9
Ma
r-20
Jun
-20
Se
p-2
0
Dec-2
0
Ma
r-21
Jun
-21
Closure of Radio
Sport
Content changes
made
12
1. GfK Radio Audience Measurement, Commercial Stations, NZME excl. Partners, Market Share %, S4 2020 – S2 2021, AP10+. 1* Cumulative Audience (000s), S2 2021 compared to S1 2021, AP25-54
2. PwC Radio advertising market benchmark report, Dec 2020, 12 months to 31 Dec 2020, 2* June 2021 Rolling 12-month average. Note: report excludes independent broadcasters and contra revenue.
3. EBITDA is a non-GAAP measure and is presented as excluding the impact of NZ IFRS 16, however excluding exceptional items (redundancy costs, one-off projects and other exceptional items).
4. Adswizz AudioMetrix incl Tableau TLH Jan-Jun 2021, Spreaker Jan-Jun 2021
NEW ZEALAND’S LEADING AUDIO COMPANY
12
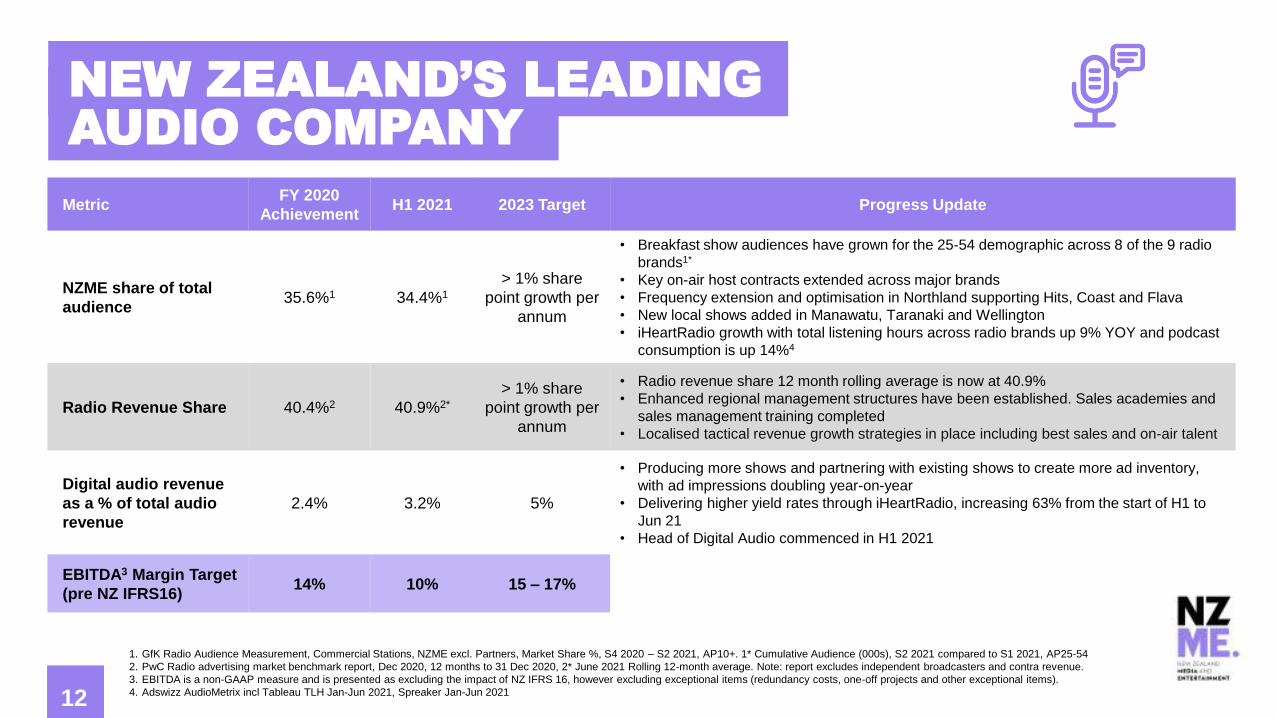
MetricFY 2020
AchievementH1 2021 2023 Target Progress Update
NZME share of total
audience35.6%1 34.4%1
> 1% share
point growth per
annum
• Breakfast show audiences have grown for the 25-54 demographic across 8 of the 9 radio
brands1*
• Key on-air host contracts extended across major brands
• Frequency extension and optimisation in Northland supporting Hits, Coast and Flava
• New local shows added in Manawatu, Taranaki and Wellington
• iHeartRadio growth with total listening hours across radio brands up 9% YOY and podcast
consumption is up 14%4
Radio Revenue Share 40.4%2 40.9%2*
> 1% share
point growth per
annum
• Radio revenue share 12 month rolling average is now at 40.9%
• Enhanced regional management structures have been established. Sales academies and
sales management training completed
• Localised tactical revenue growth strategies in place including best sales and on-air talent
Digital audio revenue
as a % of total audio
revenue
2.4% 3.2% 5%
• Producing more shows and partnering with existing shows to create more ad inventory,
with ad impressions doubling year-on-year
• Delivering higher yield rates through iHeartRadio, increasing 63% from the start of H1 to
Jun 21
• Head of Digital Audio commenced in H1 2021
EBITDA3 Margin Target
(pre NZ IFRS16)14% 10% 15 – 17%
13
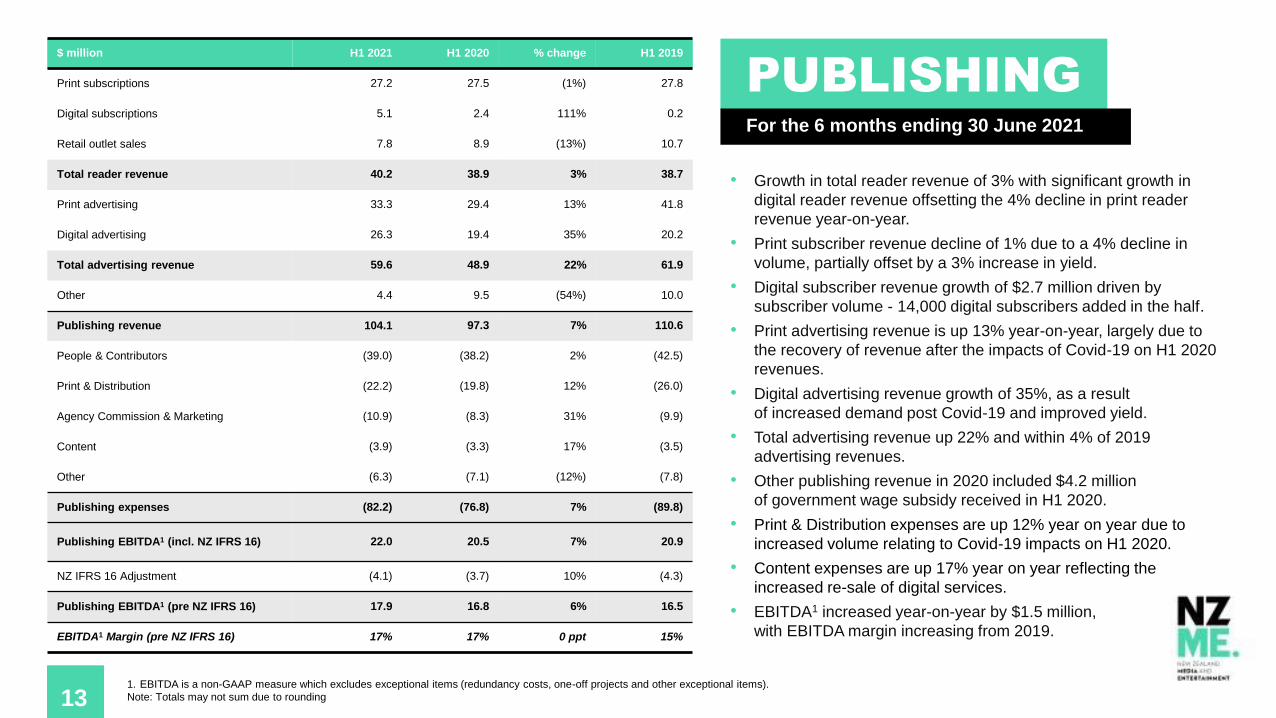
$ million H1 2021 H1 2020 % change H1 2019
Print subscriptions 27.2 27.5 (1%) 27.8
Digital subscriptions 5.1 2.4 111% 0.2
Retail outlet sales 7.8 8.9 (13%) 10.7
Total reader revenue 40.2 38.9 3% 38.7
Print advertising 33.3 29.4 13% 41.8
Digital advertising 26.3 19.4 35% 20.2
Total advertising revenue 59.6 48.9 22% 61.9
Other 4.4 9.5 (54%) 10.0
Publishing revenue 104.1 97.3 7% 110.6
People & Contributors (39.0) (38.2) 2% (42.5)
Print & Distribution (22.2) (19.8) 12% (26.0)
Agency Commission & Marketing (10.9) (8.3) 31% (9.9)
Content (3.9) (3.3) 17% (3.5)
Other (6.3) (7.1) (12%) (7.8)
Publishing expenses (82.2) (76.8) 7% (89.8)
Publishing EBITDA1 (incl. NZ IFRS 16) 22.0 20.5 7% 20.9
NZ IFRS 16 Adjustment (4.1) (3.7) 10% (4.3)
Publishing EBITDA1 (pre NZ IFRS 16) 17.9 16.8 6% 16.5
EBITDA1 Margin (pre NZ IFRS 16) 17% 17% 0 ppt 15%
• Growth in total reader revenue of 3% with significant growth in
digital reader revenue offsetting the 4% decline in print reader
revenue year-on-year.
• Print subscriber revenue decline of 1% due to a 4% decline in
volume, partially offset by a 3% increase in yield.
• Digital subscriber revenue growth of $2.7 million driven by
subscriber volume - 14,000 digital subscribers added in the half.
• Print advertising revenue is up 13% year-on-year, largely due to
the recovery of revenue after the impacts of Covid-19 on H1 2020
revenues.
• Digital advertising revenue growth of 35%, as a result
of increased demand post Covid-19 and improved yield.
• Total advertising revenue up 22% and within 4% of 2019
advertising revenues.
• Other publishing revenue in 2020 included $4.2 million
of government wage subsidy received in H1 2020.
• Print & Distribution expenses are up 12% year on year due to
increased volume relating to Covid-19 impacts on H1 2020.
• Content expenses are up 17% year on year reflecting the
increased re-sale of digital services.
• EBITDA1 increased year-on-year by $1.5 million,
with EBITDA margin increasing from 2019.
PUBLISHINGFor the 6 months ending 30 June 2021
131. EBITDA is a non-GAAP measure which excludes exceptional items (redundancy costs, one-off projects and other exceptional items).
Note: Totals may not sum due to rounding
14
Bra
nd
Au
die
nc
e (
00
0’s
)
1. Nielsen CMI Q2 17 – Q1 21, AP 15+, average issue readership trend.
2. Nielsen CMI Q1 20 – Q1 21, June 2021, AP 15+.
Rea
de
rsh
ip (
00
0’s
)
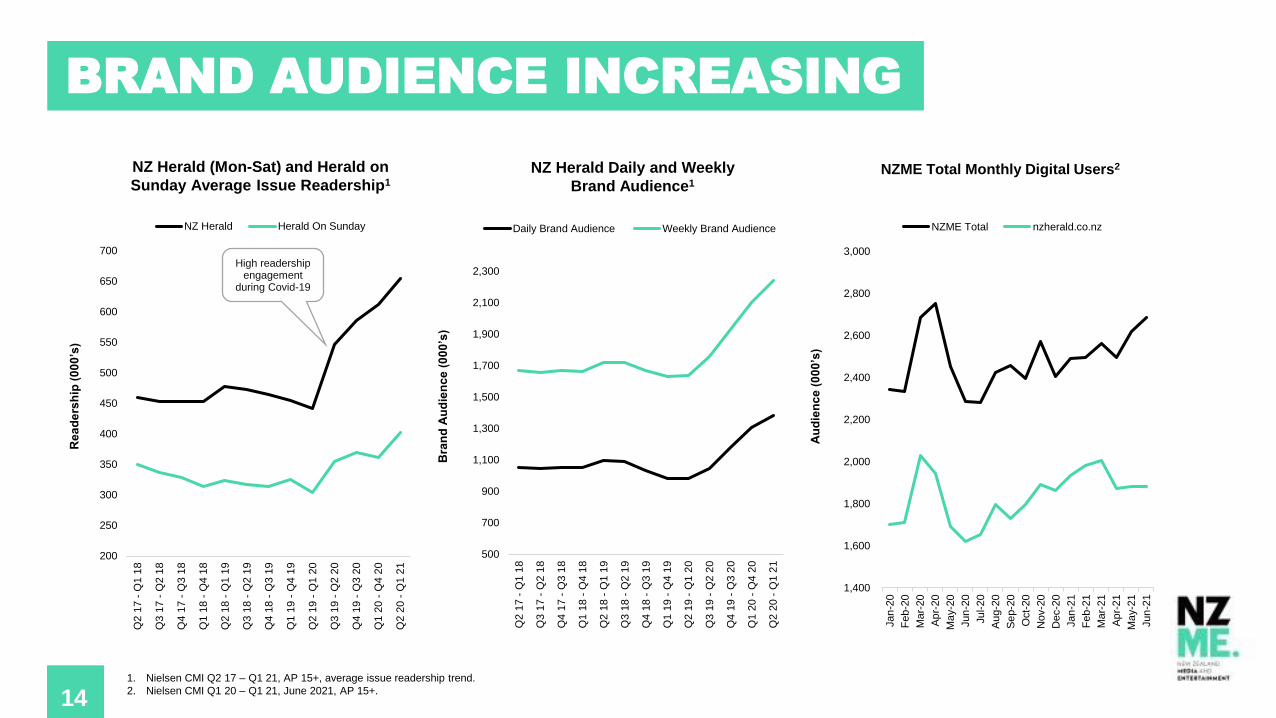
NZ Herald (Mon-Sat) and Herald on
Sunday Average Issue Readership1
NZ Herald Daily and Weekly
Brand Audience1
14
BRAND AUDIENCE INCREASING
Au
die
nc
e (
00
0’s
)
200
250
300
350
400
450
500
550
600
650
700
Q2 1
7 -
Q1 1
8
Q3 1
7 -
Q2 1
8
Q4 1
7 -
Q3 1
8
Q1 1
8 -
Q4 1
8
Q2 1
8 -
Q1 1
9
Q3 1
8 -
Q2 1
9
Q4 1
8 -
Q3 1
9
Q1 1
9 -
Q4 1
9
Q2 1
9 -
Q1 2
0
Q3 1
9 -
Q2 2
0
Q4 1
9 -
Q3 2
0
Q1 2
0 -
Q4 2
0
Q2 2
0 -
Q1 2
1
NZ Herald Herald On Sunday
500
700
900
1,100
1,300
1,500
1,700
1,900
2,100
2,300
Q2 1
7 -
Q1 1
8
Q3 1
7 -
Q2 1
8
Q4 1
7 -
Q3 1
8
Q1 1
8 -
Q4 1
8
Q2 1
8 -
Q1 1
9
Q3 1
8 -
Q2 1
9
Q4 1
8 -
Q3 1
9
Q1 1
9 -
Q4 1
9
Q2 1
9 -
Q1 2
0
Q3 1
9 -
Q2 2
0
Q4 1
9 -
Q3 2
0
Q1 2
0 -
Q4 2
0
Q2 2
0 -
Q1 2
1
Daily Brand Audience Weekly Brand Audience
NZME Total Monthly Digital Users2
High readership engagement
during Covid-19
1,400
1,600
1,800
2,000
2,200
2,400
2,600
2,800
3,000
Jan
-20
Fe
b-2
0
Ma
r-20
Ap
r-20
Ma
y-2
0
Jun
-20
Jul-2
0
Au
g-2
0
Se
p-2
0
Oct-
20
Nov-2
0
Dec-2
0
Jan
-21
Fe
b-2
1
Ma
r-21
Ap
r-21
Ma
y-2
1
Jun
-21
NZME Total nzherald.co.nz
15
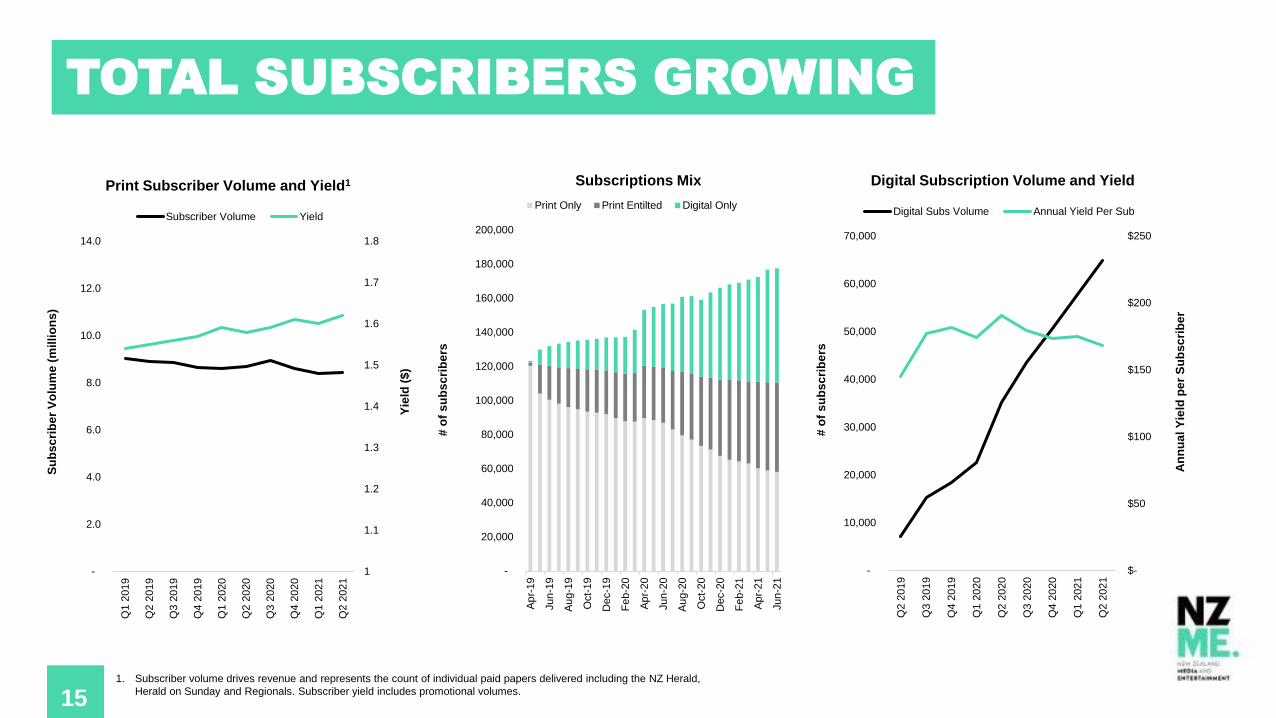
Subscriptions Mix
# o
f s
ub
sc
rib
ers
15
TOTAL SUBSCRIBERS GROWING
1. Subscriber volume drives revenue and represents the count of individual paid papers delivered including the NZ Herald,
Herald on Sunday and Regionals. Subscriber yield includes promotional volumes.
Print Subscriber Volume and Yield1
Yie
ld (
$)
Su
bs
cri
be
r V
olu
me
(m
illi
on
s)
-
20,000
40,000
60,000
80,000
100,000
120,000
140,000
160,000
180,000
200,000
Ap
r-19
Jun
-19
Au
g-1
9
Oct-
19
Dec-1
9
Fe
b-2
0
Ap
r-20
Jun
-20
Au
g-2
0
Oct-
20
Dec-2
0
Fe
b-2
1
Ap
r-21
Jun
-21
Print Only Print Entilted Digital Only
# o
f s
ub
sc
rib
ers
An
nu
al
Yie
ld p
er
Su
bs
cri
be
r
Digital Subscription Volume and Yield
1
1.1
1.2
1.3
1.4
1.5
1.6
1.7
1.8
-
2.0
4.0
6.0
8.0
10.0
12.0
14.0
Q1 2
019
Q2 2
019
Q3 2
019
Q4 2
019
Q1 2
020
Q2 2
020
Q3 2
020
Q4 2
020
Q1 2
021
Q2 2
021
Subscriber Volume Yield
$-
$50
$100
$150
$200
$250
-
10,000
20,000
30,000
40,000
50,000
60,000
70,000
Q2 2
019
Q3 2
019
Q4 2
019
Q1 2
020
Q2 2
020
Q3 2
020
Q4 2
020
Q1 2
021
Q2 2
021
Digital Subs Volume Annual Yield Per Sub
16
1. Stats.govt.nz Dwelling and household estimates: June 2021 quarter
2. EBITDA is a non-GAAP measure and is presented as excluding the impact of NZ IFRS 16, however excluding exceptional items (redundancy costs, one-off projects and other exceptional items).
3. Nielsen Online Ratings Aug 2020 – Jun 202116
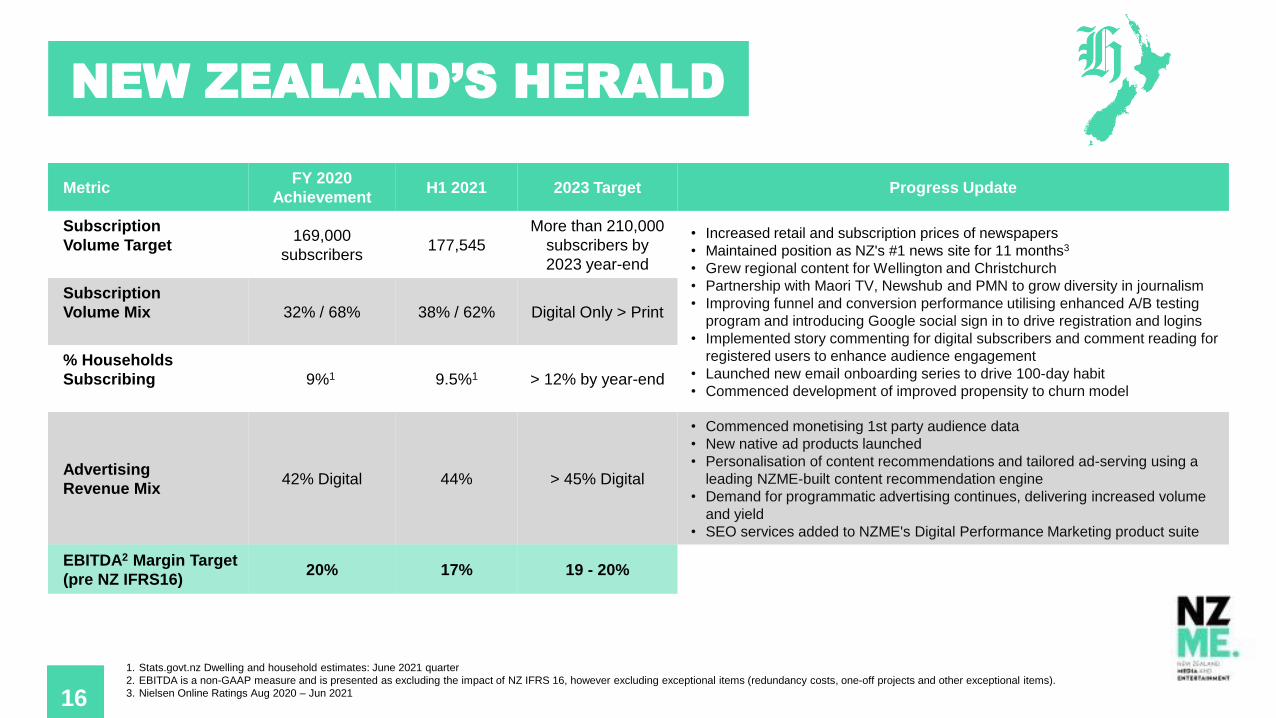
NEW ZEALAND’S HERALD
MetricFY 2020
AchievementH1 2021 2023 Target Progress Update
Subscription
Volume Target169,000
subscribers177,545
More than 210,000
subscribers by
2023 year-end
• Increased retail and subscription prices of newspapers
• Maintained position as NZ's #1 news site for 11 months3
• Grew regional content for Wellington and Christchurch
• Partnership with Maori TV, Newshub and PMN to grow diversity in journalism
• Improving funnel and conversion performance utilising enhanced A/B testing
program and introducing Google social sign in to drive registration and logins
• Implemented story commenting for digital subscribers and comment reading for
registered users to enhance audience engagement
• Launched new email onboarding series to drive 100-day habit
• Commenced development of improved propensity to churn model
Subscription
Volume Mix 32% / 68% 38% / 62% Digital Only > Print
% Households
Subscribing 9%1 9.5%1 > 12% by year-end
Advertising
Revenue Mix42% Digital 44% > 45% Digital
• Commenced monetising 1st party audience data
• New native ad products launched
• Personalisation of content recommendations and tailored ad-serving using a
leading NZME-built content recommendation engine
• Demand for programmatic advertising continues, delivering increased volume
and yield
• SEO services added to NZME's Digital Performance Marketing product suite
EBITDA2 Margin Target
(pre NZ IFRS16)20% 17% 19 - 20%
17
-32%
-7%
-26%
-100%
-41%
-11%-4%
11%
-14%-23%
1%
31%
-35%-35%-33%-29%
-1%-8%
Jan
-20
Fe
b-2
0
Ma
r-20
Ap
r-20
Ma
y-2
0
Jun
-20
Jul-2
0
Au
g-2
0
Se
p-2
0
Oct-
20
Nov-2
0
Dec-2
0
Jan
-21
Fe
b-2
1
Ma
r-21
Ap
r-21
Ma
y-2
1
Jun
-21
2020 vs 2019 2021 vs 2019
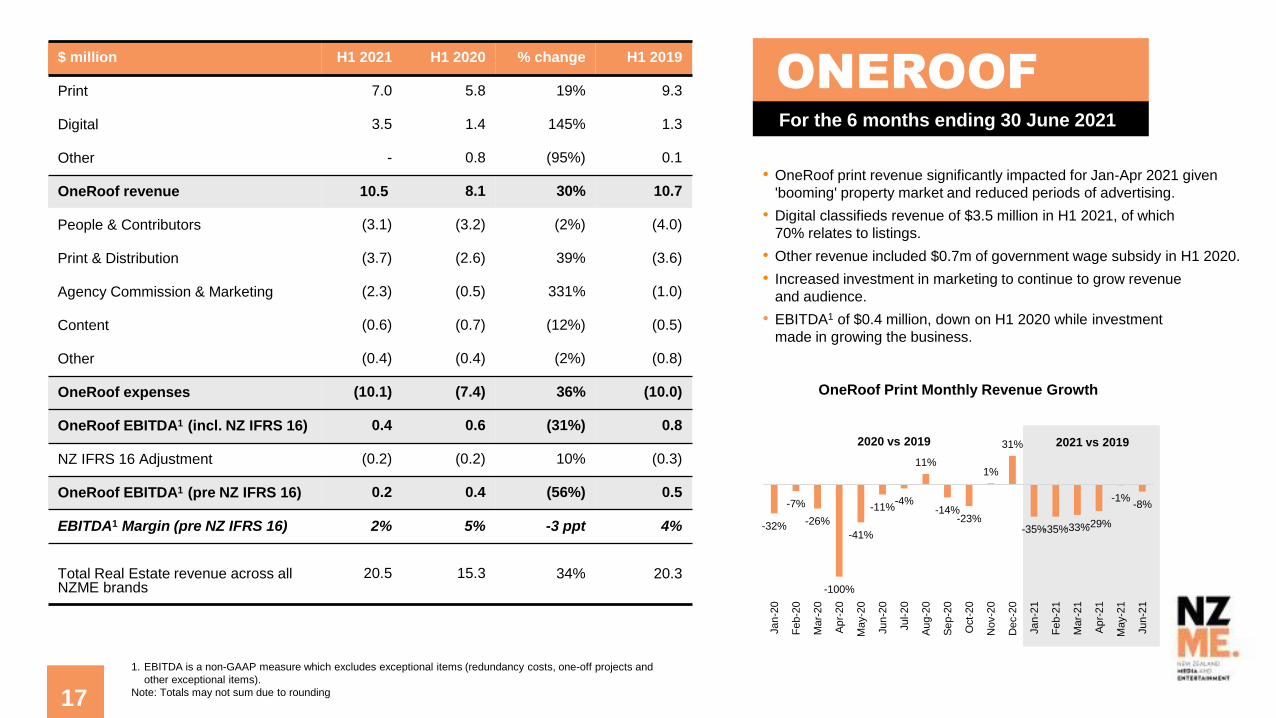
$ million H1 2021 H1 2020 % change H1 2019
Print 7.0 5.8 19% 9.3
Digital 3.5 1.4 145% 1.3
Other - 0.8 (95%) 0.1
OneRoof revenue 10.5 8.1 30% 10.7
People & Contributors (3.1) (3.2) (2%) (4.0)
Print & Distribution (3.7) (2.6) 39% (3.6)
Agency Commission & Marketing (2.3) (0.5) 331% (1.0)
Content (0.6) (0.7) (12%) (0.5)
Other (0.4) (0.4) (2%) (0.8)
OneRoof expenses (10.1) (7.4) 36% (10.0)
OneRoof EBITDA1 (incl. NZ IFRS 16) 0.4 0.6 (31%) 0.8
NZ IFRS 16 Adjustment (0.2) (0.2) 10% (0.3)
OneRoof EBITDA1 (pre NZ IFRS 16) 0.2 0.4 (56%) 0.5
EBITDA1 Margin (pre NZ IFRS 16) 2% 5% -3 ppt 4%
Total Real Estate revenue across all NZME brands
20.5 15.3 34% 20.3
• OneRoof print revenue significantly impacted for Jan-Apr 2021 given
'booming' property market and reduced periods of advertising.
• Digital classifieds revenue of $3.5 million in H1 2021, of which
70% relates to listings.
• Other revenue included $0.7m of government wage subsidy in H1 2020.
• Increased investment in marketing to continue to grow revenue
and audience.
• EBITDA1 of $0.4 million, down on H1 2020 while investment
made in growing the business.
ONEROOFFor the 6 months ending 30 June 2021
17
1. EBITDA is a non-GAAP measure which excludes exceptional items (redundancy costs, one-off projects and
other exceptional items).
Note: Totals may not sum due to rounding
OneRoof Print Monthly Revenue Growth
18
0%
20%
40%
60%
80%
100%
120%
Jan
-20
Fe
b-2
0
Ma
r-20
Ap
r-20
Ma
y-2
0
Jun
-20
Jul-2
0
Au
g-2
0
Se
p-2
0
Oct-
20
Nov-2
0
Dec-2
0
Jan
-21
Fe
b-2
1
Ma
r-21
Ap
r-21
Ma
y-2
1
Jun
-21
Auckland % National %
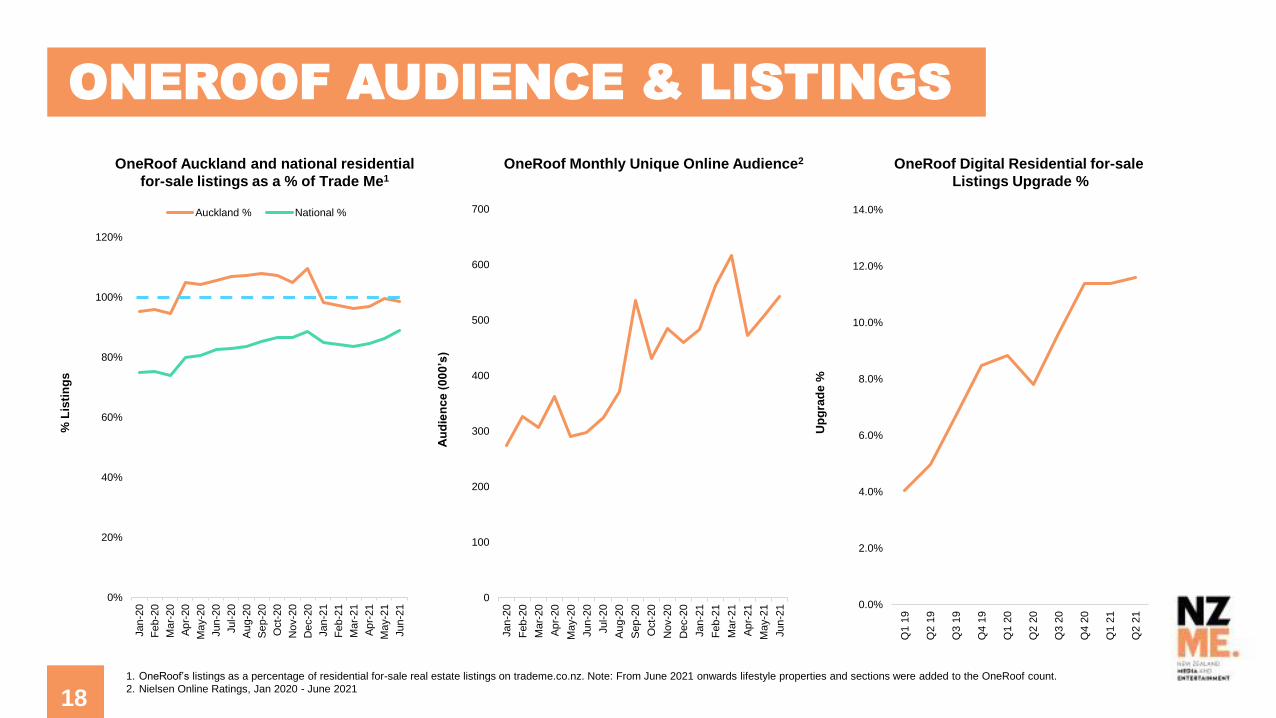
OneRoof Auckland and national residential
for-sale listings as a % of Trade Me1
1. OneRoof’s listings as a percentage of residential for-sale real estate listings on trademe.co.nz. Note: From June 2021 onwards lifestyle properties and sections were added to the OneRoof count.
2. Nielsen Online Ratings, Jan 2020 - June 2021
Au
die
nc
e (
00
0’s
)
ONEROOF AUDIENCE & LISTINGS
18
Up
gra
de
%
% L
isti
ng
s
OneRoof Digital Residential for-sale
Listings Upgrade %
OneRoof Monthly Unique Online Audience2
0
100
200
300
400
500
600
700
Jan
-20
Fe
b-2
0
Ma
r-20
Ap
r-20
Ma
y-2
0
Jun
-20
Jul-2
0
Au
g-2
0
Se
p-2
0
Oct-
20
Nov-2
0
Dec-2
0
Jan
-21
Fe
b-2
1
Ma
r-21
Ap
r-21
Ma
y-2
1
Jun
-21 0.0%
2.0%
4.0%
6.0%
8.0%
10.0%
12.0%
14.0%
Q1 1
9
Q2 1
9
Q3 1
9
Q4 1
9
Q1 2
0
Q2 2
0
Q3 2
0
Q4 2
0
Q1 2
1
Q2 2
1
19
1. OneRoof’s listings as a percentage of residential for-sale real estate listings on trademe.co.nz as of 30 June 2021.
2. Nielsen Online Ratings, Dec 2020 - June 2021 (FY 20 has been amended to be the gap as of Dec 2020)
3. EBITDA is a non-GAAP measure and is presented as excluding the impact of NZ IFRS 16, however excluding exceptional items (redundancy costs, one-off projects and other exceptional items).19
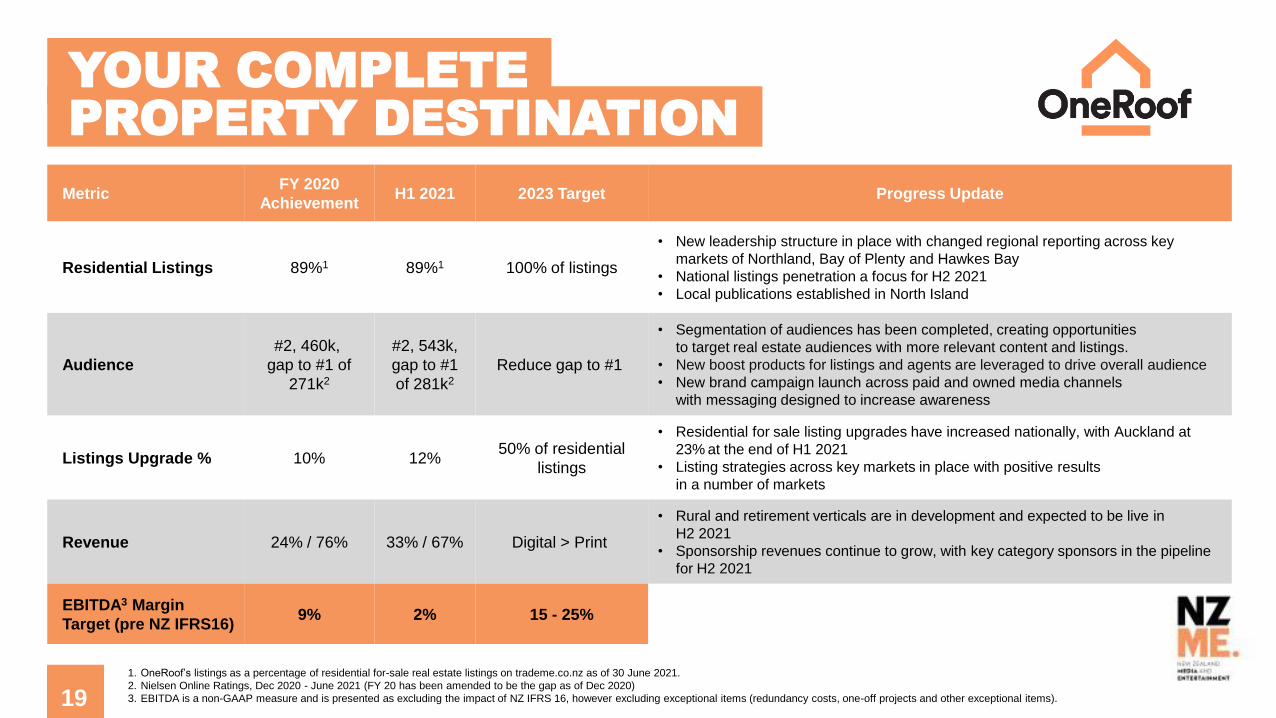
YOUR COMPLETE PROPERTY DESTINATION
MetricFY 2020
AchievementH1 2021 2023 Target Progress Update
Residential Listings 89%1 89%1 100% of listings
• New leadership structure in place with changed regional reporting across key
markets of Northland, Bay of Plenty and Hawkes Bay
• National listings penetration a focus for H2 2021
• Local publications established in North Island
Audience
#2, 460k,
gap to #1 of
271k2
#2, 543k,
gap to #1
of 281k2
Reduce gap to #1
• Segmentation of audiences has been completed, creating opportunities
to target real estate audiences with more relevant content and listings.
• New boost products for listings and agents are leveraged to drive overall audience
• New brand campaign launch across paid and owned media channels
with messaging designed to increase awareness
Listings Upgrade % 10% 12%50% of residential
listings
• Residential for sale listing upgrades have increased nationally, with Auckland at
23% at the end of H1 2021
• Listing strategies across key markets in place with positive results
in a number of markets
Revenue 24% / 76% 33% / 67% Digital > Print
• Rural and retirement verticals are in development and expected to be live in
H2 2021
• Sponsorship revenues continue to grow, with key category sponsors in the pipeline
for H2 2021
EBITDA3 Margin
Target (pre NZ IFRS16)9% 2% 15 - 25%
20
For the half year
ended 30 June 2020
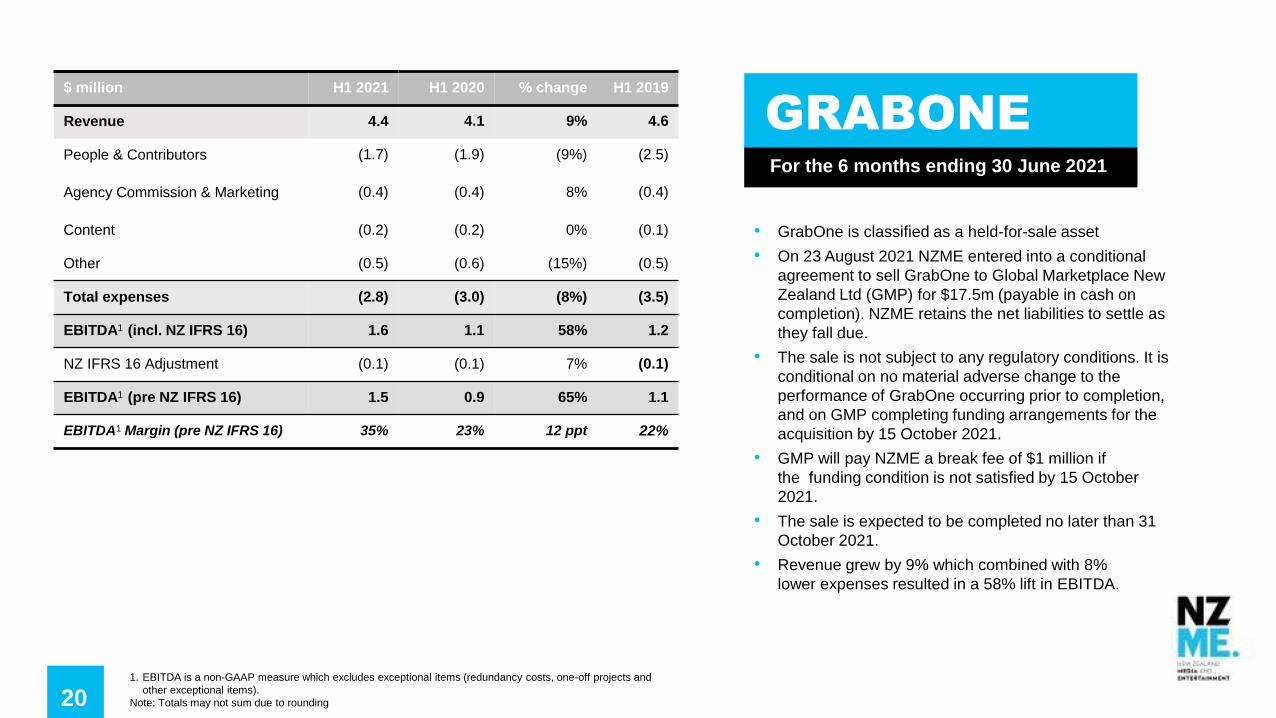
$ million H1 2021 H1 2020 % change H1 2019
Revenue 4.4 4.1 9% 4.6
People & Contributors (1.7) (1.9) (9%) (2.5)
Agency Commission & Marketing (0.4) (0.4) 8% (0.4)
Content (0.2) (0.2) 0% (0.1)
Other (0.5) (0.6) (15%) (0.5)
Total expenses (2.8) (3.0) (8%) (3.5)
EBITDA1 (incl. NZ IFRS 16) 1.6 1.1 58% 1.2
NZ IFRS 16 Adjustment (0.1) (0.1) 7% (0.1)
EBITDA1 (pre NZ IFRS 16) 1.5 0.9 65% 1.1
EBITDA1 Margin (pre NZ IFRS 16) 35% 23% 12 ppt 22%
• GrabOne is classified as a held-for-sale asset
• On 23 August 2021 NZME entered into a conditional
agreement to sell GrabOne to Global Marketplace New
Zealand Ltd (GMP) for $17.5m (payable in cash on
completion). NZME retains the net liabilities to settle as
they fall due.
• The sale is not subject to any regulatory conditions. It is
conditional on no material adverse change to the
performance of GrabOne occurring prior to completion,
and on GMP completing funding arrangements for the
acquisition by 15 October 2021.
• GMP will pay NZME a break fee of $1 million if
the funding condition is not satisfied by 15 October
2021.
• The sale is expected to be completed no later than 31
October 2021.
• Revenue grew by 9% which combined with 8%
lower expenses resulted in a 58% lift in EBITDA.
GRABONEFor the 6 months ending 30 June 2021
1. EBITDA is a non-GAAP measure which excludes exceptional items (redundancy costs, one-off projects and
other exceptional items).
Note: Totals may not sum due to rounding
21
For the half year
ended 30 June 2020
$ million H1 2021 H1 2020 % change H1 2019
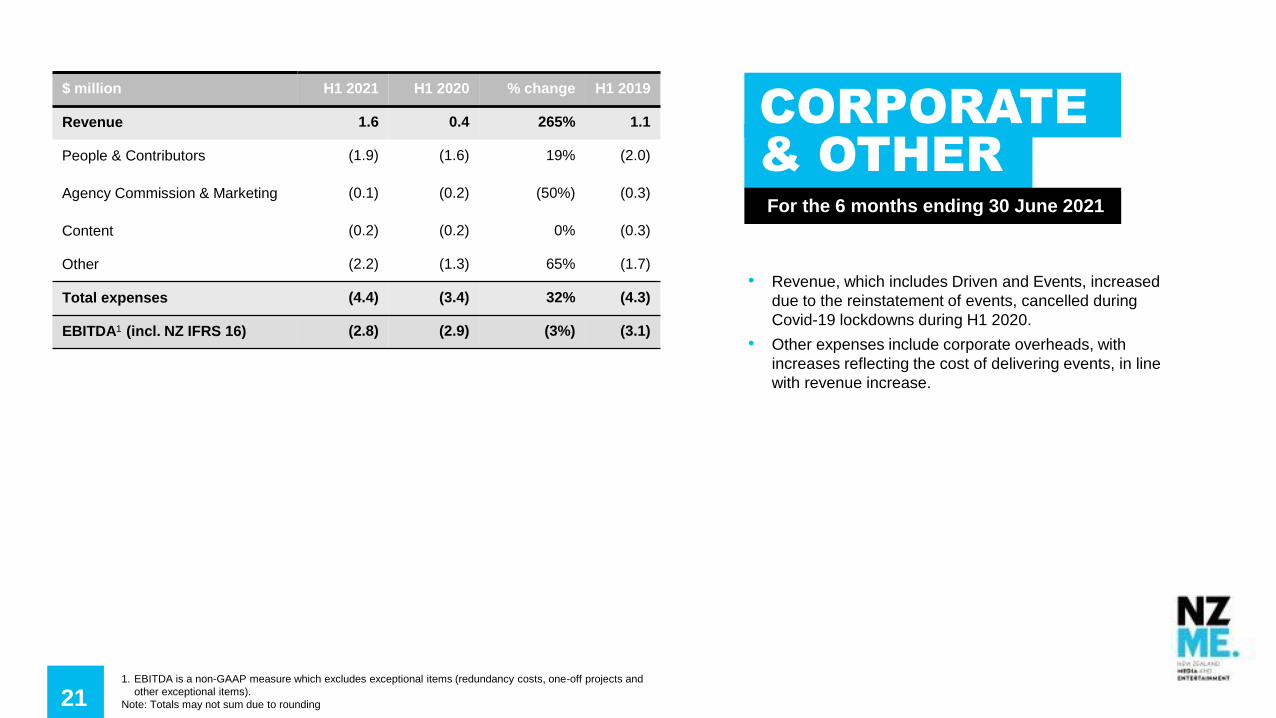
Revenue 1.6 0.4 265% 1.1
People & Contributors (1.9) (1.6) 19% (2.0)
Agency Commission & Marketing (0.1) (0.2) (50%) (0.3)
Content (0.2) (0.2) 0% (0.3)
Other (2.2) (1.3) 65% (1.7)
Total expenses (4.4) (3.4) 32% (4.3)
EBITDA1 (incl. NZ IFRS 16) (2.8) (2.9) (3%) (3.1)
• Revenue, which includes Driven and Events, increased
due to the reinstatement of events, cancelled during
Covid-19 lockdowns during H1 2020.
• Other expenses include corporate overheads, with
increases reflecting the cost of delivering events, in line
with revenue increase.
CORPORATE & OTHERFor the 6 months ending 30 June 2021
1. EBITDA is a non-GAAP measure which excludes exceptional items (redundancy costs, one-off projects and
other exceptional items).
Note: Totals may not sum due to rounding

22
2021 HALF YEARFINANCIAL RESULTS
23
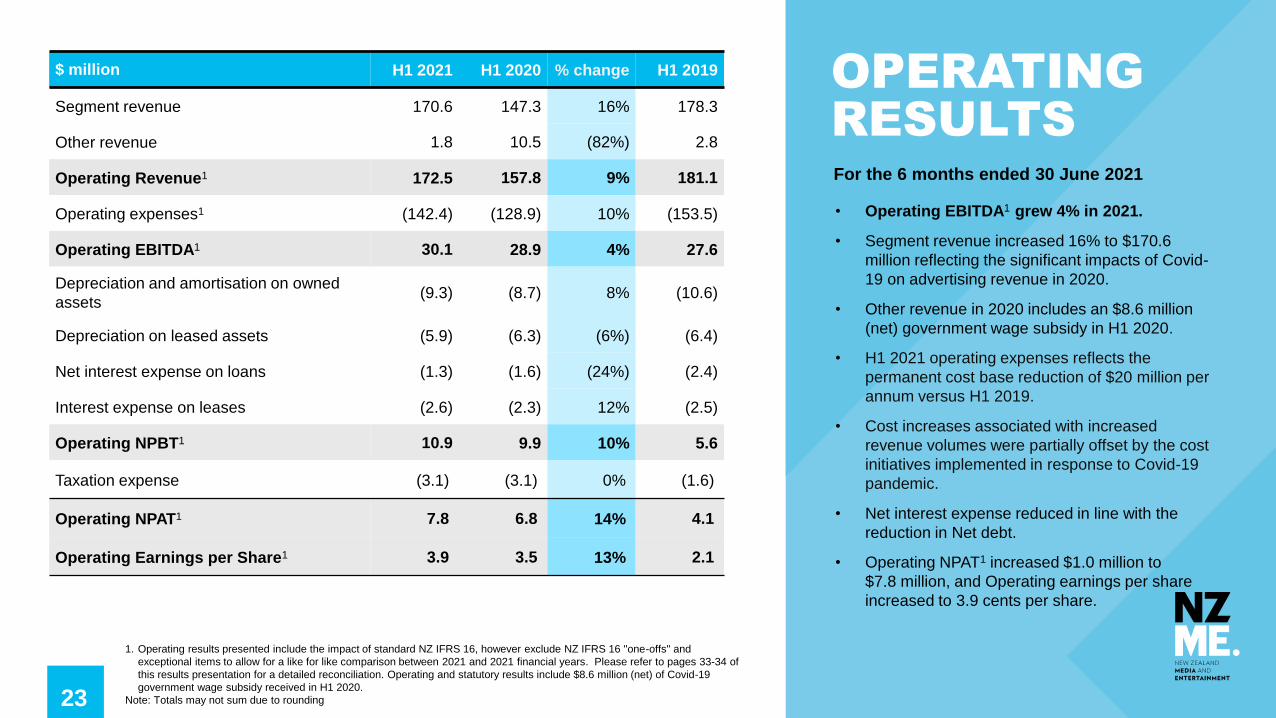
• Operating EBITDA1 grew 4% in 2021.
• Segment revenue increased 16% to $170.6
million reflecting the significant impacts of Covid-
19 on advertising revenue in 2020.
• Other revenue in 2020 includes an $8.6 million
(net) government wage subsidy in H1 2020.
• H1 2021 operating expenses reflects the
permanent cost base reduction of $20 million per
annum versus H1 2019.
• Cost increases associated with increased
revenue volumes were partially offset by the cost
initiatives implemented in response to Covid-19
pandemic.
• Net interest expense reduced in line with the
reduction in Net debt.
• Operating NPAT1 increased $1.0 million to
$7.8 million, and Operating earnings per share
increased to 3.9 cents per share.
$ million H1 2021 H1 2020 % change H1 2019
Segment revenue 170.6 147.3 16% 178.3
Other revenue 1.8 10.5 (82%) 2.8
Operating Revenue1 172.5 157.8 9% 181.1
Operating expenses1 (142.4) (128.9) 10% (153.5)
Operating EBITDA1 30.1 28.9 4% 27.6
Depreciation and amortisation on owned
assets(9.3) (8.7) 8% (10.6)
Depreciation on leased assets (5.9) (6.3) (6%) (6.4)
Net interest expense on loans (1.3) (1.6) (24%) (2.4)
Interest expense on leases (2.6) (2.3) 12% (2.5)
Operating NPBT1 10.9 9.9 10% 5.6
Taxation expense (3.1) (3.1) 0% (1.6)
Operating NPAT1 7.8 6.8 14% 4.1
Operating Earnings per Share1 3.9 3.5 13% 2.1
1. Operating results presented include the impact of standard NZ IFRS 16, however exclude NZ IFRS 16 "one-offs" and
exceptional items to allow for a like for like comparison between 2021 and 2021 financial years. Please refer to pages 33-34 of
this results presentation for a detailed reconciliation. Operating and statutory results include $8.6 million (net) of Covid-19
government wage subsidy received in H1 2020.
Note: Totals may not sum due to rounding
For the 6 months ended 30 June 2021
OPERATINGRESULTS
24
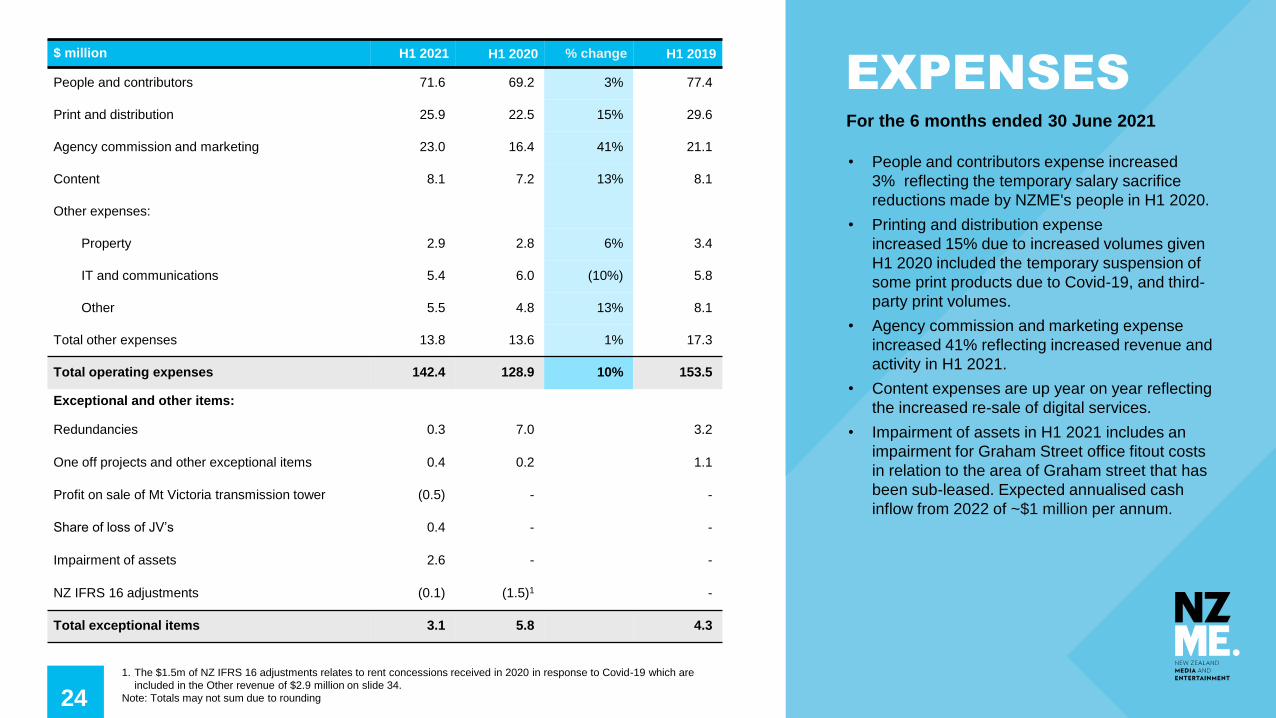
• People and contributors expense increased
3% reflecting the temporary salary sacrifice
reductions made by NZME's people in H1 2020.
• Printing and distribution expense
increased 15% due to increased volumes given
H1 2020 included the temporary suspension of
some print products due to Covid-19, and third-
party print volumes.
• Agency commission and marketing expense
increased 41% reflecting increased revenue and
activity in H1 2021.
• Content expenses are up year on year reflecting
the increased re-sale of digital services.
• Impairment of assets in H1 2021 includes an
impairment for Graham Street office fitout costs
in relation to the area of Graham street that has
been sub-leased. Expected annualised cash
inflow from 2022 of ~$1 million per annum.
1. The $1.5m of NZ IFRS 16 adjustments relates to rent concessions received in 2020 in response to Covid-19 which are
included in the Other revenue of $2.9 million on slide 34.
Note: Totals may not sum due to rounding
For the 6 months ended 30 June 2021
EXPENSES$ million H1 2021 H1 2020 % change H1 2019
People and contributors 71.6 69.2 3% 77.4
Print and distribution 25.9 22.5 15% 29.6
Agency commission and marketing 23.0 16.4 41% 21.1
Content 8.1 7.2 13% 8.1
Other expenses:
Property 2.9 2.8 6% 3.4
IT and communications 5.4 6.0 (10%) 5.8
Other 5.5 4.8 13% 8.1
Total other expenses 13.8 13.6 1% 17.3
Total operating expenses 142.4 128.9 10% 153.5
Exceptional and other items:
Redundancies 0.3 7.0 3.2
One off projects and other exceptional items 0.4 0.2 1.1
Profit on sale of Mt Victoria transmission tower (0.5) - -
Share of loss of JV’s 0.4 - -
Impairment of assets 2.6 - -
NZ IFRS 16 adjustments (0.1) (1.5)1 -
Total exceptional items 3.1 5.8 4.3
25
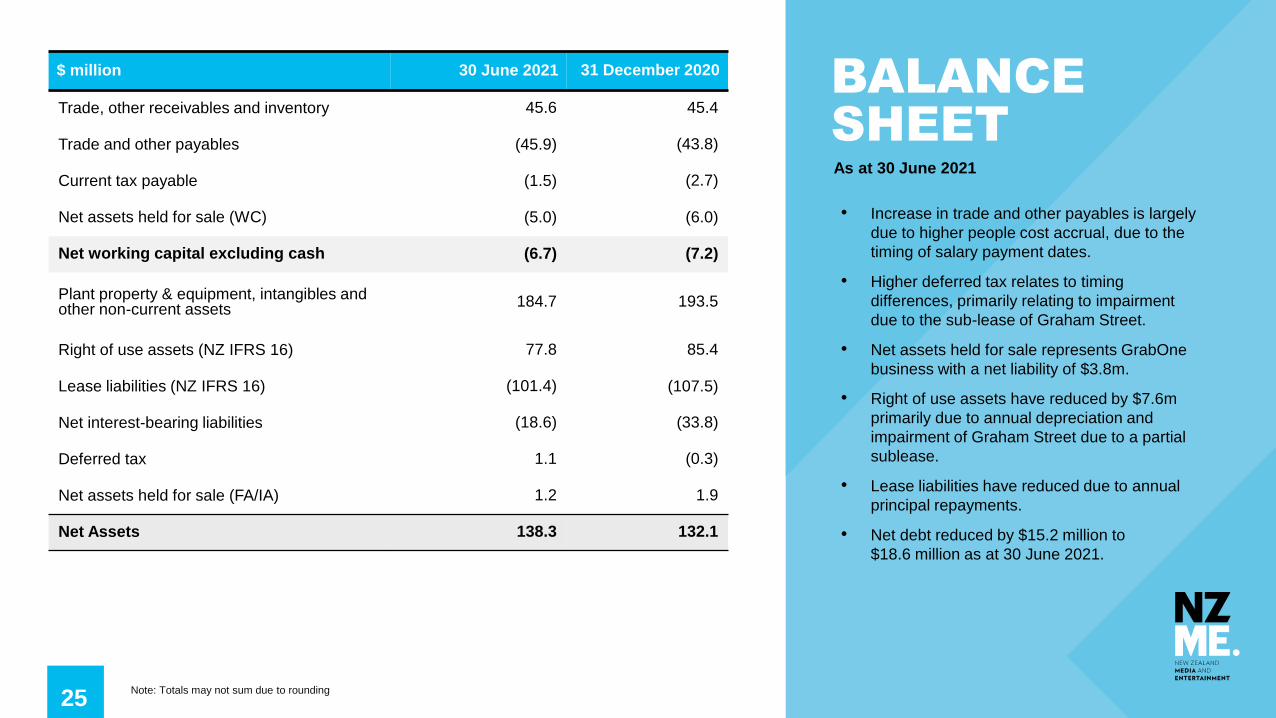
$ million 30 June 2021 31 December 2020
Trade, other receivables and inventory 45.6 45.4
Trade and other payables (45.9) (43.8)
Current tax payable (1.5) (2.7)
Net assets held for sale (WC) (5.0) (6.0)
Net working capital excluding cash (6.7) (7.2)
Plant property & equipment, intangibles and other non-current assets
184.7 193.5
Right of use assets (NZ IFRS 16) 77.8 85.4
Lease liabilities (NZ IFRS 16) (101.4) (107.5)
Net interest-bearing liabilities (18.6) (33.8)
Deferred tax 1.1 (0.3)
Net assets held for sale (FA/IA) 1.2 1.9
Net Assets 138.3 132.1
As at 30 June 2021
BALANCESHEET
• Increase in trade and other payables is largely
due to higher people cost accrual, due to the
timing of salary payment dates.
• Higher deferred tax relates to timing
differences, primarily relating to impairment
due to the sub-lease of Graham Street.
• Net assets held for sale represents GrabOne
business with a net liability of $3.8m.
• Right of use assets have reduced by $7.6m
primarily due to annual depreciation and
impairment of Graham Street due to a partial
sublease.
• Lease liabilities have reduced due to annual
principal repayments.
• Net debt reduced by $15.2 million to
$18.6 million as at 30 June 2021.
Note: Totals may not sum due to rounding
26
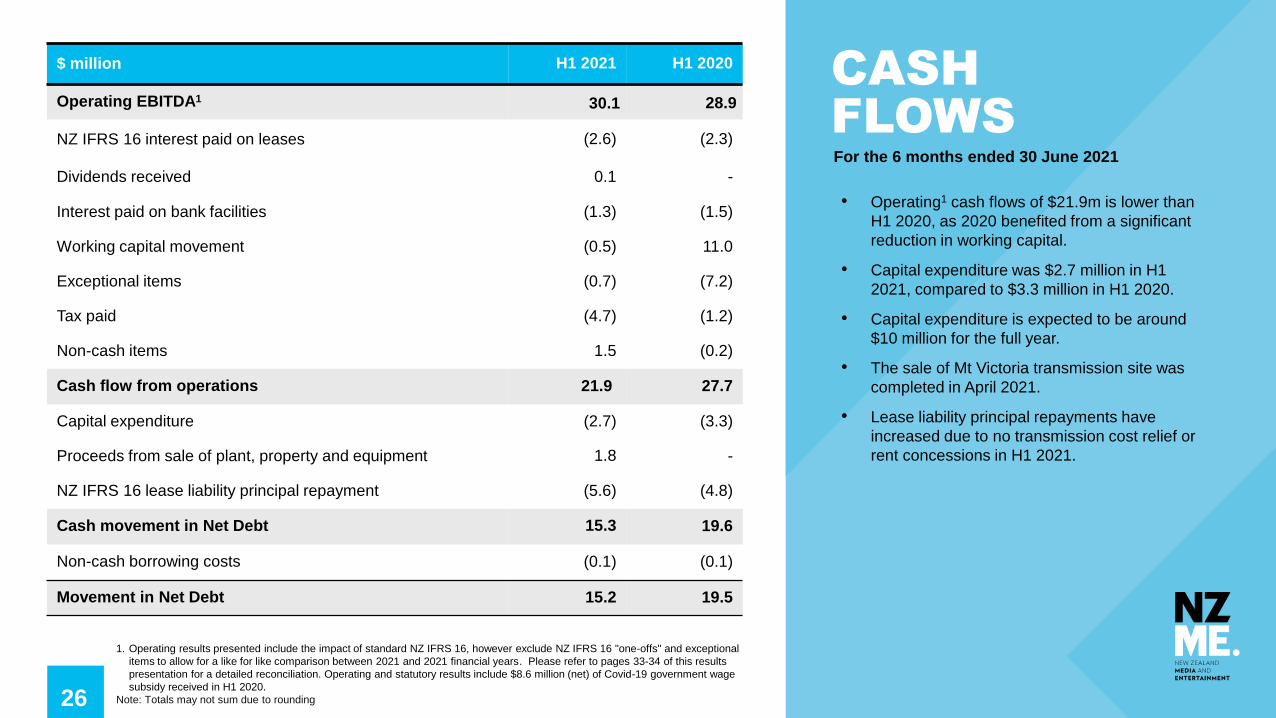
$ million H1 2021 H1 2020
Operating EBITDA1 30.1 28.9
NZ IFRS 16 interest paid on leases (2.6) (2.3)
Dividends received 0.1 -
Interest paid on bank facilities (1.3) (1.5)
Working capital movement (0.5) 11.0
Exceptional items (0.7) (7.2)
Tax paid (4.7) (1.2)
Non-cash items 1.5 (0.2)
Cash flow from operations 21.9 27.7
Capital expenditure (2.7) (3.3)
Proceeds from sale of plant, property and equipment 1.8 -
NZ IFRS 16 lease liability principal repayment (5.6) (4.8)
Cash movement in Net Debt 15.3 19.6
Non-cash borrowing costs (0.1) (0.1)
Movement in Net Debt 15.2 19.5
For the 6 months ended 30 June 2021
CASH FLOWS
• Operating1 cash flows of $21.9m is lower than
H1 2020, as 2020 benefited from a significant
reduction in working capital.
• Capital expenditure was $2.7 million in H1
2021, compared to $3.3 million in H1 2020.
• Capital expenditure is expected to be around
$10 million for the full year.
• The sale of Mt Victoria transmission site was
completed in April 2021.
• Lease liability principal repayments have
increased due to no transmission cost relief or
rent concessions in H1 2021.
1. Operating results presented include the impact of standard NZ IFRS 16, however exclude NZ IFRS 16 "one-offs" and exceptional
items to allow for a like for like comparison between 2021 and 2021 financial years. Please refer to pages 33-34 of this results
presentation for a detailed reconciliation. Operating and statutory results include $8.6 million (net) of Covid-19 government wage
subsidy received in H1 2020.
Note: Totals may not sum due to rounding
27
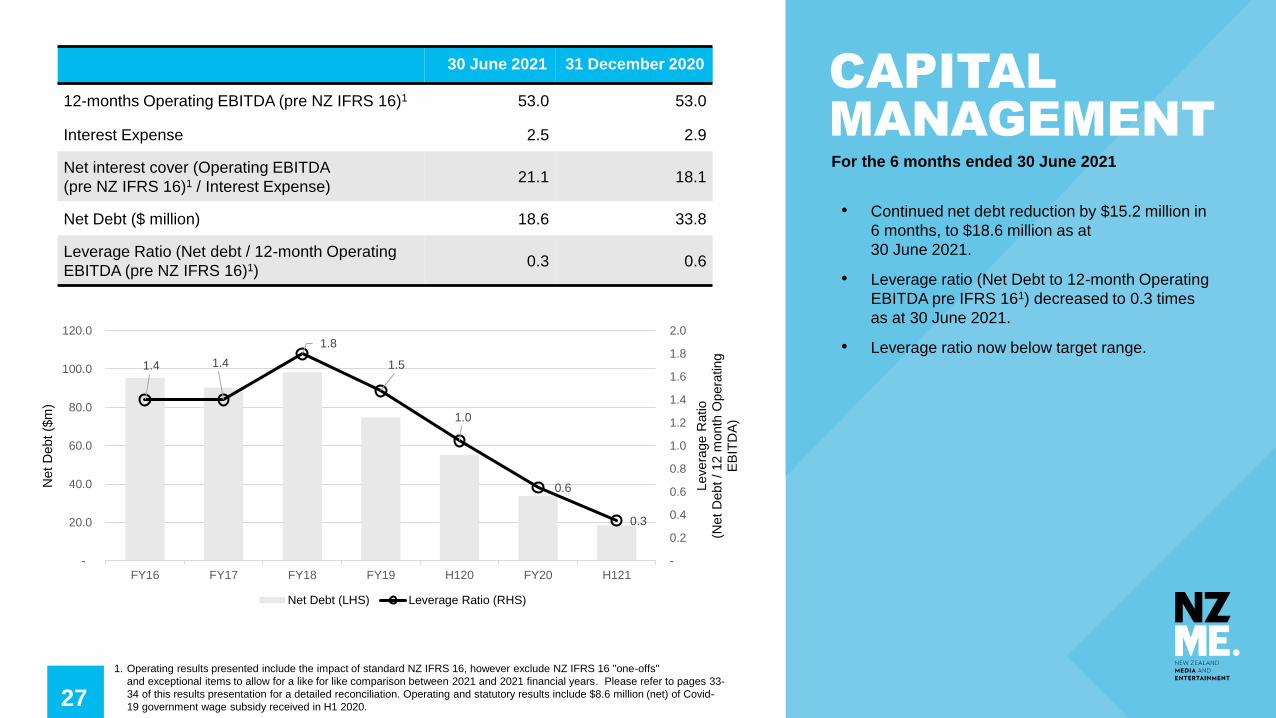
• Continued net debt reduction by $15.2 million in
6 months, to $18.6 million as at
30 June 2021.
• Leverage ratio (Net Debt to 12-month Operating
EBITDA pre IFRS 161) decreased to 0.3 times
as at 30 June 2021.
• Leverage ratio now below target range.
30 June 2021 31 December 2020
12-months Operating EBITDA (pre NZ IFRS 16)1 53.0 53.0
Interest Expense 2.5 2.9
Net interest cover (Operating EBITDA
(pre NZ IFRS 16)1 / Interest Expense)21.1 18.1
Net Debt ($ million) 18.6 33.8
Leverage Ratio (Net debt / 12-month Operating
EBITDA (pre NZ IFRS 16)1)0.3 0.6
1. Operating results presented include the impact of standard NZ IFRS 16, however exclude NZ IFRS 16 "one-offs"
and exceptional items to allow for a like for like comparison between 2021 and 2021 financial years. Please refer to pages 33-
34 of this results presentation for a detailed reconciliation. Operating and statutory results include $8.6 million (net) of Covid-
19 government wage subsidy received in H1 2020.
For the 6 months ended 30 June 2021
CAPITAL MANAGEMENT
1.4 1.4
1.8
1.5
1.0
0.6
0.3
-
0.2
0.4
0.6
0.8
1.0
1.2
1.4
1.6
1.8
2.0
-
20.0
40.0
60.0
80.0
100.0
120.0
FY16 FY17 FY18 FY19 H120 FY20 H121
Levera
ge R
atio
(Net
Debt
/ 12 m
onth
Opera
ting
EB
ITD
A)
Net
Debt
($m
)
Net Debt (LHS) Leverage Ratio (RHS)

28
Dividend Policy
NZME intends to pay dividends of 30-50% of Free Cash Flow subject to being
within its target leverage ratio and having regard to NZME's capital requirements,
operating performance and financial position.
Target Leverage Ratio of 0.5 to 1.0 times rolling 12 month EBITDA1 (pre NZ IFRS
16).
Full dividend policy is available at www.nzme.co.nz/investor-relations/dividends/
• The board have declared a fully imputed and fully franked dividend of 3.0
cps.
• During the first half of 2021, the company has confirmed that A$9.2 million
of franking credits are available for use.
• The dividend will be paid on 22 September 2021, for registered
shareholders as at 10 September 2021.
• The board recognises the company’s strong capital position. In the absence
of opportunities to invest, it will return capital to shareholders.
• The board was in a position to approve and announce a capital return to
shareholders. However, given the current Covid-19 uncertainties that
emerged last week has chosen to pause at this time.
DIVIDEND AND CAPITAL RETURN

29
• Given that New Zealand has moved into Level 4 lockdown1 over the past week,
we are wary of the potential impacts of this outbreak.
• We have been pleased to see advertising revenues track closer to 2019 levels.
Q3 2021 had been tracking to be in line with 2019 levels prior to the outbreak.
• Real Estate markets have been active and provide an opportunity for OneRoof
to grow.
• On the basis of the trends to date and on New Zealand containing any
outbreaks quickly, we would expect profit growth over 2020 for the full year
2021. However, this may become challenging depending on the duration of the
lockdowns.
• Google has announced that it will bring Google News Showcase to New
Zealand by the end of 2021. We look forward to discussing with both Google
and Facebook arrangements in regard to accessing and supporting editorial
content.
• We will update you on the Capital Management position further when market
conditions become clearer and the sale of GrabOne has been concluded.
• We also look forward to updating you at a NZME Investor Day to be held in
November 2021.
OUTLOOK
1. https://covid19.govt.nz/alert-levels-and-updates/about-the-alert-system/

30
Q&A

31
SUPPLEMENTARYINFORMATION
32
For the full year
ended 31 December 2020$m Audio Publishing OneRoof GrabOne Other H1 21 Total H1 20 Total % Change
Reader Revenue:
- Print - 35.0 - - - 35.0 36.5 (4%)
- Digital - 5.1 - - - 5.1 2.4 111%
Reader Revenue - 40.2 - - - 40.2 38.9 3%
Advertising Revenue:
- Radio 49.6 - - - - 49.6 42.3 17%
- Print - 33.3 7.0 - - 40.3 35.3 14%
- Digital 1.6 26.3 3.5 - 0.4 31.9 22.0 45%
Advertising Revenue 51.2 59.6 10.5 - 0.4 121.7 99.7 22%
Other Revenue 0.6 4.4 - 4.4 1.2 10.6 19.2 (45%)
Total Revenue 51.8 104.1 10.5 4.4 1.6 172.5 157.8 9%
People and Contributors (25.8) (39.0) (3.1) (1.7) (1.9) (71.6) (69.2) 3%
Print & Distribution - (22.2) (3.7) - - (25.9) (22.5) 15%
Agency Commission & Marketing (9.4) (10.9) (2.3) (0.4) (0.1) (23.0) (16.4) 41%
Content (3.2) (3.9) (0.6) (0.2) (0.2) (8.1) (7.2) 14%
Other (4.5) (6.3) (0.4) (0.5) (2.2) (13.8) (13.6) 1%
Total Costs (42.9) (82.2) (10.1) (2.8) (4.4) (142.4) (128.9) 10%
Operating EBITDA1 8.8 22.0 0.4 1.6 (2.8) 30.1 28.9 4%
NZ IFRS 16 Adjustments (3.7) (4.1) (0.2) (0.1) (0.1) (8.2) (7.1) 16%
EBITDA (pre NZ IFRS 16)2 5.1 17.9 0.2 1.5 (2.9) 21.8 21.8 0%
EBITDA (pre NZ IFRS 16)2 Margin % 10% 17% 2% 35% - 13% 14% -1 ppt
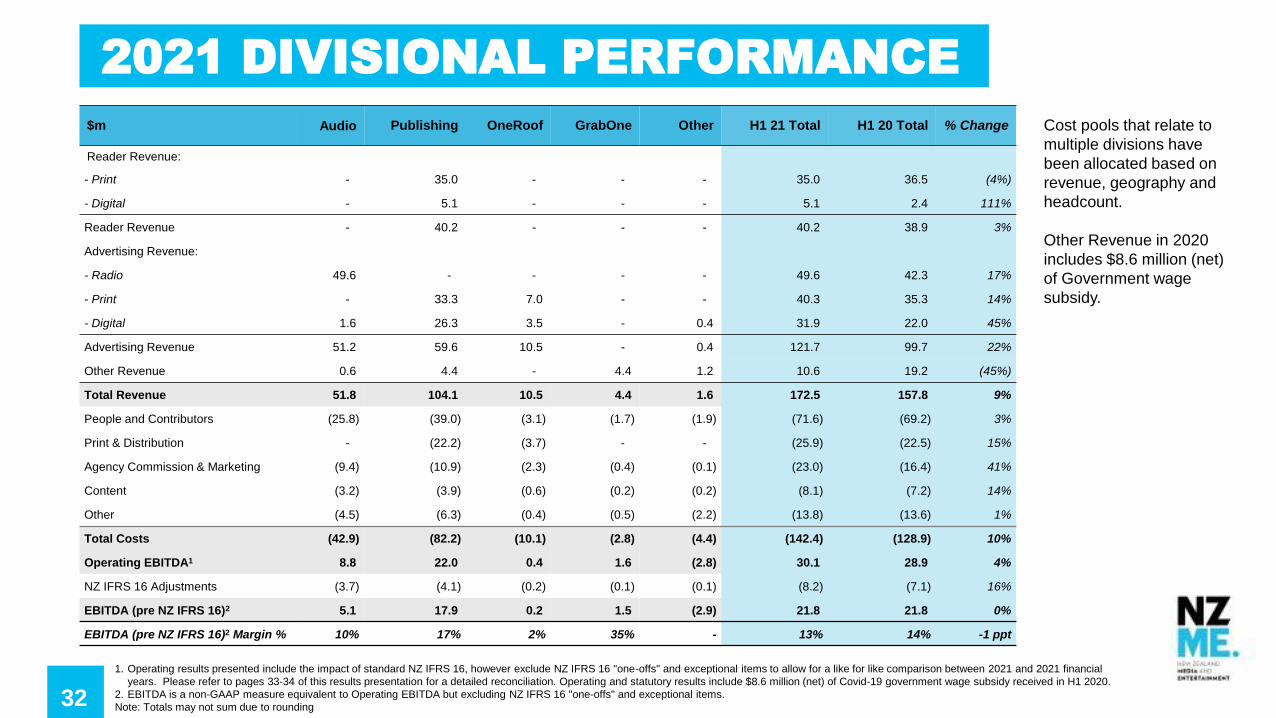
Cost pools that relate to
multiple divisions have
been allocated based on
revenue, geography and
headcount.
Other Revenue in 2020
includes $8.6 million (net)
of Government wage
subsidy.
1. Operating results presented include the impact of standard NZ IFRS 16, however exclude NZ IFRS 16 "one-offs" and exceptional items to allow for a like for like comparison between 2021 and 2021 financial
years. Please refer to pages 33-34 of this results presentation for a detailed reconciliation. Operating and statutory results include $8.6 million (net) of Covid-19 government wage subsidy received in H1 2020.
2. EBITDA is a non-GAAP measure equivalent to Operating EBITDA but excluding NZ IFRS 16 "one-offs" and exceptional items.
Note: Totals may not sum due to rounding
2021 DIVISIONAL PERFORMANCE
33
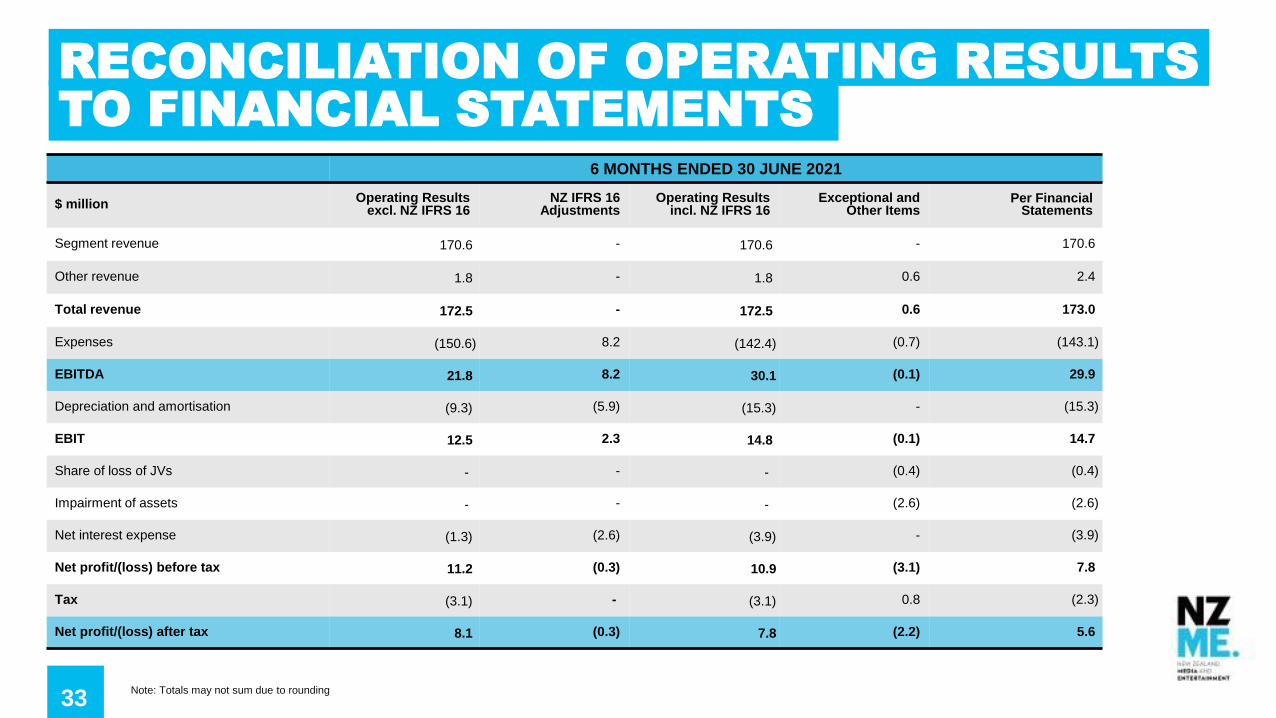
6 MONTHS ENDED 30 JUNE 2021
$ millionOperating Results
excl. NZ IFRS 16NZ IFRS 16
AdjustmentsOperating Results
incl. NZ IFRS 16Exceptional and
Other ItemsPer Financial
Statements
Segment revenue 170.6 - 170.6 - 170.6
Other revenue 1.8 - 1.8 0.6 2.4
Total revenue 172.5 - 172.5 0.6 173.0
Expenses (150.6) 8.2 (142.4) (0.7) (143.1)
EBITDA 21.8 8.2 30.1 (0.1) 29.9
Depreciation and amortisation (9.3) (5.9) (15.3) - (15.3)
EBIT 12.5 2.3 14.8 (0.1) 14.7
Share of loss of JVs - - - (0.4) (0.4)
Impairment of assets - - - (2.6) (2.6)
Net interest expense (1.3) (2.6) (3.9) - (3.9)
Net profit/(loss) before tax 11.2 (0.3) 10.9 (3.1) 7.8
Tax (3.1) - (3.1) 0.8 (2.3)
Net profit/(loss) after tax 8.1 (0.3) 7.8 (2.2) 5.6
RECONCILIATION OF OPERATING RESULTS TO FINANCIAL STATEMENTS
Note: Totals may not sum due to rounding
34
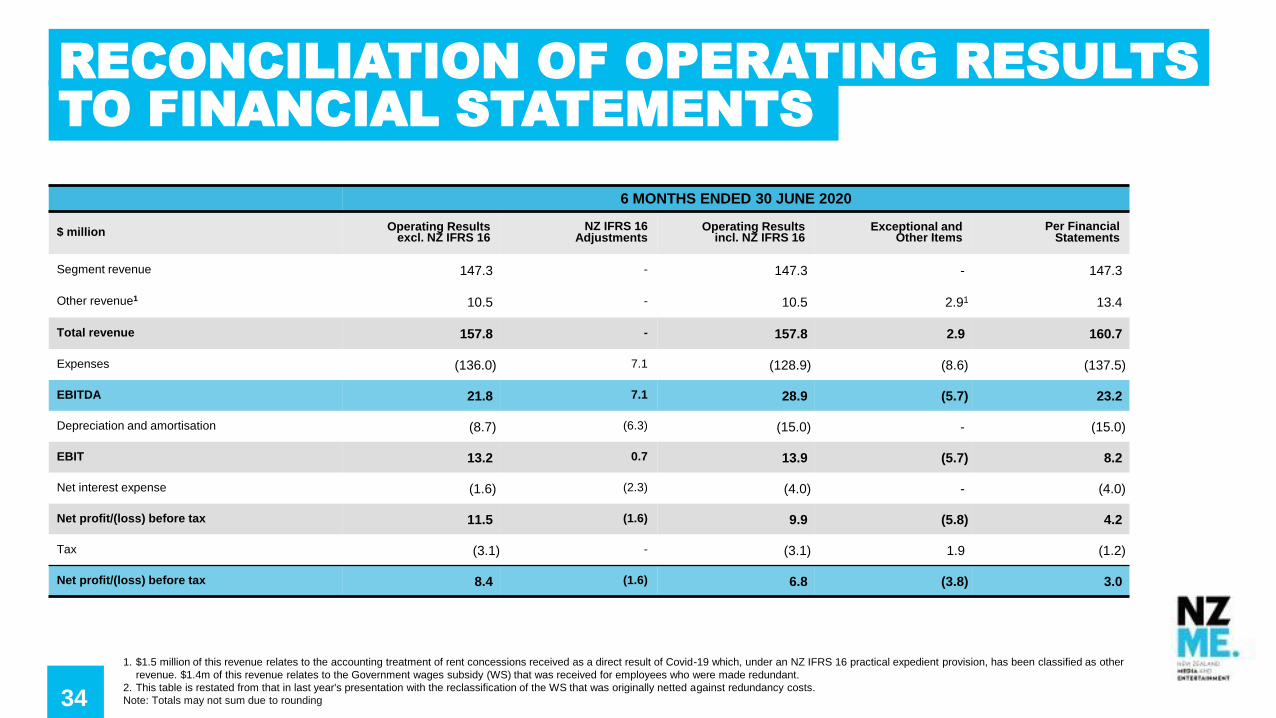
6 MONTHS ENDED 30 JUNE 2020
$ million Operating Results excl. NZ IFRS 16
NZ IFRS 16 Adjustments
Operating Results incl. NZ IFRS 16
Exceptional and Other Items
Per Financial Statements
Segment revenue 147.3 - 147.3 - 147.3
Other revenue1 10.5 - 10.5 2.91 13.4
Total revenue 157.8 - 157.8 2.9 160.7
Expenses (136.0) 7.1 (128.9) (8.6) (137.5)
EBITDA 21.8 7.1 28.9 (5.7) 23.2
Depreciation and amortisation (8.7) (6.3) (15.0) - (15.0)
EBIT 13.2 0.7 13.9 (5.7) 8.2
Net interest expense (1.6) (2.3) (4.0) - (4.0)
Net profit/(loss) before tax 11.5 (1.6) 9.9 (5.8) 4.2
Tax (3.1) - (3.1) 1.9 (1.2)
Net profit/(loss) before tax 8.4 (1.6) 6.8 (3.8) 3.0
1. $1.5 million of this revenue relates to the accounting treatment of rent concessions received as a direct result of Covid-19 which, under an NZ IFRS 16 practical expedient provision, has been classified as other
revenue. $1.4m of this revenue relates to the Government wages subsidy (WS) that was received for employees who were made redundant.
2. This table is restated from that in last year's presentation with the reclassification of the WS that was originally netted against redundancy costs.
Note: Totals may not sum due to rounding
RECONCILIATION OF OPERATING RESULTS TO FINANCIAL STATEMENTS

35
DISCLAIMER
The information in this presentation is of a general nature and does not constitute
financial product advice, investment advice, legal, financial, tax or any other
recommendation or advice. This presentation constitutes summary information
only, and you should not rely on it in isolation from the full detail set out in NZME’s
Consolidated Financial Statements for the half year ended 30 June 2021.
This presentation may contain projections or forward-looking statements regarding
a variety of items. Such projections or forward-looking statements are based on
current expectations, estimates and assumptions and are subject to a number of
risks and uncertainties. There is no assurance that results contemplated in any
projections or forward-looking statements in this presentation will be realised.
Actual results may differ materially from those projected in this presentation. No
person is under any obligation to update this presentation at any time after its
release to you or to provide you with further information about NZME Limited.
The Group adopted NZ IFRS16 Leases on 1 January 2019. Operating results as
stated throughout this presentation refer to results including the adjustments for
the adoption of NZ IFRS16 and prior to exceptional items. Please refer to pages
33-34 of this presentation for a detailed reconciliation to these results excluding
NZ IFRS 16 adjustments and to the statutory results.
While reasonable care has been taken in compiling this presentation, none of
NZME Limited nor its subsidiaries, directors, employees, agents or advisers (to
the maximum extent permitted by law) give any warranty or representation
(express or implied) as to the accuracy, completeness or reliability of the
information contained in it nor take any responsibility for it. The information in this
presentation has not been, and will not be, independently verified or audited.