jal group's strategies and account settlement for fy2003 · jal group’s strategies and...
TRANSCRIPT

0 ©JAL 2004
JAL GroupJAL Group’’s Strategies and s Strategies and Account Settlement for FY2003Account Settlement for FY2003
(Analyst Briefing)(Analyst Briefing)
May 7, 2004 May 7, 2004
Japan Airlines System CorporationJapan Airlines System Corporation

1 ©JAL 2004
Table of contents
Part 1 P1 Part 2
Ⅰ.Outline of Accout Settlement for FY2003 P2 Ⅰ. Forecast of Business Results for FY2004 P15
Outline of the Consolidated Financial Statements P3 Assumptions of the Forecast for FY2004 P16
Ⅱ.Efforts for Cost Reduction (FY2004) P4 Forecast of Business Results for FY2004(Consolidated) P17
Efforts for Cost Reduction P5 Forecast of Business Results for FY2004(by Segment) P18
Ⅲ.Efforts for Revenue Increase (FY2004 P6 Capex & Depreciation P19
New FFP Strategy P7 Interest Bearing Debt P20
Domestic Passenger -1- P8 Ⅱ. Outline of Account Settlement for FY2003 P21
Domestic Passenger -2- P9 Outline of the Consoidated Financeial Statements P22
International Passenger -1- P10 Revenue & Operating Income by Segment P23
International Passenger -2- P11 Outline of the results of Air Transportation Segment P24
International Cargo P12 Results of International Passenger P25
Ⅳ.Goal of Operating Income for FY2004 P13 Number of International Passengers by routes (yr/yr) P26
Forecast of Operating Income for FY2004 P14 Results of Domestic Passenger P27
Results of International Cargo P28
Outline of the Break down of Operating Costs P29Fuel & FOREX P30Results of main Subsidiaries P31

2 ©JAL 2004
<<PART 1>PART 1>ⅠⅠ.. Outline of Account Settlement for FY2003Outline of Account Settlement for FY2003

3 ©JAL 2004
I. Outline of Account Settlement for FY2003 I. Outline of Account Settlement for FY2003
Outline of the Consolidated Financial Statements
(Billions of yen)
FY02 FY03 Difference
(International Passenger) 668.4 549.7 -118.7 (Domestic Passenger) 629.3 668.8 39.5
(International Cargo) 157.2 153.0 -4.2(Others) 628.5 560.2 -68.3
Operating Revenue
Operating Income
Ordinary Income
Net Income
-151.7
-78.1
-87.7
-100.2-88.611.6
-71.915.8
-67.610.5
1,931.72,083.4

4 ©JAL 2004
ⅡⅡ. . Efforts for Cost Reduction (FY2004) Efforts for Cost Reduction (FY2004)

5 ©JAL 2004
ⅡⅡ.. Efforts for Cost Reduction Efforts for Cost Reduction ((FY2004FY2004))
Efforts or Cost Reduction
Cost Reduction through Integration Effects
¥25.0 billionFY03 FY04 y.o.y.
Reduction of Rents, etc. 6.5 12.5 6.0Improvement of personnel efficiency 3.0 22.0 19.0Improvement of equipment efficiency 6.0 9.5 3.5Other reductions 2.0 3.0 1.0Sub-total 17.5 47.0 29.5Additional Integration-related Cost -10.0 -14.5 -4.5
Total 7.5 32.5 25.0
(N.B.) excluding Revenue Increase through Integration Effects
Reduction of Personnel Expenses by introduction of new Retirement Benefit Scheme
¥32.0 billion*
* compared with FY2003

6 ©JAL 2004
ⅢⅢ. . Efforts for Revenue Increase (FY2004) Efforts for Revenue Increase (FY2004)

7 ©JAL 2004
ⅢⅢ.. Efforts for Revenue Increase Efforts for Revenue Increase ((FY2004FY2004))
New FFP Strategy~ launch “JAL Card Suica” in this winter~
JAL Mileage Bank(No. of member: approx.
15.9 million )
Suica (No. of issue: approx. 8.3 million)
JAL Card(No. of member:
approx. 1.2 million)
View Card(No. of member:
approx. 2.6million )
More attractive Mileage Program
Increase of No. of JAL Card members
Increase of Passengers
(N.B.) : All figures are as of March 31, 2004
First step of the new alliance between Railways & Airline

8 ©JAL 2004
ⅢⅢ.. Efforts for Revenue Increase Efforts for Revenue Increase ((FY2004FY2004))
Domestic Passenger -1-
JAL Group's No. of Domestic Passengers in FY2003 (y.o.y.)
90%
95%
100%
105%
110%
115%
Apr. May June July Aug. Sep. Oct. Nov. Dec. Jan. Feb. Mar. Apr.
JAL's Individual Pax
JAL's Total Pax
* yield: based on RPK** Figure of Apr. 2004: flash report
1Q yield*+0.1%
2Q yield*+3.0%
3Q yield* +10.8%
4Q yield*+13.6%
**
Expansion of network through Integration
in April, 2003
Sales Strategy focused on individual pax
Ratio of individual pax vs. total pax
+
Attained the target ratio of 63% in FY2003
Attained the target ratio of 63% in FY2003
Increase in Revenue ¥39.5 billion in FY2003
Yield in FY2003
increased +6.7%increased +6.7%
9 ©JAL 2004
ⅢⅢ.. Efforts for Revenue Increase Efforts for Revenue Increase ((FY2004FY2004)
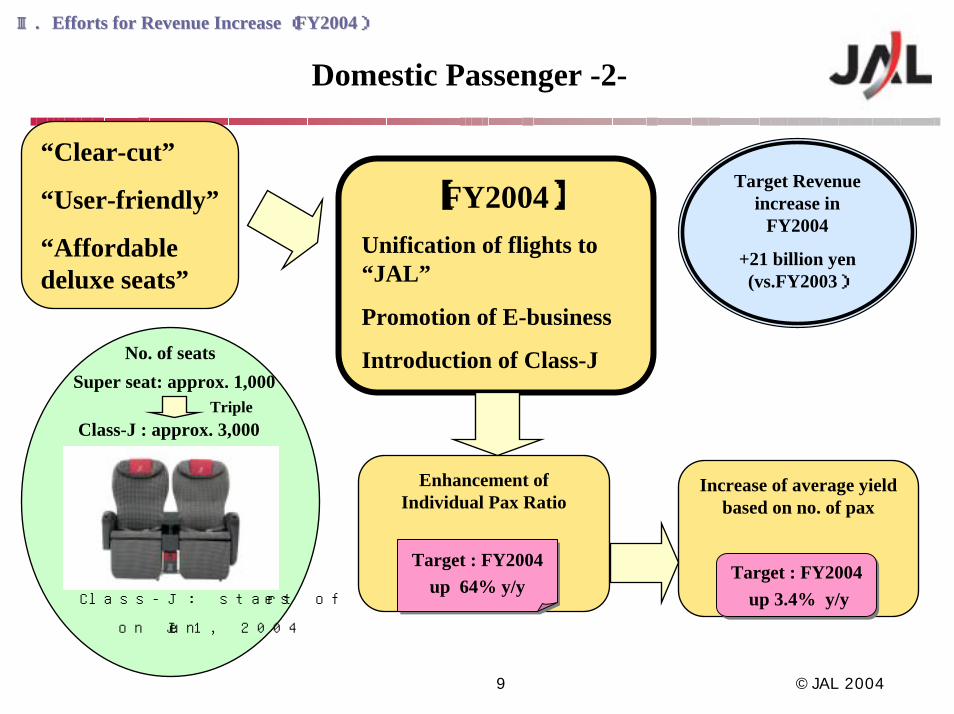
Domestic Passenger -2-
)
“Clear-cut”
“User-friendly”
“Affordable deluxe seats”
Target Revenue increase in
FY2004
+21 billion yen (vs.FY2003)
【FY2004】
Unification of flights to “JAL”
Promotion of E-business
Introduction of Class-J
Class-J : start of services
on June 1, 2004
Super seat: approx. 1,000
Class-J : approx. 3,000
No. of seats
Triple
Enhancement of Individual Pax Ratio
Target : FY2004up 64% y/y
Target : FY2004up 64% y/y
Increase of average yield based on no. of pax
Target : FY2004up 3.4% y/y
Target : FY2004up 3.4% y/y

10 ©JAL 2004
ⅢⅢ.. Efforts for Revenue Increase Efforts for Revenue Increase ((FY2004FY2004))
International Passenger -1-
Assumed JAL Group's No. of International Passengers for
FY2004
159%
206%
188%
156%
134%
122%117% 116%
112%111%114%
125%
80%
90%
100%
110%
120%
130%
140%
150%
160%
170%
180%
190%
200%
210%
220%
Apr
.
May
June
July
Aug
.Sep
.O
ct.
Nov
.Dec
.
Jan.
Feb.
Mar
.
FY04 assumed Demand (vs.FY03)
FY02 Demand (vs.FY03)
Assumed DemandTarget Revenue Increase for FY2004
145 billion yen (vs.FY2003)
27 billion yen (vs.FY2002)
【Assumed Demand for FY2004】
FH:almost same as FY2002SH:approx. 10% higher than FY2002
【Reasons why demand of SH is assumed stronger than that in FY2002】
China routes:assumed 50% demand increase corresponding to 80% supply increaseGuam routes: assumed 25% demand increase compared with weak demand in FY2002 caused by typhoons

11 ©JAL 2004
ⅢⅢ.. Efforts for Revenue Increase Efforts for Revenue Increase ((FY2004FY2004))
International Passenger -2-
【Pacific routes】Maintain proper supplyMaximize profit through high L/F & high yield
【Europe routes】Expand network in response to active demand
【China routes】Expand China routes anticipating future growthExpand the largest network of Japan-China routes
【Southeast Asia routes】Reinforce optimal route operation matching with demand
Sales strategy
Beef-up Direct Marketing
Shell-flat seats:introducing
on 7 trunk routes
Sight-seeing
FLY! JAL!Asia
FLY!JAL!Silver-wedding Trip
Business
Strategies by route

12 ©JAL 2004
ⅢⅢ.. Efforts for Revenue Increase Efforts for Revenue Increase ((FY2004FY2004))
International Cargo
Revenue increase by satisfying demand
FY2004 up 1.5% y/yFY2004 up 1.5% y/y
85.0%
90.0%
95.0%
100.0%
105.0%
110.0%
115.0%
120.0%
125.0%
Apr. May June July Aug. Sep. Oct. Nov. Dec. Jan. Feb. Mar. Apr.
Trend of International Cargo Tonnage for FY2003 Active Demand for International Cargo Target
Revenue Increase for
FY2004:9 billion yen(vs. FY03)【FY2004】
Beef-up on China routes Introduction of 747-400F Exploitation of “Chubu International Airport”
Offering high-value added products “J-Products”

13 ©JAL 2004
ⅣⅣ. . Goal of Operating Income (FY2004)Goal of Operating Income (FY2004)

14 ©JAL 2004
ⅣⅣ.. Forecast of Business Results for FY2004Forecast of Business Results for FY2004
Forecast of Business Results for FY2004
10.5
-67.6
81.0
-100-80-60-40-20
0
20406080
100
FY02 FY03 Forecast for FY2004
New Retirement Benefit Scheme⇒ ¥32 billion
Integration Effects ⇒ ¥25 billion
Domestic Passenger ⇒¥21billion International Passenger ⇒ ¥145 billion International Cargo⇒¥ 9 billion
Resumption of dividendResumption of dividend
Cost Reduction
Revenue Increase
Operating IncomeBillion yen

15 15©JAL 2004
Part 2Part 2
ⅡⅡ. Forecast of Business. Forecast of Business
Results for FY2004Results for FY2004
16 15©JAL 2004
ⅡⅡ.. Forecast of Business Results for FY2004Forecast of Business Results for FY2004
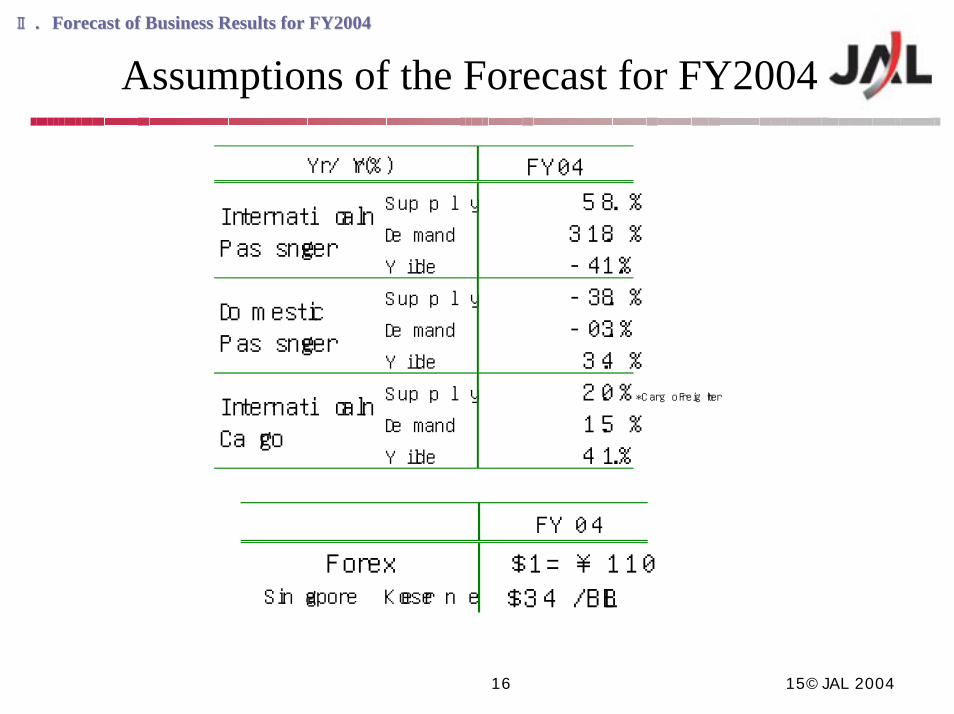
Assumptions of the Forecast for FY2004
FY04
Supply 5.8%Demand 31.8%Yield -4.1%Supply -3.8%Demand -0.3%Yield 3.4%Supply 2.0% *Cargo Freighter
Demand 1.5%Yield 4.1%
Yr/Yr(%)
InternationalPassenger
DomesticPassenger
InternationalCargo
FY04
Forex $1=¥110Singapore Kerosene $34/BBL

17 15©JAL 2004
ⅡⅡ.. Forecast of Business Results for FY2004Forecast of Business Results for FY2004
Forecast of Business Results for FY2004(Consolidated)
billions of yen
FY03 (A) FY04 (E)
International Passenger 549.7 695.0 Domestic Passenger 668.8 690.0 International Cargo 153.0 162.0 Others 560.2 643.0
ROE - 20%Payback Period*1 22years 9years*1:Interst-bearing Debts ÷ Operating Cash Flow
81.0-67.6
2,190.01,931.7
36.0-88.6
69.0-71.9
Operating Rvenue
Operating Income
Ordinary Income
Net Income

18 15©JAL 2004
ⅡⅡ.. Forecast of Business Results for FY2004Forecast of Business Results for FY2004
Forecast of Business Results for FY2004(by Segment)
billions of yen
Consolidated Adjustments
Total
( )Defference from FY2003
Other 274.0
2,190.0 (258.3)
(3.1)
Air Transportation
Airline-related
Travel Services (73.1) 0.5 (4.4) 455.0
81.0 (148.6)
0.5 (0.3)
3.5 (1.6)
-535.0 (-34.1)
(15.9) 9.5
Operating Revenue
268.0 (24.2)
1,728.0 (179.2)
Operating Income
67.0 (139.1)
The credit card and leasing business, the retailing and distribution business, previously included "Air Transport-Related Business", are combined together with the hotel and resort operations and are to be presented as part of "Other Business".

19 15©JAL 2004
ⅡⅡ.. Forecast of Business Results for FY2004Forecast of Business Results for FY2004
Capital Investment & Depreciation
No.of Aircraft introduced
13 13
150.0151.5
112.0119.3
0
100
200
FY03 Actual FY04 Forecast
Capital Investment Depreciation
billions of yen
FY03 (A) FY04 (E)
(Aircraft) 105.4 85.0 (Ground Assets) 19.1 39.0 (Intangible Fixed Assets) 27.0 26.0
Depreciation
Capital Investment
119.3 112.0
151.5 150.0
20 15©JAL 2004
ⅡⅡ.. Forecast of Business Results for FY2004Forecast of Business Results for FY2004
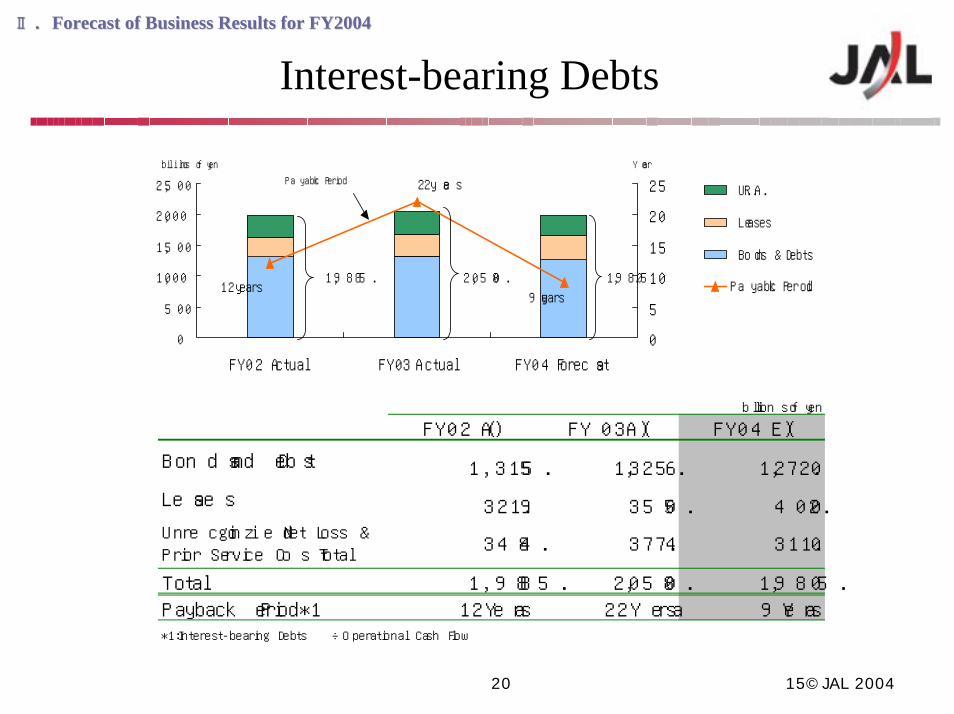
Interest-bearing Debts
9years
22yeas
12years
0
500
1,000
1,500
2,000
2,500
FY02 Actual FY03 Actual FY04 Forecast
0
5
10
15
20
25 U.R.A.
Leases
Bonds & Debts
Payback Period 2,058.0
billions of yen Year
1,985.01,985.8
Payback Period
billions of yen
FY02 (A) FY03 (A) FY04 (E)
Bonds and Debts 1,315.5 1,325.6 1,272.0
Leases 321.9 355.0 402.0
Total 1,985.8 2,058.0 1,985.0
Payback Period*1 12Years 22Years 9Years*1:Interest-bearing Debts ÷ Operational Cash Flow
Unrecoginized Net Loss &Prior Service Cost Total
311.0348.4 377.4

21 ©JAL 2004
Part 2Part 2
ⅢⅢ.. Account Settlement Account Settlement
for FY2003for FY2003

22 ©JAL 2004
ⅢⅢ.. Account Settlement for FY2004Account Settlement for FY2004
Gist of the Consolidated Financial Statements
billions of yen
FY02 FY03 yr/yr(A) (B) (B)-(A)
ROE 5% - -Payback Period *1 12years 22years -*1:Interest-bearing Debts ÷ Operational Cash Flow
Operating Revenue
Operating Income
Ordinary Income
Net Income
-151.7
-78.2
-87.7
-100.211.6 -88.6
15.8 -71.9
-67.6
2,083.4 1,931.7
10.5

23 ©JAL 2004
ⅢⅢ.. Account Settlement for FY2004Account Settlement for FY2004
Revenues & Operating Income by Segment
*1 The credit card and leasing business, the retailing and distribution business, previously included "Air Transport-Related Business", are combined together with the hotel and resort operations and are to be presented as part of "Other Business".
Airline-related Business in FY2002 includes the credit card and leasing business and the retailing and distribution business. JAS's other business in FY2002 is added to Travel Services Business.
*2 Prior to consolidation adjustments
Operating Revenue
Travel
Services
16%
Others
11%
Air
Transpor
tation
63%
Aviation-
related
10%
billions of yen
Air Transportation 1,548.8 (-101.6) -72.1 (-74.9)
Airline-related*1 243.7 (-2.3) 1.8 (-0.5)
Travel Services 381.9 (-53.8) -3.9 (-3.6)
Others*1 258.1 (-3.8) 6.3 (0.0)
( ) Defference from FY03
Add-up of JAL/JAS without adjustment for FH of FY02
OperatingIncome*2
OperatingRevenue*2

24 ©JAL 2004
ⅢⅢ.. Account Settlement for FY2004Account Settlement for FY2004
Gist of the results of Air Transportation Segment
<Breakdown of Revenue> Billions of Yen
Passenger 549.7 (- 118.7)
Cargo 153.0 (- 4.2)
Passenger 668.8 ( 39.5 )
Cargo 30.8 ( 0.5 )
Others 64.8 (- 0.9)
AssociatedBusiness
81.7 (- 17.8)
( )yr/yr Defference
Operating Revenue
International
Domestic
2.7
-72.1
1,548.81,650.4
0
500
1,000
1,500
2,000
FY02 FY03
-100
-50
0
50
100
Operating Income (right)Operating Revenue (left)
Billion of YenBillion of Yen

25 ©JAL 2004
ⅢⅢ.. Account Settlement for FY2004Account Settlement for FY2004
Results of Domestic Passenger
6.3
-0.4
1.7
6.7
-5.0
0.0
5.0
10.0
Revenue RPK ASK Yield
yr/yr(%)
Domestic Passenger Revenue
¥668.8bln(Yr/Yr difference +39.5bln)
<L/F>
FY03 64.0%FY02 65.3%

26 ©JAL 2004
ⅢⅢ.. Account Settlement for FY2004Account Settlement for FY2004
Results of International Passenger
-17.8
-2.7
-15.4
-9.5
-20.0
-10.0
0.0
10.0
Revenue RPK ASK Yield
Yr/Yr(%)
<L/F>
FY03 64.6%FY02 69.0%
Effects of Forex -0.7%
International Passenger Revenue
¥549.7bln(Yr/Yr difference ▲118.7bln)

27 ©JAL 2004
ⅢⅢ.. Account Settlement for FY2004Account Settlement for FY2004
Demand & Supply of International Passengers by route(yr/yr)
-7.7
-12.1
-15.5
-25.5
-6.4
-9.6
-25.4
-33.4
-0.1
-15.2
-12.4
-15.7
3.4
-7.4
-15.3
1.8
-40.0
-20.0
0.0
Contin
enta
l
Haw
aii
Euro
pe
South
east A
sia
Oceania
Guam
Kore
a
Chin
a
RPK ASK
yr/yr(%)

28 ©JAL 2004
ⅢⅢ.. Account Settlement for FY2004Account Settlement for FY2004
Result of International Cargo
-2.7
-0.8
-1.9
-5.0
0.0
5.0
Revenue RCTK Yield
yr/yr(%)
-2-1
7
-5
0
5
10yr/yr(%)
International Cargo Revenue
¥153.0bln(Yr/Yr difference-4.2bln)
*International Cargo Tonnage by route (yr/yr %)(On a Tonnage base)
Pacific Europe
Southeast Asian & Others
Effects of Forex -1.9%

29 ©JAL 2004
ⅢⅢ.. Account Settlement for FY2004Account Settlement for FY2004
Gist of the Breakdown of Operating Costs(Air transportation Segments)
Billions of Yen
FY02*1 FY03 Difference
Fuel 246.2 244.8 -1.4 ( -1% )
Airport Facilities 132.4 132.7 0.3 ( 0% )
Maintenance 103.3 106.0 2.7 ( 3% )
Passenger Services etc 56.2 48.1 -8.1 ( -14% )
Commisions 132.1 121.6 -10.5 ( -8% )
Aircraft Depreciation 74.0 76.1 2.1 ( 3% )
Aircraft Leases 100.6 96.8 -3.8 ( -4% )
Parsonnel 327.7 332.0 4.3 ( 1% )Others & ConsolidatedAdjustments
475.1 462.9 -12.3 ( -3% )
Total 1,647.6 1,621.0 -26.6 ( -2% )
yr/yr(%)
*1 Add-up of JAL/JAS without Adjustment

30 ©JAL 2004
ⅢⅢ.. Account Settlement for FY2004Account Settlement for FY2004
Fuel & FOREX(Air Transportation Segment)
◆Fuel
◆FOREX
FY02 FY03 Operating Revenue
Operating Costs
Operating Income 16.8
Effects on Income
¥132.3
N.B Based on the averag Company Exchange Ratefrom Apr-Sep of FY2003
Exchange Rate of Main Foreign Currencies
-24.7
Billions of Yen
USD ¥122.9 ¥114.0-7.9
EUR ¥120.0
Averaged Fuel Price(SIN Kerosene)
FY03 $33.0/bbl (FY02 $30.5/bbl)
Hedge Ratio for FY03
about 50%

31 ©JAL 2004
ⅢⅢ.. Account Settlement for FY2004Account Settlement for FY2004
Results of Main Subsidiaries
AGP 9.4 ( 0.1 ) 0.4 ( 0.0 ) 0.1 ( 0.0 )
TFK 22.9 (- 2.3) -0.3 (- 0.4) 0.1 (- 0.2)
Airline-related Business Segment
JAL Tours 104.7 ( 4.0 ) 0.7 ( 0.5 ) 0.6 ( 0.6 )
JALPAK 166.3 (- 47.9) -4.5 (- 3.0) -2.3 (- 1.0)
JAL Sales 45.2 ( 0.3 ) -0.5 (- 1.5) -1.1 ( 1.6 )
Travel Services Segment
JAL Card 15.4 ( 2.7 ) 1.5 ( 0.5 ) 1.0 ( 0.4 )
JAL Hotels 23.7 (- 0.7) 0.8 ( 0.0 ) 1.1 ( 0.2 )
JALUX 78.4 (- 0.1) 1.3 ( 0.2 ) 0.9 ( 0.2 )
Others Segment
Billions of Yen
( )yr/yr difference. Add-up of JAL/JAS for FY2002 figures.
Operating Revenue Operating Income Net Income<before consolidation adjustments>
大好評の「空弁」 !JALUX

32 ©JAL 2004
<Contact Address>
Japan Airlines System Corporation, IR Desk
TEL: (03)5769-6097 FAX: (03)5769-6492
Office Hour: Weekday: 9:30-12:00,13:00-17:00
Address: 2-4-11, Higashi-Shinagawa, Shinagawa-ku, Tokyo 140-8605
(N.B.)
Please refer to the Financial Information (“Kessan Tanshin”,”Yukashoken Hokokusyo”etc.) for the precise figures on the account settlement. Any statements in this document, other than those of historical facts, are forward-looking statements about future performance, which are based on management’s assumptions and beliefs in light of information currently available, and involve risks and uncertainties. Actual results may differ materially from these forecasts. This document is published as supplemental materials for the Briefing on JAL Group’s Financial Statements for FY2003. The copyright of this document belongs Japan Airlines System Corporation.
You can watch this presentation on our Homepage (Sorry! Only in Japanese). Please refer to the following URL: http://www.jal.jp