jal group’s q3 account settlement for fy2003 group’s q3 account settlement for fy2003 - analyst...
TRANSCRIPT

0 ©JAL 2004
JAL Group’s Q3 Account Settlement
for FY2003
- Analyst Briefing -
February 9, 2004
Japan Airlines System Corporation

1 ©JAL 2004
Contents
Contents P1
Defects of Engines for MD81/87 Aircraft P2
Outline of Q3 Account Settlement for FY2003 P3 Topics P17
Outline of the Consolidated Financial Statements P4 Flight Plan for FY2004 P18
Quarterly Operating Income P5 New Services for Domestic Flights (class J) P19
Operating Revenue & Income by Segment P6 Towards the Final Stage of the Integration (1) P20
Outline of the results of Air Transportation Segment P7 Towards the Final Stage of the Integration (2) P21
Trend in Demand in International Passenger Segment P8 JAL Group's Cash Management System P22
Results of International Passenger P9 JAL Group's Home Page P23
Demand & Supply of International Passenger by Route P10 Notice P24
Results of Domestic Passenger(1) P11
Results of Domestic Passenger(2) P12
Results of International Cargo(1) P13
Results of International Cargo(2) P14
Outline of the Breakdown of Operating Costs P15
Fuel & FOREX (AirTransportationSegment) P16

2 ©JAL 2004
FollowFollow--upup
Defects of Engines for MD81/87 Aircraft
Details of the DefectDetails of the Defect
Engines for MD81 (17 aircraft) & MD87(8 aircraft)manufactured by Pratt&Whitney
Cracks found in a section of the high-pressure compressor in the engines
Situation & MeasuresSituation & MeasuresImpactImpact
*Negative impact on revenue is assumed approx. (500) million yen
*Results of Inspection from Jan.19 to Jan. 21 →Damage was revealed in engines of 18 aircraft out of 25.*17 out of 25 MD81/87aircraft would be operated from Feb. 7 by change of engines.
*From Feb. 8, no flights would be cancelled by the damages in engines.
*Cancelled flights/Affected passengers Jan. 568 flights / 38,000 passengers Feb. 28 flights / 2,000 passengers In total 596 flights / 40,000 passengers
We deeply apologize to our customers and investors for any trouble and concern caused by this.We deeply apologize to our customers and investors for any trouble and concern caused by this.

3 ©JAL 2004
Outline of Q3 Account Settlement for FY2003

4 ©JAL 2004
Outline of Q3 Account Settlement for FY2003Outline of Q3 Account Settlement for FY2003
Outline of the Consolidated Financial Statements
(Billion yen)
FY02Oct.~Dec. Apr.~Dec. Apr.~Mar.
Operating Revenue 525.6 1,470.1 2,083.4Operating Income 5.4 (43.0) 10.5Ordinary Income 11.0 (38.7) 15.8
Net Income 3.7 (53.8) 11.6
FY03

5 ©JAL 2004
Comparison between FY03 & average past 10 years Quarterly Operating Income
Outline of Q3 Account Settlement for FY2003Outline of Q3 Account Settlement for FY2003
* add-up of JAL & JAS without adjustment (provisional)
** JAL Group’s Consolidated
(18.0)
48.0
(11.0) (7.0)
(76.9)
28.4
5.4
(100.0)
(80.0)
(60.0)
(40.0)
(20.0)
0.0
20.0
40.0
60.0
Q1 Q2 Q3 Q4
Billion yenAve rage Ope rat in g In come fo r FY93-02*
Ope rat in g In come fo r FY03**
6 ©JAL 2004
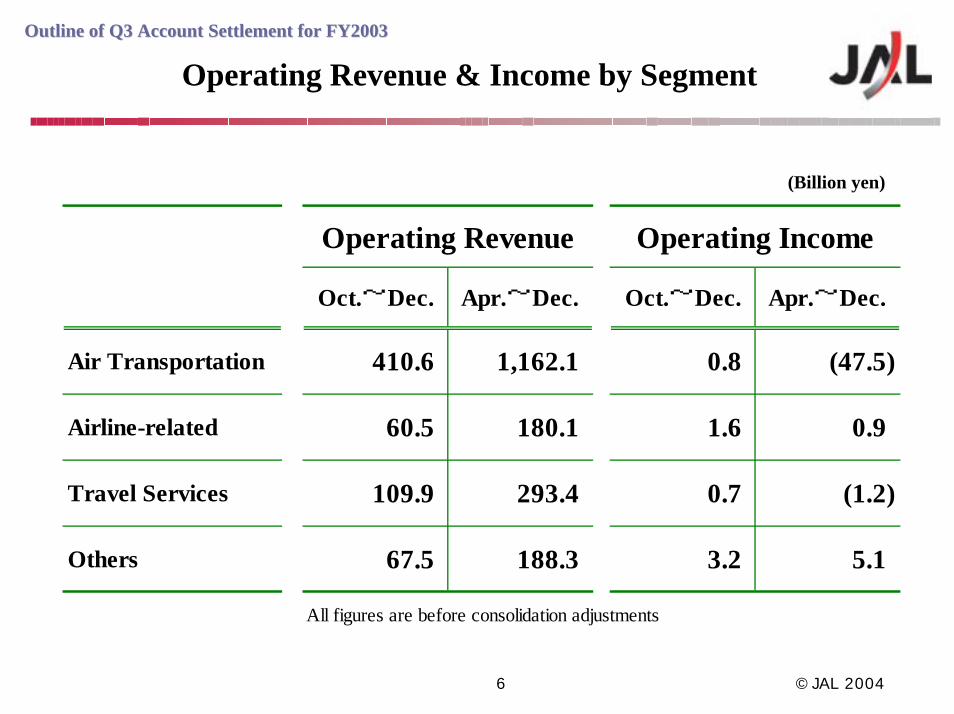
Outline of Q3 Account Settlement for FY2003Outline of Q3 Account Settlement for FY2003
Operating Revenue & Income by Segment
Oct.~Dec. Apr.~Dec. Oct.~Dec. Apr.~Dec.
Air Transportation 410.6 1,162.1 0.8 (47.5)
Airline-related 60.5 180.1 1.6 0.9
Travel Services 109.9 293.4 0.7 (1.2)
Others 67.5 188.3 3.2 5.1
All figures are before consolidation adjustments
Operating Revenue Operating Income
(Billion yen)

7 ©JAL 2004
Outline of Q3 Account Settlement for FY2003
Outline of the results of Air Transportation SegmentOutline of Q3 Account Settlement for FY2003
Breakdown of Revenue(Apr.-Dec.))
<Breakdown of Revenue> (unit:billion yen)
Internatiional Passenger 154.6 (10.9) 405.4 (112.2)
Cargo 43.3 (2.0) 114.7 (5.8)
Domestic Passenger 168.4 16.3 512.3 30.0
Cargo 8.5 0.1 23.6 0.3
Others 35.6 (3.0) 106.0 (17.3)
Total 410.6 0.4 1,162.1 (104.9)
Underlined figures are differences between FY03 and FY02.FY02 figures are add-ups of JAL/JAS without adjustment for consolidation.
Operating Income (unit:billion yen)
Total 0.8 9.5 (47.5) (68.1)
Oct.~Dec. y.o.y. Apr.~Dec. y.o.y.
Oct.~Dec. y.o.y. Apr.~Dec. y.o.y.
38.1%44.1%
40.9% 34.9%
9.5%
9.9%
2.0%
1.8%
9.7%
9.1%
0
200
400
600
800
1,000
1,200
1,400
FY02 Apr.-Dec. FY03 Apr.-Dec.
Dom. Passenger Int'l PassengerInt'l Cargo Dom. CargoOthers
billion yen
IP
IC
DP
Underlined figures are differences between FY03 and FY02.
FY02 figures are add-ups of JAL/JAS without adjustment for consolidation.

8 ©JAL 2004
Outline of Q3 Account Settlement for FY2003Outline of Q3 Account Settlement for FY2003
Trend in Demand in International Passenger Segment
Number of International Passengers in FY03
40%
50%
60%
70%
80%
90%
100%
110%
120%
Apr. May June July Aug. Sept. Oct. Nov. Dec. Jan. Feb. Mar.
y.o.y.
ForecastActual Results
*Jan. : Flash Report

9 ©JAL 2004
Outline of Q3 Account Settlement for FY2003
Results of International PassengerOutline of Q3 Account Settlement for FY2003
Oct. – Dec. Apr. – Dec.
-21 .7
-1 .7
-20 .3
-11 .5
-30 .0
-20 .0
-10 .0
0 .0
10 .0
20 .0
Revenue RPK ASK Yield
y.o.y .(%)
Effect of FOREX approx. (0.5%)
Revenue 405.4 billion yen
y.o.y. (112.2) billion yen
-6 .6
-3 .5-3 .2 -3 .8
-30 .0
-20 .0
-10 .0
0 .0
10 .0
20 .0
Revenue RPK ASK Yield
y.o.y.(%)
Effect on FOREX approx. (1%)
Revenue 154.6 billon yeny.o.y. (10.9) billion yen

10 ©JAL 2004
Outline of Q3 Account Settlement for FY2003Outline of Q3 Account Settlement for FY2003
Demand & Supply of International Passengers by route (y.o.y.)
Oct. -Dec.
L/F FY03 68.5% FY02 68.1%
-3.3
17.1
-23.3
-15.8
0.61.8
12.7
-17.0
15.3
-2.7
-10.1
-0.4
3.2
-10.6
-5.3-5.6
-40.0
-20.0
0.0
20.0
Continental
Haw
aii
Europe
Southeast Asia
Oceania
Guam
/Saipan
Korea
China
RPK ASKy.o.y.(%)
Apr.-Dec.
L/F FY03 63.8% FY02 70.8%
-10.7
-17.0
-21.6
-30.6
-9.7
-21.7
-29.7
-38.5
0.3
-14.8
-18.0
3.0
-11.0
-17.2
-3.8
-17.6
-40.0
-20.0
0.0
20.0
Contin
enta
l
Haw
aii
Euro
pe
South
east A
sia
Oceania
Guam
/S
aip
an
Kore
a
Chin
a
RPK ASKy.o.y.(%)

11 ©JAL 2004
Outline of Q3 Account Settlement for FY2003
Results of Domestic PassengerOutline of Q3 Account Settlement for FY2003
Growth of Passengers(y.o.y.)
April ~December
Individual Passengers:104%
Total Passengers:102%
96%
98%
100%
102%
104%
106%
108%
110%
112%
114%
Apr. May June July Aug. Sept. Oct. Nov. Dec.
Individual Passengers
Total Passengers
Growth of Domestic Passengers in FY03(y.o.y.) *JAL Group total
Individual Pax. Ratio(Target for FY2003:63%)
April ~December 63.5%
L/F Oct.~Dec. FY03 63.2% FY02 64.2% L/F Apr.~Dec. FY03 65.0% FY02 65.4%

12 ©JAL 2004
Outline of Q3 Account Settlement for FY2003
Results of Domestic PassengerOutline of Q3 Account Settlement for FY2003
Oct. -Dec. Apr.-Dec.
10.8
0.0
1.6
10.8
-5.0
0.0
5.0
10.0
15.0
Revenue RPK ASK Yield
y.o.y.(%)Revenue 168.4 billion yen
(y.o.y.+16.3 billion yen)
6.2
1.62.2
4.6
-5.0
0.0
5.0
10.0
15.0
Revenue RPK ASK Yield
y.o.y.(%)Revenue 512.3 billion yen
(y.o.y.+30.0 billion yen)

13 ©JAL 2004
Outline of Q3 Account Settlement for FY2003
Results of International CargoOutline of Q3 Account Settlement for FY2003
International Cargo Tonnage by route (y.o.y. %)Tonnage Growth in International Cargo
2
5
-3
-10
-5
0
5
10
Pacific
Europe Southeast Asia &Others
-6
-2
-4
-10
-5
0
5
10
y.o.y .(%)
Pacif ic Europe
Southeast Asia& Others
Oct.-Dec.
Apr.-Dec.
85.0%
90.0%
95.0%
100.0%
105.0%
110.0%
Apr. May June July Aug. Sept. Oct. Nov. Dec.
y.o.y.(%)

14 ©JAL 2004
Outline of Q3 Account Settlement for FY2003
Results of International CargoOutline of Q3 Account Settlement for FY2003
Oct.-Dec. Apr.-Dec.
-4.6
0.0
-4.6
-6.0
-3.0
0.0
3.0
Revenue RCTK
y.o.y.(%)
Effect of FOREX approx.(3%)
Revenue 43.3 billion yeny.o.y. (2.0) billion yen
-4.8
-3.7
-1.1
-6.0
-3.0
0.0
3.0
Revenue RCTK Yield
y.o.y.(%)
Effect of FOREX approx. (1.5%)
Revenue 114.7 billion yeny.o.y. (5.8 )billion yen

15 ©JAL 2004
Outline of Q3 Account Settlement for FY2003Outline of Q3 Account Settlement for FY2003
Outline of the Breakdown of Operating Costs
FY02 FY03 Difference FY02 FY03 Difference
Fuel 65.1 62.3 (2.8) 185.3 183.9 (1.5)
Airport Facilities 33.5 34.3 0.8 99.9 99.5 (0.4)
Maintenance 31.4 26.8 (4.7) 85.1 82.4 (2.8)
Passenger Services etc. 14.2 12.6 (1.6) 43.1 35.4 (7.7)
Commisions 33.2 33.3 0.1 101.9 90.8 (11.1)
Aircraft Depreciation 18.6 18.9 0.3 54.9 56.8 1.8
Aircraft Leases 25.4 24.9 (0.5) 76.3 73.3 (3.0)
Personnel 82.1 84.7 2.5 244.2 251.9 7.7
Others 115.4 112.0 (3.2) 355.9 335.7 (19.9)
Total 418.9 409.8 (9.1) 1,246.6 1,209.7 (36.9)Figures in FY02 are add-ups of JAL/JAS without adjustments of reference.
Oct.~Dec. Apr.~Dec.
16 ©JAL 2004
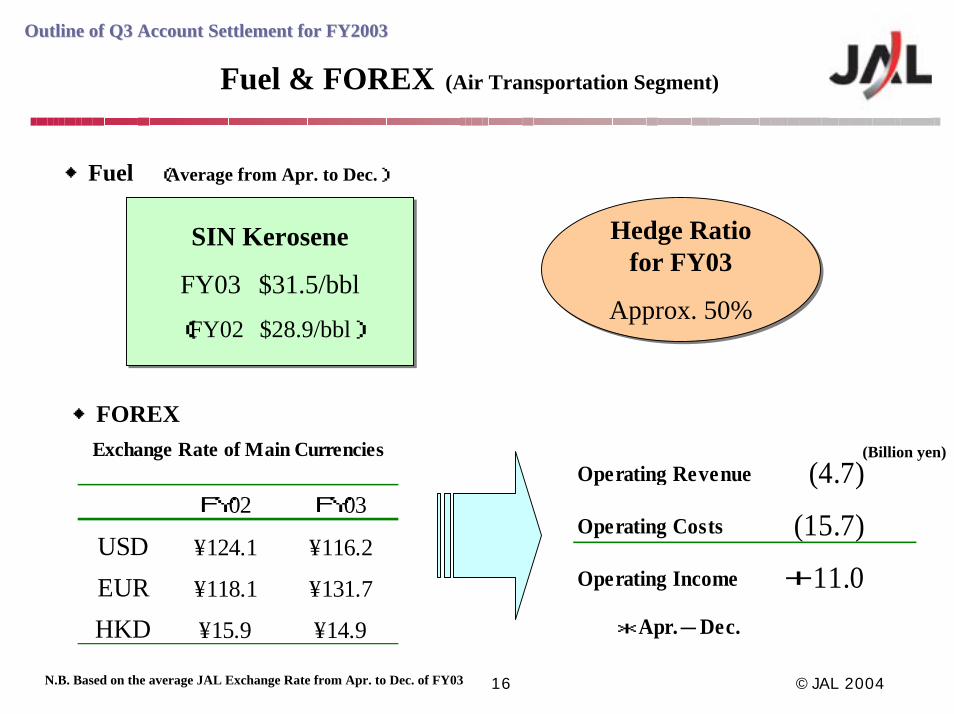
Outline of Q3 Account Settlement for FY2003Outline of Q3 Account Settlement for FY2003
Fuel & FOREX (Air Transportation Segment)
◆Fuel (Average from Apr. to Dec.)
◆FOREX
SIN Kerosene
FY03 $31.5/bbl
(FY02 $28.9/bbl)
SIN Kerosene
FY03 $31.5/bbl
(FY02 $28.9/bbl)
Hedge Ratio for FY03
Approx. 50%
Hedge Ratio for FY03
Approx. 50%
Operating Revenue (4.7)
Operating Costs (15.7)
Operating Income +11.0
*Apr.-Dec.
(Billion yen)
FY02 FY03
USD ¥124.1 ¥116.2
EUR ¥118.1 ¥131.7
HKD ¥15.9 ¥14.9
Exchange Rate of Main Currencies
N.B. Based on the average JAL Exchange Rate from Apr. to Dec. of FY03

17 ©JAL 2004
Topics

18 ©JAL 2004
Topics Topics Flight Plan for FY2004
Network Plan
Domestic Passenger Domestic Passenger
ASK VS.PY(4% )
The greatest aviation network in Japan
Improvement of investment efficiency
More efficient operation of aircraft
Network Plan aiming at profit maximization
Approx. 960 flights per day for JAL Group
International Passenger International Passenger
International CargoInternational Cargo
ASK yr/yr +7% (vs.FY02(4%))
The largest network between Japan & China covering 12 cities in Japan, with 26 routes and 216 flights per week
Increase of Shanghai route
e.g. inauguration of Hanzhou from Tokyo & Osaka
ATK y.o.y. +1%
286 aircraft (Mar. 2003) ⇒275 aircraft(Mar. 2004) ⇒275 aircraft (Mar. 2005) Fleet Plan By retirement of all existing MD11, number of aircraft types decreases from 15 to 14.
MD11 ⇒3 DC10 ⇒4 B777-200ER ⇒3 B777-300ER ⇒2 B767-300ER ⇒4
YS11 ⇒2 A300 ⇒3 Dash-8 Q400 ⇒1 B747-400F(Freighter) ⇒2
retire 12 aircraft introduce 12 aircraft

19 ©JAL 2004
Topics Topics
New Services in Domestic Flights (class J)
Introduction of “class J” replacing “Super Seat”Introduction of “class J” replacing “Super Seat”
Type of aircraft equipped and No. of seats Type of aircraft equipped and No. of seats
“class J” seats are installed in Middle & Large-size aircraft with more than 250 seats
While the number of "class J" seats will be about 3 times as many as the present Super Seats, the total number of seats remains same.
Services Services
- Special blanket and headphone
- Relaxation Oriented
June 1, 2004June 1, 2004 Fare + 1,000 yen Fare + 1,000 yen Start of services Start of services Charge Charge
New reclining system based on ergonomicsNew seatNew seat
Extension of seat
pitch by 20%

20 ©JAL 2004
Topics Topics
Towards the Final Stage of the Integration -1-
Improvement in Service and User-friendliness and Enhancement of Brand StrengthImprovement in Service and User-friendliness and Enhancement of Brand Strength
Airport Airport Reservation Reservation
Timetable Timetable
Uniform Uniform
Cargo servicesCargo services
Unification of toll-free dial
Improvement of User-friendliness
Introduction of new uniforms
Unification of freight mail windows at domestic airports
Integration of counters
Reorganization of Lounges & ban smoking
Introducing New style check-in machines
New style mileage registration machine
“JAL Pet Club”
Increase of automatic check-in machines
Domestic
International
Domestic Flight: 0120-25 -5971Int’l Flight :0120-25 -5931

21 ©JAL 2004
Topics Topics
Towards the Final Stage of the Integration -2-
All domestic flights are unified under new JAL 4-digit flight numbers All domestic flights are unified under new JAL 4-digit flight numbers
Flight No. Depart from Flight No. ~Sapporo 1000~1099 Itami/Kansai 2000~2599 ~Kansai 1300~1329 Hokkaido 2700~2899 ~Itami 1500~1599 Tohoku/Hokuriku 2900~2999 ~Fukuoka 1700~1759 Narita 3000~3099 ~Okinawa 1900~1939 Nagoya 3100~3399 ~Hokkaido 1100~1199 Chugoku/Shikoku 3400~3499 ~Tohoku/Hokuriku 1200~1299 Kyushu etc. 3500~3899 ~Kinki/Shikoku 1330~1499 ~Chugoku 1600~1699 2600~2699 ~Kyushu 1760~1899 3900~3999 ~Amami/Ishigaki/Miyako/Kume 1940~1999 4000~4999
*JTA・RAC flights continue to use 3-digit Flight No. for the time being
LocalRoutes
Extra & SeasonalFlights
To and From Haneda
TrunkRoutes
22 ©JAL 2004
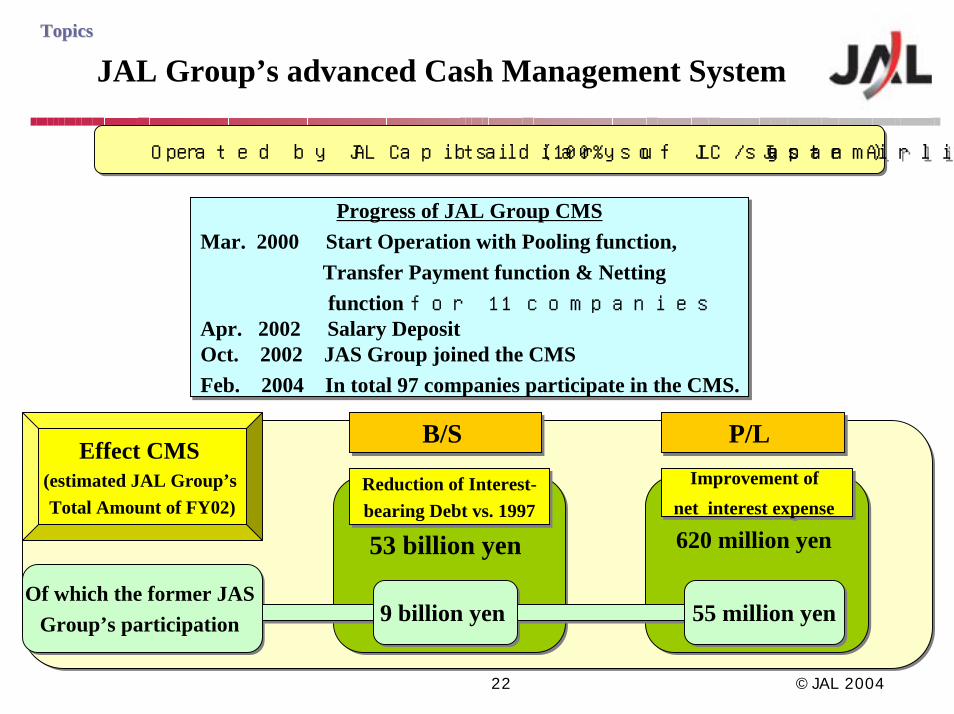
Topics Topics
JAL Group’s advanced Cash Management System
Operated by JAL Capital (100% subsidiary of JLC / Japan Airlines system) Operated by JAL Capital (100% subsidiary of JLC / Japan Airlines system)
Progress of JAL Group CMSMar. 2000 Start Operation with Pooling function,
Transfer Payment function & Nettingfunction for 11 companies
Apr. 2002 Salary Deposit Oct. 2002 JAS Group joined the CMS Feb. 2004 In total 97 companies participate in the CMS.
Progress of JAL Group CMSMar. 2000 Start Operation with Pooling function,
Transfer Payment function & Nettingfunction for 11 companies
Apr. 2002 Salary Deposit Oct. 2002 JAS Group joined the CMS Feb. 2004 In total 97 companies participate in the CMS.
620 million yen 620 million yen 53 billion yen53 billion yen
Of which the former JAS Group’s participation
Of which the former JAS Group’s participation
Reduction of Interest-bearing Debt vs. 1997Reduction of Interest-bearing Debt vs. 1997
Improvement of net interest expense
Improvement of net interest expense
9 billion yen 9 billion yen 55 million yen55 million yen
B/S B/S P/L P/L Effect CMS
(estimated JAL Group’s Total Amount of FY02)

23 ©JAL 2004
Topics Topics
JAL Group’s Homepage – most popular website in Japan-
Aim Revenue increase & Cost reduction by promoting e-marketing
Advantage JMB Member:more than 15 million
Copious contents Integration of Homepages of JAL/JAS
Enhance domestic passenger reservation to 50% of the total domestic passengers through internet by the end of FY2005. Target
Result Revenue through e-reservation system
⇒ estimated 190 billion yen for FY2003 Access:150 million views
The 3rd most selling site in Japan No.1 in the Airline ticket site (Surveyed by Gomez in 2003)Appraisal

24 ©JAL 2004
<Notice>
<Contact Address>
Japan Airlines System Corporation, IR Desk TEL: (03)5769-6097 FAX: (03)5769-6492
Office Hour: Weekday: 9:30-12:00,13:00-17:00
Address: JAL Bldg. 2-4-11, Higashi-Shinagawa Shinagawa-ku, Tokyo 140-8605
(N.B.)
Please refer to the Financial Information (“Gyoseki no Gaikyo” ) for the precise figures on the account settlement. Any statements in this document, other than those of historical facts, are forward-looking statements about future performance, which are based on management’s assumptions and beliefs in light of information currently available, and involve risks and uncertainties. Actual results may differ materially from these forecasts. This document is published as supplemental materials for the Briefing on JAL Group’s Financial Statements for Q3 in FY2003. The copyright of this document belongs Japan Airlines System Corporation.
You can watch this presentation on our Homepage (Sorry! Only in Japanese). Please refer to the following URL: http://www.jal.co.jp/broadband/