jakkur lake as a groundwater charger
TRANSCRIPT

UPTEC W13
Minor field study 15hp
March 2013
Groundwater recharge in Jakkur Lake, Bangalore Possibilities and risks of sewage water reuse Pia Sjöholm

2
Index Abstract ............................................................................................................................................... 3
Referat ................................................................................................................................................. 3
Preface ................................................................................................................................................. 4
Introduction ......................................................................................................................................... 5
Aim ...................................................................................................................................................... 5
Background ......................................................................................................................................... 6
Present water infrastructure in Bangalore ....................................................................................... 6
An overview on Jakkur Lake ........................................................................................................... 7
Wetlands for sustainable water use ................................................................................................. 8
Nitrates in water ............................................................................................................................ 12
Material and methods ........................................................................................................................ 14
Scope of study ............................................................................................................................... 14
Testing procedure .......................................................................................................................... 15
Research on Jakkur Lake ............................................................................................................... 16
Results ............................................................................................................................................... 16
Discussion ......................................................................................................................................... 18
Conclusions ....................................................................................................................................... 19
References ......................................................................................................................................... 21
Written references ......................................................................................................................... 21
Internet references ......................................................................................................................... 21
Personal communications .............................................................................................................. 23

3
Abstract
The aim of this project is to study the nitrate levels of the treated water flowing into Jakkur Lake in
Bangalore, from the treatment plant situated at the inlet to the lake, and thereby value the function of
the lake as a secondary and tertiary wastewater treatment as well as an infiltration basin. Obtained
nitrate levels are used as indicators to study the wastewater flow in the lake, and to find other possible
inflows of sewage which can affect the lakes’ total treatment efficiency. A literature study is done on
wetlands and on groundwater recharge through infiltration basins, and the possibility of recharging
groundwater below Jakkur Lake is evaluated. Water samples are collected around and in the lake and
the samples are tested for nitrate, pH and total dissolved solids. Extra focus is put on research on
nitrates in water.
The risks of groundwater recharge in Jakkur Lake include pollution of wells by bacteria, viruses,
parasites and traces of medicine. Further geotechnical investigations need to be done mainly on the
soil structure under and around the lake, and studies need to be done on the retention time of the water
in the lake. The technical limitations such as fluctuations in efficiency and pollutant migration must be
minimized, which initially could be done by building a constructed wetland and controlling the inflow
to the lake.
Keywords: Ecology, environmental engineering, water treatment, water supply, water shortage
Referat
I detta projekt studeras nitrathalterna i sjön Jakkur i norra Bangalore, som består av en naturlig
våtmark samt en infiltrationsbassäng. Nitrathalter mäts dels i det behandlade avloppsvattnet som
flödar till sjön från avloppsreningsverket vid sjöns inlopp, dels i sjön och i närliggande brunnar. Dessa
värden används som indikatorer på avloppsvattnets flödesväg samt för att hitta övriga flöden av
avloppsvatten in till sjön. Baserat på fältstudier och litteraturstudier görs en bedömning av huruvida
sjön Jakkur är lämplig för sekundär och tertiär behandling av renat avloppsvatten. Litteraturstudier
görs med fokus på reningsprocesser i våtmarker och infiltrationsbassänger. Tagna vattenprover
analyseras även för pH-värde och TDS-halt. Extra fokus läggs på litteraturstudier av biokemiska
processer för nitrat i vatten.
Riskerna med infiltration av renat avloppsvatten inkluderar föroreningar i grundvattnet av bakterier,
virus, parasiter samt medicinrester. För att kunna utvärdera reningsprocesserna i marken behöver fler
marktekniska undersökningar utföras både under och omkring sjön. Vidare behöver vattnets
uppehållstid i sjön undersökas. De tekniska begränsningarna i form av fluktuationer i effektivitet hos
våtmark och infiltrationsbassäng bör minimeras, vilket kan inledas genom att bygga en konstgjord
våtmark och kontrollera inflödet av avloppsvatten in till sjön.

4
Preface
I would like to thank Sida and ATE for the possibility to do this project. I would also like to thank Mr.
S. Vishwanath for his mentorship in India and for sharing his knowledge, Dr. Roger Herbert for his
supervision, Biome Environmental Solutions for welcoming me into their office, Dr. Jenny Grönwall
for her support in Bangalore, and Sara Jansson and Lina Danielsson for their guidance.
Copyright © Pia Sjöholm and Department of Earth Sciences, Air, Water and Landscape Science, Uppsala
University.
UPTEC W13, ISSN 1401-5765
Printed at the Department of Earth Sciences, Geotryckeriet, Uppsala University, Uppsala, 2013.

5
Introduction
As one of India’s fastest growing cities, Bangalore experiences severe problems with supporting
enough amounts of water to the citizens. The natural percolation of rainwater is not enough to balance
the groundwater level because of the amounts of groundwater being pumped up through private and
municipal wells (Department of Mines and Geology 2011). There are no rivers or large natural lakes
close to the city. To meet the city’s water demand, water is pumped from the river of Cauvery, situated
about 100 kilometers southwest of Bangalore. As access to municipal water is not always reliable or
available, a huge amount of the population relies on private wells. Because of the many wells, the
groundwater table in the city centre is radically changing and in many areas wells have to be drilled
deeper after a few years because of a sinking groundwater table. Many wells reach down as far as 200
meters in order to reach deeper aquifers, while shallow wells are drying up (Government of India
2008). A method to restore the groundwater table and thereby prevent it from sinking further is to
release treated sewage water back into the ground through an infiltration basin. Through natural
processes in the ground, the treated water will be cleaned from various harmful elements, and by time
reach the groundwater table.
Aim
The aim of this project is to study the nitrate levels of the treated water flowing through Jakkur Lake
(Figure 1) from the treatment plant situated at the inlet, and thereby value the function of the lake as a
wastewater treatment and a groundwater recharging system. To be able to follow the flow of the
treated water from the treatment plant situated in the lakes’ inlet, high levels of nitrate are used as an
indicator. Obtained nitrate levels are used for studying the wastewater flow in the lake, and to find
other possible sources of nitrate which can affect the lakes’ total treatment efficiency. A literature
Figure 1: Jakkur Lake. In front are water hyacinths covering the shore. In the background are new residential buildings. (Photo: P. Sjöholm)

6
study is done on groundwater recharge and the possibilities of recharging groundwater below Jakkur
Lake are evaluated.
Background
Bangalore is traditionally a city of gardens, irrigation lakes and open wells. Before the huge increase
of population, starting in the 1960’s, percolation by rain was enough to balance the groundwater level
and supply the citizens with water (Das, 2011). For irrigation purposes many reservoirs, locally called
tanks, were built in the city during the last century. The remaining tanks are now used for storing
drinking water, but most of them have recently been transferred into other kinds of infrastructure such
as bus stations and sport arenas.
In the 1960’s there were 280 tanks in Bangalore, of which 141 of were big enough to be considered
lakes. At this time, the population started growing rapidly and in 1971 the population reached 1.7
million. Since then the population has grown about five times its size and was estimated to 8.4 million
in 2011. Of the 141 original tanks and lakes, only 67 are remaining. The IT-industry has bloomed and
industrial areas have developed. In the 1970’s, there was already a need for other sources of drinking
water, and therefore the Cauvery River was tapped for the first time. Today Bangalore is dependent on
both a high amount of private wells and the municipal pipe system tapping Cauvery.
Present water infrastructure in Bangalore
The estimated demand of water to the greater Bangalore area is around 1200 million liters per day,
industrial needs excluded (Das 2011). 870 million liters per day is supplied by the municipal BWSSB,
Bangalore Water Supply and Sewage Board. This leaves a shortfall of 330 million liters per day,
which comes from groundwater sources like private wells. When the industrial needs of approximately
60 million liters per day are included, as well as leakages up to 20% from the BWSSB-system, there is
an enormous shortage of water in Bangalore. The shortage is estimated up to 400 million liters per
day.
This shortage creates an uncertainty among the citizens which is seen e.g. as new houses are built.
Most customers prefer to bore a private well before constructing the house, to ensure their supply of
water. These wells are expensive to drill and are only affordable for people of a certain living standard.
It is also common that a neighborhood share wells. The origin of the water in the wells is often not
known, and therefore nothing is known about potential sources of pollution. Different types of
domestic water purifiers, designed with techniques such as reverse osmosis and UV light, are often
used to clean the water before using it.

7
In the city center, the level of the groundwater is rising due to leaking pipes and uncollected sewage.
At the same time the ground water level is sinking in the outskirts of Bangalore (Vishwanath 2012).
Wells have to be dug lower and a lot of households are not connected to the common water and
wastewater pipe system. Since 2009, rainwater harvesting is mandatory for certain sites. The minimum
requirement includes rainwater storage and ground recharge, which is done by leading rainwater to an
open well.
An overview of Jakkur Lake
Jakkur Lake includes a wetland and a lake. The lake itself is manmade and around 200 years old. It
was initially built to store rainwater. The main source of water today is treated sewage water from the
treatment plant, and storm water. The flow has an assumed direction starting from the treatment plant
in the north flowing towards the outlet in the south of the lake, see figure 2. Since this is a manmade
lake it is likely not to be any groundwater flow into the lake at all, instead water is expected to flow
downwards and sidewise into the ground. This flow will be further explained in the chapter
“Groundwater recharge”. Around the lake are different kinds of human activity, such as banana
plantations, slums, a golf course, and newly built residential buildings. The village of Jakkur is
situated some hundred meters south west of the lake.
Figure 2: Jakkur Lake with treatment plant, wetland and outlet marked (Google maps 2013)
8
Wetlands for sustainable water use
Technical aspects of wetlands
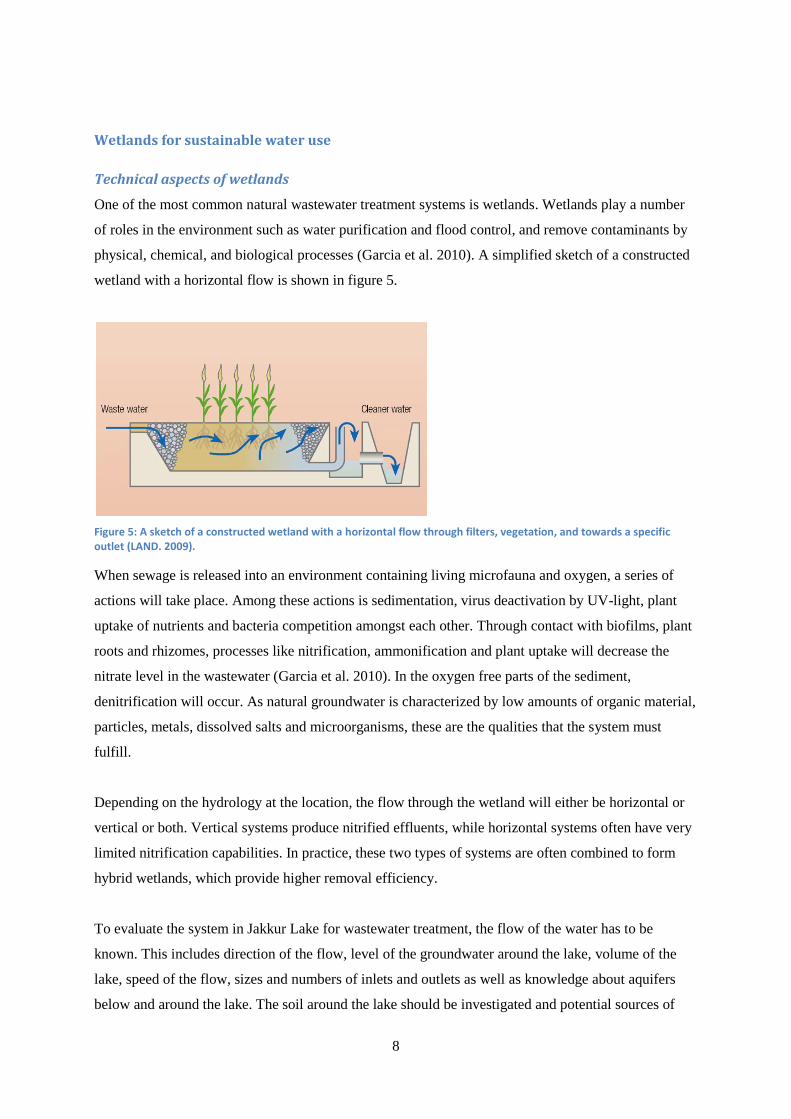
One of the most common natural wastewater treatment systems is wetlands. Wetlands play a number
of roles in the environment such as water purification and flood control, and remove contaminants by
physical, chemical, and biological processes (Garcia et al. 2010). A simplified sketch of a constructed
wetland with a horizontal flow is shown in figure 5.
Figure 5: A sketch of a constructed wetland with a horizontal flow through filters, vegetation, and towards a specific outlet (LAND. 2009).
When sewage is released into an environment containing living microfauna and oxygen, a series of
actions will take place. Among these actions is sedimentation, virus deactivation by UV-light, plant
uptake of nutrients and bacteria competition amongst each other. Through contact with biofilms, plant
roots and rhizomes, processes like nitrification, ammonification and plant uptake will decrease the
nitrate level in the wastewater (Garcia et al. 2010). In the oxygen free parts of the sediment,
denitrification will occur. As natural groundwater is characterized by low amounts of organic material,
particles, metals, dissolved salts and microorganisms, these are the qualities that the system must
fulfill.
Depending on the hydrology at the location, the flow through the wetland will either be horizontal or
vertical or both. Vertical systems produce nitrified effluents, while horizontal systems often have very
limited nitrification capabilities. In practice, these two types of systems are often combined to form
hybrid wetlands, which provide higher removal efficiency.
To evaluate the system in Jakkur Lake for wastewater treatment, the flow of the water has to be
known. This includes direction of the flow, level of the groundwater around the lake, volume of the
lake, speed of the flow, sizes and numbers of inlets and outlets as well as knowledge about aquifers
below and around the lake. The soil around the lake should be investigated and potential sources of

9
pollution such as old landfills must be removed. It is always difficult to control the flow of the water in
a natural system; therefore constructed wetlands are often used instead of natural ones. In a
constructed wetland the flow is controlled as well as the location of different layers of filters
consisting of fine-grained fractions. The function of these filters is to maximize the area of biofilm that
the wastewater passes and thereby increase the microbial inactivation, but also to slow down the flow
to increase sedimentation. The hydraulic retention time is an important parameter that describes how
efficient nitrification, sedimentation, metal removal and microorganism reduction processes are
(Vymazal, Kröpfelová. 2009). Darcy's Law can be applied to describe the flow through a medium if
the hydraulic potential and porosity of the ground are known, such as a flow through filters in a
wetland.
As natural wetland systems in urban environments are sensitive and exposed, water cleaned by this
method can never be guaranteed to be potable. The quality will differ depending on natural causes.
Parameters suitable to monitor in a wetland are plant biomass, oxidation–reduction potential, chemical
oxygen demand, temperature, dissolved oxygen, pH, ammonia, nitrate, phosphates and coliform
bacteria.
Groundwater recharge through an infiltration basin
Infiltration basins have many advantages, such as decreasing storm water peak flows, reducing
pollution of surface waters and recharging groundwater. The basics of groundwater recharge are to
release water onto the ground or into an infiltration basin, letting the water pass downwards through
filters of different kinds, and finally let it reach and refill the groundwater (WRD. 2013). For this to
function, it is important to understand and monitor the flow of the water. In a natural system the water
flows as in figure 6. Groundwater flows into the ground and slowly towards a well or discharge area.
Figure 6: Groundwater flow in a natural system (Wikimedia Commons. 2005)
Since Jakkur Lake is a manmade lake, the water will flow in a different manner than it would in a
natural lake. Jakkur Lake was initially built to store rainwater and the hydraulic potential is likely to
vary between flooding and dry periods. The flow depends on the hydraulic potential in the ground and
will flow from higher to lower potential (Hendriks 2009). Because of variation in hydraulic potential,
10
the flow direction from the lake to the groundwater is likely to vary between positive and negative. A
way to monitor the potential is to compare the groundwater level in wells situated around the lake, to
the water surface of the lake. The hydraulic conductivity of the ground, which depends on soil
structure, will affect the flow of the water between the ground and the lake.
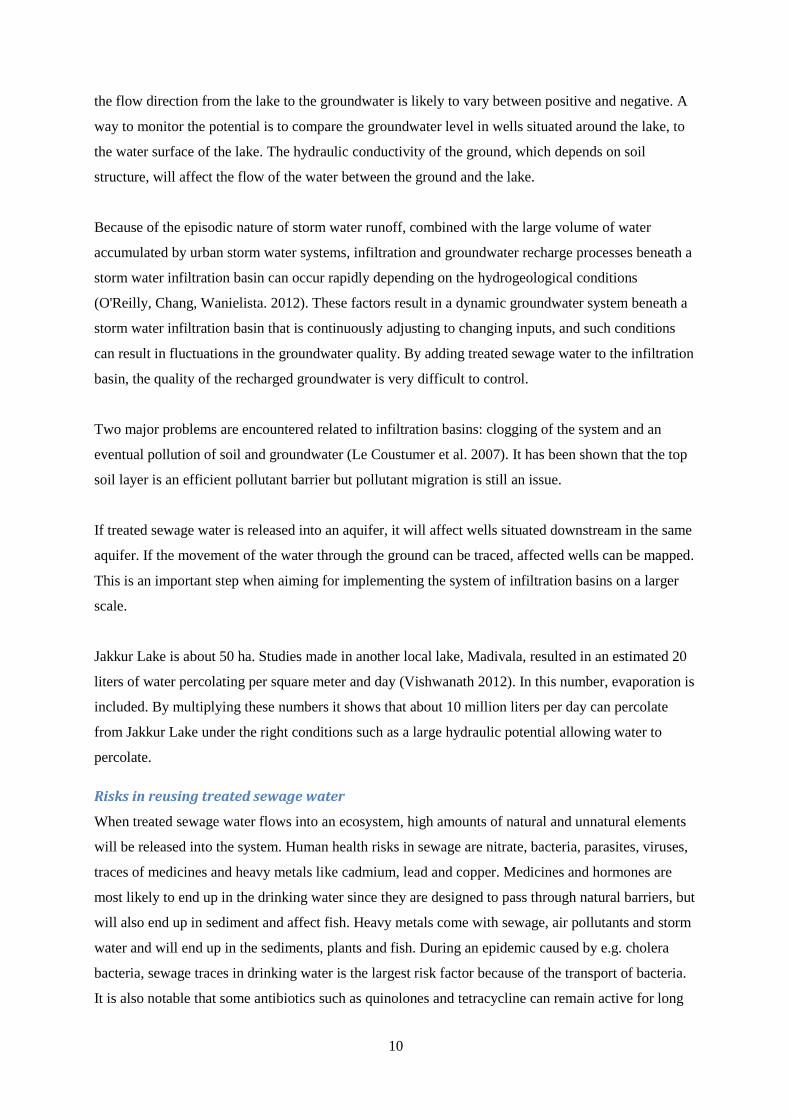
Because of the episodic nature of storm water runoff, combined with the large volume of water
accumulated by urban storm water systems, infiltration and groundwater recharge processes beneath a
storm water infiltration basin can occur rapidly depending on the hydrogeological conditions
(O'Reilly, Chang, Wanielista. 2012). These factors result in a dynamic groundwater system beneath a
storm water infiltration basin that is continuously adjusting to changing inputs, and such conditions
can result in fluctuations in the groundwater quality. By adding treated sewage water to the infiltration
basin, the quality of the recharged groundwater is very difficult to control.
Two major problems are encountered related to infiltration basins: clogging of the system and an
eventual pollution of soil and groundwater (Le Coustumer et al. 2007). It has been shown that the top
soil layer is an efficient pollutant barrier but pollutant migration is still an issue.
If treated sewage water is released into an aquifer, it will affect wells situated downstream in the same
aquifer. If the movement of the water through the ground can be traced, affected wells can be mapped.
This is an important step when aiming for implementing the system of infiltration basins on a larger
scale.
Jakkur Lake is about 50 ha. Studies made in another local lake, Madivala, resulted in an estimated 20
liters of water percolating per square meter and day (Vishwanath 2012). In this number, evaporation is
included. By multiplying these numbers it shows that about 10 million liters per day can percolate
from Jakkur Lake under the right conditions such as a large hydraulic potential allowing water to
percolate.
Risks in reusing treated sewage water
When treated sewage water flows into an ecosystem, high amounts of natural and unnatural elements
will be released into the system. Human health risks in sewage are nitrate, bacteria, parasites, viruses,
traces of medicines and heavy metals like cadmium, lead and copper. Medicines and hormones are
most likely to end up in the drinking water since they are designed to pass through natural barriers, but
will also end up in sediment and affect fish. Heavy metals come with sewage, air pollutants and storm
water and will end up in the sediments, plants and fish. During an epidemic caused by e.g. cholera
bacteria, sewage traces in drinking water is the largest risk factor because of the transport of bacteria.
It is also notable that some antibiotics such as quinolones and tetracycline can remain active for long

11
time periods and will gather in the sediments, increasing the risk of multi resistant bacteria to form
(Mantecón et al. 2011).
Viral infections spread by water are e.g. SARS, hepatitis A, polio and polyomavirus infections.
Among diseases caused by water spread bacteria can be mentioned typhoid fever, dysentery,
legionnaires’ disease and infections caused by salmonella bacteria (Wikipedia. 2012).
The faecal coliform bacteria inactivation in a sub-surface constructed wetland usually ranges between
1.25 and 2.5 log units. It must be taken into account that the concentration of coliform bacteria in
wastewater is affected by daily fluctuations, so the highest concentration in the influent water will not
necessarily coincide with the highest concentration in the effluent water (Garcia et al. 2010). Coliform
bacteria can be used as an indicator of the reduction of other bacteria. The type of wetland chosen has
a high impact on the reduction rate and it is important to keep in mind that the wetland in Jakkur Lake
is not a constructed wetland but lacks many crucial parts of a constructed wetland such as filters and a
controlled flow. The efficiency will be lower than for a constructed wetland.
Figure 7: Children helping out with sample nr. 4 (Photo: P. Sjöholm)
Jakkur Lake is used by children for swimming and playing. The children seen in figure 7, helping out
with sample nr. 4, claimed that there are faeces in the water downstreams and therefor they choose to
swim close to the treatment plant instead.
Benefits of reusing sewage water
The risks associated with sewage contamination in wells must be weighted towards the economical,
ecological, energy-saving and sustainable benefits gained. In comparison to transporting water in pipes
from the Cauvery River, the benefits are huge. Costs are minimal, water losses are minimal, the bird
life benefits from the wetland, and no energy input is needed to refill the wells. It is an ideal solution
from all stand points except health risks and pollution by heavy metals. These risks should be
compared to the same risks in the alternatives, as an example might water pipes under low pressure
take in pollutants through leaks. It is proved to be fecal coliform bacteria, up to around 160 per 100

12
ml, in the water supplied by pipes in many central areas of Bangalore (ATREE 2012). There is no
Indian standard for the amount of fecal coliform bacteria in drinking water, but the Indian standard for
E.coliform bacteria in drinking water is zero. The WHO standard for fecal coliform bacteria in
drinking water is zero.
Prevention of sewage contamination of wells
The initial way to prevent wells from being affected by sewage is distance or a non-leaking
construction of wells reaching unaffected deeper aquifers. The further the distance from the wetland to
the well, the longer time harmful elements will be degraded.
Reduction of pollutants can be modified by manipulating infiltration time, distance between well and
wetland, pre-filtering, retention time of the water in the wetland, and annual maintenance of the
wetland bottoms. Further the water can be treated with domestic water purifiers.
Nitrate in water
A relatively easy way to discover sewage contamination is by testing the level of nitrate in the water.
Nitrate is easier to detect than e.g. microorganisms. Though nitrate itself is not part of the largest
contamination risks considering human health, it can function as an indicator of sewage
contamination.
Nitrates in groundwater and unmanaged leakages
The groundwater structure of Bangalore is complicated with aquifers extending beyond the boundaries
of the groundwater level. There might be several aquifers on top of each other with impermeable or
semi permeable layers in between. Shallow wells are therefore in general more affected by human
activity while deep bored wells can in some cases remain more unaffected.
Nitrate is a substance that develops naturally from organic waste. It is formed by bacteria through
nitrification when e.g. ammonium from urine is released into an environment with enough heat and
oxygen. When a well is polluted by nitrate, uncollected sewage is often the reason. In nature, nitrate is
absorbed by plants as nutrition, as part of a natural circulation. Problems occur when nitrate ends up in
drinking water instead of in the ground. Other explanations for nitrate in a well, except sewage, are
industrial impact or fertilizers. Since the city of Bangalore is very urbanized, fertilizers are in most
cases unlikely to be the cause of nitrate pollution.
When sewage is uncollected, it percolates the ground. Where it ends up depends on the structure of the
ground and the aquifers. The shallow aquifers are more likely to be affected, since the sewage reaches
these aquifers first. On the other hand, old unmanaged deep wells might function as macropores down
to deeper aquifers and thereby transport pollutions very fast. In deeper aquifers with low amounts of

13
oxygen, chemical reactions occur in a different way than close to the surface. It is likely that nitrates
will remain for a longer time in the deeper aquifers because of a lack of plant roots for uptake and a
lack of oxygen for bacterial degradation.
How fast sewage reaches the groundwater depends on the soil structure. The more microorganisms
and plants, the more nitrate will be absorbed before percolating. Macropores such as abandoned deep
wells raise dramatically the hydraulic conductivity, affecting the cleaning process. The soil of
Bangalore is an old tropical soil, high in iron, silicate and aluminum complexes but low in carbon and
nutrients. Since the soil is low in nutrients and carbon, it is likely to have a low microbiological
activity and it is therefore a weak biological barrier for nitrate. On the other hand, the soil is dry and
warm and it is very difficult for water to percolate through it before evaporating. Most of the water
that reaches the ground evaporates. Leakages of sewage to the groundwater are, because of these
conditions, most likely to come from deep pipes and through macropores rather than from open
ditches. Since the groundwater level is higher in the central city, this area is more sensitive to pipe
leakages.
Nitrate health risks
The risk associated with a high intake of nitrate is mainly methaemoglobinaemia (blue baby
syndrome). This is caused by involvement of nitrate in the oxidation of normal Hb to metHb, which is
unable to transport oxygen to the tissues (WHO 2012). This mainly affects infants up to three months
of age in combination with gastrointestinal infections. As most cases of infantile
methaemoglobinaemia reported in the literature have been associated with the consumption of
bacterially contaminated well water, the involvement of infections is highly probable. Therefore
infants might be able to take in a larger amount of nitrate in an environment with higher hygiene
standards. Few cases of methaemoglobinaemia have been reported in older children. For adults there
might be an increased risk of gastric cancer related to a high intake of nitrate, but this is yet not proven
scientifically. The largest risk that follows nitrates in a well is the potential leakage of sewage, and
thereby greater health risks, into the well. These health risks might not be as easy to monitor, therefore
it is better to use nitrate as an indicator.
Nitrate as a tracer
When treated sewage water is released into lakes it will recharge the groundwater while percolating. It
is important to understand the flows so the impact on the ground water level and ground water quality
can be monitored. To follow the flows, nitrate can be used as a tracer. If sewage water is released into
a natural ecosystem, it will bring along high levels of nitrate. These levels will decrease along the way
through the processes mentioned above, like plant uptake and nitrification, and eventually the water
will be potable. When water samples are taken along the wetland and tested for nitrate, the flow of the
14
sewage water is traced. Related to the time the sewage water remains in the wetland, nitrate levels are
reduced. Therefore a decrease in nitrate level should follow in the direction of the flow.
As the nitrate levels are reduced, one can assume that the levels of other pollutants are reduced as well.
This is never guaranteed though and e.g. temperature and nutrients can affect the involved processes.
Bacteria, viruses and parasites will be reduced by a natural concurrence over nutrients, by
sedimentation, by UV light and by predator microbes. Nitrate will be reduced by volatilization and by
microorganisms and plants absorbing it, and the result becomes visible as an increase in biomass.
Material and methods
Scope of study
Initially, this project was to investigate nitrate levels in drinking water wells in a specific area in
Bangalore. Upon arriving in Bangalore, it became apparent that this project could not be pursued, and
instead the project was to address a sustainable drinking water system for Bangalore, which was of
great interest to the local mentor. In particular, his vision included recharging groundwater below
Jakkur Lake.
A major part of this project involves collecting water samples for nitrate analyses so as to study if
there is any change in nitrate level in the wastewater passing through Jakkur Lake. As mentioned
above, the aim of this study is to study the nitrate levels of the treated water from the treatment plant
and thereby value the function of the lake as a wastewater treatment, find other possible sources of
nitrate and investigate the relationship between the distance from the treatment plant and the nitrate
levels in the water. Furthermore, general information on groundwater recharge is presented as a basis
for evaluating the possibilities to recharge groundwater below Jakkur Lake.
In order to fulfill the aims of this study, water samples were taken from different parts of Jakkur Lake
in order to study the nitrate levels in the flow from the sewage treatment plant. Samples from wells
surrounding the lake were also taken for the possibility to see amounts of nitrates from the treatment
plant in the wells, which could be an indicator of a flow from the lake into the underlying aquifer. The
level of total dissolved solids, TDS, was measured as a parameter to value the correctness of the
nitrate levels obtained. The level of TDS should follow the amount of nitrate more or less
proportionally. As a request from the co-workers at the company hosting this project in Bangalore,
Biome Environmental Solutions, general information on nitrates in water were given extra focus in
this report.

15
Testing procedure
Samples were collected twice on two different occasions. Some locations were sampled both times,
some only once. The water samples were taken by walking around the lake and sampling directly in
clean PET bottles as in figure 3. Locations were chosen to cover the whole lake but also to cover
interesting spots such as storm drains, places with high human activity and the outlet from the
treatment plant. Some people moving in the area were interviewed, among these fishermen, young
men swimming and women working with washing clothes. These interviews were done with the help
of a co-worker from Biome Environmental Solutions. Questions were asked about how the people,
active around the lake at the time of the interviews, experience the water quality of the lake. The aim
was to get a better picture on which parts of the lake that were of special interest to sample. This led to
us finding storm drains that we did not notice before. When possible, children playing in the lake were
asked to take water samples to reach deeper spots away from the shore. No samples were taken from
the middle of the lake because of practical obstacles. For the second sampling round, a TDS-meter was
used but data was only collected from a limited number of points. All samples from the second water
sampling round were tested for TDS at a later time.
The nitrate testing was done with a nitrate testing kit named TARA Water Testing Kit for pH and
Nitrate. The name of the company manufacturing these kits is TARAenviro. The kit works by
colorimetry, and three color examples were presented. Water from each sample was boiled dry, see
figure 4. Ammonia and phenoldisulphonic acid were added. The final occurring color was compared
to the three colors represented. The first color, light yellow, represented nitrate levels of 10 mg/l. The
second color, green, represented nitrate levels of 45 mg/l, as the WHO maximum contaminant level
for nitrate in drinking water. The third color, dark yellow, represented nitrate levels of 100 mg/l.
Figure 3 (left): A sample is taken from the water flowing directly from the treatment plant into Jakkur Lake (Photo: P. Sjöholm).
Figure 4 (right): Two samples are being boiled dry as part of the testing procedure (Photo: P. Sjöholm).

16
Research on Jakkur Lake
Most of the data given on Bangalore and Jakkur Lake was collected by literature studies and
interviews. Some information was collected during a conference including professionals and
academics involved in the water infrastructure of Bangalore. Information on Jakkur Lake being a
natural wetland was collected during a workshop that included members of the BWSSB. This
workshop was called Water Supply and Sanitation Solutions for Bangalore and was held the 14th of
December 2012 in Bangalore.
Results
To map the flow from the sewage treatment plant through the wetland, water samples were collected
around the lake. Samples were tested for temperature, nitrate, pH-value and TDS-value. The data from
the water samples are collected in table 1. When the nitrate testing results showed a color seemingly in
between the two given options of 0 mg/l and 45 mg/l, the result was interpreted as 10-45 mg/l. The
circumstances of the sampling site are described and whether the site was tested once or twice. Nitrate
levels from the two occasions follow together with pH-levels, TDS-levels, temperatures and comments
to each site. The TDS-values were not tested at the location but later, in a temperature of 23.2 degrees
Celsius. The pH-values were checked at the same time as the TDS-values.

17
Table 1: Collected data from water samples
Site
no.
Position
(amount of
tests)
Nitrate
level,
first
sample
(mg/l)
Nitrate
level,
second
sample
(mg/l)
pH-
value
TDS
(ppm)
Temp.
(Celsius) Comments
1
Open well, south
side (2) 0 0 7 1080 - Used daily for drinking
2
Outside storm
drain (2) 10-45 0 7 1110 -
3
T-Plant side of
pier (2) 0 0 8 1450 -
In the wetland and by
the inlet to the lake
4
Lake side of pier
(2) 10-45
10-45
7 1130 25
Among swimming
children
5
From treatment
plant (2) 0 0 9 1360 -
Square drain out from
plant
6
Well/swimming
pool (1) 10-45 - 5 - -
High risk of urine
contaminated sample
7 Borewell (1) 0 - 7 - -
8
West shoreline
(1) -
10-45 7 1120 25
By the shore among
water hyacinths
9
Under white res.
Houses (1) - 45 7 1120 -
A slum situated close
by
10
Close to
washing point
(1) - 10-45 7 1120 25
People washing clothes
and swimming close
by
11
South west
lakeside (1) - 10-45 7 1120 25.5
Plenty of water
hyacinths at the spot
12 At south gate (2) - 10-45 7 1120 -
At the outlet of the
lake

18
The sites tested are numbered and shown on the map in figure 9. Numbers with a red circle shows sites
where nitrate was found in either one or both samples. The highest level of nitrate was found at site
number 9.
Figure 9: The sites for sampling marked, and sites where nitrate was found are marked with a red ring.
Discussion
Since the two water tests taken at different times from the outlet of the treatment plant had no traces of
nitrate, the strategy of mapping the flow by the nitrate levels did not succeed. Instead, nitrate showed
in the areas around the lake with most human activity. It seems from the results like Jakkur Lake does
not only receive sewage from one stationary source, but from many small ones situated around the
lake. There might also be sewage in the storm drains leading into the lake. Sewage water from the
village of Jakkur is led to Jakkur Lake and it is likely that this sewage water does not pass the
treatment plant. This has been assumed in earlier studies (Alakananda et al. 2011).
As for the nitrate testing kit, it was sometimes difficult to interpret the result. Often the result had a
color matching none of the given ones. The range went from colorless to green. Since the highest and
the lowest nitrate levels presented by the testing kit had the same color but in different intensities, it
led to some confusion that might affect the results. Further the testing kit procedure was too slow to
use out in the field, since the procedure to prepare one single sample took about half an hour. The
TDS-levels are not correlated to the nitrate levels, which indicate errors in one or both of the
measurement procedures.

19
Figure 8: A test result as an example of the difficulties with colorimetry as the resulting color of the sample does not match any of the given choices (Photo: P. Sjöholm).
To be able to make further calculations on the cleaning efficiency of the wetland and the ground, there
are many parts to further investigate. This includes retention time for the water in the wetland, the soil
structure, the infiltration amount and direction, the ground quality in general, the inlets to the lake and
possible sources of pollution other than treated sewage water. The direction of the flow in and around
Jakkur Lake must be known, and it is likely that the wetland does not have a completed construction to
function as a constructed wetland per definition. Neither the characteristics of a horizontal nor a
vertical wetland matches the wetland in Jakkur Lake, where wastewater from the treatment plant is led
to the wetland surface and then seems to flow mainly horizontally. This indicates that the wastewater
never passes any kind of granular medium.
If municipal recharge of water could be put into function, it would be a huge ecological and
economical relief on the water scarcity of Bangalore. For this to happen, the BWSSB have to take on
responsibility for the quality of the groundwater. As for now, this institution only take on
responsibility for delivering piped water. In a city where the citizens rely on different sources of water
such as rainwater, Cauvery water, tank water, bottled water, and water from bored and open wells, it is
not sustainable that no municipal institution is responsible for groundwater quality. Thereby this
question is highly political and a part of solving the water scarcity for the future generations of
Bangalore.
Conclusions
When it comes to groundwater recharge by treated sewage water, the risks always have to be taken
into account. Activity around and in the lake have to be strictly monitored to prevent e.g. sudden loads
of pollutants. The technical limitations such as fluctuations in efficiency and pollutant migration must
be minimized, which should be done by building a proper constructed wetland and controlling the
inflow to the lake. The economical, political and ecological benefits of pumping less water from
Cauvery River should be further studied.
As water is used for many other purposes than drinking, it is reasonable to supply water of different
qualities depending on what the usage is. I suggest using Jakkur Lake as the infiltration basin that it is

20
today, and develop the wetland into a proper constructed wetland. It is already a common habit for the
people of Bangalore to use different water sources for different purposes. Therefore water supplied by
the municipality for other usage than drinking could be one important step to handle the water
scarcity. This water can be used for washing cars, cleaning drive ways, gardening etc, as long as
information on the quality reaches the consumers. By reusing water, a huge amount of money and
energy can be saved.

21
References
Written references
Alakananda B, Mahesh M K, Supriya1 G, Boominathan M, Balachandran C and
Ramachandra T V. 2011. Monitoring Tropical Urban Wetlands through Biotic Indices. Biodiversity
Journal, 2(2): 91-106.
ATREE Ashoka Trust for Research in Ecology and the Environment. 2012. Information collected
during a conference in December 2012.
Das, S. 2011. BENGALURU Water Problems of the Fastest Growing City of India. Bangalore:
Geological Society of India.
Department of Mines and Geology. 2011. Groundwater hydrology and groundwater quality in and
around Bangalore City. Bangalore: Department of Mines and Geology.
Garcia J, Rousseau D P L, Morato J, Lesage E, Matamoros V and Bayona J M. 2010. Contaminant
Removal Processes in Subsurface-Flow Constructed Wetlands: A Review. Critical Reviews in
Environmental Science and Technology. 40(7):561-661
Hendriks, M. 2009. Introduction to Physical Hydrology. Oxford: Oxford University Press
Le Coustumer S, Moura P, Barraud S, Clozel B and Varnier J-C. 2007. Spatial analysis and temporal
evolution of pollutants in a stormwater infiltration basin – estimation of the mass of trapped pollutants.
Water Sci Technol. 56 (12):93-100 .
O'Reilly A M, Chang N-B and Wanielista M P. 2012. Cyclic biogeochemical processes and nitrogen
fate beneath a subtropical stormwater infiltration basin. Journal of Contaminant Hydrology 133: 53–
75.
Vymazal J, Kröpfelová L. 2009. Removal of Nitrogen in Constructed Wetlands with Horizontal Sub-
Surface Flow: A Review. The Society of Wetland Scientists. 29(4):1114-1124.
Internet references
Google maps. 2013. Jakkur Lake. Available at:
<https://www.google.com/maps?f=q&source=s_q&hl=en&geocode=&q=Jakkur+Lake,+Bangalore,+

22
Karnataka,+India&aq=0&oq=jakkur+lake&sll=13.087368,77.609932&sspn=0.008966,0.016512&vps
rc=0&ie=UTF8&hq=&hnear=Jakkur+Lake&t=h&ll=13.087379,77.609954&spn=0.035865,0.066047
&z=15&iwloc=A> [Accessed 29 January 2013]
Government of India, 2008. Groundwater Information Booklet, Bangalore Urban District, Karnataka.
[pdf] Available at: http://cgwb.gov.in/district_profile/karnataka/bangalore_urban_brochure.pdf [1
May 2013]
Gupta, G, 2012. Will Cauvery quench the thirst of Bangalore?. The new Indian Express. [online].
Available at: <http://newindianexpress.com/cities/bangalore/article1320554.ece> [Accessed 2
November 2012]
LAND, 2009. Use of wetlands for wastewater treatment. [electronic print] Available at:
http://www.landsurvey-intl.com/env_service.php?id=21 [Accessed 29 January 2013]
Mantecón E.B., Villacorta J.M., Valsero M.H. and R. Martínez. 2011. Antibiotic-resistant bacteria in
aquatic environments. Seguridad y Medio Ambiente. [online] Available at:
<http://www.mapfre.com/fundacion/html/revistas/seguridad/n124/articulo3En.html> [Accessed 27
October 2012]
TaraEnviro. Homepage: www.taraenviro.com.
Wikimedia commons, 2005. Groundwater flow. [electronic print] Available at: <
http://en.wikipedia.org/wiki/File:Groundwater_flow.png> [Accessed 18 January 2013]
Wikipedia a. 2012. Waterborne diseases. [online] Available at:
<http://en.wikipedia.org/wiki/Waterborne_diseases#Viral_infections> [Accessed 26 October 2012]
Wikipedia b. 2012. Wetland. [online] Available at: < http://en.wikipedia.org/wiki/Wetlands>
[Accessed 26 October 2012]
Wikipedia c. 2012. Constructed wetland. [online] Available at:
<http://en.wikipedia.org/wiki/Constructed_wetland> [Accessed 26 October 2012]
WHO World Health Organization, 2011. Nitrate and nitrite in drinking-water, background
document for development of WHO Guidelines for drinking-water quality. [pdf] Geneva: World
Health Organization. Available at:

23
<http://www.who.int/water_sanitation_health/dwq/chemicals/nitratenitrite2ndadd.pdf> [Accessed 26
October 2012]
WRD, Water Replenishment District of Southern California. 2013. Groundwater Recharge with
Recycled Water [online] Available at: <http://www.wrd.org/water_quality/recycled-water-
groundwater-recharge.php> [Accessed 28 January 2013]
Personal communications
S. Vishwanath, 2012. Interview by P. Sjöholm.

24