jacob habinek, adam goldstein, and neil fligstein ... · 1 a field-theoretic approach to the...
TRANSCRIPT

1
A field-theoretic approach to the transformation of subprime lending, 1993-2008
Jacob Habinek, Adam Goldstein, and Neil Fligstein
Department of Sociology
University of California, Berkeley
Berkeley CA, 94720
April 2012
2
A field-theoretic approach to the transformation of subprime lending, 1993-2008
Abstract
How do the boundaries of markets change? Our paper shows that field boundaries can
change as both membership in the field and actors’ tactics redefine the very structure of the field
over time. We also show how the dynamics of conflict in the field are part of the fabric of this
ongoing structuring. As a case study, we examine the development of the US subprime
mortgage lending industry from its initial expansion in the 1990s to its disastrous collapse in the
financial crisis of 2008. The partial repeal of the Glass-Steagall Act in 1999 opened the
boundaries between securities trading and mortgage banking to contestation. In the years that
followed, huge changes occurred in the subprime lending industry, including the entry of large
commercial and investment banks, a more than six-fold increase in lending volume, and an
integration of the entire industry in the hands of a few large firms. However the transformation
of the subprime lending industry was less a matter of the elimination of legal barriers to entry
than a result of changes in the strategies employed by firms. Within the field of subprime
lending, mortgage originators like Countrywide and GMAC had been active in both lending to
homebuyers and the production of mortgage-backed securities since at least the 1990s, and the
expansion of subprime lending in 2003 and 2004 was driven primarily by these vertically-
integrated specialists. The entry of major investment banks into subprime origination in 2006
and 2007 and the subsequent losses they suffered came about not because of changes in the
definition of market boundaries but because investment banks adopted the same tactics as
specialists in this high-risk industry.
Keywords: field theory, organizations, sociology of finance

3
Introduction
A major current of thought in sociological research seeks to recast social action across
diverse contexts as occurring within local social orders called fields (Bourdieu and Wacquant
1992; DiMaggio and Powell 1983; Fligstein 2001; Martin 2003). The language of fields is now
widely used in sociology, particularly Bourdieu’s influential formulation (Bourdieu and
Wacquant 1992:94–115; c.f. Emirbayer and Johnson 2008; Go 2008; Ray 1999; Steinmetz
2007). Yet the implications of field-theoretic concepts for empirical research remain only partly
explored. Fields are often invoked in studies as a heuristic device in which the positions
constituting the field are defined in an a priori fashion by the analyst and represented either as
bounded study populations or in the form of an arbitrary diagram (e.g. Bourdieu 1996:122–4;
Lewin 1952:70–3, 136, 138). Only rarely are attempts made to define the structure of a field
empirically using observed patterns in the distribution of individuals’ actions (e.g. Bourdieu
1984, 1988; Slez and Martin 2007).
Understanding the conditions under which fields emerge, become organized, and change
is a central concern for proponents of the field-theoretic perspective within the sociology of
organizations (Bourdieu 1996; DiMaggio and Powell 1983; Fligstein 2001:75–86; Fligstein and
McAdam 2011). This paper explores the problem of the boundaries that help define the limits of
any field using the development of the subprime mortgage lending industry as a case study.
Studies of a variety of industries have revealed the importance of the relationships between
different types of actors in adjacent fields to the creation, stability, or transformation of markets
(e.g. Gulati and Gargiulo 1999; Podolny 1993; Powell et al. 2005; Stark and Vedres 2006; Uzzi
1996, 1999). However few of these studies attempt to examine how the actions of firms in an
industry work to produce or undermine the very categories that define the structure of the field
(although for two approaches to this problem, see Powell et al. 2005; Stark and Vedres 2006).

4
Instead, the precise boundaries between different markets or sectors are often taken for granted
or assumed to be identical to regulatory categories.
In the case of subprime mortgage lending, these questions also raise important
substantive issues. In 1996, U.S. subprime lending was a marginal financial activity in the US
economy. The largest players were a diverse cast of minor companies from the margins of
consumer finance, including an automobile loan company (Associates First Capital), a home
construction contractor owned by a Belgian grain-trading firm (Conti), and non-bank retail
lender (The Money Tree).1 By 2007 however, subprime mortgage lending had become a core
activity of some of the largest banks and financial services companies in the world. This
transformation involved significant realignments in the activities of firms across all sectors of the
subprime lending industry. The rise of private mortgage securitization altered the relationship
between residential mortgage lending and securities trading by turning mortgages into a source
of raw material for the manufacture of securities by large banks. The involvement of the
financial sector in subprime mortgage lending ultimately resulted in huge losses for investors
worldwide and left a number of “too big to fail” financial institutions in danger of imminent
collapse.
In order to understand the processes behind this transformation, we begin by discussing
the implications of treating markets as fields for understanding the relationship between market
boundaries, firm strategy, and the structure of markets. Then we move on to describe the growth
of the subprime mortgage lending industry and the transformation of its organization over the
course of the 1990s and 2000s, focusing specifically on the changing relationship between the
primary market for mortgages and the secondary market for mortgage-backed securities. Finally,
1 Today, The Money Tree is perhaps the most widely remembered of these firms because of its television advertisements featuring former Yankees shortstop and Hall of Famer Phil Rizzuto. For examples, see http://www.youtube.com/watch?v=oo_stdamO_c, http://www.youtube.com/watch?v=nDQHQkuv9l0.

5
using data on the top firms in each sector of the subprime mortgage industry, we examine how
the boundaries between different sectors and the tactics of participating firms evolved in
response to regulatory changes, economic conditions, and the strategies of other firms between
1998 and 2007. We find that the tactics of firms involved in primary subprime lending remained
surprisingly consistent during this period, but that as subprime mortgages became a key but
shrinking resource for securitization activity, major investment banks aligned their tactics with
vertically-integrated subprime mortgage lenders, entering the subprime mortgage origination
market even as it began to unravel.
Field theory and the problem of boundaries
We define fields as local social orders in which actors share a common goal and a
mutual orientation to each other (c.f. Bourdieu and Wacquant 1992; Fligstein 2001; Martin
2003). Fields are socially constructed arenas within which actors vie for advantage with one
another and wherein the rules are determined at least in part through the relations among the
actors constituting the field. Field theory is thus a cultural approach to social action in the sense
that the rules governing the field are a product of intersubjective processes of alignment towards
a shared understanding of both what is at stake in the field and how to interpret the actions of
others. Fields are specifically local orders because the boundaries of any fields’ influence are
limited to the population of actors who are actually invested in its stakes and attuned to the other
actors in the field.
However fields are not necessarily homogenous social orders in which all actors share
similar identities or tactics. In unsettled or rapidly changing conditions, the rules governing any
field may be the subject of contestation or simply up for grabs and the strategies employed by

6
actors may not suggest any coherent logic. More importantly, even in a relatively settled, stable
field, actors may differ considerably in their understandings of how to pursue their goals based
on their relative positions within the field. Dominant actors may work to preserve the conditions
responsible for their own advantage, while less powerful actors may either challenge the status
quo or choose to accept a lesser role that avoids directly competing with dominant actors. What
matters for the stability of a field is not that everyone agrees to act the same way, but that
dominant actors are able to defend a particular understanding of the principles governing action
within a field that also reproduces the conditions of their own dominance. 2 This understanding
defines how actors behave in terms of their positions within the field, and therefore a stable field
can be thought of as constituting a self-reproducing structure of defined roles (c.f. White 2002).
Since the imperatives of social action in a field are at least in part dependent upon an
actor’s sense of position relative to other actors, the structure of a field is never entirely fixed. In
particular, the boundaries of a field are always potentially at stake in defining the relationship
between two positions. Even in a highly structured field with clear positions, actors may
disagree sharply about the actors to which they must attend and the positions which are irrelevant
to their conception of the field. Beliefs about who is in the field and who is not may become
polarized based on the distribution of resources (Fligstein 2001), geographic location (Bourdieu
1992), or the institutional location of actors (Bourdieu 1988). Such fields are highly organized,
but are marked contestation over two or more understandings of the boundaries of the field
among actors occupying different positions. This problem is especially pressing where a
2 This feature distinguishes field theory from both cultural sociology in the tradition following Geertz, which often treats the forms of shared understanding constituting a culture as a complex but homogeneously shared whole (Geertz 1973; Wuthnow 1987). It also distinguishes field theory from the approach of much of mainstream economics, which tends to assume that the preferences governing strategy choice are exogenous to the context of social action and therefore treats divergence primarily as a matter of opportunism (for the role of opportunism in agency theory, see Jensen and Meckling 1976; in transaction-cost economics, see Williamson 1973). Both of these approaches locate the sources of shared patterns of action outside of the context of action (and thus often outside the scope of research).
7
multiplicity of different distinctions may be used to define the structure and boundaries of a field
or where, as in the case of a field of organizations, the boundaries of the actors themselves factor
into these conflicts.
Market structure and firm tactics
Among organizational sociologists, the concept of field has enjoyed widespread use in
recent years as a tool for understanding the behavior of firms in a variety of different markets
(DiMaggio and Powell 1991; Emirbayer and Johnson 2008). These studies treat organizational
behavior not as a deterministic process, but as product of deliberate strategic action on the part of
leaders within firms. Of course on the broadest level, the goal of firms’ activities is relatively
clear: to make money. But the key issue for any firm is how to make money. Organizational
sociologists suggest that directors of firms adopt strategies that ensure the survival of the firm
and protect it from the uncertainties generated by a competitive environment (for detailed
discussions, see Fligstein 2001; White 2002). When these strategies are widely recognized
within a market, they constitute what Fligstein (2001: 35) calls a “conception of control” that
both describes the tactics used by firms and constitutes an interpretive frame for understanding
the actions of other firms.
Conceptions of control define both the principles of firms’ internal organization and
actors’ understandings of the structure of the market. The tactics adopted by any firm shape its
internal organization, but the choice of tactics is also embedded in members of the firm’s sense
of its position relative to other actors in the market. When a firm attempts to impose a new
conception of control on a market, it may also thus redefine the boundaries of both the market.
For example, efforts to avoid destructive price competition with competitors may lead firms to

8
divide a market into different niches by constructing new distinctions among producers (Carroll
1985; Carroll and Swaminathan 2000; White 2002). On the other hand, firms may also attempt
to control potential sources of uncertainty by dissolving existing boundaries. Firms can
vertically integrate production in order to make uncertain relationships with suppliers or
distributors more manageable (Coase 1993 [1937]; Knight 1964 [1921]), or move into new and
unrelated markets in order to reduce its dependence on any one product (Kay 1997). Through
these processes, firm tactics can potentially transform market structures.
Before attempting to show how firm tactics are involved in the production of market
structures, it is a good idea to make clear what we mean by structure. Our definition of field
implies that within a given market, firms’ identities provide information to other actors about
their probable goals, expectations, and strategies. To the extent that identities align into a
structure of one or more distinct positions, we make also speak of it as having a structure. In
order to develop the implications of this approach to market structure, it is useful to consider a
hypothetical industry in which firms can act as either suppliers or manufactures or both. To
represent the structure of this industry visually, we can assign each firm a position in a two-
dimensional Cartesian space based on its volume of production in each activity. Figure 1
presents four possible distributions of firms in this hypothetical industry. 3
<<Figure 1 about here>>
An unstructured industry. Figure 1a presents an extreme case of disorganization. In this
figure, there is absolutely no alignment among firms around a shared approach to relationship
3 The definition of organization in a field presented here also further implies that the inverse of organization is entropy, the amount of arbitrariness in the distribution of firms across markets. Given that the distribution both social actors and particles can also be represented in terms of Cartesian coordinates, there may be useful analogies to the statistical theromodynamics developed by Boltzmann and Maxwell, which also attempt to quantify the amount of non-arbitrary movement within an N-dimensional space. If it is possible to develop this analogy further, then it may be the case that statistical thermodynamics provides a better model for quantifying the structure of social fields than the classical field theories of Newton or Faraday. For the use of the same analogy by Maxwell, see Porter (1986).

9
between the suppliers’ market and manufacturers’ market. In terms of firm strategy, the
relationship between manufacturing and supply appears to be completely up for grabs. In terms
of information, the position of any given firm in the manufacturing market implies nothing about
its position among suppliers. Statistically speaking, the distribution of firms is consistent with
independence. However it is not the case that these two markets are structurally separate. Each
market partly overlaps because any given firm may participate in one market, the other market,
or both. The absence of structure also implies the absence of clear boundaries between
manufacturing and supply.
A partitioned industry. We do not typically expect markets to resemble Figure 1a.
Instead, we usually imagine that any given market is associated with a distinct set of firms.
Organizational ecologists, for example, have long noted that high barriers to entry, the costs of
acquiring information, and legitimacy constraints on firm strategy tend to create relatively stable,
homogenous populations of firms within different markets (Hannan and Freeman 1977, 1989).
Figure 1b presents just such a case. In contrast to the first case, we can now speak of two
markets with clear boundaries, each defined by a unique strategy and a clear group of firms.
Here, the relationship between the two markets is strong and mutually exclusive: participation in
one market implies not participating in the other. If a supplier were to enter the manufacturing
market, that firm would appear very much out of alignment with other firms, and its actions
would run counter to the overall structure of the industry.
An integrated industry. However if all firms were to make this decision, then the industry
might align around a strategy of vertical integration, in which manufacturing and supply are both
done by the same firms, as in Figure 1c. Although this implies the dissolution of the boundary
between manufacturing and supply, it is a common strategy in industrial organization wherever

10
firms seek a reliable supply of inputs in a competitive marketplace (Knight 1964 [1921]). In this
case, the position of a firm in one market still tells us a great deal about its position in the other
because being a large manufacturer now also implies being a large supplier. Firms differ from
one another based on size, but not based on the markets in which they participate because nearly
all of the variation within the industry falls along the diagonal of the plot. There are no
boundaries between manufacturing and supply in this case, yet this field nevertheless has a clear
structure.
A contested industry. At the same time, there is no reason to expect that the organization
of firm strategies in fields will relate to the activities under study in such direct ways. Figure 1d
presents a more problematic, but equally plausible case. Here, firms are active in both
manufacturing and supply, but strongly organized into two distinct groups. As in Figure 1a, no
single understanding of the relationship between supply and manufacturing predominates, but
here the position of a firm in one market nevertheless tells us quite a bit about its position in the
other. Although these two markets are not well partitioned, the structural pattern here is
intuitively accessible to the eye. Two clusters of firms exist, and within each cluster of firms
there is a positive relationship between supply and manufacturing.4
The relationship between manufacturing and supply appears to be open to some dispute
in this case. Perhaps manufacturers and suppliers are both attempting to vertically integrate
production, but have encountered some degree of resistance in entering each others’ markets. If
so, they would be pursuing the exact same goal using opposite strategies: suppliers are
4 It is also worth noting that this case poses a challenge for the usual kind of linear models employed by social scientists. In Figure 1c, a positive, linear relationship exists between the two markets, and therefore this structure is also easy to describe using the customary tools of linear regression. However in Figure 1d, unless we are able to identify a categorical variable which cleanly divides the observations into the two clusters, we would be forced to conclude using linear regression that the relation between manufacturing and supply is negative and deviations from this trend constitute residual error, in contrast to the pattern immediately apparent here.

11
attempting integrate production forwards towards end buyers, while manufacturers are
attempting to integrate backwards. On the other hand, it may also be the case that the two groups
of firms are attempting to avoid direct competition with one another, and are divesting
themselves from each others’ businesses.
The relationship between firm tactics and market boundaries appears to be especially
salient in the case of the US subprime mortgage lending industry. Beginning with the partial
repeal of the Glass Steagall Act in 1999, the legal boundaries between mortgage lending and
securities trading were removed, opening the relationship between these activities to increased
contestation. In the years leading up to the collapse of the housing market in 2007 and 2008, the
mortgage lending industry became both more horizontally integrated and vertically integrated as
subprime lenders, commercial banks, and investment banks all moved into each others’ markets.
Before exploring these developments in detail, we must first provide the some background
information on the development of subprime mortgage lending since its inception and its
relationship with the broader US financial sector.
A short history of the subprime mortgage lending industry
Subprime mortgage lending is a relatively new activity. Indeed, mortgage securitization
only goes back to the 1970s (Kendall 1996). Until the 1980s, most people got their mortgages
from a local bank, most likely a savings and loan bank. The bank would lend the funds and hold
onto the mortgage until it was paid off or the house was sold. Figure 2 describes the way the
mortgage industry is currently organized. Nowadays the borrower goes to a lending company
(frequently a bank, but not exclusively) called an “originator” because they make the initial loan.
Unlike traditional savings and loan banks, these companies do not hold on to the mortgages they

12
create. Instead, they sell the mortgages in order to recapture their capital and move back into the
primary market to make more loans (Kendall 1996; Sellon and VanNahmen 1988).
<<Figure 2 about here>>
The mortgages are then packaged into something called a special purpose vehicle by an
“issuer,” which may be the originator, a wholesale purchaser such as Fannie Mae or Freddie
Mac, or a private financial company or investment trust. This vehicle converts the mortgage
pool into an asset that pays a rate of return based on the interest payments of the original home
buyers. An “underwriter” (sometimes the issuer, but often an investment bank) divides the pool
into tranches, arranged to have each tranche evaluated by ratings agencies, and brokers the sale
of bonds from each investment-grade tranche to investors. In this way, mortgage pools are
structured so that investors can buy riskier bonds if they want a higher rate of return or less risky
bonds that pay a lower rate of return. These bonds, called mortgage-backed securities (hereafter
MBS) are held by the issuer or sold to investors including banks, mutual funds, and private
investors in the United States or around the world. This secondary market for MBS thus
resembles production in many other large industries, with originators in the primary market
acting as suppliers, issuers as manufacturers, and underwriters as dealers.
The development of the mortgage-backed security market, 1993-2008
The mortgage securitization industry did not emerge overnight. The first MBS were
issued in the 1970s by Ginnie Mae, Fannie Mae, and Freddie Mac, quasi-private government-
sponsored enterprises (GSEs) created during the Johnson Administration to expand access to
homeownership (Quinn 2008; Sellon and VanNahmen 1988). The private MBS market did not
begin to grow until the 1980s and 1990s, after regulatory changes and the demise of many
13
savings and loan banks in the savings and loan crisis cleared the way for the expansion of
mortgage sales and securitization. It was not until the 2000s that the MBS market began to shift
away from conventional or prime mortgages issued by the GSE and carrying the explicit or
implicit guarantee of the federal government to various types of subprime and unconventional
mortgages issued by private companies (for further details, see Fligstein and Goldstein 2010).
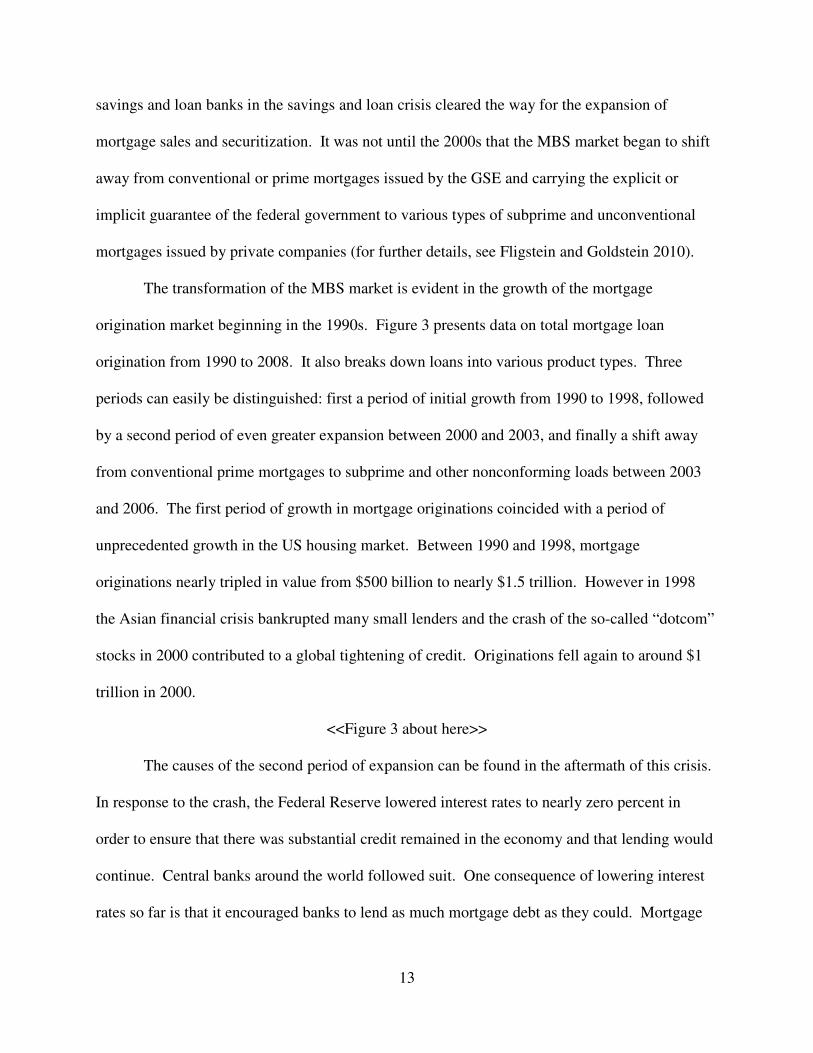
The transformation of the MBS market is evident in the growth of the mortgage
origination market beginning in the 1990s. Figure 3 presents data on total mortgage loan
origination from 1990 to 2008. It also breaks down loans into various product types. Three
periods can easily be distinguished: first a period of initial growth from 1990 to 1998, followed
by a second period of even greater expansion between 2000 and 2003, and finally a shift away
from conventional prime mortgages to subprime and other nonconforming loads between 2003
and 2006. The first period of growth in mortgage originations coincided with a period of
unprecedented growth in the US housing market. Between 1990 and 1998, mortgage
originations nearly tripled in value from $500 billion to nearly $1.5 trillion. However in 1998
the Asian financial crisis bankrupted many small lenders and the crash of the so-called “dotcom”
stocks in 2000 contributed to a global tightening of credit. Originations fell again to around $1
trillion in 2000.
<<Figure 3 about here>>
The causes of the second period of expansion can be found in the aftermath of this crisis.
In response to the crash, the Federal Reserve lowered interest rates to nearly zero percent in
order to ensure that there was substantial credit remained in the economy and that lending would
continue. Central banks around the world followed suit. One consequence of lowering interest
rates so far is that it encouraged banks to lend as much mortgage debt as they could. Mortgage

14
lenders could borrow money at approximately one percent and loan it to homebuyers at five to
seven percent. Strong demand from investors in the bond market for relatively safe, high-yield
investment also increased the appeal of producing MBS. In order to generate new mortgages to
sell or package, mortgage lenders sought out new local real estate markets where they could
make loans and encouraged homeowners to refinance their existing loans by offering favorable
interest rates. The rapid expansion of mortgage lending during this period is astonishing:
mortgage origination rose 400 percent in four years to almost $4 trillion in 2003.
In 2004, the MBS market experienced a supply shock. Approximately $2.6 trillion worth
of prime or conventional mortgages were produced in 2003, but this dropped by nearly half to
$1.35 trillion in 2004. The steep decline in mortgage origination reflected neither weakness in
the housing market nor slackening demand from the secondary market for MBS. Instead, a
saturated market for conventional mortgages and an interest rate hike led to a steep drop in the
refinancing activities which had driven the boom. Conventional mortgages, as well as Federal
Housing Administration (FHA) and Veteran’s Administration (VA) loans, had to conform to
relatively strict lending criteria and could not be easily increased. Beginning in 2004 the
production of all forms of unconventional loans including home equity loans, Alt-A, subprime,
and Jumbo increased rapidly as banks sought out new mortgage customers 5 In 2004, these four
categories exceeded the size of the prime market for the first time ever, and by 2006 accounted
for fully 70 percent of all loans.
It is worth taking brief note of who the buyers were for MBS during these years. Figure
4 documents the holdings of MBS from 2002 to 2008. Contrary to accounts in the popular press,
5 Home equity loans (HEL) refer to loans made against the value of the equity in a house rather than the refinancing of an existing loan. These were frequently used as a line of credit or second mortgage. Alt-A and subprime mortgages (sometimes called “B” and “C” mortgages to denote their lower bond ratings) were made to people with poor credit history or who lacked the ability to make a large down payment. Jumbo loans have higher interest rates because the loan amount exceeds a value set by the FHA each year.

15
the GSEs did not increase their holdings of MBS after 2003 and beginning in 2004 their relative
share of holdings overall declined. Instead, private investors sought out MBS as an investment
that could yield 6 to 7 percent, well above the 1 to 2 percent cost of borrowing money.
Commercial banks increased their holdings from $650 billion in 2002 to $1.1 trillion in 2007.
Mutual fund operators began to buy MBS as well and went from approximately $400 billion to
nearly $850 billion. Other private investors including hedge funds (not shown) also increased
their holdings from $25 billion to nearly $700 billion. Most spectacularly, foreign investors
increased their holdings of MBS from $200 billion in 2002 to over $1.2 trillion by 2006. The
demand for “safe” high yield bonds attracted capital to the US MBS market from around the
world.
<<Figure 4 about here>>
The concentration and integration of mortgage lending
The expansion of the subprime lending market and the proliferation of mortgage
securitization tools must be understood in the context of the changing structure of the mortgage
lending and securitization industry, particularly the role of large banks. Table 1 shows that in
1996, the origination and packaging of subprime mortgages was mostly done by small specialist
lenders like Aames and The Money Store, regional banks like Equicredit, Long Beach Mortgage,
and AMRESCO, or subsidiaries of industrial conglomerates like Associates (part of Ford Motor
Company), Residental (part of General Motors), and ContiMortgage (part of Continental Grain, a
grain-trading and construction company). By 2007, both subprime origination and issuance were
dominated by major investment banks like Lehman Brothers, Bear Stearns, and Merrill Lynch.
Large commercial banks like Citibank and Wells Fargo had also become deeply involved in all

16
stages of the market. A few mortgage lending specialists like Countrywide and Option One also
grew along with the subprime lending industry and occupied strong positions across both
markets.
<<Table 1 about here>>
How did this happen? One of the least remarked features of the mortgage origination
market is the degree to which it became concentrated between the early 1990s and the mid-2000s
(although for exceptions see Fligstein and Goldstein 2010; Kaufmann 2009). The top 5
originators in Table 1 controlled only about 20 percent of market share in 1996, a relatively low
concentration ratio. By 2007, the market share of the top 5 had grown to nearly 50 percent. If
we examine the change of the market share held by the top 25 mortgage lenders overall and in
subprime, shown in Figure 5, the trend is even more dramatic. In 1990, the top 25 lenders
accounted for less than 30 percent of market share, but by 2007 they accounted for over 90
percent of market share. The concentration of subprime lending closely parallels the overall
development of the mortgage origination market. Large banks entered these markets beginning
in the 1990s with the goal of expanding their market share and after 2000 aggressively used
securitization as a way to raise money for mortgages and to sell them. Although the GSEs and
small independent lenders are often blamed for the lending practices which led to financial crisis,
it is clear that by the time subprime mortgage lending began to expand in 2003 and 2004, all
sectors of the market were already dominated by large banks with a nationwide presence.
<<Figure 5 about here>>
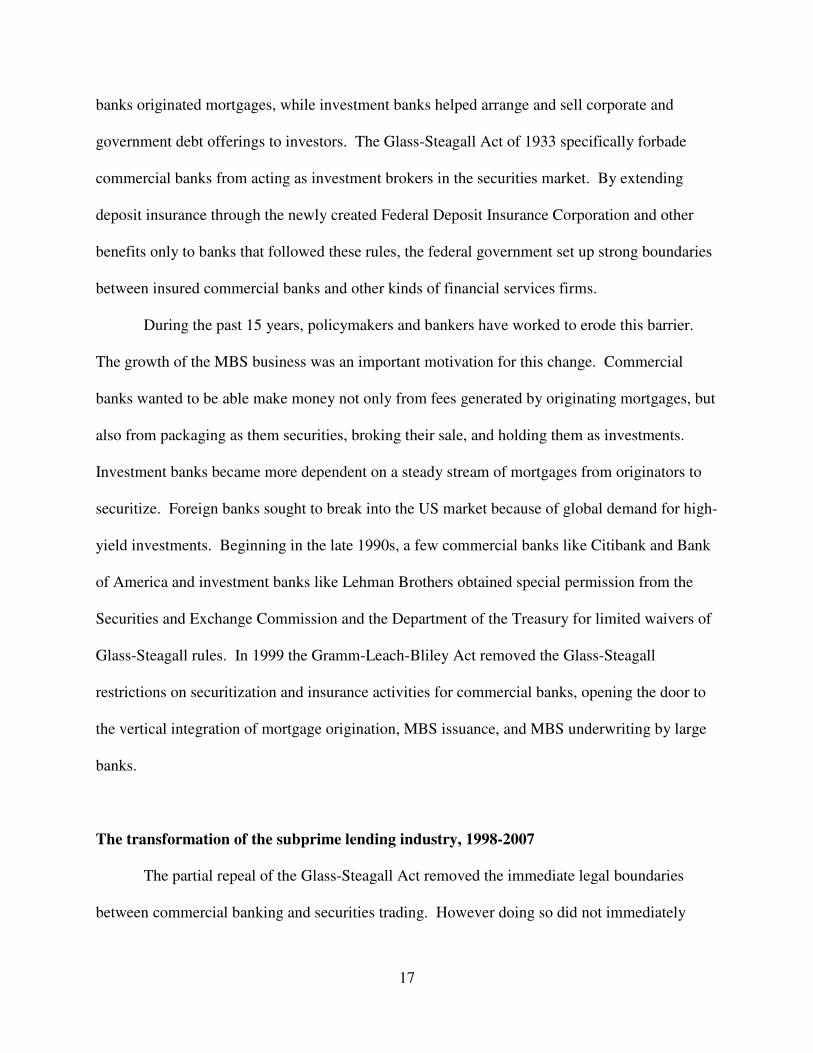
The relationship between primary mortgage lending and the financial sector also changed
with the expansion of the MBS market. Since the 1930s, mortgage lending and the sale of
securities have generally been two separate businesses. Commercial banks and savings and loan
17
banks originated mortgages, while investment banks helped arrange and sell corporate and
government debt offerings to investors. The Glass-Steagall Act of 1933 specifically forbade
commercial banks from acting as investment brokers in the securities market. By extending
deposit insurance through the newly created Federal Deposit Insurance Corporation and other
benefits only to banks that followed these rules, the federal government set up strong boundaries
between insured commercial banks and other kinds of financial services firms.
During the past 15 years, policymakers and bankers have worked to erode this barrier.
The growth of the MBS business was an important motivation for this change. Commercial
banks wanted to be able make money not only from fees generated by originating mortgages, but
also from packaging as them securities, broking their sale, and holding them as investments.
Investment banks became more dependent on a steady stream of mortgages from originators to
securitize. Foreign banks sought to break into the US market because of global demand for high-
yield investments. Beginning in the late 1990s, a few commercial banks like Citibank and Bank
of America and investment banks like Lehman Brothers obtained special permission from the
Securities and Exchange Commission and the Department of the Treasury for limited waivers of
Glass-Steagall rules. In 1999 the Gramm-Leach-Bliley Act removed the Glass-Steagall
restrictions on securitization and insurance activities for commercial banks, opening the door to
the vertical integration of mortgage origination, MBS issuance, and MBS underwriting by large
banks.
The transformation of the subprime lending industry, 1998-2007
The partial repeal of the Glass-Steagall Act removed the immediate legal boundaries
between commercial banking and securities trading. However doing so did not immediately
18
transform the relationships between firms that structured the mortgage lending industry. Instead,
it opened the boundaries between the primary and secondary markets for subprime mortgages to
new forms of contestation. Firms active in one market could move into new markets and take
advantage of new opportunities, but also became exposed to new forms of competition.
Not all sectors of the subprime mortgage lending industry responded in the same way to
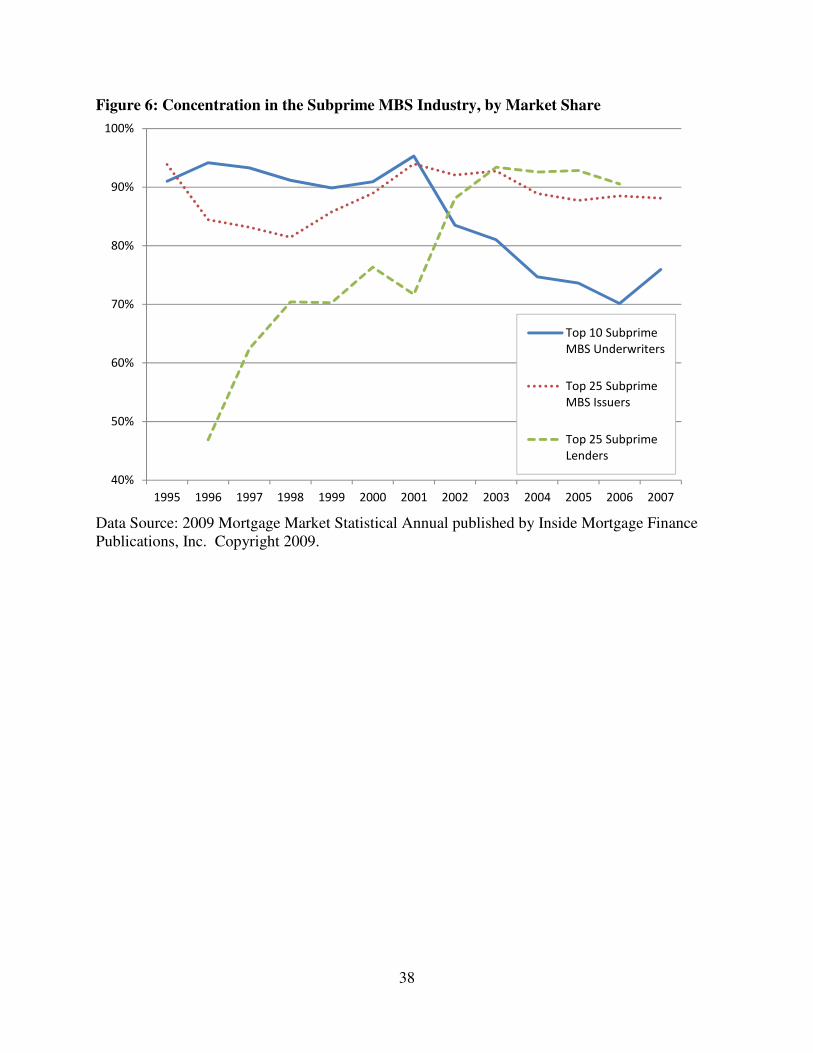
these developments. Figure 6 shows that changes in the concentration of subprime mortgage
origination did not coincide with changes in the concentration of either the issuance or the
underwriting of subprime MBS.6 In fact, the secondary market was already highly concentrated
in the 1990s. The combined market share of the top 25 subprime MBS issuers never fell below
80 percent between 1995 and 2007. Ten firms were responsible for over 90 percent of subprime
MBS underwriting as early as 1995, nearly all of which were major investment banks or
insurance companies.7 At no time did the top ten firms in subprime MBS underwriting account
for less than 70 percent of total market share, a striking degree of concentration in a market with
annual sales of hundreds of billions of dollars and which sold its products to investors
worldwide.
<<Figure 6 about here>>
Yet the position of financial services companies responsible for subprime MBS
underwriting became contested by new entrants, even at the same time as subprime mortgage
origination became highly concentrated in the hands of a few firms. The combined market share
of the top 10 underwriters dropped sharply as subprime lending industry expanded in the 2000s.
6 It was not possible to determine the names of the top 25 underwriting firms. There is evidence however that in many years this would have been almost impossible because there may not have been 25 different firms active in subprime MBS underwriting. In 1996, for example, only 19 out of 151 subprime mortgage investment vehicles were underwritten by firms not in the top 10, indicating the number of firms underwriting subprime MBS could not have been any more than 28. 7 In 1996, these included Prudential, Lehman Brothers, Bear Stearns, CS First Boston, Morgan Stanley, Merrill Lynch, Salomon Brothers, Greenwich, Residential Funding (a division of General Motors), and Goldman Sachs.
19
The Gramm-Leach-Bliley Act removed restrictions on securities underwriting and trading for
commercial banks. The new law freed commercial banks, many of which were already selling
and packaging mortgages for securitization, to extend their activities into the underwriting and
selling of MBS. This invasion of new competitors with deep pockets and their own in-house
sources of subprime mortgages eroded the position of incumbents in the subprime MBS
underwriting market. Figure 6 gives little clue as to how the investment banks responded, but
the shifting boundaries between sectors in the subprime lending industry gave investment banks
a strong incentive to change their own tactics and move into new markets in order to maintain
their own supply of assets to securitize or else risk getting shut out of their home market.
A second look at Table 1 (above) helps make clear the response of investment banks. All
sectors of the subprime lending industry were involved in its eventual integration. In 2007, the
top firms in subprime origination and issuance included non-bank mortgage lenders, commercial
banks, and several investment banks. Countrywide, Option One, and Ameriquest were small
subprime mortgage lenders in the 1990s, and of these only Countrywide was actually chartered
as a true savings and loan bank. During the 2000s these firms grew enormously along with the
subprime lending industry itself and became some of the largest financial companies in the
United States. Major commercial banks and foreign banks such as Citibank, Chase, and HSBC
also entered the subprime lending industry. Originally these large banks were active primarily in
conventional mortgage lending and other common forms of retail commercial banking, but after
1998 they were permitted to enter the US securities market. These banks also expanded
horizontally into subprime mortgage origination. Finally, Wall Street investment banks became
extremely active in not only MBS issuance, but also subprime lending directly to homebuyers.
In 2007, Lehman Brothers, Bear Stearns, and Merrill Lynch were all among the top MBS issuers

20
and underwriters, and through subsidiaries were also three of the 10 largest originators of
subprime mortgages. These firms engaged in the backward integration of MBS production by
purchasing suppliers and packagers of subprime mortgages in order to protect the inputs for their
lucrative but contested business in the securities market. Although subprime lenders,
commercial banks, and investment banks had all entered MBS production from different home
markets and took different paths to vertical integration in the subprime lending industry, by 2007
firms in each of these categories had converged on the same strategy.
An uneven integration
We can get a better sense of how the integration of these markets proceeded over time by
examining the degree to which the top firms in each sector of the mortgage lending industry
overlapped in each year between 1998 and 2007. To do so we took lists of the top firms
equivalent to those presented in Table 1 from the Mortgage Market Statistical Annual published
by Inside Mortgage Finance Publications, Inc., and for every year between 1998 and 2007
computed the percentage of (a) the top 15 firms in subprime origination which were also among
the top 15 firms in subprime issuance, (b) the top 15 firms in subprime origination which were
also among the top 10 firms in subprime underwriting, (c) the top 15 firms in subprime issuance
which were also among the top 10 firms in subprime underwriting, and (d) the top 15 firms in
conventional origination which were also among the top 15 firms in subprime origination (we
omit conventional issuance and underwriting because the overwhelming majority of
conventional mortgages were collected and packaged into securities by the GSEs rather than
private companies).
21
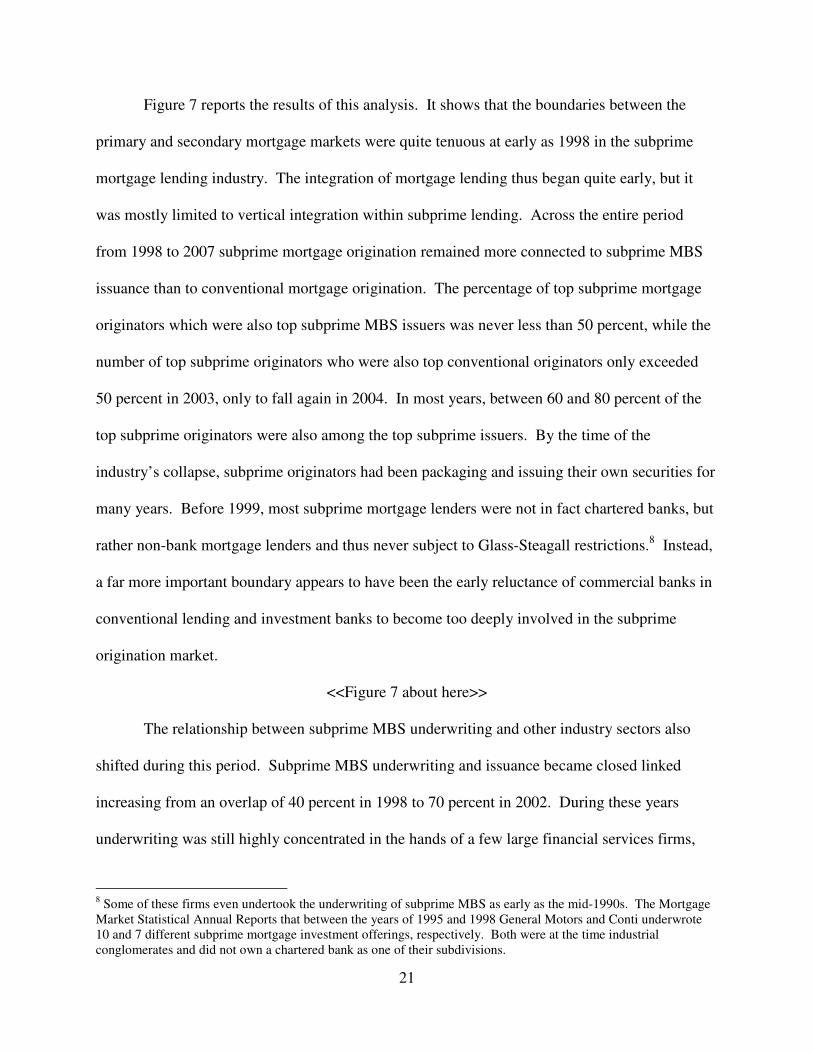
Figure 7 reports the results of this analysis. It shows that the boundaries between the
primary and secondary mortgage markets were quite tenuous at early as 1998 in the subprime
mortgage lending industry. The integration of mortgage lending thus began quite early, but it
was mostly limited to vertical integration within subprime lending. Across the entire period
from 1998 to 2007 subprime mortgage origination remained more connected to subprime MBS
issuance than to conventional mortgage origination. The percentage of top subprime mortgage
originators which were also top subprime MBS issuers was never less than 50 percent, while the
number of top subprime originators who were also top conventional originators only exceeded
50 percent in 2003, only to fall again in 2004. In most years, between 60 and 80 percent of the
top subprime originators were also among the top subprime issuers. By the time of the
industry’s collapse, subprime originators had been packaging and issuing their own securities for
many years. Before 1999, most subprime mortgage lenders were not in fact chartered banks, but
rather non-bank mortgage lenders and thus never subject to Glass-Steagall restrictions.8 Instead,
a far more important boundary appears to have been the early reluctance of commercial banks in
conventional lending and investment banks to become too deeply involved in the subprime
origination market.
<<Figure 7 about here>>
The relationship between subprime MBS underwriting and other industry sectors also
shifted during this period. Subprime MBS underwriting and issuance became closed linked
increasing from an overlap of 40 percent in 1998 to 70 percent in 2002. During these years
underwriting was still highly concentrated in the hands of a few large financial services firms,
8 Some of these firms even undertook the underwriting of subprime MBS as early as the mid-1990s. The Mortgage Market Statistical Annual Reports that between the years of 1995 and 1998 General Motors and Conti underwrote 10 and 7 different subprime mortgage investment offerings, respectively. Both were at the time industrial conglomerates and did not own a chartered bank as one of their subdivisions.

22
but it appears that these firms became involved as both underwriters and wholesalers in the
packaging of subprime loans for the production of subprime MBS. Nevertheless, most subprime
MBS underwriters hardly moved at all into subprime mortgage origination at this time. The
overlap between the top subprime MBS underwriting firms and the top subprime loan originators
remained extremely low until 2006, after which it increased in one year from 10 percent to 60
percent. The vertical integration of subprime lending appears to have occurred in at least two
stages, one beginning in the late 1990s, but the other not occurring until as late as 2006.
Although there was never an absolute boundary between the primary and secondary markets in
the subprime mortgage lending industry, the reorientation of investment banks’ tactics towards
full vertical integration of origination, issuance, and underwriting did not occur until around
2007.
The unevenness of the integration of the mortgage lending industry across the period
under study suggests a lack of consensus among firms about the precise boundaries of different
sectors within the subprime lending industry before 2007. Instead, the early vertical integration
of subprime mortgage origination and securities issuance and the very late entry of underwriters
into the primary market for subprime mortgage loans indicates that several strategies coexisted
within the subprime lending industry for a number of years: perhaps one or two fully vertically
integrated firms existed, but many subprime lenders packaged their own loans into MBS and
continued to rely on other firms to underwrite the securities, while many underwriters issued
their own MBS but purchased the loans from independent originators. By 2007 most firms had
converged upon a strategy of vertical integration, but the paths by which they eventually arrived
at this strategy remain unclear.

23
The realignment of firm tactics
The absence of any consensus regarding the organization of the subprime lending
industry for most of the 2000s raises several questions about how firms’ tactics shifted over time.
If the investment banks remained for the most part out of origination, which firms were
responsible for the expansion of subprime loan origination in 2003 and 2004? What changes, if
any, in the structure of the field drove underwriting firms to vertically integrate in 2006 and
2007? How did the relative positions of underwriting firms with respect to issuance and
origination between 2001 and 2007? It behooves us to examine more closely the positions taken
by firms across each sector of the subprime lending industry.
To show how firms’ positions changed over time, we plotted each firms’ market share in
subprime MBS issuance against its market share in subprime mortgage origination and subprime
MBS issuance. We treated subprime MBS underwriting as a categorical variable in order to
simplify the presentation of our data and because, as discussed above, relatively few firms were
simultaneously involved in subprime underwriting, issuance, and origination before 2007. In
these plots, firms involved in issuance but not in origination appear along the Y-axis, firms
involved origination but not issuance appear along the X-axis, and those active in both appear in
the middle of the plot.
We focus on four different years that correspond to four different moments in the
development of the subprime lending industry across which the goals of firms’ actions may have
changed: 1998, 2001, 2004, and 2007. The year 1998 provides a snapshot of the subprime
lending industry as it stood immediately before the 1999 repeal of the Glass-Steagall provisions
separating investment banking and commercial banking. By 2001, the initial incentives to
vertically integrate were also firm in place: the Gramm-Leach-Bliley Act had been in effect for
24
several years, and mortgage sales and securitization were increasing rapidly. By 2004, the
conventional mortgage origination market was in steep decline but subprime and alternative
originations had increased dramatically. Finally, in 2007 the market for subprime mortgages had
already begun to collapse and the vertical integration of the subprime lending industry was fairly
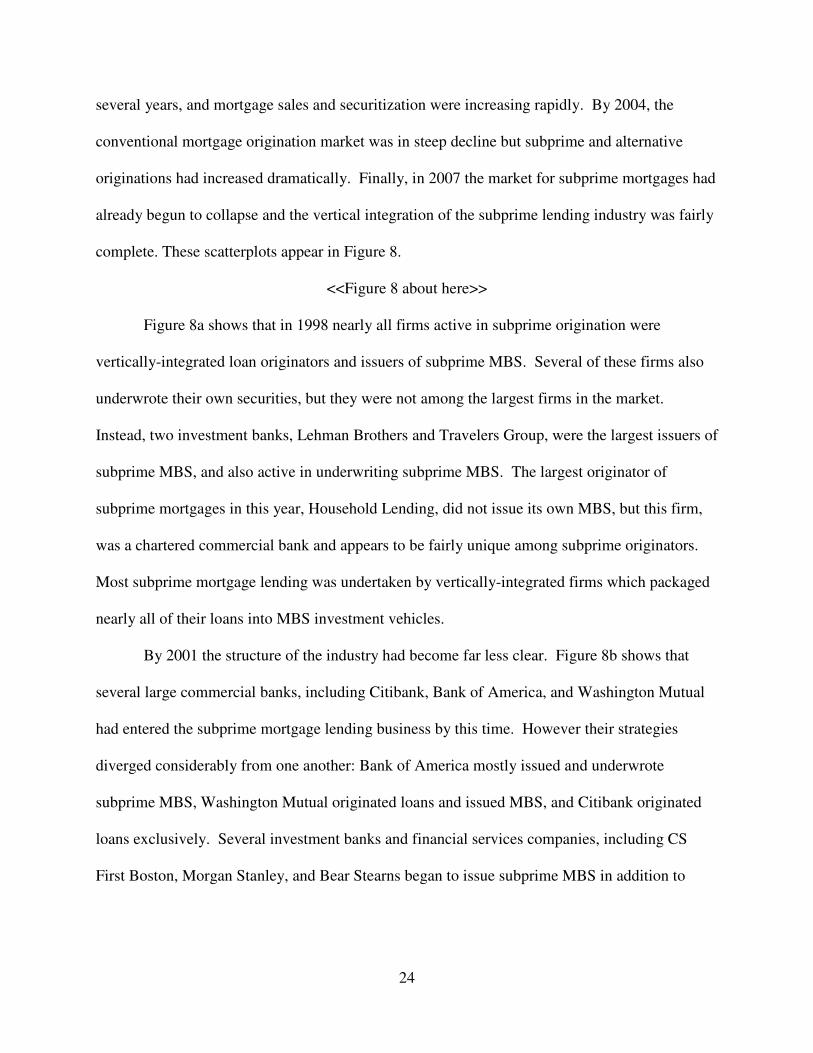
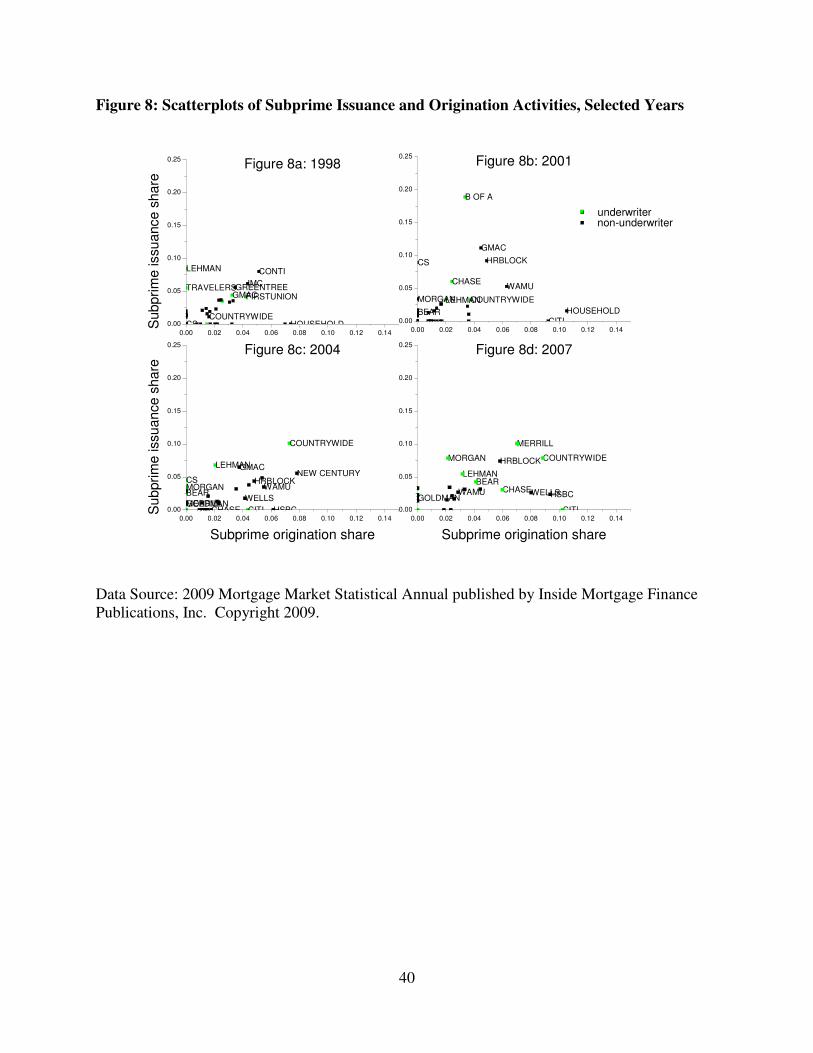
complete. These scatterplots appear in Figure 8.
<<Figure 8 about here>>
Figure 8a shows that in 1998 nearly all firms active in subprime origination were
vertically-integrated loan originators and issuers of subprime MBS. Several of these firms also
underwrote their own securities, but they were not among the largest firms in the market.
Instead, two investment banks, Lehman Brothers and Travelers Group, were the largest issuers of
subprime MBS, and also active in underwriting subprime MBS. The largest originator of
subprime mortgages in this year, Household Lending, did not issue its own MBS, but this firm,
was a chartered commercial bank and appears to be fairly unique among subprime originators.
Most subprime mortgage lending was undertaken by vertically-integrated firms which packaged
nearly all of their loans into MBS investment vehicles.
By 2001 the structure of the industry had become far less clear. Figure 8b shows that
several large commercial banks, including Citibank, Bank of America, and Washington Mutual
had entered the subprime mortgage lending business by this time. However their strategies
diverged considerably from one another: Bank of America mostly issued and underwrote
subprime MBS, Washington Mutual originated loans and issued MBS, and Citibank originated
loans exclusively. Several investment banks and financial services companies, including CS
First Boston, Morgan Stanley, and Bear Stearns began to issue subprime MBS in addition to

25
their previous involvement in underwriting. Issuance and origination were divided in a complex
way among both subprime specialists and a diverse group of new entrants.
In contrast to the divergence among firm tactics was apparent in 2001, Figure 8c
indicates that by 2004 there could have been little doubt over who the dominant firms were. This
was not because many firms had left the origination or issuance market: Household Lending had
been acquired by HSBC in 2003; however Citibank, CS First Boston, Morgan Stanley, and Bear
Stearns all appear in roughly the same positions as in 2001.9 Instead, in every year between
2001 and 2004, Countrywide and Ameriquest, both vertically-integrated subprime specialists,
had managed to double their subprime mortgage origination volume. As a result, they were
among the largest subprime mortgage originators and subprime MBS issuers in 2004, and
Countrywide was also the largest subprime MBS underwriter. At this time only one investment
bank, Lehman Brothers, had entered the subprime mortgage origination market. Vertically-
integrated firms like Countrywide thus appear to have been the primary beneficiaries (and
perhaps engineers) of the explosion in subprime lending that began in 2003.
Finally, by 2007 a number of other major investment banks had adopted the same tactic
as Lehman and Countrywide, including Merrill Lynch, Morgan Stanley, and Bear Stearns, as
seen in Figure 8d. Two commercial banks, Wells Fargo and Chase, also took the same approach
to subprime mortgage lending. Certainly, not all investment banks or commercial banks made
this choice: Goldman Sachs never entered subprime origination market, and Citibank had ceased
to issue subprime MBS before 2007. However the entry of several large investment banks and
commercial banks increased the overall degree of vertical integration in the field. Strikingly,
9 There is evidence that many of these firms had already begun to take advantage of regulatory changes by 2004. FDIC records show that between 2001 and 2004, Morgan Stanley, Merrill Lynch, Goldman Sachs, and Lehman Brothers all acquired savings and loan banks which were granted full trust powers as commercial banks. However with the exception of Lehman Brothers they had not begun to originate subprime mortgages during these years.
26
nearly all large firms in both issuance and origination are also underwriting their own subprime
MBS. Subprime MBS underwriters and issuers entered the primary market for subprime loans
precisely as the supply of loans was beginning to dwindle.
Conclusions
We have seen that the tactics of firms involved in subprime mortgage lending remained
surprisingly consistent between 1998 and 2007, but as subprime mortgages became a key
resource for securitization activity, major banks aligned their tactics with vertically-integrated
mortgage lenders already present in the market. There is evidence that the elimination of legal
barriers to the entry of commercial banks into the securities market in 1999 encouraged
commercial banks to expand their activities in the subprime lending industry, but their effects on
overall industry structure appear to have been limited.
Instead, the growth of subprime lending in 2003 and 2004 was driven primarily by
vertically-integrated specialists like Countrywide, Ameriquest, and GMAC. These firms had
been marginal to both the conventional mortgage lending sector and the securities market, but
very active in both the provision of subprime loans to homebuyers and the production of
subprime MBS since at least the 1990s, but expanded the scale of their activities enormously in
the 200s. In contrast, the entry of major investment banks into subprime origination in 2006 and
2007 represented a departure from their earlier tactics. As the supply of conventional mortgages
began to dry up in 2003 and vertically-integrated firms like Countrywide took the lead subprime
MBS underwriting, major commercial and investment banks entered into the subprime mortgage
origination in order to maintain a steady supply of mortgages to securitize, and transformed the
US financial sector by adopting the tactics of these formerly marginal companies.

27
The problem of the boundaries between different sectors within the subprime lending
industry became a salient one for actors because of the success of actors employing an
alternative conception on the field. It appears that the boundaries of a field may at times refer to
two realities which do not always precisely overlap. Even after the explicit legal categories
dividing mortgage lending from securities trading had become irrelevant, the structure of the
subprime lending industry continued to reflect divisions between investment banks, commercial
banks, and subprime lenders. Only as subprime lenders rose to prominence within the world of
securities trading did investment banks begin to abandon their previous positions and attempt to
dissolve the structural divisions between subprime mortgage lending and subprime MBS
production.
This case offers two lessons about the nature of boundaries within fields undergoing
transformative change. First, the boundaries between fields are produced in part by the strategies
of actors. The subprime lending industry remained isolated not only because of Glass-Steagall
regulations, but also because of it occupied a marginal position in the structure of the US
economy. As it grew, its structure and boundaries became contested by new actors attempting to
take advantage of the opportunities it now offered. When it became a central concern to the
major financial services companies and investors worldwide, large firms changed their tactics in
order to secure their position and the boundaries of industry were redefined to encompass a new
set of members.
Second, we have observed the obduracy of social structures even in a field undergoing
transformative change. Boundaries are only one aspect of a field’s structure. Even in a case
where the actors within a field changed dramatically, new entrants drew upon old tactics and
reproduced much of the existing structure of positions within the field. When investment banks

28
entered subprime origination, they followed the rules laid down by previously marginal
mortgage lenders. In this case, it appears that the positions defining the structure of the field
were more stable than the classifications actors sought to impose upon them. The resulting
absorption of subprime lending into the heart of the US financial sector transformed a looming
housing bubble into a worldwide financial crisis.

29
References
Bourdieu, Pierre. 1984. Distinction : a social critique of the judgement of taste. Cambridge, Mass.: Harvard University Press.
Bourdieu, Pierre. 1988. Homo academicus. Stanford, Calif.: Stanford University Press.
Bourdieu, Pierre. 1996. The rules of art : genesis and structure of the literary field. Stanford, Calif.: Stanford University Press.
Bourdieu, Pierre, and Loïc J. D Wacquant. 1992. An invitation to reflexive sociology. Chicago: University of Chicago Press.
Carroll, Glenn R. 1985. “Concentration and Specialization: Dynamics of Niche Width in Populations of Organizations.” American Journal of Sociology 90(6):1262-1283. Retrieved April 6, 2012.
Carroll, Glenn R., and Anand Swaminathan. 2000. “Why the Microbrewery Movement? Organizational Dynamics of Resource Partitioning in the U.S. Brewing Industry.” American Journal of Sociology 106(3):715-762. Retrieved April 6, 2012.
Coase, Ronald. 1993. “The nature of the firm.” Pp. 18-33 in The nature of the firm : origins,
evolution, development. New York: Oxford University Press.
DiMaggio, Paul J., and Walter W. Powell. 1983. “The Iron Cage Revisited: Institutional Isomorphism and Collective Rationality in Organizational Fields.” American
Sociological Review 48(2):147-160. Retrieved April 6, 2012.
Emirbayer, Mustafa, and Victoria Johnson. 2008. “Bourdieu and organizational analysis.” Theory and Society 37(1):1-44. Retrieved April 6, 2012.
Fligstein, Neil. 2001. The architecture of markets : an economic sociology of twenty-first-century
capitalist societies. Princeton: Princeton University Press.
Fligstein, Neil, and Adam Goldstein. 2010. “The anatomy of the mortgage securitization crisis.” Pp. 29-70 in Markets on Trial : The Economic Sociology of the U.S. Financial Crisis:
Part A, Research in the Sociology of Organizations. Bingley: Emerald Group.
Fligstein, Neil, and Doug McAdam. 2011. “Toward a General Theory of Strategic Action Fields.” Sociological Theory 29(1):1-26. Retrieved April 6, 2012.
Geertz, Clifford. 1973. The interpretation of cultures : selected essays. New York: Basic Books.
Go, Julian. 2008. American empire and the politics of meaning : elite political cultures in the
Philippines and Puerto Rico during U.S. colonialism. Durham: Duke University Press.
Gulati, Ranjay, and Martin Gargiulo. 1999. “Where Do Interorganizational Networks Come From?” American Journal of Sociology 104(5):1439-1493. Retrieved April 6, 2012.
30
Hannan, Michael T, and John Freeman. 1989. Organizational ecology. Cambridge, Mass.: Harvard University Press.
Hannan, Michael T., and John Freeman. 1977. “The Population Ecology of Organizations.” American Journal of Sociology 82(5):929-964. Retrieved April 6, 2012.
Jensen, Michael C., and William H. Meckling. 1976. “Theory of the firm: Managerial behavior, agency costs and ownership structure.” Journal of Financial Economics 3(4):305-360. Retrieved April 6, 2012.
Kay, Neil M. 1997. Pattern in corporate evolution. Oxford: Oxford University Press.
Kendall, L. T. 1996. “Securitization: A new era in American finance.” Pp. 1-16 in A primer on
securitization. Cambridge Mass.: MIT Press.
Knight, Frank H. 1964. Risk, uncertainty and profit. New York: Augustus M. Kelley.
Lewin, Kurt. 1952. Field theory in social science : selected theoretical papers. London: Tavistock Publications.
Martin, John Levi. 2003. “What Is Field Theory?” American Journal of Sociology 109(1):1-49. Retrieved April 6, 2012.
Podolny, Joel M. 1993. “A Status-Based Model of Market Competition.” American Journal of
Sociology 98(4):829-872. Retrieved April 6, 2012.
Porter, Theodore M. 1986. The rise of statistical thinking, 1820-1900. Princeton, N.J.: Princeton University Press.
Powell, Walter W., Douglas R. White, Kenneth W. Koput, and Jason Owen‐Smith. 2005. “Network Dynamics and Field Evolution: The Growth of Interorganizational Collaboration in the Life Sciences.” American Journal of Sociology 110(4):1132-1205. Retrieved April 6, 2012.
Quinn, Sarah. 2008. “Securitization and the state.” Paper presented at the Annual Meeting of the American Sociological Association. Boston, Mass.
Ray, Raka. 1999. Fields of protest : women’s movements in India. Minneapolis, Minn.: University of Minnesota Press.
Sellon, Gordon, and Deena VanNahmen. 1988. “The securitization of housing finance.” Economic Review 73(7):3-20.
Slez, Adam, and John Levi Martin. 2007. “Political Action and Party Formation in the United States Constitutional Convention.” American Sociological Review 72(1):42 -67. Retrieved April 6, 2012.
31
Stark, David, and Balázs Vedres. 2006. “Social Times of Network Spaces: Network Sequences and Foreign Investment in Hungary.” American Journal of Sociology 111(5):1367-1411. Retrieved April 6, 2012.
Steinmetz, George. 2007. The devil’s handwriting precoloniality and the German colonial state
in Qingdao, Samoa, and Southwest Africa. Chicago Ill.: University of Chicago Press.
Uzzi, Brian. 1999. “Embeddedness in the Making of Financial Capital: How Social Relations and Networks Benefit Firms Seeking Financing.” American Sociological Review 64(4):481-505. Retrieved April 6, 2012.
Uzzi, Brian. 1996. “The Sources and Consequences of Embeddedness for the Economic Performance of Organizations: The Network Effect.” American Sociological Review 61(4):674-698. Retrieved April 6, 2012.
White, Harrison C. 2002. Markets from networks : socioeconomic models of production. Princeton, N.J.: Princeton University Press.
Williamson, Oliver E. 1973. “Markets and Hierarchies: Some Elementary Considerations.” The
American Economic Review 63(2):316-325. Retrieved April 6, 2012.
Wuthnow, Robert. 1987. Meaning and moral order : explorations in cultural analysis. Berkeley: University of California Press.

32
Figure 1: Four Hypothetical Industry Structures
manufa
ctu
rers
suppliers
Figure 1a: Unorganized
manufa
ctu
rers
suppliers
Figure 1b: Paritionedm
anufa
ctu
rers
suppliers
Figure 1c: Integrated
manufa
ctu
rers
suppliers
Figure 1d: Contested

33
Figure 2: A Mortgage Securitization Package (adapted from L.T. Kendall 1996: 3)
Assets (Principal + interest from
loans)
Cash (Payment for Assets)
Underwriter (Investment Bank)
Originator (Lending
Company)
Borrower
Principal + interest
Fees
Expertise
Bonds
The underwriter will broker the sale of the bonds from the SPV to the investors.
Cash Payment for Bonds
Loan (Principal) One the assets have
been sold to the SPV, a servicer
may take over the management of the
underlying loans
SPV
The underwriter may arrange for
additional credit
enhancement for the pool of assets held by the SPV.
This may include a letter of credit or guarantee from a highly rated third
party.
Investors (Institutional)

Figure 3: Residential Mortgage Origination by Type, 1990
Data Source: 2009 Mortgage Market StatiPublications, Inc. Copyright 2009.
34
Figure 3: Residential Mortgage Origination by Type, 1990-2008
Data Source: 2009 Mortgage Market Statistical Annual published by Inside Mortgage Finance Publications, Inc. Copyright 2009.
stical Annual published by Inside Mortgage Finance

35
Figure 4: Mortgage-Related Security Holdings of Four Largest Investor Types, 2002-2008.
Data Source: 2009 Mortgage Market Statistical Annual published by Inside Mortgage Finance Publications, Inc. Copyright 2009.
$0
$200
$400
$600
$800
$1,000
$1,200
$1,400
2002 2003 2004 2005 2006 2007 Jun-08
Se
curi
tie
s H
old
ing
s (B
illi
on
s)
Fannie Mae /
Freddie Mac
Commercial
Banks
Mutual
Funds
Foreign
Investors

36
Table 1: Top 10 Subprime Mortgage Originators and Issuers in 1996 and 2007.
1996 Market Share 2007 Market Share
Top Subprime Mortgage Originators
Associates Capital (Ford) 7.0 Citibank 10.2
The Money Store 4.3 Household Finance (HSBC) 9.3
ContiMortgage 3.5 Countrywide 8.8
Beneficial Mortgage 2.8 Wells Fargo 8.0
Household Finance 2.6 First Franklin (Merrill Lynch) 7.0
United Co. 2.3 Chase 6.0
Long Beach Mortgage 2.2 Option One 5.8
EquiCredit 2.1 EMC Mortgage (Bear Stearns) 4.1
Aames Capital 2.0 Ameriquest 3.3
AMRESCO 1.9 BNC Mortgage (Lehman) 3.2
Top Subprime MBS Issuers
The Money Store 10.3 Merrill Lynch 10.1
United Companies 6.4 Countrywide 7.9
ContiMortgage 5.3 Morgan Stanley 7.8
Beneficial 5.0 Option One 7.4
AMRESCO 4.7 Lehman Brothers 5.5
EquiCredit 4.5 Bear Stearns 4.3
Aames 4.3 Barclays 3.4
Household 4.2 CIT Group 3.3
Residential (General Motors) 4.2 Deutsche Bank 3.2
Associates (Ford) 3.5 Residential (General Motors) 3.2
Data Source: 2009 Mortgage Market Statistical Annual published by Inside Mortgage Finance Publications, Inc. Copyright 2009.

37
Figure 5: Concentration in Mortgage Lending, Top 25 Market Share
Data Source: 2009 Mortgage Market Statistical Annual published by Inside Mortgage Finance Publications, Inc. Copyright 2009.
0%
10%
20%
30%
40%
50%
60%
70%
80%
90%
100%
1992 1993 1994 1995 1996 1997 1998 1999 2000 2001 2002 2003 2004 2005 2006 2007 2008
Combined Market
Share of Top 25
Total Lenders
Combined Market
Share of Top 25
Subprime Lenders
38
Figure 6: Concentration in the Subprime MBS Industry, by Market Share
Data Source: 2009 Mortgage Market Statistical Annual published by Inside Mortgage Finance Publications, Inc. Copyright 2009.
40%
50%
60%
70%
80%
90%
100%
1995 1996 1997 1998 1999 2000 2001 2002 2003 2004 2005 2006 2007
Top 10 Subprime
MBS Underwriters
Top 25 Subprime
MBS Issuers
Top 25 Subprime
Lenders

39
Figure 7: Overlaps of Top Firms in Mortgage Lending, 1998-2007
Data Source: 2009 Mortgage Market Statistical Annual published by Inside Mortgage Finance Publications, Inc. Copyright 2009.
0%
10%
20%
30%
40%
50%
60%
70%
80%
1998 1999 2000 2001 2002 2003 2004 2005 2006 2007
subprime origination & subprime issuance
subprime origination & subprime underwriting
subprime origination & conventional origination
subprime issuance & subprime underwriting
40
Figure 8: Scatterplots of Subprime Issuance and Origination Activities, Selected Years
underwriter
FIRSTUNION
HOUSEHOLD
CONTI
GMACGREENTREE
CS
TRAVELERS
LEHMAN
IMC
COUNTRYWIDE
CHASE
CITI
HOUSEHOLD
B OF A
GMAC
CS
BEAR
LEHMANMORGAN
HRBLOCK
COUNTRYWIDE
WAMU
CHASE CITI
WELLS
GMAC
CS
HSBC
BEAR
GOLDMAN
LEHMAN
MERRILL
MORGANHRBLOCK
NEW CENTURY
COUNTRYWIDE
WAMU CHASE
CITI
WELLSHSBC
BEAR
GOLDMAN
LEHMAN
MERRILL
MORGAN HRBLOCK COUNTRYWIDE
WAMU
0.00 0.02 0.04 0.06 0.08 0.10 0.12 0.14
0.00
0.05
0.10
0.15
0.20
0.25S
ubprim
e issuance s
hare
Figure 8a: 1998
0.00 0.02 0.04 0.06 0.08 0.10 0.12 0.14
0.00
0.05
0.10
0.15
0.20
0.25Figure 8b: 2001
0.00 0.02 0.04 0.06 0.08 0.10 0.12 0.14
0.00
0.05
0.10
0.15
0.20
0.25
Subprim
e issuance s
hare
Subprime origination share
Figure 8c: 2004
0.00 0.02 0.04 0.06 0.08 0.10 0.12 0.14
0.00
0.05
0.10
0.15
0.20
0.25
non-underwriter
Subprime origination share
Figure 8d: 2007
Data Source: 2009 Mortgage Market Statistical Annual published by Inside Mortgage Finance Publications, Inc. Copyright 2009.