the emergence of a finance culture in american households ... · the emergence of a finance culture...
TRANSCRIPT

Forthcoming, Socio-Economic Review
The Emergence of a Finance Culture in American Households, 1989-2007
Neil Fligstein and Adam Goldstein
Department of Sociology
University of California
Berkeley, Ca. 94720
U.S.A.
September 2014
[Word count: 11,899 including abstract, text, notes, and references]
* This article is co-authored. A version of this paper was presented at the Annual Meetings of the American Sociological Association held in Denver, Colorado, on August 17-21, 2012. We thank Juliet Schor and Maria Charles for their comments on that draft. We would like to acknowledge the comments of the participants in the Seminar on Financialization at the Center for Culture, Organization, and Politics at the University of California and the audience at “The Anthropology of Consumption” conference on March 8-9, 2013 in Irvine, Ca. We also thank the reviewers. The research reported in this paper was supported by a grant from the Institute on New Economic Thinking.
Abstract
As the financial economy has expanded beginning in the mid-1980s, it has done so in part by selling more products to individuals and households. Households have had more access to new forms of assets and debts and new ways to fund their lifestyles. This occurred at the same time that income inequality and job insecurity increased dramatically in the U.S. We show that a more risk taking culture that engages in more active financial management emerges amongst the middle and upper middle classes. We suggest that these households are feeling the effects of growing inequality at the top more acutely and they respond by changing how they think about their financial lives. For those lower on the income distribution, financial strategies are more of a defensive strategy to get by. Those at the top embrace finance as an opportunity to preserve and extend their lifestyles. SER Keywords: Consumers, Culture, Inequality, Family Economics, Financialization JEL Classification: D12 Consumer Economics: Empirical Analysis; D31 Personal Income, Wealth
and their distributions; G21 Financial Institutions: Banks; Z13 Economic Sociology

1
Introduction
Financialization, broadly understood to mean the increasingly important role of financial
markets, motives, actors, and institutions in the operation of the economy (Epstein, 2005), has
attracted increasing attention in recent years (Krippner, 2005; Orhangazi, 2008; Davis, 2009).
Scholars have produced a growing number of studies on the origins, dimensions, and effects of
financialization across multiple domains, both in the U.S. and elsewhere (Zorn, et al., 2004;
Krippner, 2011; Tomaskovic-Devey and Lin, 2011; Lin and Tomaskovic-Devey, 2013; Baud and
Durand, 2011; Van Der Zwan, 2014).
One area that has received less attention is the role of households in financialization. As the
financial economy has expanded, it has done so in large part by selling more products to
households, such as mortgages, second mortgages, mutual funds, stock trading accounts, student
loans, car loans, and various forms of retirement products (Greenwood and Scharfstein, 2012;
Aalbers, 2008). This has been particularly true in the United States, where increasing consumption
of financial products and services has deepened households’ involvement in financial markets
dramatically during the past two decades. In credit markets, real median household debt levels
increased 179% from 1989-2007 as consumers took on an ever-wider array of loans (Wolff, 2010).
This trend is also apparent in the widespread acquisition and trading of investment assets. The
percentage of households with direct holdings of stock equities or mutual funds increased from
20% to over 30% during the 1990s, and the median frequency of financial transactions more than
tripled over this period (Kremp, 2011). Later, the housing bubble of the mid-2000s saw the
widespread popularization of housing investment as an entrepreneurial activity.
Several theorists have argued that such trends are indicative of a more fundamental shift in
how people think about financial activities and markets (Martin, 2002; Langley, 2008; Davis,
2009). Akerlof and Shiller (2009, p.157) assert that the increasing prominence of the stock market
during the 1990s made investment success a popularly understood indicator of intelligence. Davis
characterizes the U.S. in the early 21st century as a "portfolio society," in which “investment
becomes the dominant metaphor to understand the individual’s place in society" (2009, p. 193).
Davis argues that this means a change in the way that people think about what they own. From this

2
perspective, households have come to actively embrace financial strategies as a means to manage
their consumption, indebtedness, and saving, what could be termed a finance culture.
We use the term “culture” here not as a unitary set of beliefs held by all
people. Instead, culture is a toolbox of meanings that can be used in a given
situation as a way to frame, make sense of, and organize action in some aspect of
people’s lives (Swidler 1986). Our use of the term “finance culture” does not imply
that household financialization is caused by an exogenous cultural shift. Nor does
it imply that emergent cultural repertoires are disconnected from material
pressures. A finance culture involves people becoming more fluent and comfortable with
financial language and taking financial risks, including increasing one’s indebtedness as a means to
support their lifestyles. Behaviorally, it implies engaging in activities like the active trading of
stocks and treating one’s house as an investment asset.
Economists and sociologists have studied fragmentary pieces of this process, including
changes in household portfolio mix, shifts in attitudes about risk, financial literacy, and the
performance of retail stock investors (see Tufano, 2009 for an overview). Scholars have also
studied evolving patterns of participation in particular financial markets, including credit cards
(Manning, 2001; Zinman, 2009), mortgage credit (Dynan and Krohn, 2007; Mian and Sufi, 2010),
and stock equities (Kremp, 2010). Yet we lack a panoramic analysis of the financialization of
American households over the previous two decades. The purpose of the present paper is to lay a
conceptual and empirical groundwork for how social scientists might think about this multi-faceted
issue. Our goal is to provide a global view of the various ways that households at different points
in the stratification structure have become more involved with the financial economy and how this
has co-evolved with their attitudes towards risk and debt.
Lurking behind these questions are several alternative accounts about how we ought to
understand the financialization of households in relation to broader changes in the economy. Wage
stagnation, rising inequality, and declining job security over the past three decades have altered
Americans’ life-chances and mobility strategies in profound ways. There are two views about how
this shaped households’ turn to finance, one that focuses on how households reacted defensively to
preserve their lifestyles, and the other that suggests households embraced the logic of the risk
economy and developed a more aggressive mindset for managing their assets and debts.

3
The first account highlights how structural changes pushed households to become more
reliant on financial services (Rajan, 2010). As the finance-fuelled shareholder-value movement
made employment less secure and less remunerative, households had little choice but to take on
more debt (Harvey, 2010; Leicht and Fitzgerald, 2007). Meanwhile, pension reform and the
privatization of risks tied Americans’ retirement savings to privately-managed financial investment
accounts. Financial firms devised new ways to profit from these needs by marketing an expanded
array of services to ever-wider segments of the population up and down the income distribution.
By this account, the financialization of households manifests itself primarily in the increasing sale
of financial products to all households.
The second view posits a more expansive conception of financialization whereby the
increasing availability of financial products also coincides with the emergence of qualitatively new
cultural frames (Davis, 2009; Langley, 2008). Here, households come to embrace a more proactive
and entrepreneurial management of their finances in order to capitalize on the opportunities these
products present. In other words, they begin to think more financially. They conceive of their
wealth as deployable assets. They embrace risk and trade stocks. They use leveraged equity to fund
investments and consumption expenditures (Greenspan and Kennedy, 2008). This account
suggests that financialization involves more than simply consuming more financial products and
services. Rather, it means a new kind of socio-economic game for households, with new frames of
meaning and repertoires of action.
Neither of these two accounts is mutually exclusive, but they imply different views on the
scope of what household financialization entails. Our goal is to explore how well each of these
accounts characterizes the patterns of financial market involvement by U.S. households across the
stratification structure. We use triennial data from the Survey of Consumer Finances to chart
changes in the financial activities and attitudes of households across an array of different indicators
from 1989 to the onset of the financial crisis in 2007. We find that there is substantial growth in the
use and holding of financial products of all kinds across the stratification structure. This implies
that the financial firms sought out customers for their products and made them available to people
up and down the status distribution. Not surprisingly, those with the highest socio-economic status
(SES) have the most financial products.
For the bottom part of the distribution, there is little discernible evidence that increasing use
of financial services has brought about a significant shift in cultural norms about risk and debt.

4
Middle and upper middle class households have responded to income inequality by more actively
managing their financial situations and adopting a more thoroughly financial mindset. While upper
middle class households have been amongst the principal beneficiaries of economic growth in the
past 20 years, they have found themselves in competition for valued goods like housing and
schools with those above them (i.e. the top 2%), whose income and wealth have grown faster. This
has pushed them to take on more debt and use that debt to maintain and expand their lifestyles. In
their case, embracing a more financial outlook is a creative one to help them keep up their
lifestyles in the face of the competition for valued positional goods. Those in the bottom 40% of
the income distribution more clearly have had to become more involved in borrowing money. But
this appears to be in response to declining income opportunities.
Our results extend and qualify previous arguments about the increasing integration of
American households into the financial economy (Davis, 2009). Our findings imply that household
financialization (in the sense of the increased use of financial products) should be seen as a broad-
based process extending across the socio-economic distribution. However, to the extent that we
can discern a deepening culture of risk-taking and strategic deployment of assets, this is
concentrated within the middle and upper middle income groups.
We elaborate our argument by first considering how the rise of the shareholder value
movement made working conditions for most Americans less secure and less remunerative. Then,
we consider the effects of these changes on the income distribution. We discuss the idea of lifestyle
and consider how households may have utilized financial services and strategies in order to adapt
to new economic circumstances. Here, we use the extant literature to discuss how a finance culture
might have arisen, and we generate hypotheses about which parts of the income distribution might
have adopted this culture. Then we introduce our data and examine which hypotheses best account
for the changing patterns of financial attitudes and behavior among American households. We
conclude by considering what this means about the household level response to growing income
inequality in the U.S. and what additional research is needed.
Shareholder Value, Inequality, and Insecuritization in the U.S. since the 1980s
Households located in different parts of social structure have faced different challenges and
opportunities as the larger economy in the U.S. has changed in the past 30 years. By understanding

5
the nature and timing of these changes and connecting them to the stratification of the population,
we will be in the position where we can make some hypotheses about how households in various
social positions had to change the way they saved, borrowed and invested in response to potential
pressures on their lifestyles.
The late 1970s marked the beginning of an era of rising inequality and declining economic
security for U.S. households. The 1970s was a period of slow economic growth, high inflation, and
high interest rates. Corporate America found itself at the end of the decade with lots of cash, low
stock prices, and undervalued assets on their books (Zorn et al., 2004). In the late 1970s, the
institutional investment community pushed corporate managers to focus on raising stock prices, i.e.
boosting shareholder value (Useem, 1993). The main strategy to pursue this was corporate
reorganization. Layoffs, selling off low performing divisions, outsourcing, and buying back shares
of stock were all seen as actions that would increase shareholder value (Fligstein and Shin, 2007).
The spread of the shareholder value movement during the 1980s had a profound effect on
the jobs of millions of Americans. One of the main outcomes was massive layoffs of blue collar
workers, weakening of unions, and the closure of a large part of America’s manufacturing capacity
(Davis, 2009). Unionized blue collar workers who lost their jobs during the 1980s never recovered
financially from those layoffs (Farber, 1996; 1997). Even for those who did keep their jobs,
corporate provision of benefits decreased. Defined-benefit pensions and health insurance became
rarer and employees had to pay more for the benefits they got (Hacker, 2006). The 1980s produced
a large growth in income inequality, at least part of which was caused by the lack of opportunities
for those who were downsized and outsourced, and part of which reflected the ability of those at or
near the top to increase their incomes (Lin and Tomaskovic-Devey, 2013).
The 1990s saw the return of better macro-economic conditions and rapidly rising stock
prices. But, the growth of inequality continued during this period, driven predominantly by rising
incomes in the top 10% and especially the top 1% of the income distribution, with continuing
stagnation below (Saenz, 2009; Volscho and Kelley, 2012; Mishel et al., 2007). Moreover,
households continued to experience heightened labor market risks and more frequent income
shocks (Fligstein and Shin, 2004; Kalleberg, 2009; Hollister, 2011; Western, et al., 2012). There
was a growth in contingent employment where work was based on temporary contracts (Kalleberg,
2009). Newly created job positions were concentrated at the bottom of the income distribution
during the 1990s (Wright and Dwyer, 2003), and positions were increasingly part time. Job

6
duration shortened throughout most of the occupational structure (Hollister, 2011). Rates of
involuntary job loss increased, even during the high-growth years of the late 1990s. White collar
workers became almost as susceptible to layoffs as blue collar workers (Aaronson and Sullivan,
1998). McCloud and Dwyer (2011) show that middle class families were particularly vulnerable to
financial hardship. Events such as job loss, divorce, or health crises plunged middle class families
into more frequent credit troubles, defaults, and bankruptcies (Porter, 2012). Not surprisingly, this
high-risk economy resulted in marked increases in economic anxiety across the occupation
structure, and most dramatically so amongst middle and upper middle-class white-collar workers
who had previously been insulated from labor market dislocations (Western, et al., 2012).
The main goal of our research is to examine how these larger changes in social
stratification and economic risk shaped the differential incorporation of households into the
financial economy. Households were pushed to adjust their lifestyles in response to this new
economic order. But financial markets also dangled the prospect of new opportunities to maintain
or enhance one’s lifestyle (Rajan, 2010). Indeed, popular discourses about financial investment
tend to frame these markets as a “brave new world” in which entrepreneurial agents can advance
themselves through active management of their financial and human capital (Langley, 2008). So,
for example, Dwyer, et al. (2011) provocatively demonstrate that young people who use credit
cards and student loans to enhance their life chances experience positive changes in their self-
esteem.
Financial Adaptation: Credit, Lifestyle, and Emergence of a Finance Culture
Obviously, people at different levels of the income, wealth, and education distributions
faced very different economic prospects and might have made quite different decisions. In order to
theorize households’ behavior it is useful to consider the sociological concept of lifestyle. Lifestyle
can be conceived of as the cultural meanings and identities attached to consumption (Bourdieu,
1984; Sobel, 1981). What we consume has a meaning that reflects who we are and how we want
others to perceive us (Schor, 1998). It draws boundaries and allows privileged groups to claim
social distinction (Bourdieu, 1984). It also ratifies inclusion within broader identity groupings, such
as consumption standards that qualify one as having a “middle-class lifestyle.”

7
In our paper, the main measure of a household’s position is its relative place in the socio-
economic status (SES) distribution. We conceive of socio-economic status as an index measure
based on a household’s income, assets, and educational attainment. The most influential
sociological statement on lifestyles views them as product of one’s location on two separate
dimensions of status: economic and cultural capital (Bourdieu, 1984). We opt to use a single-
dimension measure because it better serves our analytic purposes. Unlike Bourdieu, we are not
interested in what people are consuming per se, but instead in their ability to maintain their lifestyle
given their current resources. Since income inequality and the prospects for those with differing
levels of education shifted dramatically in the U.S. in the past 25 years, it follows that the lifestyles
of households at any level the distribution became more difficult to sustain, particularly relative to
those who were situated just above you. As the share of income and wealth at the top of the
distribution increased, it heightened pressures on those below to try to keep up (Frank, 2007;
Charles and Lundy (2012).
Most people’s reaction to threats to their lifestyle and consumption involve trying to
preserve their style of life (Elias 1994). In the past 25 years, the easiest way to close the gap
between what you were earning and what you needed to preserve your position was to borrow
money. To accomplish this, there had to be a huge expansion of credit (Rajan, 2010; Hyman,
2011). During the 1970s, many lower-income and minority households had long had only limited
access to credit (Krippner, 2011). But, after 1985, securitization was used to create bonds not just
from mortgages, but second mortgages, home loans, student loans, and credit card debt. This
propelled a broad expansion of the credit availability to all sorts of households (Rajan, 2010;
Kendall, 1996; Erturk et al., 2007).1 Deregulation and the advent of new credit-scoring and
classification techniques facilitated this broad-based expansion by allowing lenders to tailor
product offerings and credit pricing to the calculated risk profile of each borrower (Rona-Tas and
Hiss, 2010; Fourcade and Healy, 2013). Although the terms and prices of these products varied,
they were marketed aggressively across the income distribution. In the aggregate, it would appear
that credit expansion allowed Americans to compensate for their growing insecurity, thereby
maintaining their lifestyles and positions in the status hierarchy (Hacker, 2006; Leicht and
Fitzgerald, 2007).
Of course, protecting one’s lifestyle in response to economic change involves not
only maintaining current consumption, but also securing one’s future position. Here new

8
investment opportunities, particularly the mass-participatory booms in the stock market during the
1990s (Kremp, 2011) and in real estate markets during the 2000s (Goldstein, 2014), offered
households new avenues to supplement their income and wealth. Here again we might expect that
labor market insecurity may have also played a role by spurring more households to embrace
investment as a substitute for the economic security that had formerly derived from the stable
career and defined-benefit pension (Langley, 2008). In the case of real estate, investment activity is
closely associated with increased mortgage borrowing activity.
So far, we have only discussed the idea that in order to protect their lifestyles various
groups would adapt by consuming more debt and investment products. This implies a quantitative
expansion in their financial activities. But, another provocative idea is that a new cultural frame
emerged during this period. By this, we mean a set of understandings that people use in order to
take a more active stance towards their financial affairs. Beginning with pension reform and the
switch from defined-benefit to defined contribution plans, Americans have been encouraged to
shift their outlook from being passive to proactive financial subjects (Langley, 2008). Davis (2009)
argues that as households have been integrated in financial markets more directly, they have had to
learn to think like financial economists in order to manage their consumption, investments, and
debts. Such arguments suggest that financialization also entailed a qualitative shift in households’
orientation toward financial activities, which we refer to as a “finance culture.”
It is useful to elaborate what we mean by “finance culture”, and how we use it analytically.
The idea of “finance culture” as we use it is based on a toolkit model of culture (Swidler, 1986).
This means that people have a set of concepts that they utilize to interpret and orient action in
particular situations. In this case, as American have become confronted with more financial
products and discourses, they have developed notions about how to manage their finances that
reflect changed views on what an asset is, what debt is, and how can one’s assets can be leveraged
to allow one to live the life one aspires toward. So, for example, one would not have to go very
back into time (say as late as 1990) to discover that most people saw their houses primarily as a
place to live, not as an asset to be deployed and borrowed against. The finance culture thesis
implies that as financial products have proliferated since the early 1990s, a growing portion of U.S.
society have come to think about their economic lives in distinctly financial terms. By developing a
cultural toolkit that allows them to engage in ever-more elaborate financial strategies, these
households have sought to put financial resources to work in order to enhance their lifestyles.

9
Empirically, this means that more households began to look at their income and wealth as
assets to be deployed. They also learned to embrace risk-taking and to relax their attitudes towards
taking on debt. These attitudinal shifts were accompanied by a set of concrete financial strategies
to accomplish this end. Active stock trading, using leveraged home equity to fund investments, and
investing in real estate (“house flipping”) are all indicators of a more thoroughly financialized
repertoire.
We should emphasize that we do not intend the finance culture thesis as a competing
account that "explains" the increased consumption of financial products better than other
institutional, material, or technological factors. To the extent that these cultural shifts occurred, we
suspect that they are as much a consequence of the growth of financial services as a cause.
Unfortunately, our data does not allow us to disentangle such causal dynamics at the individual
household level. For the purposes of the present analysis, we treat the expanded consumption of
financial products and the adoption of a finance culture as analytically separate dimensions of
fianncialization. We use available indicators to assess the extent to which each has occurred across
the SES distribution.
Hypotheses
It is useful to formalize these arguments into a set of hypotheses. We first consider the
degree to which households felt that their lifestyles were under some pressure. As the U.S. society
became more unequal over much of this period, we posit that those at the bottom of the distribution
were more likely to perceive their income had declined than those at the top (Western, et. al.,
2012).
Hypothesis 1: Lower SES households are more likely to perceive that their incomes have
been falling over time. Only the highest SES groups will perceive that their incomes have been
rising or remained stable over time.
We next consider the growing consumption of financial products and services. The
preceding discussion suggests that households throughout all but the very top of the distribution
have felt heightened lifestyle pressures because of growing income inequality, labor market risks,
and changes in benefits like pensions and health care. Financial services firms saw this as an

10
opportunity to sell more financial products to all segments of the distribution and provide financial
advice to clients in order to secure their business.
Hypothesis 2: Because of the expansion of financial services, there should be a general
increase in the holding of all kinds of financial instruments including bank accounts, credit cards,
stock or mutual funds, and the use of home equity to take cash out from a house across the SES
distribution. There should also be an increase in the use of professionals who provide such advice.
To what extent did expanded financial consumption coincide with the spread of a finance
culture at different points in the stratification structure? We generate several versions of this
hypothesis in order to highlight the difference of opinions about the both existence and scope of
such a culture across the SES distribution. A null hypothesis is that consumption of financial
products and services grew without any attendant shift in cultural repertoires. In other words, there
was no finance culture.
Hypothesis 3a: Attitudes towards debt and risk did not change across SES groups even as
access to financial products increased.
The opposite possibility, implied by Davis (2009), is that everyone became more
financially savvy as they were encouraged to take responsibility for their economic futures and as
the financial services industry marketed products more widely and aggressively. Households
embraced taking on financial risk and became comfortable with going into debt to support their
lifestyles. Households across the distribution actively managed their assets by participating in the
stock market and using their house to borrow money to support their lifestyles.
Hypothesis 3b: As their consumption of financial products increased, all households across
the SES distribution developed more of a finance culture whereby they had more of a taste for risk
and a more relaxed attitude towards taking on debt. We should see more stock market investment
and more withdrawal of home equity to support households’ current lifestyles across the SES
distribution.

11
Another alternative emphasizes how the need to engage in financial behavior was spread
unevenly across the stratification structure. Since higher SES groups already had access to
financial markets, financialization is really about the popularization of finance whereby lower and
middle class groups increasingly come to adopt a financial orientation toward managing their
economic lives (Rajan, 2010). As incomes stagnated, lower middle class and working class
households, who had previously been less involved in financial markets, suddenly had both a
heightened impetus and expanded opportunities to participate.
Hypothesis 3c: We ought to observe households in the bottom 60% of the SES distribution
driving the expansion of financial practices. These groups began the period with the most latent
demand due to their previous impediments. They faced the strongest pressures to become more
financially attuned as a way to finance a better life in the face of growing inequality and declining
incomes.
The opposite might have been taking place. Given that income inequality rose most at the
very top, one can theorize that pressures on people’s lifestyles were most acutely felt first by those
in the upper middle class (80-98% in the income distribution) and to a lesser extent by the middle
classes (40-80% of the income distribution). These were the households who most struggled to
keep up with the rising price of positional goods like housing and schools, particularly in high
priced urban areas. These households had more financial resources to begin with and they were
able to take advantage of the expansion of new financial opportunities. But in order to do so, they
needed to change their attitudes towards risk and debt. They needed to take active control over
their income and wealth and deploy their resources more aggressively. These households saw the
rising stock market in the 1990s and the rising housing market in the 2000s as exploitable
opportunities. As a result, we expect that it is the upper-middle part of the income distribution was
where the finance culture took root most widely.
Hypothesis 3d: It was predominantly in the upper-middle SES strata where households not
only felt the need but also had the means to take more responsibility for their financial welfare.
They bought more stocks and began to see their houses as assets and their mortgages as ways to
get financial leverage. As a result, they use debt more creatively to engage in status competition for
positional goods, particularly housing.

12
Data and Methods
One needs data over time that documents both socioeconomic characteristics, attitudes
towards risk and debt, and financial activities in order to examine these alternative patterns of
household financialization. The Federal Reserve has conducted the Survey of Consumer Finances
(hereafter, SCF) every three years since 1989 (1989, 1992, 1995, 1998, 2001, 2004, and 2007). The
SCF offers the most comprehensive and consistent source of data that includes attitudes towards
various kinds of financial risks, sources of financial information, and detailed information on
sources of debt and investment. The SCF is a repeated cross-sectional survey. Each cross-section
includes approximately 4000 households with an oversample of high-income households (for more
information on the surveys, see www.federalreserve.gov/econresdata/scf/scfindex.htm).2 One
might prefer longitudinal data that tracks households over time, but the SCF is appropriate for the
present purpose, which is to describe the distributional contours of household financialization.
The primary aim is to track how financial attitudes and behaviors spread across the socio-
economic status distribution. The basic strategy is to chart the patterns for various attitudinal and
behavioral indicators broken down by different levels of SES, and consider how these patterns
changed over time. We perform statistical tests to determine whether or not our indicators have
changed significantly from the first measurement to the last measurement. We use z-tests to see if
the percentage within an income category has changed and t-tests for tests of differences between
means. We measure households’ position in the stratification structure using a socio-economic
status index constructed from a principle components factor analysis on respondents’ (log) income,
(log) assets, and years of education. We note that constructing quantiles only from
household income produces substantively identical results.
We break this down into seven percentile groups (“quantiles”) in order to index a
household’s relative position in the stratification structure: 0-20%, 20-40%, 40-60%, 60-80%, 80-
90%, 90-98%, and 98-100%. All of the figures we report refer to either the proportion or the mean
within each quantile. Because the SCF is a stratified sample, we used sampling weights in order to
allocate each observation to the appropriate quantile groups. The over-sampling of high net-worth
households in the SCF allows us to calculate valid estimates for the smaller quantiles at the top. 3

13
We utilize survey weights in order to render our descriptive estimates representative of the
population of U.S. households.
In order to measure how households feel about how they have fared in terms of pressures
on their lifestyle, we use the following question: “Relative to the prices for things you buy has your
income increased in the past five years, remained constant, or decreased in the past five years”.
This question captures the degree to which a household feels itself a winner or loser in the recent
economic race. It offers a way to measure the pressures households feel on trying to preserve their
lifestyles.
In trying to measure the existence of a finance culture, we include both attitudinal and
behavioral measures. The attitudinal measures in the SCF are less extensive than we would ideally
like. We choose two attitudinal measures that get at aspects of a finance culture (neither of which is
perfect). One aspect of a finance culture is a respondent’s attitude towards risk. Taking financial
risk is core to thinking financially. To index the degree that households are comfortable assuming
more risk, we use the following question in the SCF:
Which of the following statements on this page comes closest to the amount of financial
risk that you are willing to take when you save or make investments?
1. Take substantial financial risk expecting to earn substantial returns
2. Take above average financial risks expecting to earn above average returns
3. Take average financial risks expecting to earn average returns
4. Not willing to take any financial risk
In our analyses, we collapse this question into three categories: take substantial or above
average risks, take average risks, and take no risks. For a discussion of the meaning of this
measure, see Grable and Lytton, (2001).
One of our arguments about the finance culture is that households adopt a more
relaxed attitude towards debt. If households decide to tap into the equity on their house by
refinancing or taking out a home equity loan, they are taking on debt now to fund current

14
consumption. The SCF does not contain a general question about attitudes towards taking on debt.
But, the SCF does ask “Do you think it is right to borrow money to fund expenses when one’s
income declines?” This question is answered “yes” or “no”. We expect that over time if there is a
finance culture, more people will answer “yes.”
Results
Income Pressures
Figure 1 presents perceptions of the household’s real income growth over the preceding
five years, broken down by SES quantile. The top panel shows the percentage who report negative
income growth, while the bottom panel shows the percentage who report positive income growth.
The remainder represents those who report constant real income (not shown). There are two main
trends apparent in the figure. First, there is a statistically significant decline over time in the
percentage of households who feel that their income has gone up and an increase in those who
have felt that their household income has gone down. Overall, the percentage of households
experiencing negative income growth rises from 32% in 1989 to 42% in 2007 (z=-9.82, p<.01),
with particularly significant growth after 2001. Meanwhile, the percentage of households who
perceive their income as having risen has dropped dramatically from 28% in 1989 to 18%
(z=11.27, p<.01) by 2007. This sobering fact implies that nearly half of American households are
feeling downward pressure on their current style of life and consumption. We note that this does
not include data from 2010 after the financial crisis when one could expect that household income
would have dropped even further.
(Figure 1 about here)
The second important pattern is the clear association between income trajectory and SES
level. When we consider how perceived income growth varies across quantiles, we see a pattern
that confirms hypothesis 1. The groups in the bottom 90% of the distribution all report statistically
significant declines in their income over the past 5 years. The top 10% of households report no
statistically significant change over the period. The groups in the bottom 90% of the SES
distribution also report statistically significant declines in upward income mobility over the past
five years. These results dramatically show the effects of 18 years of increasing inequality in the
U.S. Only in the top 10% of the SES distribution do the majority of households report similar

15
percentages of income growth at the beginning and the end of the period. Poor families, middle
class families and even upper middle class families (80-90% percentiles of the SES distribution)
have faced stagnant or declining income.
Household Financialization 1: Financial Holdings and Consumption of Financial
Services
We know that the financial services industry has greatly expanded its activities in the past
20 years. It follows that this supply side increase of all sorts of services and tools must trickle over
to households. After all, someone is holding all of those mortgages, home equity loans, student
loans, credit cards, debt, stocks and mutual funds. Figures 2-5 provide a test of hypothesis 2, which
states that households throughout all but the very top of the SES distribution will increase their
consumption of financial services. We note that we have only included a limited number of
financial products in our analyses. This could affect our analyses of lower SES groups most
directly. Such groups often rely on different financial services than middle class households. They
are more likely to use pawn shops, payday loans, loans on tax returns (for a review, see Barr,
2012). Unfortunately, there is little information in the SCF on these types of financial instruments.4
The degree to which these types of services might lead us to underestimate the financialization of
lower SES groups should lead to some caution in interpreting the results.
Figure 2 presents data on the number of accounts of all forms other than credit cards that
households have with financial institutions. Here we see roughly parallel growth across the SES
quantiles, which implies that financial services firms were able to get households throughout the
distribution to increase their consumption of their products. The changes in the average number of
accounts from 1992 until 2007 are statistically significant for each quantile except for the top 2%.
But, clearly the differences between the levels of consumption remain across quantiles. The highest
SES households had somewhere around 5.5 such accounts in 1992 and that grew to 5.6 in 2007
while the lowest income household only had 1 in 1995, which grew to 1.5 in 2007.
(Figure 2 about here)
Figure 3 contains data on the average number of credit cards in each household by SES
quantile. Here, we see a similar pattern. There is a statistically significant increase in the number of
credit cards held by each group from 1989 until 2007. While higher SES households tend to have
more credit cards in general, the financial industry succeeded in getting all people to open and

16
maintain more accounts. The slightly widening gap between the top income groups and the bottom
suggests this trend was more pronounced among the affluent.
(Figure 3 about here)
Figure 4 presents data on whether or not households get professional advice when making
investment or borrowing decisions. Seeking out financial advice implies that people are more
connected to the financial services industry, and that their decision-making is more likely to be
guided by such contacts. The question asks whether or not a household gets advice from a wide
variety of sources and respondents can answer as many of the categories as apply. We consider the
following responses to be a professional: lawyer, accountant, banker, broker, or financial planner.
If the household identifies any one of these, they are coded as having used the services of a
financial professional. There is no statistically significant change in the percentage of people who
used financial professionals to get information within any of the quantiles from 1998 until 2007.
The figure does show quite clearly, however, that the use of such professionals is highly related to
income. The top of the income distribution is nearly 50% more likely than the bottom 20% to seek
out such advice.
(Figure 4 about here)
Figure 5 shows the growth of stock or mutual fund ownership by quantile. The
measure we use does not include retirement accounts or pension plans that invest in stocks. It only
includes whether or not the household owned stocks or mutual funds directly (Kremp, 2011). This
is a good measure of the degree to which households are financially oriented because stock or
mutual fund ownership outside of the context of pensions requires people to actively seek out stock
brokers or brokerage firms. As with all other indicators of financial involvement, there are large
differences in stock ownership across income groups over time.
All of the income groups were increasing their holdings during the stock bubble of
the 1990s and early 2000s, with declines after 2001. However, even with the declines, there is a
statistically significant increase in owning stocks or mutual funds by households at all levels of the
income distribution except the 90-98%. The biggest movement (both upward and downward)
occurs in the 80-90% and the 98-100%. This overall trends show that the upper middle class were
the largest participants in the riskiest part of the financial economy. Meanwhile, ownership
expansion in the middle portions of the distribution was more modest during the 1990s. But the
gains were also more permanent: by 2007 the ownership rate in the 60th-80th percentile was still

17
10% greater than 1989. In spite of having a statistically significant change in stock ownership for
the bottom 60% of the SES distribution, their rates of stock ownership remained below 20%
throughout the period.
(Figure 5 about here)
All households became more involved in the financial system over time in line with
hypothesis 2. They held increasing numbers of credit cards and other accounts including
mortgages, bank accounts, and equity and mutual funds. Not surprisingly, variations in financial
market involvement are strongly related to one’s socio-economic position. The highest income
groups consistently held more of all of these financial services and instruments and they ended up
consuming more of them over time. We offer two conclusions. First, obviously one needed to have
money to invest in order to consume financial products and gain access to credit. Second, is the
fact that the trend lines tend to grow in parallel. That is, consumption of financial services into
households’ financial decision-making rose roughly in tandem for all income groups over time.
This suggests that the aggressive expansion of the financial services industry was successful in
servicing all parts of the income distribution with more products, not just the most wealthy.
Household Financialization 2: Finance Culture and Financial Savvy
In this section we turn to analyzing attitudinal and behavioral indicators of more active or
savvy financial management. Our null hypothesis, hypothesis 3a, is that no one had to change their
attitudes to increase their involvement with financial products as the industry pushed to sell
everyone as much as they could. Our other versions of hypothesis 3 explore the idea that some
income groups were more likely than others to change how they thought about active financial
management either because of necessity, opportunity, or a mix of both. One useful attitudinal
indicator is the degree to which individuals are altering their conceptions of risk. In our theoretical
discussion, we argued that willingness to take on risk reflects a more informed and aggressive
orientation toward financial market participation. Hypothesis 3 b-d offered different views about
how attitudes towards risk might have changed within different portions of the SES distribution.
The SCF data indicate that risk tolerance among American households rose sharply during
the 1990s, but then retreated a little after 2001. We suspect this pattern reflects increasing
household participation in the stock market during the bubble of the 1990s, which was followed by
the stock market crash in 2001. Overall, the percentage of households who say they take no

18
financial risks declined from 47% in 1989 to 35% in 2001, and then crept back to 39% in 2007,
which is still a statistically significant change. The percentage of households who say they take
above average or high risks rises from 14% in 1989 to 25% in 2001 and then dips to about 22% by
2007 (also a statistically significant difference). This implies a rejection of hypothesis 3a that there
was no change in attitudes towards risk. The timing of these changes is consistent with Akerlof
and Schiller’s (2011) argument that the rising stock market attracted households who wanted to be
part of the “new” economy and accustomed them to be more comfortable with risk-taking (see also
Langley 2008). There is some cyclicality in the risk responses over time that reflects recent stock
market performance (Yao, et al., 2004), but some of the shift appears to be permanent. It is worth
emphasizing, however, that between 75% and 85% of all households report taking either average
risk or no risk throughout the period. If a self-conscious culture of aggressive financial risk-taking
emerged in the U.S., it is restricted to less than a quarter of households.
Figure 6 shows the proportion of households who see themselves as taking above average
or high risks, broken down by SES quantiles. This figure will allow us to evaluate hypotheses 3b-d
about which groups might have shifted their attitudes towards risk. The figure dramatically shows
a huge difference in risk tolerance for the top and bottom of the distribution. In the bottom 40% of
the distribution, only 10% embrace above average or high risk, and this changes little over time. At
the top of the distribution, above average risk-taking grows from about 20% of the households in
1989 to 45% in 2001. The more prevalent spread of aggressive risk orientations at the top is
consistent with hypothesis 3d. Over time, we see a statistically significant increase in having an
above average or high tolerance for risk within the quantile groups 40-60%, 60-80%, 80-90%, 90-
98%, and 98-100%. There is no statistically significant change within the 0-20% and 20-40%
groups. The change in risk taking is really a product of the top 60% of the distribution and
especially the top 20% of the distribution.
(Figure 6 about here)
The results in figure 6 suggest that hypothesis 3b is wrong. It is not the case that all
households shifted their attitudes towards risk, as Davis (2009) has suggested. Hypothesis 3c,
based on Rajan’s work (2010), stated that lower income groups should have adopted more risky
attitudes towards finance given the dramatic increases in inequality. The data do not support this
idea either. The evidence is most consistent with hypothesis 3d, which suggests that a finance
culture that involves taking more risks is focused on the middle and particularly upper middle part
19
of the income distribution. It is these households who felt the need to compete with other high SES
households over positional goods like housing and schools and it was these households who had
the opportunity and wherewithal to shift their views of financial risk.
Norms about Debt-Funded Consumption
We next consider the degree to which people embrace more liberal norms about the
appropriateness of debt-funded consumption to maintain one’s lifestyle in the face of income
shocks. Given that so many households, particularly in the bottom part of the SES distribution have
experienced increasingly negative income growth over time, it is interesting to explore how their
attitudes about using debt to support their lifestyles may have changed.
Figure 7 shows that there has been a substantial increase from about 45% to about 55% in
the proportion who feel it is okay to borrow to support one’s lifestyle if income declines. The
overall difference is statistically significant at the .05 level. This increase is statistically significant
for those groups whose incomes have increased or remained constant. But it is statistically
insignificant for those who say their incomes have decreased. We interpret this to mean that those
who are facing downward income mobility have always had a more open attitude towards taking
on debt in order to support their lifestyles. In the face of income decline, they have always been
willing to go into debt to support their current lifestyle. What has changed is that those whose
incomes are constant or rising agree in increasing numbers over time that it is permissible to go
into debt to support one’s lifestyle. Those who have experienced positive income growth actually
exhibit the largest change in agreement, from about 42% in 1989 to 55% in 2007.
(Figure 7 about here)
The bottom panel of Figure 7 shows responses to the same question, broken down by
groups who share levels of household indebtedness (household debt-to-income ratio). Here again
there is a broad-based upward trend in the percentage of households who believe it is permissible
to go into debt holds to support one’s lifestyle. The change in attitudes is statistically significant for
those in the 25-50%, 50-75%, and 75-100% groups. Amongst the least indebted quartile, people
maintain a less positive view of going into debt and this negative attitude towards debt does not
change over time. The percentage of this group who approve of such behavior grows only from
about 41% to 44% over the period. But for the other 75% of the indebtedness distribution, a
majority supports the new norm of borrowing to sustain one’s lifestyle in the face of declining

20
income, and they converge to a higher rate of approval over time. Overall, patterns in figure 7
suggest a secular shift in beliefs about using debt to fund one’s lifestyle when times get bad.
Our attitudinal measures provide evidence that American households became willing to
take on more financial risk over time and that they became more accepting of debt as a tool to
support a given lifestyle against income shocks. But, these shifts also imply quite different social
processes for different ends of the income distribution. The top of the income distribution, which
has seen the most income gains from 1998-2007, has become much more accepting of risk and
more accepting of borrowing when times become difficult. The bottom of the income distribution
rarely takes financial risks but has always been willing to find borrowing acceptable to keep a
lifestyle in place. Those in the middle and upper middle classes have gotten used to higher levels of
risk and reward and are more comfortable with going into debt to support their lifestyles. This
offers overall support for hypothesis 3d, which argues that if there is a new finance culture, it is
most prevalent in the upper-middle and top parts of the SES distribution.
Frequency of Stock Trading
Earlier we argued that a finance culture does not just imply a shift in attitudes
towards debt and risk, but also more active management of financial assets. Figure 8 shows the
average number of annual transactions reported across the income categories among those
households who have a stock brokerage trading account. Note that the 0-20th quantile is omitted
because the very small number of stockowners in this category results in unstable estimates. We
see the familiar pattern whereby the active trading of stocks grows higher as one goes up in the
income distribution. There are statistically significant changes over time in the average number of
annual trades for the 60-80%, 80-90%, and 90-98, and 98-100% groups. There are no statistically
significant changes in the number of trades for people in the 20-40% and 40-60% groups. This is
more support for hypothesis 3d. We note that for the 90-98%, stock trades increased from an
average of 4.6 to an average of 11.4 while for those in the top 2%, stock trades increased from 9.7
per year to 17.1. This is strong behavioral evidence that not only did attitudes towards risk change,
but levels of engagement in risky financial markets increased in parallel.
(Figure 8 about here)
The House as an Automatic Teller Machine (ATM)

21
The final indicator of finance culture we examine, is the incidence and uses of home equity
borrowing. Davis (2009) has argued that home equity borrowing is a consummate instance of a
finance culture insofar as it involved a) conceptualizing houses as income-producing capital assets,
and then b) using debt in order to leverage against the asset to pursue various other economic
purposes. Goldstein (2014) has shown that the bulk of household debt-to-income growth from
1989-2007 comes from three sources: mortgages on primary residences, home equity loans on
those residences, and the purchase of other real estate including second homes and commercial
property by households. Home equity debt was the fastest growing type of debt from 2001 through
2007. This reflects the real estate bubble of this period, when many households took advantage of
rising housing prices by borrowing money against their increasing equity. Greenspan and Kennedy
(2008) estimate that households were extracting over $500 billion in equity annually on average
from 2002-2007.
Figure 9 shows the proportion of all homeowners with home equity borrowings, broken
down by SES quantile. The overall upward trend is dramatic. This includes any home equity
loan balances, active use of home equity lines of credit, or balances on refinanced
purchase mortgage in which the borrower extracted additional cash. The plots
begin at 1995 because the SCF contained only limited data on equity extraction for
earlier years. By 2007, approximately one third of all homeowners carried some sort of home
equity debt for purposes other than purchasing the property. There is a statistically significant
increase in the use of home equity borrowings within all quantiles through the period except for the
98-100%. This implies that the financial services industry successful sold home equity withdrawals
to all income groups. This provides some support for Davis’ view that the active management of
home equity spread across society.
Patterns of home equity borrowing also reflect the effects of rising relative income
inequality on financial involvement. The 90-98% group took out the most home equity followed
by the 80-90% and the 60-80%. This is evidence that in order to maintain their lifestyles, these
middle and upper middle class groups had to take more money out of their houses to engage in
other forms of consumption. However, we see clear effects of income levels on the changes in this
practice. As borrowing against one’s house became easier and more commonplace during the
housing bubble years, it was a way for the middle and upper-middle classes to keep up with the
lifestyles of those above them.5

22
(Figure 9 about here)
For what sorts of consumptive purposes were households using extracted equity? Figure 10
shows the percentage of all homeowners who report using an outstanding home equity loan or cash
taken out from refinancing for the given type of purpose. Note that homeowners who have multiple
home equity loans could be counted for multiple purposes. Over time, we see statistically
significant increases in the percentage of homeowners who borrow against their house for two
different sets of purposes: investments and home renovations on the one hand, and paying daily
living expenses and bills on the other hand. This fits with the view that homeowners increasingly
saw their houses as assets and sought to leverage against them in order to maximize their market
value and increase salability (e.g. by installing luxury kitchens). But they also increasingly saw
them as tools to fund consumption by covering living expenses and paying off bills.
Only a small portion of homeowners borrowed to fund “extravagant” consumption like
home entertainment systems, vacations, wedding parties, recreational vehicles and boats. The
incidence of this behavior did not change in a statistically significant fashion over the study period.
This casts some doubt on the popular view that home equity loans were being widely used as a
cash machine to fund luxurious lifestyles. We note that there may be a social desirability
effect at work here. Admitting to borrowing money to fund what some may view as
frivolous activities means that these purchases are underreported. Nor were a
significantly growing number of homeowners extracting equity for educational and/or medical
expenses. Only 1-2% of homeowners report doing so throughout the study period. Instead,
homeowners were most commonly reinvesting borrowed equity into their house, or alternatively
using it to cover “normal living expenses” and pay off credit card bills.
(Figure 10 about here)
Of course, we would expect different uses of borrowed equity would be relatively
more concentrated in different parts of the SES distribution. Figure 11 examines how people spent
money extracted from their homes across in order to see if the distribution of uses differs
significantly across the SES quantiles. This figure is based only on the 2007 SCF cross-section,
and it focuses only on the two most frequent uses of borrowed equity discussed above. Several
patterns are apparent. First, the relative likelihood that a home equity borrower uses borrowed
equity to reinvest in their housing asset is high throughout the SES distribution. Even in the bottom
quantiles, homeowners who extracted equity were at least as likely to do so in order to fund

23
reinvestments as they were to fund living expenses (although a lower proportion of homeowners
are borrowing at all in the bottom quintiles). However, we also see that a significant minority of
equity borrowing went to cover general living, educational, or medical expenses all the way up to
the 90th percentile of the distribution. Only in the top 10% is there a clear divergence. This is
particularly pronounced in the top 2% group, where 20.4% of homeowners report using their
borrowed equity for investment/home renovation, compared to 3.7% who use borrowings for
expenses. One way to interpret these trends is that a significant number of households up to the
90th percentile were experiencing a middle class squeeze whereby they had to use their borrowed
money to fund living expenses. This supports the argument that lower and middle-class groups are
using credit more defensively to maintain their current lifestyles while the highest SES groups are
using their resources to expand their wealth by investing in their real estate assets.
(Figure 11 about here)
Summary
We conclude that if there is a new finance culture, the evidence suggests that those in the
middle and particularly upper middle classes have been the ones to embrace it. The upper middle
class (roughly 80-98% in the SES distribution) have become accustomed to taking on risk, trading
frequently in the stock market, and demonstrating their financial savvy by using the equity in their
homes to fund investment and home renovation. They have done so as their incomes have
remained stable or increased. Those in the middle class (40-80%) have also became more
financially oriented in order to maintain their lifestyles, but to a lesser degree. The lowest SES
groups did not change their attitudes towards risk and debt significantly. Their increased
participation in financial markets reflected their need to defend their existing lifestyles more
actively with debt. It is clear that the most intensive and multi-faceted finance culture centered
amongst the most well off 20% of the population.
Conclusions
The huge expansion of financial services in the U.S. since the early 1990s made financial
products more readily available to everyone. But, these opportunities were differentially distributed
across the income distribution. While all households have been involved in the expansion of

24
financial services over the past 20 years, the most well off households continue to lead across
every category of financial services consumption. Even as the much discussed “democratization”
of finance and the rise of “sub-prime” lending have brought more lower-income households into
the financial economy, this has not undermined the strong effect of income level on participation.
We see the clear effects of stratification when we consider the growth of a finance culture.
In contrast to the parallel trend lines for financial services consumption, the development of
financialized attitudes and strategies appears most strongly in the 80-98% of the income
distribution, and to some degree into the middle class (40-80% of the income distribution). For
those in the upper middle class, while their incomes did increase, they were still falling behind
those in the top 2%. The evidence shows that they adopted a more aggressive attitude towards risk
and engaged in more financial activities to support their lifestyles.
For the 40% of households living at the bottom of the income distribution, life chances
have declined dramatically in the past 20 years. Their income growth is negative, they are
vulnerable to not having enough money to survive, and as a result tend to be extremely risk averse.
For these households the growth of finance has meant new products to cope with a changing
economic landscape. Because we lacked data, our results certainly understate the degree to which
poorer households also paid more for this credit by using products with high interest rates or
significant fees (bank overdrafts, refund anticipation loans, payday loans). When they borrow, they
tend to use their borrowing for routine household expenses such as paying bills, medical expenses
or financing education. The rapid expansion of credit availability to those in the bottom 40% has
not produced a finance culture.
Our results imply a number of research opportunities. We have focused on single summary
measure of SES position. One can hypothesize that multi-dimensional measures of stratification
will produce a more nuanced picture of the precise clusters of people who have adopted the finance
culture. For example previous research shows that that young educated white males may be less
risk averse than similarly situated women and minorities (Yao, et al., 2005). It would also be useful
to further disentangle age, period, and cohort effects within the aggregate trends. The SCF provides
a great data source to explore how stratification interacts with financial styles in more complex
ways.
The idea that a finance culture has taken hold in the top part of the income distribution
needs to be explored more fully. We have been careful to avoid implying that finance culture

25
represents some kind of exogenous cultural shift that has independently come to affect our
identities. Instead, we have conceived of it as a cultural frame that make some people look at what
they own as assets and offer an appropriate set of tactics to manage our risk, debt, and equity. Our
analysis relies on attitudinal and behavioral proxies that are consistent with this view, but not
definitive proof. We need to understand the mechanisms through which people are socialized into
the finance culture, how they come to develop the skills and knowledge to engage in being more
entrepreneurial about their investments. Scholars should also further explore the extent to which
these cultural shifts endured in the wake of the recent financial crisis. Finally, the causal
connections between the expansion of financial services and emergence of a finance culture needs
to be explored more fully at the individual level.
Lastly, research should consider the degree to which increased levels of participation in
financial markets, and the American-style household finance culture has expanded to other
countries (Kus 2013). Many of the advanced industrial countries have experienced increases in
income inequality in the past 20 years, as well as financialization of their broader economies.
Many of these societies have also witnessed financial and labor market deregulation. There have
been constant political struggles, particularly in Europe, over maintaining current levels of the
social safety net. One would predict that the pressures for households to become more indebted
and adopt a finance culture are most likely to occur in the other liberal market economies like
Great Britain, Australia, and Canada. But households in many social democracies also faced these
pressures on their current lifestyles and how they have responded is an important question for
subsequent research.
We have tried to center our discussion of the change in finance culture in a broader
sociological discussion about stratification and growing inequality. Our results imply that growing
income inequality has pushed middle and upper middle class people to adopt a more aggressive
attitude towards the management of their assets in order to maintain and expand their lifestyles and
“keep up with the Jones” in the top 2% of the income distribution. This has meant that they need to
embrace financial savvy and knowledge in order to manage their equity and debt and thus be able
to afford the good things. For lower income people, growing inequality has meant making it harder
to keep your head above water. Taking on debt has been part of the answer, albeit one that comes
with costs.

26
References
Aalbers, M. B. (2008). ‘The Financialization of Home and the Mortgage Market Crisis’,
Competition & Change, 12, 148-66.
Aaronson, D. and D. Sullivan. (1998) ‘The decline of job security in the 1990s: Displacement,
Anxiety, and their effect on wage growth’, Economic Perspectives, 22, 17-43.
Akerlof, G. A., and R. J. Shiller. (2010) Animal Spirits: How Human Psychology Drives
the Economy, and Why It Matters for Global Capitalism, Princeton, N.J., Princeton University
Press.
Barr, M. (2012) No Slack: The Financial Lives of Low-Income Americans, Washington, D.C.,
Brookings Institution Press, 2012.
Baud, C. and C. Durand. (2012) ‘Financialization, globalization and the making of profits by
leading retailers’, Socioeconomic Review, 10, 241-26.
Bourdieu, P. (1984) Distinctions, Cambridge, Ma., Harvard University Press.
Charles, M. and Lundy, J. (2012) ‘The Local Joneses: Household Consumption and Income
Inequality in Large Metropolitan Areas’, paper presented at the annual meeting of the American
Sociological Association, Denver, Co., Aug 16-20, 2012.
Davis, G. (2009) Managed by the markets: How finance reshaped America, New York, Oxford
University Press.
Dynan, K. E., and D. L. Kohn. ( 2007) ‘The rise in U.S. household indebtedness: causes
And consequences’, Finance and Economics Discussion Series 2007-37, Washington, D.C.,
Divisions of Research & Statistics and Monetary Affairs Federal Reserve Board.
27
Dwyer, R., L. McCloud, and R. Hodson. (2011) ‘Youth debt, mastery, and self-esteem: class
stratified effects of indebtedness on self-concept’, Social Science Research,40, 727-741.
Elias, N. (1994) The Civilizing Process, Oxford, Eng., Blackwell Press.
Epstein, G. (2005) Financialization and the World Economy, London, Eng., Edgar Elgar.
Erturk, I., J. Froud, S. Johal, A. Leaver and K. Williams. (2007) ‘The democratization of finance?
Promises, outcomes and conditions’, Review of International Political Economy, 14, 197-216.
Farber, H. (1996) ‘The incidence and costs of job loss: 1981-1991’, Brookings Papers on
Economic Activity: Microeconomics, 73-132.
_______ . (1997) ‘The changing face of job loss in the United States, 1981-1995’, Brookings
Papers on Economic Activity: Microeconomics, 55-142.
Fligstein, N. and T. Shin. (2004) ‘The shareholder value society: a review of the changes in
working conditions and inequality in the United States, 1976-2000’, in Kathryn Neckerman (ed.)
The New Inequalities, New York, Russell Sage Foundation, pp. 401-432.
___________________ . (2007) ‘Shareholder value and the transformation of the U.S. economy’,
Sociological Forum, 22, 399-424.
Frank, R. (2007) Falling Behind: How Rising Inequality Harms the Middle Class, Berkeley, Ca.,
University of California Press.
Goldstein, A. (2014) ‘Income, consumption, and household indebtedness in the U.S., 1989-2007’,
Department of Sociology, University of California. Unpublished Manuscript.
28
Grable, J. E. and R. H. Lytton. (2001) ‘Assessing the concurrent validity of the SCF Risk
Tolerance Question’, Financial Counseling and Planning, 12, 434-54.
Greenspan, A. and J. Kennedy.(2008) ‘Sources and Uses of Equity Extracted from Homes’, Oxford
Review of Economic Policy, 24, 120–144.
Greenwood, R. and D. Scharfstein. (2012) ‘The growth of modern finance’, National Bureau of
Economic Research Working Paper #2162179, Cambridge, Ma., NBER.
Hacker, J. (2006) The Great Risk Shift, New York, Oxford University Press.
Hyman, L. (2011) Debtor Nation: A History of America in Red Ink, Princeton, N.J., Princeton
University Press.
Kalleberg, A. (2009) ‘Precarious work, insecure workers: Employment relations in transition’,
American Sociological Review, 74,1–22.
Kendall, L. T. (1996) ‘Securitization: a new era in American finance’ in L.T. Kendall and M.J.
Fishman (eds.) A Primer on Securitization. Cambridge, Ma., MIT Press, pp. 1-24.
Kremp, P. (2010) ‘From Main Street to Wall Street? The determinants of stock-market
participation and their evolution from 1995 to 2007’, Working paper, Department of Sociology,
Princeton, N.J., Princeton University.
Krippner, G. (2005) ‘The financialization of the American economy’, Socio-Economic Review, 3,
173–208.
__________. (2011) Capitalizing on Crisis: The Political Origins of the Rise of Finance,
Cambridge, Ma., Harvard University Press.
29
Kus, B. (2013) ‘Credit, consumption, and debt: Comparative perspectives’, International Journal
of Comparative Sociology, 54, 183-186.
Langley, P. (2008) The Everyday Life of Global Finance: Saving and Borrowing in Anglo-
America, New York, Oxford University Press.
Leicht, K. and S. Fitzgerald. (2006) Post-Industrial Peasants, New York, Macmillan Press.
Lin, K. and D. Tomaskovic-Devey. (2013) ‘Financialization and U.S. income
inequality, 1970–2008’, American Journal of Sociology, 118,1284-1329.
Manning, R. D. (2001) Credit Card Nation, New York, Basic Books.
Martin, R. (2002) Financialization of Daily Life, Philadelphia, Temple University Press.
McCloud, L. and R. Dwyer. (2011) ‘The fragile American: Hardship and Financial Troubles in the
21st century’, The Sociological Quarterly, 52, 13-35.
Mian, A. R. and Sufi, A. (2010) ‘House prices, home equity-based borrowing, and the U.S.
household leverage crisis’, University of Chicago Booth School of Business Research Paper No.
09-20, Chicago, Il., University of Chicago Booth Business School.
Mishel, L., J. Bernstein, and J.Schmitt. ( 2007) The State of Working America, Ithaca, N.Y.,
Cornell University Press.
Orhangazi, O. (2008) ‘Financialization and capital accumulation in the non-financial corporate
sector’, Cambridge Journal of Economics, 32, 863-886.
Porter, K.( 2012) Broke: How Debt Bankrupts the Middle Class, Stanford, Ca., Stanford University
Press.

30
Rajan, R. (2010) Fault Lines: How Hidden Fractures Still Threaten the World Economy,
Princeton, N.J., Princeton University Press.
Saenz, E. (2009) ‘Striking It Richer: The Evolution of Top Incomes in the United States’,
http://escholarship.org/uc/item/8dp1f91x, accessed on March 14, 2014.
Sennett, R. (1998) The Corrosion of Character: The Personal Consequences of Work in the New
Capitalist Economy, London, Norton.
Schor, J. (1998) The Overspent American, New York, Basic Books.
Sobel, M. (1981) Lifestyle and Social Structure, New York, Academic Press.
Survey of Consumer Finance. (2011) http://federalreserve.gov/econresdata/scf/scfindex.htm,
accessed on December 26, 2011.
Swidler, A. (1986) ‘Culture in action’, American Sociological Review, 51, 273-286.
Tomaskovic-Devey, D. and K. Lin.(2011) ‘Income dynamics, economic rents, and the
financialization of the American economy’, American Sociological Review 76, 538-59.
Tufano, P. (2009) ‘Consumer finance’, in A. Lo and R. Merton (eds.), Annual Review of Financial
Economics, 1, 247-67.
Trumbull, G. (2012) ‘Credit access and social welfare: The rise of consumer lending in the United
States and France’, Politics & Society, 40, 9–34.
Useem, M. (1993) Executive Defense, Cambridge, Ma., Harvard University Press.
Van der Zwan, N. (2014) ‘Making sense of financialization’, Socio-Economic Review, 12, 99-129.

31
Volscho, T. and N. Kelley . (2012) ‘The rise of the super-rich: power resources, taxes, financial
markets, and the dynamics of the top 1 percent, 1949-2008’, American Sociological Review, 77,
79-700.
Western, B., D. Bloome, B. Sosnaud, and L.Tauch. (2012) ‘Economic insecurity and social
stratification’, Annual Review of Sociology , 38, 341-359.
Wolff, E. (2010) ‘Recent trends in household wealth in the United States: Rising debt
and the middle-class squeeze—an update to 2007’, Levy Institute Working Paper 589, Bard
College, Annandale-on-Hudson, New York.
Wright, E. Olin and R. E. Dwyer. (2003) ‘The patterns of job expansions in the USA: A
comparison of the 1960s and 1990s’, Socio-Economic Review 1, 289-325.
Zinman, J. (2009) ‘Where is the missing credit card debt? Clues and implications’,
Review of Income and Wealth, 55, 249–265.
Zorn, D., F. Dobbin, J. Dierkes, and M. Kwok. (2004) ‘Managing Investors: How Financial
Markets Reshaped the American Firm’, in Karin Knorr Cetina and Alexander Preda (eds.) The
Sociology of Financial Markets, London, Oxford University Press, pp. 269-289.
Yao, R., S. D. Hanna, and S. Lindamood. (2004) ‘Changes in Financial Risk Tolerance, 1983-
2001’, Financial Services Review, 13, 249-68.
Yao, R., M. S. Gutter, and S. D. Hanna. (2005) ‘The Financial Risk Tolerance of Blacks,
Hispanics and Whites’, Journal of Financial Counseling & Planning, 16, 51–62.

1
Figure 1: Households' Perceived Change in Real Income over Preceding Five Years, by SES Qauntiles1
Note: To save space the figure does not show the middle category (those who report no change/constant real income) . Source : Survey of Consumer Finances 1 The changes between 1989 and 2007 in the percentage with negative income trajectory are statistically significant using a z-test at the .05 level for the 0-20, 20-40, 40-60, 60-80, and 80-90 quantiles, and insignificant for the-90-98 and 98-100 quantiles. The differences between 1989 and 2007 in the percentage with positive income growth are statistically significant using a z-test at the .05 level for the 0-20, 20-40, 40-60, 60-80, and 80-90 quantiles, and insignificant for the 90-98 and 98-100 quantiles.
0%
10%
20%
30%
40%
50%
60%
70%
1989 1992 1995 1998 2001 2004 2007
% Negative 5-year income trajectory
0%
10%
20%
30%
40%
50%
60%
70%
80%
90%
1989 1992 1995 1998 2001 2004 2007
% Positive 5-year income trajectory
98-100pct
90-98pct
80-90pct
60-80pct
40-60pct
20-40pct
0-20pct

1
Figure 2: Mean number of different accounts with financial institution, excluding credit cards, by SES quantiles1
Source: Survey of Consumer Finances 1 The difference between the means between 1992 and 2007 with a t-test are statistically significant at the .01 level for all quantiles except for the 98-100 pct.
0
1
2
3
4
5
6
1992 1995 1998 2001 2004 2007
98-100pct
90-98pct
80-90pct
60-80pct
40-60pct
20-40pct
0-20pct

2
Figure 3: Mean number credit cards, by SES quantile1
Source : Survey of Consumer Finances 1 The difference between the mean level in 1989 and 2007 is statistically significant using a t-test at the .01 level for all quantiles.
0
0.5
1
1.5
2
2.5
3
3.5
1989 1992 1995 1998 2001 2004 2007
98-100pct
90-98pct
80-90pct
60-80pct
40-60pct
20-40pct
0-20pct

3
Figure 4: Percentage of households who get information from a financial professional when making decisions about investing or borrowing, by SES quantile1
Source : Survey of Consumer Finances 1 The changes between 1998 and 2007 are statistically insignificant using a z-test for all quantiles.
30%
40%
50%
60%
70%
80%
90%
100%
1998 2001 2004 2007
98-100pct
90-98pct
80-90pct
60-80pct
40-60pct
20-40pct
0-20pct

4
Figure 5: Percentage of households who directly hold stocks or mutual funds, by SES quantile1
Source : Survey of Consumer Finances 1 The differences between 1989 and 2007 are statistically significant using a t-test at the .01 level for the 0-20,20-40,40-60,80-90, 98-100 quantiles, and statistically significant at the .05 level for the 60-80 quantile. The difference for the 90-98 pct. group is insignificant.
0%
10%
20%
30%
40%
50%
60%
70%
80%
90%
1989 1992 1995 1998 2001 2004 2007
98-100pct
90-98pct
80-90pct
60-80pct
40-60pct
20-40pct
0-20pct

5
Figure 6: Percentage of respondents who report taking "above-average" or "high" financial risks in order to achieve above-average returns, by SES quantiles1
Source : Survey of Consumer Finances 1 The changes between 1989 and 2007 are statistically significant using a z-test at the .05 level for the 40-60, 60-80, 80-90, 90-98, and 98-100 quantiles. The changes for the 0-20 and 20-40 quantiles are statistically insignificant.
0%
10%
20%
30%
40%
50%
60%
1989 1992 1995 1998 2001 2004 2007
98-100pct
90-98pct
80-90pct
60-80pct
40-60pct
20-40pct
0-20pct

6
Figure 7: Percentage of households who agree it is right to borrow to support one's lifestyle when income declines, by 5-year income trajectory and by debt-to-income quartile1
Source : Survey of Consumer Finances 1 In the top panel, the differences between 1989 and 2007 are statistically significant using a z-test at the .05 level for those in the constant or positive income growth groups, while the difference for those whose incomes declined is statistically insignificant. In the bottom panel, the differences between 1989 and 2007 are statistically significant using a z-test at the .05 level for all debt-to-income quartiles except for the least indebted quartile.
35%
40%
45%
50%
55%
60%
1989 1992 1995 1998 2001 2004 2007
Households with positive real income growth over preceding 5 years
Households with constant real income over preceding 5 years
Households with negative real income over preceding 5 years
35%
40%
45%
50%
55%
60%
1989 1992 1995 1998 2001 2004 2007
Households in 75-100pctile debt-to-income
Households in 50-75pctile debt-to-income
Households in 25-50pctile debt-to-income
Households in 0-25pctile debt-to-income

7
Figure 8: Average annual number of stock trades among households with a brokerage account, by SES quantile1
Note: The bottom income quintile is omitted because there are not enough households with a brokerage account to generate accurate estimates. Source : Survey of Consumer Finances 1 The differences between 1989 and 2007 are statistically significant using a t-test at the.01 level for the 60-80, 80-90, 90-98 and 98-100 pct. groups. The differences for the 20-40 and 40-60 pct. are statistically insignificant.
0
2
4
6
8
10
12
14
16
18
20
1992 1995 1998 2001 2004 2007
98-100pct
90-98pct
80-90pct
60-80pct
40-60pct
20-40pct

8
Figure 9: Percentage of homeowners borrowing against home equity, by SES quantile1
Note: This figure shows the percentage of homeowners in a given income percentile group who have debts from a home equity loan, home equity line of credit, or cash-out refinance loan on the primary residence. Source : Survey of Consumer Finances 1 The differences between 1992 and 2007 are statistically significant using a z-test at the .01 level for all quantiles except the 98-100 pct.
0%
5%
10%
15%
20%
25%
30%
35%
40%
45%
50%
1992 1995 1998 2001 2004 2007
98-100pct
90-98pct
80-90pct
60-80pct
40-60pct
20-40pct
0-20pct

9
Figure 10: Percentage of all homeowners borrowing against home equity, by the reported use of borrowed funds 1
Note: This figure shows the percentage of all homeowners who have home equity debt for a given purpose. Source : Survey of Consumer Finances 1 The differences between 1992 and 2007 in the percentages of homeowners using borrowing for each category is statistically significant using a z-test at the .05 level for the home improvement and living expenses categories and statistically insignificant for the other categories.
0%
2%
4%
6%
8%
10%
12%
14%
16%
18%
20%
1992 1995 1998 2001 2004 2007
Investment, Home Improvement
Living Expenses, Bills
Basic Durables, Autos
Medical, Education Expenses
Highly Discretionary, Recreational
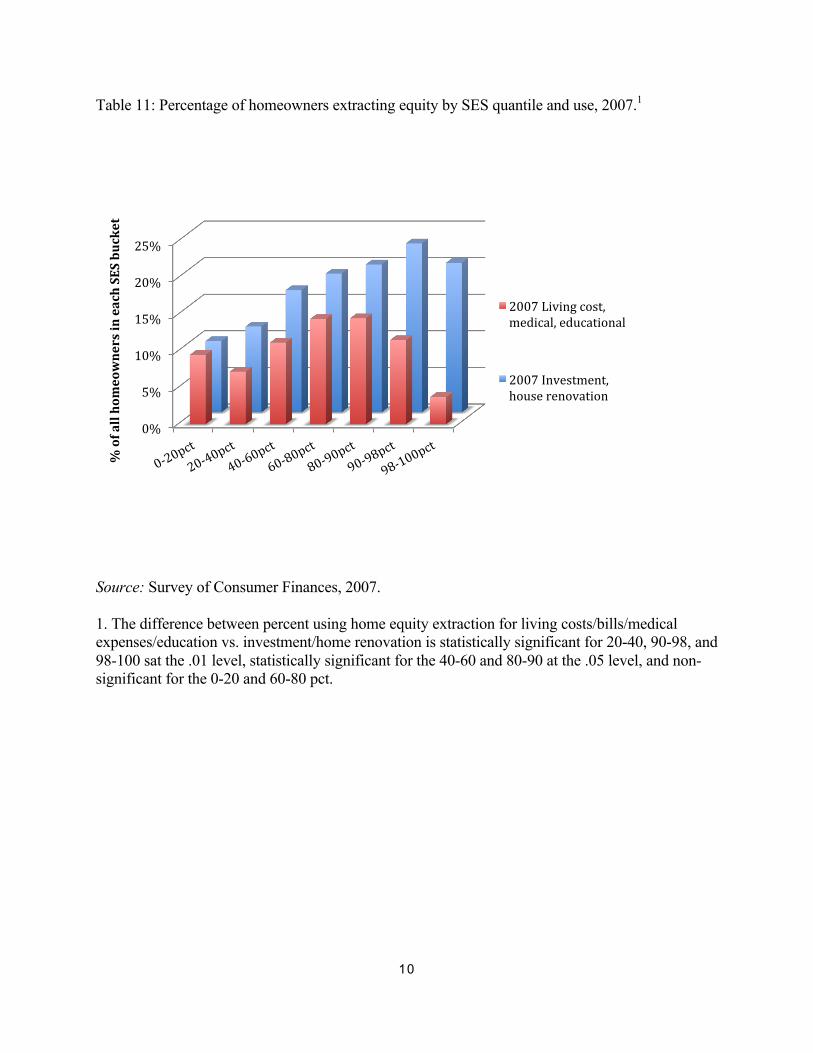
10
Table 11: Percentage of homeowners extracting equity by SES quantile and use, 2007.1
Source: Survey of Consumer Finances, 2007.
1. The difference between percent using home equity extraction for living costs/bills/medical expenses/education vs. investment/home renovation is statistically significant for 20-40, 90-98, and 98-100 sat the .01 level, statistically significant for the 40-60 and 80-90 at the .05 level, and non-significant for the 0-20 and 60-80 pct.
0%#
5%#
10%#
15%#
20%#
25%#
%"of"all"homeowners"in"each"SES"bucket"
2007#Living#cost,#medical,#educational#
2007#Investment,#house#renovation#

11
Endnotes
1 We note that some of the forms of credit available to low income households, like
check cashing services and payday loans relied on high interest rates and fees. It is
difficult to assess the degree to which these costlier forms of credit contribute to
this process because of a lack of data. We address this issue in our results section.
2 The SCF was conducted before 1989, but those earlier waves are not comparable
due to methodological changes. While labor market changes and rising income
inequality were well on their way by 1989, households were still figuring out how
to adjust to the changing circumstances generated during the earlier parts of the
1980s. Beginning in 1989 allows us to get leverage on many of the issues in which
we are interested. A few of the indicators we use were only added in later years.
3 We tried to use just the top 1% as a group, but this proved to provide unstable estimates of the
variables. At 2%, we still get those at the top, but we get enough cases to provide more stable
estimates.
4 The SCF does have information on payday loans but only for 2007. In 2007, 4%
of households in the 0-20% and 20-40% reported using payday loans, 3 % in the
40-60%, 1% in 60-80% and 0% in the three upper quintiles. This level of
participation is close to what Barr (2012) observes (3.4% for the bottom 20% of the
income distribution).
5 We also explored the possibility that income level and income trend might
interact in shaping the probability of using one’s house as an ATM, but we found
no evidence to support this.