j. chem. thermodynamics - concordia...
TRANSCRIPT

J. Chem. Thermodynamics 40 (2008) 1064–1076
Contents lists available at ScienceDirect
J. Chem. Thermodynamics
journal homepage: www.elsevier .com/ locate/ jc t
The equilibrium phase diagram of the magnesium–copper–yttrium system
Mohammad Mezbahul-Islam, Dmytro Kevorkov, Mamoun Medraj *
Department of Mechanical Engineering, Concordia University, 1455 de Maisonneuve Boulevard West, Montreal, Canada H3G 1M8
a r t i c l e i n f o
Article history:Received 8 November 2007Received in revised form 5 March 2008Accepted 5 March 2008Available online 15 March 2008
Keywords:Ternary phase diagramThermodynamic modellingModified quasichemical modelMg alloys
0021-9614/$ - see front matter � 2008 Elsevier Ltd. Adoi:10.1016/j.jct.2008.03.004
* Corresponding author. Tel.: +1 514 848 2424x314E-mail address: [email protected] (M. MURL: http://www.me.concordia.ca/~mmedraj (M. M
a b s t r a c t
Thermodynamic modelling of the Mg–Cu–Y system is carried out as a part of thermodynamic databaseconstruction for Mg alloys. This system is being modelled for the first time using the modified quasi-chemical model which considers the presence of short range ordering in the liquid. A self-consistent ther-modynamic database for the Mg–Cu–Y system was constructed by combining the thermodynamicdescriptions of the constituent binaries, Mg–Cu, Cu–Y, and Mg–Y. All the three binaries have been re-optimized based on the experimental phase equilibrium and thermodynamic data available in the liter-ature. The constructed database is used to calculate and predict thermodynamic properties, the binaryphase diagrams and liquidus projections of the ternary Mg–Cu–Y system. The current calculation resultsare in good agreement with the experimental data reported in the literature.
� 2008 Elsevier Ltd. All rights reserved.
1. Introduction
Magnesium alloys are getting considerable attention for auto-mobile and aerospace applications because they are the lightestamong the commercially available structural alloys. They havehigh specific properties but low corrosion resistance which limitedtheir use. While metallic glass, a new class of wonder material, isattracting attention due to its high mechanical strength and goodcorrosion resistance [1]. Mg–Cu–Y alloy system is a promising can-didate for metallic glass since it has the largest super cooled liquidregion among other Mg-alloy systems [2–5].
Despite its importance, this system has not yet been modelledthermodynamically. Also, the available descriptions for the bina-ries are contradictory to each other and none of the assessmentwas done considering the presence of short range ordering in theliquid. Hence the main objective of this work is to construct a reli-able thermodynamic database of the Mg–Cu–Y system using soundthermodynamic models. The three constituent binary systemsMg–Cu, Cu–Y, and Mg–Y were re-optimized using the modifiedquasichemical model for the liquid phase. This model has the abil-ity to take into consideration the presence of short range orderingin the liquid.
ll rights reserved.
6; fax: +1 514 848 3175.edraj).edraj).
2. Analytical descriptions of the thermodynamic modelsemployed
The Gibbs free energy function used for the pure elements (Mg,Cu, and Y) are taken from the SGTE (Scientific Group ThermodataEurope) compilation of Dinsdale [6].
The Gibbs free energy of a binary stoichiometric phase is givenby
G/ ¼ xi0G/1
i þ xj0G/2
j þ DGf ; ð1Þ
where / denotes the phase of interest, xi and xj are mole fractions ofelements i and j which are given by the stoichiometry of the com-pound, and are the respective reference states of elements i and jin their standard state and DGf = a + b(T/K) represents the Gibbs freeenergy of formation of the stoichiometric compound. The parame-ters a and b were obtained by optimization using experimentaldata.
The Gibbs free energy of the terminal solid solutions is de-scribed by the following equation:
G/ ¼ xi0G/
i þ xi0G/
j þ RðT=KÞ½xi ln xi þ xj ln xj�þexG/: ð2Þ
The excess Gibbs free energy exG/ is described by the Redlich–Kisterpolynomial model [7].
The modified quasichemical model [8–10] was chosen to de-scribe the liquid phases of the three constituent binaries. Fromthe literature survey, it was found that all the three binary systemshave a very high negative enthalpy of mixing. Also, the calculatedentropy of mixing curves of the Cu–Y and Mg–Y systems assumem-shaped characteristics. All these are indications of the presenceof short range ordering [8]. The modified quasichemical model has

M. Mezbahul-Islam et al. / J. Chem. Thermodynamics 40 (2008) 1064–1076 1065
three distinct characteristics [8–10]: (i) it permits the compositionof maximum short range ordering in a binary system to be freelychosen, (ii) it expresses the energy of pair formation as a functionof composition which can be expanded as a polynomial in the pairfraction and the coordination numbers are permitted to vary withthe composition, and (iii) the model can be extended to multi-com-ponent systems. The model has been discussed extensively in theliterature [8–10] and will be outlined briefly here. The energy ofpair formation can be expressed by the following equation:
DgAB ¼ Dg�AB þXiP1
gi�ABXi
AA þXjP1
g�jABXjBB; ð3Þ
where Dg�AB, Dgi�AB, and Dg�jAB are the parameters of the model and can
be expressed as functions of temperature ðDg�AB ¼ aþ bðT=KÞÞ. Also,the atom to atom coordination numbers, ZA and ZB, can be ex-pressed as a function of composition and can be represented bythe following equations:
1ZA¼ 1
ZAAA
2nAA
2nAA þ nAB
� �þ 1
ZAAB
nAB
2nAA þ nAB
� �; ð4Þ
1ZB¼ 1
ZBBB
2nBB
2nBB þ nAB
� �þ 1
ZBBA
nAB
2nBB þ nAB
� �; ð5Þ
where nij is the number of moles of (i–j) pairs, ZAAA and ZA
AB arethe coordination numbers when all nearest neighbours of an A atomare A or B atoms, respectively. The composition at maximum shortrange ordering is determined by the ratio ZB
BA=ZAAB. Values of ZA
AB andZB
BA are unique to the A – B binary system and should be carefullydetermined to fit the thermodynamic experimental data (enthalpyof mixing, activity, etc.). The value of ZA
AA is common for all systemscontaining A as a component. In this work, the value of ZMg
MgMg, ZCuCuCu
and ZYYY was chosen to be 6 because it gave the best possible fit
for many binary systems and is recommended by Dr. Pelton’s group[8–10]. The values of ZMg
MgCu, ZYCuMg, ZMg
MgY, ZYYMg, ZY
CuY, and ZYYCu are
chosen to permit the composition at maximum short range order-ing in the binary system to be consistent with the composition thatcorresponds to the minimum enthalpy of mixing. These values aregiven in table 1. The tendency to maximum short range orderingnear the composition 40 atomic per cent (at.%) Mg in the Mg–Cusystem was obtained by setting ZMg
MgCu ¼ 4 and ZYCuMg ¼ 2. For the
Cu–Y system, maximum short range ordering near 30 at.% Y was
TABLE 1Atom–atom ‘‘coordination numbers” of the liquid
A B ZAAB ZB
AB
Mg Mg 6 6Cu Cu 6 6Y Y 6 6Mg Cu 4 2Cu Y 3 6Mg Y 2 4
TABLE 2Crystal structure and lattice parameters of MgCu2 phase
Phase Crystal data Atom WP
Prototype MgCu2 Cu 16MgCu2 Pearson symbol cF24 Mg 8
Space group Fd�3mSpace group No. 227Lattice parameter/nm a = 0.7035Angles: a = 90�, b = 90�, c = 90�
a WP, Wyckoff Position.b CN, coordination number.
obtained by setting ZYCuY ¼ 3 and ZY
YCu ¼ 6. Similarly for the Mg–Ysystem, the tendency to maximum short range ordering near thecomposition 30 at.% Y was obtained by setting ZMg
MgY ¼ 2 andZY
YMg ¼ 4.The Gibbs free energy of intermediate solid solutions is de-
scribed by the compound energy formalism as shown in the fol-lowing equations:
G ¼ Gref þ Gideal þ Gexcess; ð6ÞGref ¼
Xyl
iymj . . . yq
k0Gði:j:...:kÞ; ð7Þ
Gideal ¼ RðT=KÞX
l
fl
Xi
yli ln yl
i; ð8Þ
Gexcess ¼X
yliy
ljy
mk
Xc¼0
cLði;jÞ:k � ðyli � yl
jÞc; ð9Þ
where i,j, . . . k represent components or vacancy, l, m and q repre-sent sub-lattices, yl
i is the site fraction of component i on sub-latticel, fl is the fraction of sub-lattice l relative to the total lattice sites,0G(i:j:. . .k) represents a real or a hypothetical compound (end mem-ber) energy, and cL(i,j) represent the interaction parameters whichdescribe the interaction within the sub-lattice.
Modelling of the intermetallic solid solution phases requiresinformation regarding the crystal structure of the phases and theirhomogeneity range. From the crystallographic data summarized intable 2, the following model is applied to represent the MgCu2
phase:
ðMg%;CuÞ8 : ðCu%;MgÞ16:
Here, the ‘%’ denotes the major constituent of the sub-lattice. Thismodel covers the 0 6 XMg 6 1 composition range and, of course, in-cludes the homogeneity range of 0.31 6 XMg 6 0.353 which was re-ported by Bagnoud and Feschotte [11].
The crystal structure data of the Cu6Y intermediate solid solu-tion was obtained by Buschow and Goot [12] and are listed intable 3.
According to Buschow and Goot [12] some of the Yttrium atom-ic sites are occupied by a pair of Cu atoms, which can be describedby the following model with two sub-lattices:
ðY%;Cu2ÞðCuÞ5This is actually a Wagner–Schottky type model [13]. The same mod-el was used by Fries et al. [14] to represent Cu6Y in their assessmentof the Cu–Y system. This type of model can be used only for inter-mediate phases with a narrow homogeneity range [15]. This modelcovers 0.83 6 XCu 6 1 composition range. This range includeshomogeneity 0.84 6 XCu 6 0.87 which was reported by Fries et al.[14]. The optimized model parameters are listed in table 4.
3. Experimental data evaluation
According to the CALPHAD method, the first step of the thermo-dynamic optimization is to extract and categorize the available
a CNb Atomic position Reference
X Y Z
d 12 0.625 0.625 0.625 [68]a 16 0 0 0
[11]

TABLE 3Crystal structure and lattice parameters of Cu6Y phase
Phase Crystal data Atoms WPa CNb Atomic position References
X Y Z
Cu6Y Prototype TbCu7 Y 1a 20 0 0 0 [12]Pearson symbol hP8 Cu 1 2e 8 0 0 0.306Space group P6/mmm Cu 2 2c 12 0.333 0.667 0Space group No. 191 Cu 3 3g 16 0.5 0 0.5Lattice parameter/nm a = 0.4940
b = 0.4157Angles: a = 90�, b = 90�, c = 120�
a WP, Wyckoff position.b CN, coordination number.
TABLE 4Optimized model parameters for the liquid, Mg-hcp, Cu-fcc, Mg2Cu and MgCu2phasesin the Mg–Cu system
Phase Terms a/(J �mol�1) b/(J �mol�1 � K�1)
Liquid Dg�AB �12975.95 0gi�
AB �6153.13 1.26
g�jAB �13528.50 0
Mg-hcp 0LMg-hcp 8371.60 0
Cu-fcc 0LCu-fcc �21923.39 5.37Mg2Cu DGf �28620.00 0.03
MgCu2 (Mg%, Cu)8 (Cu%, Mg)160GMgCu2
Cu:Cu 16743.20 00GMgCu2
Mg:Cu �37684.26 00GMgCu2
Cu:Mg 0 00GMgCu2
Mg:Mg 6278.7 00LMgCu2
Mg;Cu:Cu 13011.35 00LMgCu2
Mg;Cu:Mg 13011.35 00LMgCu2
Cu:Mg;Cu 6599.45 00LMgCu2
Mg:Mg;Cu 6599.45 0
1066 M. Mezbahul-Islam et al. / J. Chem. Thermodynamics 40 (2008) 1064–1076
experimental information from the literature. Various pieces ofinformation related to the Gibbs free energy can be taken as inputdata for the optimization that includes crystallographic informa-tion. All relevant data should be critically evaluated to choosethe most reliable sets to be used for the optimization [15].
3.1. The Mg–Cu binary system
3.1.1. Phase diagramThe Mg–Cu system was evaluated by Boudouard [16], Sahmen
[17], and Urazov [18]. They reported the existence of two congru-ently melting compounds, and three eutectic points in the system.The analysis of Boudouard [16] showed one more line compoundand one eutectic point which was, however, not accepted by otherresearchers [17–19]. The most extensive work on the Mg–Cu sys-tem was done by Jones [19] using both thermal and microscopicanalyses. His reported data were not fully consistent with the pre-vious authors. Since he used a huge number of samples and tookextreme precautions during the sample preparations, his resultsare more reliable and will be used in this work.
No homogeneity range is mentioned for the intermediate phaseof Mg2Cu, whereas MgCu2 was reported with a narrow homogene-ity range that extends on both sides of the stoichiometric compo-sition. Grime and Morris-Jones [20] showed a homogeneity rangeof (2 to 3) at.% on both sides of the stoichiometry. Also, X-ray dif-fraction from Sederman [21] disclosed that the extent of solubilityon both sides of MgCu2 at T = 773 K does not exceed 2.55 at.% (from64.55 to 67.20) at.% Cu and considerably less at lower tempera-tures. However X-ray diffraction, microscopic, simple, and differ-
ential thermal analysis by Bagnoud and Feschotte [11] confirmedthat the maximum solid solubility at the eutectic temperatureson both sides of MgCu2 are (64.7 and 69) at.% Cu.
Hansen [22] reported that the solubility of Cu in Mg increasesfrom about 0.1 at.% Cu at room temperature to about (0.4 to0.5) at.% Cu at T = 758 K. However, Jenkin [23] was doubtful aboutthe accuracy of the above solubility limit and reported that the lim-it should be very much less. The metallography of the high-purityalloys prepared by Jenkin [23] clearly indicated that the solubilityof Cu in Mg is less than 0.02 at.% Cu at T = 723 K. Elaborate metal-lographic analysis of Jones [19] also showed that the solubility ofCu in Mg is only 0.007 at.% Cu at room temperature, increasing toabout 0.012 at.% Cu near the eutectic temperature. These valuesare contradictory to those given by Hansen [22]. Later, Stepanovand Kornilov [24] revealed that the solubility is 0.2 at.% Cu atT = 573 K, 0.3 at.% Cu at T = 673 K, and 0.55 at.% Cu at T = 753 K.This is in considerable agreement with the metallographic workof Hansen [22]. However considering the accuracy of the analysisby Jones and Jenkin [19,23], it appears that the solubility limits gi-ven in [22,24] are quite high. Hence in this work, the results ofJones [19] are used.
The solubility of Mg in Cu was determined by Grime and Mor-ris-Jones [20]. According to their X-ray powder diffraction results,the maximum solubility is approximately 7.5 at.% Mg. Accordingto Jones [19], the solubility is about 5.3 at.% Mg at T = 773 K,increasing to about 6.3 at.% Mg at T = 1003 K. Stepanov [25], how-ever, determined the maximum solid solubility of 10.4 at.% Mgusing an electrical resistance method. Bagnoud and Feschotte[11] placed the maximum solubility at 6.94 at.% Mg. Except forthe results by Stepanov [25], most of the data [19,20,11] are inclose agreement with each other. In this work, the results of Jones[19] have been used during optimization for their consistency inrepresenting the entire phase diagram.
Thermodynamic modelling on Mg–Cu system was done byNayeb-Hashemi and Clark [26], Coughanowr et al. [27], and Zuoand Chang [28]. The homogeneity range of MgCu2 phase wasreproduced by both [27,28] using the Wagner–Schottky [13] typemodel while, sub-lattice model was used in this work.
3.1.2. Thermodynamic dataGarg et al. [29], Schmahl and Sieben [30], Juneja et al. [31], and
Hino et al. [32] measured the vapour pressure of Mg over Mg–Culiquid alloys using different techniques. The activity measured bythese four different groups is more or less in good agreement witheach other. Enthalpy of mixing for the Mg–Cu liquid was measuredby Sommer et al. [33] and Batalin et al. [34] using the calorimetricmethod. King and Kleppa [35] determined the enthalpies of forma-tion for MgCu2 and Mg2Cu by the calorimetric method. Similar val-ues have been determined by Eremenko et al. [36] using EMFmeasurements. The vapour pressure measurements of Smithet al. [37] showed discrepancy with the other results. Due to

M. Mezbahul-Islam et al. / J. Chem. Thermodynamics 40 (2008) 1064–1076 1067
different measurement techniques, the reported values are mutu-ally contradictory. Since vapour pressure measurements usuallydo not provide highly reliable results, the values in [35,36] are con-sidered more acceptable and hence were given higher weighingfactors during optimization.
3.2. The Cu–Y binary system
3.2.1. Phase diagramDomagala et al. [38] studied the Cu–Y system by metallographic
method, X-ray analysis, and critical temperature work to constructthe phase diagram. They reported the composition and tempera-ture of four eutectic points, one peritectic point, and four interme-diate compounds CuY, Cu2Y, Cu4Y, and Cu6Y. They also reported themaximum solid solubility of Cu in Y as well as Y in Cu to be lessthan 1 wt%. It is worth noting that Domagala et al. [38] missedthe presence of the Cu7Y2 compound. Massalski et al. [39] pub-lished a phase diagram of the Cu–Y system based on the experi-mental data of Domagala et al. [38]. Buschow and Goot [12]investigated the system by metallography and X-ray diffractionand obtained evidence for the existence of two hexagonal Cu-richphases. They defined the composition as Cu5Y, having a hexagonalCaCu5 type structure and Cu7Y, having a hexagonal TbCu7 typestructure. Chakrabarti and Laughlin [40] proposed a phase diagramfor this system using the experimental data of Domagala et al. [38].The information they provided on this system was incompleteespecially with regard to the entire liquidus region. Various transi-tion temperatures were also not accurately determined. Guojunet al. [41] measured the heat contents and determined the meltingpoint of the intermetallic compounds using drop calorimeter in atemperature range of (850 to1300) K. Domagala et al. [38] deter-mined the melting point by visual analysis of the samples and re-ported error of measurement by ±15 K. This method is not preciseand therefore the data reported by Guojun and Itagaki [41] are pre-ferred. They determined the critical temperature of the intermetal-lic compounds by drop calorimetry by analyzing the deflectionpoints in the JT–T curve, where JT is the heat content and T is theabsolute temperature. Itagaki et al. [42] optimized the Cu–Y systemusing the experimental data of Guojun and Itagaki [41]. UnlikeChakrabarti and Laughlin [40], they considered Cu4Y as a stoichi-ometric compound. However, all the experimental and calculateddata reported by different authors are contradictory to one an-other. To resolve the controversy, Fries et al. [14] reinvestigatedthe Cu–Y system by DTA and XRD analysis, with emphasis on therange between (55 and 90) at.% Cu, and they proposed a new phasediagram. Their DTA results provide evidence for the possible exis-tence of a high temperature phase transformation in the Cu2Y com-pound {Cu2Y(h) M Cu2Y(r)}. The invariant points obtained in [14]show fair agreement with the experimental data from Guojunet al. [41] but differ markedly from those of [38,39] along the (a-Y) liquidus line. Later, Abend et al. [43] made another attempt toinvestigate the Cu–Y system between (30 and 90) at.% Cu usingEMF, DTA, and XRD. Their reported values are in fair agreementwith those in [14,41] and differ from those in [38,39]. These resultswill be compared with the current assessment of the equilibria inthe Cu–Y system.
The XRD results of Fries et al. [14] confirmed a range of solubil-ity for the Cu6Y phase. The limits of Y-rich and Cu-rich sides weredetermined to be (84.5 ± 0.5) at.% Cu and (87.0 ± 0.5) at.% Cu,respectively, over the temperature range of (973 to 1123) K. Thisis in reasonable agreement with the reported values (85.7 to87.5) at.% Cu by Massalski et al. [39] and (84 to 88) at.% Cu byOkamoto [44]. Also, the emf measurement by Abend and Schaller[43] showed a similar range of homogeneity. The Cu4Y phase isconsidered as a stoichiometric compound in this work since nodefinite homogeneity range was reported.
The experimental results available for the Cu–Y system are notin good accord with each other. However after reviewing all theavailable data for this system, it appears that the results of Guojunet al. [41] and Fries et al. [14] are the most reliable and thereforewere given higher weighing factors during optimization.
3.2.2. Thermodynamic propertiesThe amount of thermodynamic data for the Cu–Y system is lim-
ited. The yttrium is highly reactive and hence it is very difficult tohandle the alloys during high temperature experiments. However,heats of mixing of liquid Cu–Y alloys have been determined calori-metrically by Watanabe et al. [45] at T = 1373 K, Sudavtsova et al.[46] at T = 1415 K and also by Sidorov et al. [47] at T = 1963 K. Ber-ezutskii and Lukashenko [48] measured the vapour pressure andactivity coefficients of liquid Cu over the composition range of(19.8 to100) at.% Cu at T = 1623 K. Abend and Schaller [43] mea-sured the activity of Y in the solid state using the emf measure-ment technique. Different thermodynamic properties of the Cu–Yliquid were calculated by Ganesan et al. [49]. Guojun et al. [41]and Watanabe et al. [45] determined the enthalpy of formationof CuY, Cu2Y, and Cu4Y. These values along with the reported val-ues of Cu6Y and Cu7Y2 by Itagaki et al. [42] will be compared withthe current modelling results.
3.3. Mg–Y binary system
3.3.1. Phase diagramGibson et al. [50] were the first researchers who reported the
Mg–Y phase diagram. They determined the maximum primary so-lid solubility of Y in Mg as 9 wt% Y at the eutectic temperature(840 K). This agrees well with the results of Sviderskaya andPadezhnova [51] who used thermal analysis to study the Mg-richregion of the Mg–Y system. Another investigation by Mizer andClark [52] on this system using thermal analysis and metallogra-phy showed that the maximum solubility of Y in solid Mg wasapproximately 12.6 wt% Y at the eutectic temperature. This is, also,in good accord with the results of [50,51].
As reported by Gibson et al. [50], there is one eutectic reactionoccurring at 74 wt% Mg and T = 840 K and one eutectoid reactionat 11 wt% Mg and T = 1048 K. The latter reaction was associatedwith a high temperature allotropic transformation of yttrium.Three intermediate phases were identified as c at 21.5 wt% Mg, dat 41 wt% Mg and e at 60 wt% Mg. But any definite compositionfor these phases was not mentioned. However, e and c were re-ported to have compositions of Mg24Y5 and MgY, respectively, bySviderskaya and Padezhnova [51].
The thermodynamic optimization of Ran et al. [53] showed avery good agreement with the measured values of Gibson et al.[50]. Massalski [54] assessed the Mg–Y phase diagram using theavailable experimental data from the literature. He used the exper-imental data of [51] for the Mg-rich region. Smith et al. [55] inves-tigated the crystallography of MgY (c), Mg2Y (d) and Mg24Y5 (e)intermediate phases. The tangible homogeneity ranges of e and cdetermined by them will be compared with the current analysis.The d-phase was predicted as a stoichiometric compound in[50,54,55]. Their results do not agree with Flandorfer et al. [56],who employed XRD, optical microscopy, and microprobe analysesto study the Ce–Mg–Y isothermal section at T = 773 K. Based on theexperimental work of [56], the homogeneity range of d-phase wasobtained and will be compared with the current results. The X-raydiffraction analysis of Smith et al. [55] showed that c-phase hasCsCl type structure, d-phase has MgZn2structure, and e-phase hasa-Mn structure. Another investigation on the crystal structure ofe-phase by Zhang and Kelly [57] using transmission electronmicroscopy (TEM) showed the same structure as found by Smithet al. [55] but with one difference in the occupying atoms at the

1068 M. Mezbahul-Islam et al. / J. Chem. Thermodynamics 40 (2008) 1064–1076
2a Wyckoff position. However, since the work of Zhang and Kelly[57] used TEM, it is used during modelling of the e-phase, becauseit is considered more precise than that of Smith et al. [55] whereXRD was used. Thermodynamic investigations on the Mg–Y systemwere carried out by Fabrichnaya et al. [58] and Shakhshir and Me-draj [59]. Both of them reproduced the homogeneity range of theintermetallic phases using the required crystallographic informa-tion but with two different approaches. However, for this workthe same models reported by Shakhshir and Medraj [59] was usedsince their modelling approach was the same as the other interme-tallic phases modelled in this work.
3.3.2. Thermodynamic dataAgrawal et al. [60] measured calorimetrically the enthalpy of
mixing of the liquid Mg–Y alloy near the Mg-rich region (up to21.8 at.% Y) at different temperatures. Activities of Mg was mea-sured by Gansen et al. [49] using the vapour pressure techniquewhich is in agreement with the results of Isper and Gansen [61]who used the same method for the measurement. The enthalpyof formation of all three compounds was determined calorimetri-cally by Pyagai et al. [62]. Their results are in reasonable agreementwith the calorimetric data of Smith et al. [55] except for the c-phase, for which the value of Pyagai et al. [62] is twice morenegative than that obtained by Smith et al. [55]. This is due tothe difficulties in measuring the enthalpy of formation when theyttrium content increases and hence the reactions become moreexothermic. Also, Y has a high melting point compared to Mgand this leads to the sublimation of Mg during fusion of the metals[60]. The experimental results for enthalpy of formation of thecompounds in the Mg–Y system will be compared with the currentmodelling results.
3.4. Mg–Cu–Y ternary system
Inoue et al. [3], Ma et al. [4], and Busch et al. [63] carried outsome experimental investigations on the Mg–Cu–Y system to findthe glass-forming ability at different compositions. However, theirreported results cannot be used in this work since equilibrium con-ditions cannot be achieved during the preparation of amorphousmaterial. Ganesan et al. [49] measured the enthalpy of mixing of
Cu (fcc) + MgCu2 MgCu2 +
Cu (fcc)
T/K
0.00 0.20 0.40300
500
700
900
1100
1300
1500
Mole F
FIGURE 1. Plot of temperature against mole fraction Mg to illustrate the calcu
the liquid by a calorimetric method along five different isopleths.Also, the activity of magnesium in the ternary liquid was reportedby them. These results will be compared with the calculated valuesfrom the current work.
Two ternary compounds of composition Y2Cu2Mg and YCu9Mg2
were identified by Mishra et al. [64] and Solokha et al. [65]. How-ever no thermodynamic properties for these compounds could befound in the literature. For this reason, it was not possible to in-clude them in the present work by the conventional method. Butfor better understanding of the ternary system, these two com-pounds were included in the optimization by an alternative meth-od which will be discussed later. A thermodynamic calculation ofthe Mg–Cu–Y system was carried out by Palumbo et al. [66]. Theyproposed a new modelling approach for the description of the spe-cific heat of the liquid to include the glass transition phenomenon.The ternary compounds were not included in their assessment.
A complete thermodynamic optimization for the Mg–Cu–Y ter-nary system is still unknown. Also, the liquid phases of the threeconstituent binary systems Mg–Cu, Cu–Y, and Mg–Y need to beremodelled in order to consider the presence of short rangeordering.
4. Results and discussion
4.1. The Mg–Cu binary system
4.1.1. Phase diagramThe calculated Mg–Cu phase diagram is shown in figure 1 which
shows reasonable agreement with the experimental data from theliterature. All the optimized parameters are listed in table 4. Theexcess entropy term (b) for the Mg2Cu phase is 0.03 J �mol�1 � K�1
which is very close to zero. Although it is desired to reduce thenumber of parameters, it is very difficult to get exact zero valuefor this term because for modelling the stoichiometric phase usingthe FactSage software [69], one needs to provide some entropy va-lue for the compound and the change of entropy is calculated usingthe corresponding reaction. The congruent melting temperature ofMgCu2 was calculated as 1061 K. The experimental values of tem-perature reported in [17,18,11] are 1070 K, 1072 K, and (1066 ± 4)K, respectively. On the other hand, Jones [19] determined this
CuMg2
Mg (hcp) + CuMg2
Liquid
Mg (hcp)
0.60 0.80 1.00raction, Mg
lated Mg–Cu phase diagram: N: [11], h: [17], �: [18], s: [19], .: [67].

M. Mezbahul-Islam et al. / J. Chem. Thermodynamics 40 (2008) 1064–1076 1069
melting temperature as 1092 K which is not consistent with theother experimental values. This may be because it is an old mea-surement (1931). Hence, it was decided to be consistent with the
-12
Ent
halp
y of
mix
ing/
(kJ
.mol
- )
0.0 0.20 0.40 0.60 0.8 1.0
-2
0
-4
-6
-10
-8
Mole fraction Mg
-45
-30
-15
Ent
hapl
y of
for
mat
ion
/ (kJ
.mol
- )
0.0 0.20 0.40 Mole fractio
0
Cu2Mg
FIGURE 2. Plot of calculated thermodynamic properties against mole fraction Mg withT = 1100 K: O: [29] at 1100 K,�: [31] at 1100 K, s: [33] at 1120 K and 1125 K, h: [34] at 1at 1123 K, h: [31] at 1100 K, s: [32] at 1100 K. (c) Enthalpy of formation in kJ �mol�1 f
Cu6Y Cu 4
Y
Cu7Y2
Cu2Y(r)
Cu2Y(h)
T/K
0.00 0.20 0.401000
1200
1400
1600
1800
Mole fr
FIGURE 3. Plot of temperature against mole fraction Y to illustrate the calc
most recent value reported by Bagnoud and Feschotte [11]. Also,the homogeneity range of MgCu2 is consistent with the experimen-tal data of Bagnoud and Feschotte [11]. The remaining parts of the
Act
ivit
y M
g
0.0
1.0
0.8
0.6
0.4
0.2
0.0 0.20 0.40 0.60 0.80 1.00Mole fraction Mg
0.60 0.80 1.0 n Mg
CuMg2
the literature values: (a) enthalpy of mixing in kJ �mol�1 for the Mg–Cu liquid at100 K. (b) Activity of Mg in the Mg–Cu liquid at T = 1123 K:�: [29] at 1100 K, M: [30]or the stoichiometric compounds: � : [this work], e: [35], s: [36], h: [37].
CuY
bcc-Y
0.60 0.80 1.00
action, Y
ulated Cu–Y phase diagram: s: [14], � [38], e: [39], h: [41], $: [43].

1070 M. Mezbahul-Islam et al. / J. Chem. Thermodynamics 40 (2008) 1064–1076
phase diagram are in fair agreement with the experimental data fromthe literature.
4.1.2. Thermodynamic propertiesThe calculated enthalpy of mixing, shown in figure 2a, is in good
agreement with the experimental data. The calculated activity ofMg in Mg–Cu liquid at T = 1100 K is shown in figure 2b whichagrees well with the experimental results from the literature[29–32]. The experimental data for the activity of Cu could notbe found in the literature. Figure 2c shows good agreement be-
TABLE 5Optimized model parameters for the liquid, CuY, Cu2Y(h), Cu2Y(r), Cu4Y, Cu7Y2, andCu6Y phases
Phase Terms a/(J �mol�1) B/(J �mol�1 � K�1)
Liquid Dg�AB �28718.77 6.28gi�
AB �6278.70 0.84g�jAB �6906.57 2.09
Cu6Y (Y%, Cu2) (Cu)5 GCu6 YCu:Cu � 7Ghcp
Cu 0 0
GCu6 YCu:Y � 5Ghcp
Cu � GhcpY 65.8 0
0LCu6YY;Cu2 :Cu � 4794.8 0.45
CuY DGf �22517.5 �3.311Cu2Y (h) DGf �17416.2 1.63Cu2Y (r) DGf �21997.9 �2.44Cu4Y DGf �17,888 �1.65Cu7Y2 DGf �18775.5 �1.73
0
Ent
halp
y of
mix
ing
/ (kJ
.mol
-1)
0.0 0.20 0.40 0.60 0.8 1.0
-3
-9
-15
-27
-21
Mole fraction Y
0
-10
-20
Ent
halp
y of
for
mat
ion
/ (kJ
. mol
-1.a
tom
-1)
0.0 0.20 0.40 Mole fractio
Cu 4
Y
Cu 2
Y(r
)
Cu 7
Y2
FIGURE 4. Plot of calculated thermodynamic properties against mole fraction with litera[45] at 1373 K, s, $: [46] at 1410 K e: [47] at 1963 K. (b) Activity of Cu in the Cu–Y liqstoichiometric compounds: e: [this work], : [14], M: [42], s: [45].
tween the calculated heats of formation of MgCu2 and Mg2Cu, ob-tained in this study and the experimental results reported by Kingand Kleppa [35] and Eremenko et al. [36]. The measured values ofSmith and Christian [37] are less negative than those calculatedand also inconsistent with other experimental results. This is prob-ably due to the inaccuracy involved in the vapour pressure mea-surement carried out by Smith and Christian [37].
4.2. The Cu–Y binary system
4.2.1. Phase diagramThe Cu–Y calculated phase diagram with the available experi-
mental data from the literature is shown in figure 3. The solid sol-ubilities of Y in Cu and Cu in Y are negligible and hence were notincluded in this work. The optimized parameters are shown in ta-ble 5. Except few discrepancies with the results from Domagala[38], the phase diagram shows reasonable agreement with all theother experimental points. Composition of the eutectic point nearthe Cu-rich side shows small deviation from the experimental data.But the thermodynamic properties especially the enthalpy of mix-ing near the Cu-rich side shows strong agreement with the exper-imental data; hence this amount of error is acceptable. It is worthnoting that trying to be consistent with the experimental eutecticcomposition resulted in deviation from the experimental thermo-dynamic properties of the Cu–Y liquid. The solid phase transforma-tion of Cu2Y(h) ¡ Cu2Y(r) was included in the current assessment
Act
ivit
y C
u
0.0
1.0
0.8
0.6
0.4
0.2
0.0 0.20 0.40 0.60 0.8 1.00Mole fraction Y
0.60 0.80 1.0n Mg
CuY
ture values: (a) enthalpy of mixing in kJ �mol�1 for the Cu–Y liquid at T = 1410 K: h:uid at T = 1623 K; s: [48] at 1623 K. (c) Enthalpy of formation in kJ �mol�1 for the

TABLE 6Optimized model parameters for liquid, hcp-Mg, b-Y, e, d, and c phases in Mg–Ysystem
Phase Terms A/(J �mol�1) b/(J �mol�1 � K�1)
Liquid Dg�MgY �13059.70 6.45
gi�MgY �13394.56 7.20
g�jMgY �6529.85 1.26
hcp-Mg 0LMg-hcp �12476.78 7.491LMg-hcp �2724.56 2.42LMg-hcp �8788.22 2
b-Y 0LY-b �29760.18 13.491LY-b �2005.86 1.5
e (Mg%, Y)29 (Y%, Mg)10 (Mg)190Ge
Mg:Mg:Mg 1585 00Ge
Mg:Y:Mg �5891.23 00Ge
Y:Y:Mg 6000 00Ge
Y:Mg:Mg 0 0d(Mg%, Y)6 (Y%, Mg)4 (Mg) 2
0GdMg:Mg:Mg 2148.82 0
0GdMg:Y:Mg �8902.47 0
0GdY:Y:Mg 0 0
0GdY:Mg:Mg 0 0
0LdMg;Y:Mg:Mg 9006.45 88.50
0LdMg;Y:Y:Mg 641.82 11.86
0LdMg:Mg;Y:Mg �3910.07 3.46
0LdY:Mg;Y:Mg 9006.45 88.50
c(Mg%, Y) (Y%: Va) 0GcMg:Y �10727.25 1.26
0GcMg:Va 10464.50 0.0
0GcY:Y 13432.86 0
0GcY:Va 13483.55 0
0LcMg;Y:Y 15006.45 16
0LcMg;Y:Va 15006.45 15
0LcMg:Y;Va �5000 7
0LcY:Y;Va �5000 7
M. Mezbahul-Islam et al. / J. Chem. Thermodynamics 40 (2008) 1064–1076 1071
of this system and the temperature and composition of the two eu-tectic points around this compound remained within the limits ofthe experimental errors.
4.2.2. Thermodynamic propertiesThe calculated enthalpy of mixing of the Cu–Y liquid at
T = 1410 K in relation to the experimental results from the litera-ture is shown in figure 4a. The calculated activity of Cu atT = 1623 K is shown in figure 4b, which is in good agreement withthe experimental results of Berezutskii and Lukashenko [48] nearthe Y-rich corner. The curve shows some deviation from the exper-imental values between (20 and 35) at.% Y. However, the calcula-tion of Ganesan et al. [49] showed very similar results to thepresent calculation. A comparison between the calculated enthalpyof formation for the stoichiometric compounds and other works isshown in figure 4c. Discrepancy can be seen between the differentexperimental works which is not unexpected since both Cu and Yare highly reactive elements and it is very difficult to perform anykind of experimental investigation on this system. Nevertheless,the results obtained in this work lie within the error limits of theexperimental measurements.
4.3. The Mg–Y binary system
4.3.1. Phase diagramThe calculated phase diagram is shown in figure 5 with the
experimental data from the literature. The optimized parametersare listed in table 6. The homogeneity ranges of the e, d, and cphases were reproduced using the same models reported byShakhshir and Medraj [59] with a fewer number of excess Gibbsfree energy parameters. The models reported by Shakhshir andMedraj [59] are acceptable since both crystallographic informationand homogeneity range data were taken into consideration duringmodelling process.
4.3.2. Thermodynamic propertiesThe calculated enthalpy of mixing at T = 984 K is shown in fig-
ure 6a with the available experimental data in the literature. The
hcp
hcp+ε
ε
δ γ
δ γ+
Liquid
T/K
0.00 0.20 0.40300
600
900
1200
1500
1800
Mole fra
FIGURE 5. Plot of temperature against mole fraction yttrium to illustrate the calculatedM: [51], �: [55], .: [56].
activity of Mg in liquid Mg–Y at T = 1173 K is shown in figure 6bwhich shows very good agreement with the experimental worksin [49,61]. Better fit with the experimental data than the calcula-tions of [58,59] was achieved in this work. The calculated partialGibbs free energy of mixing of Mg and Y in the Mg–Y liquid atT = 1173 K shows good agreement with the experimental resultsof [63] as shown in figure 6c. Figure 6d shows the calculated
γ
hcp
L + β − Y
β − Y
hcp
β −Y
+
+ hcp
0.60 0.80 1.00
ction, Y
Mg–Y phase diagram: s: [50], h: one phase region [50], j: two phase region [50],

0.0 0.20 0.40 0.60 0.8 1.0
0
-6
-10
-2
Act
ivit
y M
g
0.0
1.0
0.8
0.6
0.4
0.2
0.0 0.20 0.40 0.60 0.8 1.00Mole fraction Y
Mole fraction Y
-5
-35
-25
-15
Hea
t of
for
mat
ion
/ (kJ
.mol
-1 . a
tom
- )
0.0 0.20 0.40 0.60 0.80 1.0
0 ε
δγ
-10 0
0
-60
-40
-20
Par
tial
gib
bs e
nerg
y of
Mg
and
Y /
(kJ.
mol
-1)
0.0 0.20 0.40 0.60 0.80 1.0
Mole fraction Y
-80
Mole fraction Y
Ent
halp
y of
mix
ing
/ (kJ
.mol
-1)
FIGURE 6. Plot of calculated thermodynamic properties against mole fraction yttrium with literature values: (a) enthalpy of mixing in kJ �mol�1 for the Mg–Y liquid atT = 984 K: h: at 1020 K, s: at 1057 K, M: at 984 K, e: at 975 K, : at 955 K. [60]. (b) Activity of Mg in the Mg–Y liquid at T = 1173 K: j: [49] at 1173 K, .: [61] at 1173 K. (c)Partial Gibbs free energy of mixing of Mg and Y at T = 1173 K: s: [49]. (d) Enthalpy of formation in kJ �mol�1 for the stoichiometric compounds: s: [this work], M: [55], h:[62].
1072 M. Mezbahul-Islam et al. / J. Chem. Thermodynamics 40 (2008) 1064–1076
enthalpy of formation of the intermediate compounds in the Mg–Ysystem in relation to the experimental results from the literature. Agood agreement between the calculated and the experimental dataof Smith et al. [55] and Pyagai et al. [62] can be seen. However, theenthalpy of formation for the c phase measured by Pyagai et al. [62]is not consistent with the experimental value of Smith et al. [55]and the calculated value in this work. However, the results ofSmith et al. [55] are more reliable since they used both the calori-metric and vapour pressure techniques in their investigation.
4.4. The Mg–Cu–Y system
A self-consistent thermodynamic database for the Mg–Cu–Ysystem has been constructed by combining the thermodynamicdescriptions of the three constituent binaries Mg–Cu, Cu–Y, andMg–Y. For the extrapolation of the ternary system, the Kohlergeometric model [70] was used since none of the three binarysystems showed much dissimilarity in their thermodynamiccharacteristics.
4.4.1. Phase diagramThe liquidus projection shown in figure 7 was calculated using
FactSage software [69] with the optimized parameters of the threeconstituent binary systems without introducing any ternary inter-action parameters.
The univariant valleys are shown by the heavier lines and thearrows on these lines indicate the directions of decreasing temper-ature. There are four ternary eutectic (E1 to E4) points, eight ternaryquasi-peritectic (U1 to U8) points and three maximum (m1 to m3)points present in this system. A summary of the reactions at theseinvariant points is given in table 7.
4.4.2. Thermodynamic propertiesGanesan et al. [49] measured the enthalpy of mixing of the ter-
nary Mg–Cu–Y liquid alloys by calorimetric method along five dif-ferent isopleths. Their results were compared with the presentcalculated enthalpy of mixing for three different sections as shownin figures 8a to c. The initial discrepancy with the experimental re-sults in figure 8c reflects the fact that the results of Ganesan et al.[49] for the enthalpy of mixing of ternary alloys is not consistentwith the experimental binary enthalpy of mixing for the Cu–Yliquid.
The calculated activity of Mg in the ternary liquid alloy atT = 1173 K is shown in figure 8d, with the experimental data ofGanesan et al. [49]. The calculated values showed negative devia-tion from Raoult’s law unlike the measured activity that showedpositive deviation. The reason for this is not known. Nevertheless,the present calculated activity of Mg showed similar trend as theone calculated by Ganesan et al. [49] who, also, could not explainthis inconsistency.

FIGURE 7. Liquidus projection of Mg–Cu–Y ternary system.
TABLE 7Calculated equilibrium points and their reactions in the Mg–Cu–Y system
No. Reaction Calculated (this work)
T/K Type Y/at.% Mg/at.% Cu/at.%
1 Liquid ¡ hcp-Mg + e + CuMg2 709.8 E1 7.7 79.2 13.12 Liquid ¡ d + CuMg2 + CuY 662.6 E2 17.8 59.6 22.63 Liquid ¡ Cu6Y + MgCu2 + Cu 956.3 E3 5.1 15.9 794 Liquid ¡ c + hcp-Y + CuY 910.1 E4 54.6 22.4 235 Liquid + e ¡ d + Mg2Cu 680.9 U1 14.7 67.9 17.36 Liquid + Cu2Y ¡ CuY + CuMg2 672.89 U2 17.4 58.3 24.37 Liquid + MgCu2 ¡ CuMg2 + Cu2Y 761.22 U3 8.8 51.4 39.88 Liquid + Cu7Y2 ¡ MgCu2 + Cu2Y 849.4 U4 9.8 40.6 49.69 Liquid + Cu4Y ¡ MgCu2 + Cu7Y2 957.4 U5 10.6 25.2 64.210 Liquid + Cu4Y ¡ Cu6Y + MgCu2 961.4 U6 5.8 15.9 78.311 Liquid + c ¡ d + CuY 794.23 U7 27.3 52.2 20.512 Liquid + b-Y ¡ hcp-Y + c 1038 U8 54 32.1 13.913 Liquid ¡ e + Mg2Cu 710.5 m1 8.8 77.4 13.814 Liquid ¡ MgCu2 + Cu4Y 995.5 m2 8.0 19.9 72.115 Liquid ¡ c + CuY 918.3 m3 49.6 26.1 24.3
M. Mezbahul-Islam et al. / J. Chem. Thermodynamics 40 (2008) 1064–1076 1073
4.5. Approximation of the Mg–Cu–Y system with ternaryintermetallics
Two ternary compounds Y2Cu2Mg and YCu9Mg2 were reportedin the literature by Mishra et al. [64] and Solokha et al. [65], butinformation on melting temperatures or the enthalpies of forma-tion of these compounds could not be found in the literature. Theonly available information is the annealing temperatures of thesetwo compounds. Annealing was used by Mishra et al. [64] and Sol-okha et al. [65] to grow single-crystals in the samples. The reportedannealing temperatures of Y2Cu2Mg and YCu9Mg2 are 900 K and673 K, respectively. This means that these ternary compoundsare stable at the annealing temperatures, and most probably theyexist at low temperatures.
In order to reflect this important information in our work, wehave created the approximate thermodynamic model of theMg–Cu–Y system with ternary intermetallics. Absence of experi-
mental data on melting temperatures and the enthalpies of forma-tion of these compounds limited our thermodynamic model, but itcould be useful for the readers who are interested in the ternaryphase equilibrium below T = 600 K.
The liquidus surface in this model may have substantial devia-tions from reality because only indirect experimental data wereavailable to approximate the melting temperatures of ternary com-pounds. That forced us to make some assumptions based on theavailable experiments on amorphous Mg–Cu–Y alloys and binaryphase diagrams.
Inoue et al. [3] and Ma et al. [4] studied the Mg–Cu–Y system tofind suitable compositions for metallic glass. They used XRD andDSC analyses to examine different amorphous samples. Duringtheir experiments, proper equilibrium conditions did not prevail,hence their experimental results cannot be used directly in thiswork. But after reviewing their [3,4] works, some informationregarding the system can be obtained. The DSC analysis of Ma

Act
ivit
y,M
g
0.0
1.0
0.8
0.6
0.4
0.2
0.0 0.20 0.40 0.60 0.80 1.00 Cu0.33Y0.67 Mole fraction Mg Mg
0.0 0.20 0.40 0.60 0.8 1.0
0
-5
-15
-10
Mg0.92Y0.8 Mole fraction Cu Cu 0.0 0.20 0.40 0.60 0.8 1.0Cu0.1Mg0.9 Mole fraction Y Y
-6
0
-3
-12
-9
0.0 0.20 0.40 0.60 0.8 1.0Cu0.33Y0.67 Mole fraction Mg Mg
-14
0
-7
-21
Ent
halp
y of
mix
ing
/ (kJ
.mol
-1)
Ent
halp
y of
mix
ing
/ (kJ
.mol
-1)
Ent
halp
y of
mix
ing
/ (kJ
.mol
-1)
FIGURE 8. Plot of thermodynamic properties against mole fraction for the Mg–Cu–Y liquid: integral enthalpy of mixing in kJ �mol�1 for (a) (Mg0.92Y0.08)1�xCux ternary liquidat T = 1023 K: M: [49] at 1023 K. (b) (Cu0.1Mg0.9)1�xYx ternary liquid at T = 1023 K: e: [49] at 1023 K. (c)(Cu0.33Y0.67)1�xMgx ternary liquid at T = 1107 K: h: [49] at 1107 K. (d)Activity of Mg at T = 1173 K, --- ideal mixing: M, h, e, s: [49].
FIGURE 9. Liquidus projection of the Mg–Cu–Y system with the ternary compounds (tentative).
1074 M. Mezbahul-Islam et al. / J. Chem. Thermodynamics 40 (2008) 1064–1076
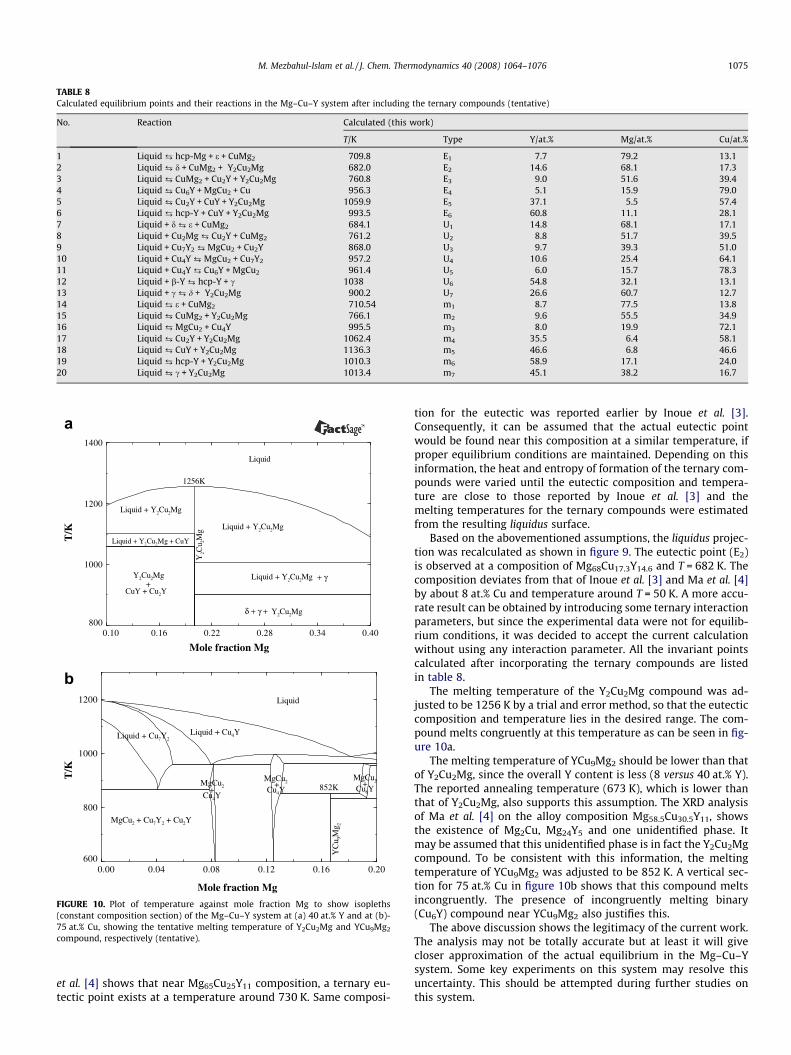
TABLE 8Calculated equilibrium points and their reactions in the Mg–Cu–Y system after including the ternary compounds (tentative)
No. Reaction Calculated (this work)
T/K Type Y/at.% Mg/at.% Cu/at.%
1 Liquid ¡ hcp-Mg + e + CuMg2 709.8 E1 7.7 79.2 13.12 Liquid ¡ d + CuMg2 + Y2Cu2Mg 682.0 E2 14.6 68.1 17.33 Liquid ¡ CuMg2 + Cu2Y + Y2Cu2Mg 760.8 E3 9.0 51.6 39.44 Liquid ¡ Cu6Y + MgCu2 + Cu 956.3 E4 5.1 15.9 79.05 Liquid ¡ Cu2Y + CuY + Y2Cu2Mg 1059.9 E5 37.1 5.5 57.46 Liquid ¡ hcp-Y + CuY + Y2Cu2Mg 993.5 E6 60.8 11.1 28.17 Liquid + d ¡ e + CuMg2 684.1 U1 14.8 68.1 17.18 Liquid + Cu2Mg ¡ Cu2Y + CuMg2 761.2 U2 8.8 51.7 39.59 Liquid + Cu7Y2 ¡ MgCu2 + Cu2Y 868.0 U3 9.7 39.3 51.010 Liquid + Cu4Y ¡ MgCu2 + Cu7Y2 957.2 U4 10.6 25.4 64.111 Liquid + Cu4Y ¡ Cu6Y + MgCu2 961.4 U5 6.0 15.7 78.312 Liquid + b-Y ¡ hcp-Y + c 1038 U6 54.8 32.1 13.113 Liquid + c ¡ d + Y2Cu2Mg 900.2 U7 26.6 60.7 12.714 Liquid ¡ e + CuMg2 710.54 m1 8.7 77.5 13.815 Liquid ¡ CuMg2 + Y2Cu2Mg 766.1 m2 9.6 55.5 34.916 Liquid ¡ MgCu2 + Cu4Y 995.5 m3 8.0 19.9 72.117 Liquid ¡ Cu2Y + Y2Cu2Mg 1062.4 m4 35.5 6.4 58.118 Liquid ¡ CuY + Y2Cu2Mg 1136.3 m5 46.6 6.8 46.619 Liquid ¡ hcp-Y + Y2Cu2Mg 1010.3 m6 58.9 17.1 24.020 Liquid ¡ c + Y2Cu2Mg 1013.4 m7 45.1 38.2 16.7
Mole fraction Mg
T/K Liquid + Y2Cu2Mg
Liquid + Y2Cu2Mg
Liquid + Y2Cu2Mg + CuY
Y2Cu2Mg Liquid + Y2Cu2Mg
Y2Cu2Mg
Liquid
+ γ
δ + γ +
Y2C
u 2Mg
1256K
+CuY + Cu2Y
0.10 0.16 0.22 0.28 0.34 0.40800
1000
1200
1400
Mole fraction Mg
T/K
MgCu2 + Cu7Y2 + Cu2Y
Liquid + Cu4Y
MgCu2MgCu2
Cu6Y+
Cu4Y+
+MgCu2
Cu4Y
Liquid + Cu7Y2
852K
YC
u 9Mg 2
Liquid
0.00 0.04 0.08 0.12 0.16 0.20600
800
1000
1200
a
b
FIGURE 10. Plot of temperature against mole fraction Mg to show isopleths(constant composition section) of the Mg–Cu–Y system at (a) 40 at.% Y and at (b)-75 at.% Cu, showing the tentative melting temperature of Y2Cu2Mg and YCu9Mg2
compound, respectively (tentative).
M. Mezbahul-Islam et al. / J. Chem. Thermodynamics 40 (2008) 1064–1076 1075
et al. [4] shows that near Mg65Cu25Y11 composition, a ternary eu-tectic point exists at a temperature around 730 K. Same composi-
tion for the eutectic was reported earlier by Inoue et al. [3].Consequently, it can be assumed that the actual eutectic pointwould be found near this composition at a similar temperature, ifproper equilibrium conditions are maintained. Depending on thisinformation, the heat and entropy of formation of the ternary com-pounds were varied until the eutectic composition and tempera-ture are close to those reported by Inoue et al. [3] and themelting temperatures for the ternary compounds were estimatedfrom the resulting liquidus surface.
Based on the abovementioned assumptions, the liquidus projec-tion was recalculated as shown in figure 9. The eutectic point (E2)is observed at a composition of Mg68Cu17.3Y14.6 and T = 682 K. Thecomposition deviates from that of Inoue et al. [3] and Ma et al. [4]by about 8 at.% Cu and temperature around T = 50 K. A more accu-rate result can be obtained by introducing some ternary interactionparameters, but since the experimental data were not for equilib-rium conditions, it was decided to accept the current calculationwithout using any interaction parameter. All the invariant pointscalculated after incorporating the ternary compounds are listedin table 8.
The melting temperature of the Y2Cu2Mg compound was ad-justed to be 1256 K by a trial and error method, so that the eutecticcomposition and temperature lies in the desired range. The com-pound melts congruently at this temperature as can be seen in fig-ure 10a.
The melting temperature of YCu9Mg2 should be lower than thatof Y2Cu2Mg, since the overall Y content is less (8 versus 40 at.% Y).The reported annealing temperature (673 K), which is lower thanthat of Y2Cu2Mg, also supports this assumption. The XRD analysisof Ma et al. [4] on the alloy composition Mg58.5Cu30.5Y11, showsthe existence of Mg2Cu, Mg24Y5 and one unidentified phase. Itmay be assumed that this unidentified phase is in fact the Y2Cu2Mgcompound. To be consistent with this information, the meltingtemperature of YCu9Mg2 was adjusted to be 852 K. A vertical sec-tion for 75 at.% Cu in figure 10b shows that this compound meltsincongruently. The presence of incongruently melting binary(Cu6Y) compound near YCu9Mg2 also justifies this.
The above discussion shows the legitimacy of the current work.The analysis may not be totally accurate but at least it will givecloser approximation of the actual equilibrium in the Mg–Cu–Ysystem. Some key experiments on this system may resolve thisuncertainty. This should be attempted during further studies onthis system.

1076 M. Mezbahul-Islam et al. / J. Chem. Thermodynamics 40 (2008) 1064–1076
5. Concluding remarks
A comprehensive thermodynamic assessment of the ternaryMg–Cu–Y system was conducted using available experimentaldata. Based on the current assessment, the following conclusionscan be drawn:
� The modified quasichemical model was used to describe theliquid phase in the Mg–Cu–Y system. The calculated phase dia-grams of the binary systems as well as thermodynamic proper-ties such as activity, enthalpy of mixing, and enthalpy offormation of the compounds show good agreement with theexperimental data available in the literature.
� A self-consistent database for the Mg–Cu–Y system was con-structed by combining the optimized parameters of the threeconstituent binary systems. No ternary interaction parameterswere used for the extrapolation.
� The presence of two ternary compounds was included in theoptimization considering the limited experimental informationavailable in the literature for these compounds.
� More experimental investigation is required to obtain detailedinformation regarding the two ternary compounds (Y2Cu2Mgand YCu9Mg2). The melting temperatures of these two com-pounds should be determined experimentally which is veryimportant to establish a more accurate assessment of theMg–Cu–Y system. Also, all the predicted invariant points inthe Mg–Cu–Y ternary system are to be verified experimentally.The present work can be used to design key experiments for fur-ther verification of this system.
References
[1] J.M. Kim, K. Shin, K.T. Kim, W.J. Jung, Scripta Mater. 49 (2003) 687–691.[2] R.H. Tendler, M.R. Soriano, M.E. Pepe, J.A. Kovacs, E.E. Vicente, J.A. Alonso,
Intermetallics 14 (2006) 297–307.[3] A. Inoue, A. Kato, T. Zhang, S.G. Kim, T. Masumoto, Mater. Trans. 32 (1991)
609–616.[4] H. Ma, Q. Zheng, J. Xu, Y. Li, E. Ma, J. Mater. Res. 20 (2005) 2225–2252.[5] H. Men, W.T. Kim, D.H. Kim, J. Non-Cryst. Solids 337 (2004) 29–35.[6] A.T. Dinsdale, CALPHAD 15 (1991) 317–425.[7] O. Redlich, A.T. Kister, J. Ind. Eng. Chem. 40 (1948) 341–345.[8] A.D. Pelton, S.A. Degterov, G. Eriksson, C. Robelin, Y. Dessureault, Metall. Mater.
Trans. B 31 (2000) 651–659.[9] P. Chartrand, A.D. Pelton, Metall. Mater. Trans. A 32 (2001) 1397–1407.
[10] A.D. Pelton, P. Chartrand, G. Eriksson, Metall. Mater. Trans. A 32 (2001) 1409–1416.
[11] P. Bagnoud, P. Feschotte, Z. Metallkd. 69 (1978) 114–120.[12] K.H.J. Buschow, A.S. Goot, Acta Crystallogr. B 27 (1971) 1085–1088.[13] C. Wagner, W. Schottky, J. Phys. Chem. B 11 (1930) 163–210.[14] S.G. Fries, H.L. Lukas, R. Konetzki, R. Schmid-Fetzer, J. Phase Equilibr. 15 (1994)
606–614.[15] K.C. Kumar, P. Wollants, J. Alloys Compd. 320 (2001) 189–198.[16] O. Boudouard, Comptes Rendus 135 (1902) 794–796.[17] R. Sahmen, Z. Anorg. Allg. Chem. 57 (1908) 1–33.[18] G.G. Urazov, Zh. Russ. Fiz. – Khim. Obschestva 39 (1907) 1556–1581.[19] W.R.D. Jones, J. Jpn. Inst. Met. 574 (1931) 395–419.[20] G. Grime, W. Morris-Jones, Philos. Mag. 7 (1929) 1113–1134.[21] V.G. Sederman, Philos. Mag. 18 (1934) 343–352.[22] M. Hansen, J. Jpn. Inst. Met. 428 (1927) 93–100.[23] J.W. Jenkin, J. Jpn. Inst. Met. 428 (1927) 100–102.[24] N.I. Stepanov, I.I. Kornilov, Izv. Inst. Fiz. – Khim. Analiza, Akad. Nauk SSSR 7
(1935) 89–98.
[25] N.I. Stepanov, Z. Anorg. Allg. Chem. 78 (1913) 1–32.[26] A.A. Nayeb-Hashemi, J.B. Clark, Bull. Alloy Phase Diagram 5 (1984) 36–43.[27] C.A. Coughanowr, I. Ansara, R. Luoma, M. Hämäläinen, H.L. Lukas, Z. Metallkd.
82 (1991) 574–581.[28] Y. Zuo, Y.A. Chang, Z. Metallkd. 84 (1993) 662–667.[29] S.P. Garg, Y.J. Bhatt, C.V. Sundaram, Metall. Mater. Trans. 4 (1973) 283–289.[30] N.G. Schmahl, P. Sieben, in: NPL Symposium on Phys. Chem. of Metallic
Solutions and Intermetallic Compounds, vol. 1, Paper 2K, 1960, pp. 268–282.[31] J.M. Juneja, G.N.K. Iyengar, K.P. Abraham, J. Chem. Thermodyn. 18 (1986)
1025–1035.[32] M. Hino, T. Nagasaka, R. Takehama, Metall. Mater. Trans. B 31 (2000) 927–
934.[33] F. Sommer, J.J. Lee, B. Predel, Ber. Bunsen-Ges. 87 (1983) 792–797.[34] G.I. Batlin, V.S. Sudavtsova, M.V. Mikhailovskaya, Izv. Vysh. Ucheb. Zaved,
Tsvetn Metall. 2 (1987) 29–31.[35] R.C. King, O.J. Kleppa, Acta Mater. 12 (1964) 87–97.[36] V.N. Eremenko, G.M. Lukashenko, R.I. Polotskaya, Izv. Akad. Nauk SSSR, Metall.
1 (1968) 210–212.[37] J.F. Smith, J.L. Christian, Acta Mater. 8 (1960) 249–255.[38] R.F. Domagala, J.J. Rausch, D.W. Levinson, Trans. Am. Soc. Met. 53 (1961) 137–
155.[39] T.B. Massalski, J.L. Murray, L.H. Bennett, H. Barker (Eds.), Binary Alloy Phase
Diagrams, vol.1, ASM International, Materials Park, OH, 1986, pp. 977–978.[40] D.J. Chakrabarti, D.E. E Laughlin, ASM Int. (1981) 478–481.[41] Q. Guojun, K. Itagaki, A. Yazawa, Mater. Trans. 30 (1989) 273–282.[42] K. Itagaki, Q.I. Guojun, A. Sabine, P.J. Spencer, CALPHAD 14 (1990) 377–384.[43] U. Abend, H.J. Schaller, J. Phys. Chem. 101 (1997) 741–748.[44] H. Okamoto, J. Phase Equilibr. 19 (1998) 398–399.[45] S. Watanabe, O.J. Kleppa, Metall. Trans. B 15 (1984) 573–580.[46] V.S. Sudavtsova, G.I. Vatalin, A.V. Kalmykov, F.F. Kuznetsov, Izv. Vysh. Ucheb.
Zaved. Cvetn. Metall. 6 (1983) 107–108.[47] O.Y. Sidorov, M.G. Valishev, Y.O. Esin, P.V. Gel’d, V.M. Zamyatin, A.Y. Dubrovski,
Izv. Akad. Nauk SSSR, Metall. 4 (1990) 188–190.[48] V.V. Berezutskii, G.M. Lukashenko, Zh. Fiz. Khim. 61 (1987) 1422–1424.[49] V. Ganesan, F. Schuller, H. Feufel, F. Sommer, H. Ipser, Z. Metallkd. 88 (1997)
701–710.[50] E.D. Gibson, O.N. Carlson, Trans. Am. Soc. Met. 52 (1960) 1084–1096.[51] Z.A. Sviderskaya, E.M. Padezhnova, Izv. Akad. Nauk SSSR, Metall. 6 (1968) 183–
190.[52] D. Mizer, J.B. Clark, Trans. Am. Inst. Min. Met. Eng. 221 (1961) 207–208.[53] Q. Ran, H.L. Lukas, G. Effenberg, G. Petzow, CALPHAD 12 (1988) 375–381.[54] T.B. Massalski, H. Okamoto, P.R. Subramanian, L. Kacprzak (Eds.), Binary Alloy
Phase Diagrams, second ed., vol. 3, ASM International, Materials Park, OH,1990, pp. 2566–2569.
[55] J.F. Smith, D.M. Bailey, D.B. Novotny, J.E. Davison, Acta Mater. 13 (1965) 889–895.
[56] H. Flandorfer, M. Giovannini, A. Saccone, P. Rogl, R. Ferro, Metall. Mater. Trans.A 28 (1997) 265–276.
[57] M.X. Zhang, P.M. Kelly, Acta Mater. 53 (2005) 1085–1096.[58] O.B. Fabrichnaya, H.L. Lukas, G. Effenberg, F. Aldinger, Intermetallics 11 (2003)
1183–1188.[59] S. Shakhshir, M. Medraj, J. Phase Equilibr. Diffus. 27 (2006) 231–244.[60] R. Agarwal, H. Feufel, F. Sommer, J. Alloys Compd. 217 (1995) 59–64.[61] V. Ganesan, H. Ipser, J. Chim. Phys. 94 (1997) 986–991.[62] I.N. Pyagai, A.V. Vakhobov, N.G. Shmidt, O.V. Zhikhareva, M.I. Numanov, Dokl.
Akad. Nauk Tadzh. SSR 32 (1989) 605–607.[63] R. Busch, W. Liu, L. Johnson, J. Appl. Phys. 83 (1998) 4134–4141.[64] R. Mishra, R.D. Hoffmann, R. Pottgen, Z. Naturforsch. B 56 (2001) 239–244.[65] P. Solokha, V. Pavlyuk, A. Saccone, S.D. Negri, W. Prochwicz, B. Marciniak, E.R.
Sokolowska, J. Solid State Chem. 179 (2006) 3073–3081.[66] M. Palumbo, M. Satta, G. Cacciamani, M. Baricco, Mater. Trans. 47 (2006)
2950–2955.[67] I.L. Rogel’berg, Tr. Gos. Nauch. -Issled. Proekt. Inst. Obrab. Tsvet. Met. 16 (1957)
82–89.[68] W.G. Wyckoff, Crystal Structures, second ed., vol. 1, John Wiley & Sons, New
York, 1963. pp. 365-367.[69] FactSage 5.4.1, Thermofact (Centre for Research in Computational
Thermochemistry), Montreal, QC, Canada, 2006.[70] F. Kohler, Monatsh. Chem. 91 (1960) 738–740.
JCT 07-365