ix. differences across racial/ethnic groups: whites ... · hispanics, 54% of african americans, and...
TRANSCRIPT

STAYING AHEAD OF THE CURVE 2007
��
60 U.S. Census Bureau, “Minority Population Tops 100 Million” (May 17, 2007); online: http://www.census.gov/Press-Release/www/releases/archives/population/010048.html.
61 Toossi, pp. 44 to 45.62 Projections for Hispanic and African American workers ages 45 and older were downloaded from the Civilian Labor Force 2007 to
2016 Projections page of the BLS web site at http://www.bls.gov/emp/emplab1.htm (February 2008).63 Respondents in the survey self-identified as white, African American, or Hispanic. In this study, “white” refers to non-Hispanic white.
Blacks who indicated that they are of Hispanic or Latino origin or descent are classified as Hispanic (not African American) in this study’s analysis.
Hispanics and African Americans are, on average, younger than the non-Hispanic white population. However, Hispanics and African Americans already constitute a significant portion of today’s age 45+ workforce, and that presence will increase over time as much of the growth in Hispanic and African American workers will occur in the 45+ age group. For example, from 2007 to 2016, the number of Hispanic workers ages 45 and older is expected to increase by 55 percent and the number of African American workers ages 45 and older is expected to rise by 24 percent whereas white workers ages 45+ will increase by only 9 percent.62
The extent to which the work-related experiences, attitudes, and expectations of today’s older workforce persists into the future will depend, in part, on the degree to which the views of tomorrow’s older minority workers resemble or differ from those of today’s older workers.
Thus far, Staying Ahead of the Curve 200� has examined the views of 45- to 74-year-old workers generally without reference to race or ethnicity. This section focuses on the racial and ethnic differences—how older workers in the two largest minority groups of the United States differ from whites and from each other in work-related experiences, preferences, and plans. Many of the findings identified and presented earlier for the overall older worker population also apply to African Americans and Hispanics as well as to whites.63 But on other dimensions, the minority groups are unique. It is these contrasts that will be highlighted here.
In order to facilitate a comparison among African American workers, Hispanic workers, and whites, this nationally representative survey of 45- to 74-year-old workers included oversamples of African American workers and Hispanic workers to yield a total of 421 older African American workers and 601 older Hispanic workers.
IX. Differences Across Racial/Ethnic Groups: Whites, African Americans, Hispanics
The U.S. Hispanic and African American populations are growing faster than the white population.
From mid-2005 to mid-2006, the Hispanic population ages 16 and older jumped by 3.4 percent
and the African American population increased by 1.3 percent, while the white population grew by
only 0.3 percent.60 Consequently, both of these minority groups, African Americans and especially
Hispanics, are expected to constitute larger proportions of the workforce in the years ahead. For
example, although Hispanics age 16 and older represented 13.7 percent of the U.S. workforce in
2007, they are expected to account for 16.4 percent of U.S. workers in 2016. African American
workers will also make up an increasing share of the U.S. workforce, growing from 11.4 percent of
the workforce in 2006 to 12.3 percent in 2016. In contrast, the share of the workforce represented
by whites will decline from 69.1 percent to 64.6 percent during the same ten-year time period.61

Ful l Report September 2008
��
Contrasting Demographic and Employment ProfilesWhile all three racial/ethnic groups of 45- to 74-year-old workers contain a fairly balanced distribution of men and women, white and Hispanic older workers are more heavily male (53% and 52%, respectively) than African American older workers (only 45% male). In terms of age, African American and Hispanic workers are younger (60% and 63%, respectively, are 45 to 54 years of age; and 11% and 10% are 62 to 74, compared to 52% of whites who are ages 45 to 54 and 16% who are 62 to 74).
Levels of education and income are lower, on average, for both minority groups than they are for whites. African American older workers are less likely to be currently married or living as married than are whites; Hispanics are the least likely to be single. Almost half of older Hispanic workers (48%) were born outside the United States, compared to just 8 percent of African Americans and 3 percent of whites, which suggests that older Hispanic workers may be more likely than their African American and white counterparts to encounter communication barriers in the job market resulting from a lack of proficiency in the English language.64
The three older worker groups also differ in terms of employment characteristics such as their employment status, occupation, and tenure in their current job. African Americans (10%) and especially Hispanics (14%) are more likely to be currently unemployed and looking for work than are whites (5%). They are also less likely to work in executive/professional positions (27% and 20% respectively for African Americans and Hispanics vs. 37% for whites) and more likely to have blue-collar jobs
(31% and 42% vs. 27% for whites). Average tenure in their current job is only slightly lower than it is for whites (12 years for African Americans and Hispanics compared to 14 years for whites).65
The complete demographic and employment profiles of the respondents are located in Appendix A. Readers should keep in mind the differences between the three groups’ demographic and employment profiles during the subsequent presentation of differences in their work-related experiences, preferences, and plans. Although this section comments on probable drivers of observed differences among the groups, conclusive testing to determine the causes of the differences is beyond the scope of the study.
45- to 74-Year-Old Minority Workers Specify More Reasons for Working and Emphasize Financial NeedPerhaps the most striking observation about the differences in the major reasons for working named by the three groups is the sheer number of minority workers that cite each reason. African Americans and especially Hispanics are more likely than whites to regard each of the eleven different reasons probed as a major reason for working.66 This strong pattern probably partly reflects substantive contrasts—older African American and Hispanic workers may very well have more reasons for working—but it may also partly reflect cultural differences in response tendency.67
Because of differences in socio-economic status, it is not surprising that financial need is mentioned more often by African Americans and Hispanics than by whites, including working to pay for
64 More than half (322, or 54%) of the 601 Hispanic respondents to this survey chose to complete the telephone interview in Spanish.65 Average number of hours worked per week and average expected number of years of work before retirement are not significantly
different across the three racial/ethnic groups.66 The differences between Hispanics and whites are large enough to reach statistical significance for each of the 11 reasons. The
differences between African Americans and whites reach statistical significance for 10 of the 11 reasons; the remaining reason elicited more responses from African Americans than from whites but not enough more to represent a significant difference.
67 See, for example, Jerold G. Bachman and O’Malley, P.M., “Yea-Saying, Nay-Saying, and Going to Extremes: Black-White Differences in Response Styles,” Public Opinion Quarterly Vol. 48, No. 2 (Summer, 1984), 491 to 509 and G. Marin, Gamba, R.J. and Marin, B.V. (1992) “Extreme Response Style and Acquiescence among Hispanics,” Journal of Cross-Cultural Psychology 23 (4), 498 to 509.

STAYING AHEAD OF THE CURVE 2007
��
health costs for self or other family members (Figure 23, page 97). The latter reason for working also differentiates the two groups of older minority workers, as it is identified as a major reason for working by eight in ten (81%) Hispanics compared with two thirds (67%) of African Americans. The greater tendency of Hispanics to cite the need to cover health costs for themselves or their families may reflect the relatively large intact families that are more common among Hispanics than the other two groups. Consistent with this potential explanation, two-thirds of Hispanics also cite the need to support other family members as a major reason for working, compared to only 54 percent of African Americans and 44 percent of whites.
The greater financial need of older minority workers is further underscored by their greater agreement with the statement, “The only reason I continue to work is because I need the money”—with which 76 percent of African Americans and 72 percent of Hispanics concurred compared to just 57 percent of whites. However, as noted above, Hispanics and African Americans were more likely than whites to name each of the listed reasons—the financial ones and the non-financial ones—as major factors in their decision to work.
Working because one enjoys the job particularly characterizes Hispanic workers. “Enjoy the job/enjoy working” was not only the major reason for working most often mentioned by Hispanics, but it was also named by Hispanics more often than by any other group (85%). In contrast, enjoyment was cited by just seven in ten (71%) African Americans, making it the 4th most often mentioned major reason among African Americans. For whites, it was the second most often selected major reason, named by just under seven in ten (69%). Two other reasons mentioned more often by Hispanic workers than by their African American and white counterparts
include working because it “gives me something to do” (67% of Hispanics, 53% of African Americans, and only 35% of older white workers), and working “to be able to interact with people” (65% of Hispanics, 54% of African Americans, and only 45% of older white workers).
Both Minority Groups and Whites View Money as the Single Most Important Reason for WorkingFor all three groups (whites, African Americans, and Hispanics), “need the money” is the most frequently named single most important reason for working (Figure 24, page 99). “Need to support other family members” is a much closer second choice among Hispanics (23%) compared to African Americans (15%), while this reason is mentioned less often by whites (10%) as the single most important reason for working.
As discussed earlier, “enjoy working” was selected as a major reason for working by more Hispanics than African Americans and whites. However, it was picked as the single most important reason for working by only 7 percent of Hispanics, less frequently than among whites (12%) and slightly less often than by African Americans (10%). These findings suggest that Hispanics may be particularly likely to enjoy their work but that most view something other than enjoyment as their main reason for working.
“Need the money” was selected by whites more often in 2007 (39%) than in 2002 (32%) as the single most important reason for working, although the share of Hispanics and African Americans who mentioned it exhibited no significant changes over the same time period. The proportion of African Americans who identified “saving for retirement” as their single most important reason for working declined from 11 percent in 2002 to 5 percent in 2007 but did not change among Hispanics or whites.

Ful l Report September 2008
��
Figure 23: Major Reasons for Working, by Race/Ethnicity
76%
69%
60%
64%
44%
55%
50%
45%
41%
40%
35%
85%
71%
73%
73%
54%
67%
64%
54%
61%
59%
53%
82%
85%
77%
77%
67%
81%
68%
65%
62%
68%
67%
Need the money
Enjoy the job or enjoy working
Need to maintain health insurance coverage
To save more for retirement
Need to support other family members
Need to pay for health costs for self or others in family
Makes me feel useful
To be able to interact with people
To qualify for Social Security
To fulfill pension requirements
Gives me something to do, keeps me busy
White African American Hispanic
Base: Total Whites (n = 1237), Total African Americans (n = 421), Total Hispanics (n = 601)
Q4a/b. “First, I’d like you to rate each of the following things in terms of their importance in your decision to be working/looking for work right now. For each item, please tell me if it is a major factor, or a minor factor, or no factor at all in your decision to be working/looking for work.”
STAYING AHEAD OF THE CURVE 2007
�8
Combining the most important and the second most important reasons for working indicates that five main motivations for working predominate, although the relative frequency with which each is mentioned differs slightly across the three racial/ethnic groups. These five main motivations include the need for money, to maintain health insurance and to pay for health care, to save for retirement, for enjoyment, and to support family members.
By far, “need the money” is mentioned most often by all three groups although it does not appear quite as often among Hispanics’ top two most important reasons for working as among those of African Americans and whites. Other than the need for money, the remaining top motivations affecting the decision to work (based on the percentage of workers naming each factor as either their first or second most important reason for working) vary somewhat across the groups:
» “Need to support other family members” receives the second highest number of mentions among Hispanics and African Americans, and fifth among whites.
» “Need to maintain health insurance” is third highest among African Americans and Hispanics, and second highest among whites. Another issue related to health care needs, the “need to pay for health costs for self or family,” elicits the fourth highest number of mentions among African Americans and Hispanics, and is sixth among whites.
» “To save more for retirement” is sixth (in terms of number of mentions) among African Americans, tied for fifth and sixth most mentions among Hispanics, and tied for third and fourth among whites.
» “Enjoy the job/Enjoy working” is fifth among African Americans, seventh among Hispanics, and tied for third and fourth most mentions among whites.68
In short, for all three racial/ethnic groups, at least four of the five most important motivations for working are economic in nature. Compared to whites, Hispanics and African Americans place a greater emphasis on supporting other family members. Whites place a greater emphasis than the other two groups on enjoying the work.
Work-Related Challenges Facing Minority WorkersAfrican American Workers Are More Concerned About Losing Their Job but More Confident about Getting a Replacement PositionAfrican Americans are more likely to believe that their job will be eliminated in the next year than are whites (Figure 25, page 100). Approximately one in four (26%) African American older workers think that it is very likely or somewhat likely that they could lose their job compared to fewer than one in five (18%) whites, with Hispanics falling in between (22%). Older workers in each of the three race/ethnic groups who think that their job may be eliminated tend to cite similar reasons related to the local or broader economy.
Although more African Americans than other older workers fear near-term job elimination, African Americans as a group are more confident about becoming re-employed should such a loss occur: More than eight in ten (82%) are very or somewhat confident in their ability to get a replacement job right away without having to move or take a cut in pay, compared to just over seven in ten (72%) white and Hispanic workers. African American workers’ confidence in their ability to find a new job quickly has increased since 2002, when it stood at 73 percent.
68 “Fulfilling pension requirements” actually elicited more mentions by Hispanics than “enjoy the job/enjoy working” (14% vs. 13%), but it is not listed above because it is not among the top six reasons for working among the total sample.

Ful l Report September 2008
��
Figure 24: Most Important Reasons for Working, by Race/Ethnicity*
38%
15%
10%
8%
10%
5%
2%
29%
23%
7%
4%
7%
5%
7%
17%
11%
13%
7%
4%
8%
10%
13%
8%
12%
11%
8%
9%
6%
39% 16% 55%
10% 17% 27%
8% 13% 21%
12% 8% 21%
10% 8% 18%
5% 7% 12%
4% 5% 9%
54%
26%
23%
15%
14%
13%
12%
42%
31%
19%
15%
14%
14%
13%
WhiteNeed the money
Need to maintain health insurance coverage
To save more for retirement
Enjoy the job or enjoy working
Need to support other family members
Need to pay for health costs for self or others in family
Makes me feel useful
African AmericanNeed the money
Need to support other family members
Need to maintain health insurance coverage
Need to pay for health costs for self or others in family
Need to maintain health insurance coverage
Need to pay for health costs for self or others in family
Enjoy the job or enjoy working
To save more for retirement
To fulfill pension requirements
HispanicNeed the money
Need to support other family members
To save more for retirement
To fulfill pension requirements
Enjoy the job or enjoy working
Most important reason Second-most important reason
Base: Total Whites (n = 1237), Total African Americans (n = 421), Total Hispanics (n = 601)
Q4ab/b. “Which of the things we just talked about is the ONE MAJOR FACTOR in your decision to be working/looking for work right now?”
Q4ad/bd. “And, of the same list of issues we talked about, what would you say is the SECOND major factor in your decision to be working/looking for work right now?”
*For each race/ethnic group, chart shows the seven factors that were named most frequently as either the single most important reason for working or the second most important reason for working. Due to rounding, percentages for the single most important reason and second most important reason may not appear to add up to the total.

STAYING AHEAD OF THE CURVE 2007
100
Total (n = 1419)
White (n = 1179)
African American (n = 368)
Total (n = 1500)
White (n = 1237)
African American (n = 421)
Hispanic (n = 601)
Percentage of workers who say that their job is very or somewhat likely to be eliminated and percentageof workers who say they are very or somewhat confident they could get another job right away.
Hispanic (n = 525)
Base for Q19: Respondents who are working full-time, part-time, or are self-employed.
Q19a. “How likely is it that your job could be eliminated within the next year?”
Q19b (self-employed). “How likely is it that you will have to give up working for yourself within the next year?”
Base for Q21: Total
Q21a (employed). “If your job were eliminated tomorrow, how confident are you that you could get another job right away without having to move or take a cut in pay?”
Q21b (unemployed). “How confident are you that you will get another job soon without having to move or take a cut in pay?”

Ful l Report September 2008
101
Hispanics Are More Concerned That Their Prospects for Re-Employment Would Be Hampered by Technical and Communication Skills; Both Minorities Struggle to Keep Up with Changing Technology
Older Hispanic workers who lack confidence in their chances of securing re-employment quickly after a job elimination—28 percent of Hispanics—attribute their low confidence to a variety of issues. Like their white and African American counterparts, Hispanic workers cite the economy and their age most often. However, Hispanics are more likely than the other two race/ethnic groups to cite inadequate computer skills (11% of Hispanics vs. 4% of African Americans and 3% of whites) and language or communication skills (11% of Hispanics vs. 0% of African Americans and 1% of whites).
Other evidence from the survey reinforces this finding related to Hispanics’ concerns about computer skills. For example, nearly half (46%) of older Hispanic workers say they have difficulty keeping up with technology compared to just one in four (25%) whites and about three in ten (31%) African American workers (Figure 26, page 103). Although African American workers are less likely than Hispanics to mention such difficulties, the share of African American workers expressing difficulty with technology has increased since 2002 when just under two in ten (19%) cited this challenge. Although mastering workplace technology is a particularly common challenge among Hispanic workers, it is clearly a growing concern for African Americans as well.
African American Workers Who Haven’t Changed Jobs Recently Are Less Likely to Attribute Tenure to Enjoying Their Jobs Employed older African American workers who have been in their current job longer than five years are less likely than other workers to attribute their lack of mobility to enjoying their job (41% of African American workers vs. 49% of Hispanic workers and 52% of whites). They are slightly more likely than whites and Hispanics to refer to “financial obligations.”
Older Hispanic Workers Are More Likely to Seek Work-Life BalancePossibly because Hispanics have larger intact families and due to their strong cultural emphasis on family, Hispanics are more likely to report that they are looking for better ways to balance work with personal life (78%) than are whites (66%) and African Americans (68%).
Essential Features of the Ideal Job Are Similar for the Three Race/ Ethnicity GroupsHispanic, African American, and white older workers generally share the same priorities when it comes to features considered to be absolutely essential elements of their ideal job. “Having a chance to use your skills and talents” is the element most frequently identified as essential by each of the three groups. Nearly as important in terms of proportion of mentions are “a friendly work environment,” which comes in second, and having “the chance to do something worthwhile,” which is “ranked” either third or fourth by each group.69 The two minority groups depart from whites in ranking “healthcare benefits or insurance” and “good pension benefits” slightly higher than whites do, and they rank
69 As in the discussion of the elements of the “ideal job” presented earlier in the report, this section also uses the term “rank” to refer to the relative percentage of respondents that identified each attribute as an essential component of the ideal job. The respondents themselves did not rank the components. Therefore, within each race/ethnicity group, we assigned a rank of 1 to the attribute that was selected by the largest percentage of respondents in that race/ethnicity group, 2 to the attribute that was selected by the second highest percentage of respondents in that race/ethnicity group, etc.

STAYING AHEAD OF THE CURVE 2007
102
“competitive pay” slightly lower than white workers do. “Feeling respected by your boss” is ranked higher by Hispanics than by whites and African Americans, and “feeling respected by your co-workers” is ranked relatively lower by African Americans than it is by the other two groups.
As with the major reasons given for working, the two minority groups are more likely than whites to identify many of the features as absolutely essential components of their ideal job. Again, it is unclear how much of this finding reflects substantive differences—differences in the way minority groups and whites envision their “ideal job”—and how much reflects differential response tendencies, such as a tendency of these minorities to be more likely to acquiesce to items presented in a survey (in this situation, a greater inclination to answer “yes” when asked if the features are absolutely essential components of their ideal job).70
There were few notable differences in relative “rank” in 2007 and 2002. For African Americans, respect from co-workers dropped from 8th to 12th highest in the proportion of workers identifying it as absolutely essential (although still chosen by 82% in 2007). Opportunity to learn something new dropped from 5th to 10th for Hispanics (although still chosen by 84% in 2007).
“Feeling respected by your boss” moved up in Hispanic worker rankings from 9th to 3rd highest in 2007 (even though this ideal job element was chosen by approximately nine in ten Hispanics in both years). There are no clear explanations for these shifts in the relative proportion of workers deeming each job attribute essential. However, the contrasts between the 2002 and 2007 findings are minor compared to the similarities in the relative rankings of each job component.
Older Minority Workers Face Extra ChallengesOlder minority workers are more likely to report challenging life circumstances and events than their white counterparts. This applies in multiple realms—family responsibilities, challenging personal and family events, and financial difficulties. On some of the indicators, the contrasts are sharp, suggesting that older Hispanic and African American workers may encounter markedly greater obstacles than whites do.
Greater Family ResponsibilitiesHispanic and African American workers appear to have more caregiving responsibilities than do older white workers. This appears to stem in part from the fact that members of the two minority groups are more likely than whites to have children living with them (43% of Hispanics and 37% of African Americans vs. 25% of whites). However, in addition to reporting more responsibility for the care of children and grandchildren, Hispanics and African Americans are also more likely than whites to report having responsibility for the care of a spouse. Hispanic workers, in addition, are more likely than white workers to be responsible for the care of a parent. African American workers are also more likely than whites to report responsibility for the care of another adult relative other than a parent or spouse.
In the past five years, more Hispanics (31%) and African Americans (23%) than whites (11%) have assumed responsibility for the care of a spouse or partner on a regular basis (Table 26, page 104). The same is true for providing regular child care or daycare for a grandchild: 29% of Hispanics and 23% of African Americans but only 9% of whites have started providing such care with the past five years. And, older Hispanic workers are more likely than others to have taken on care of a parent or other adult relative (38% for Hispanics vs. 30% for African Americans and 28% for whites).
70 As noted in Chapter V, the tendency to regard features as essential was also higher in general (for all three race/ethnicity groups) in 2002 than in 2007—possibly due to differences in the way these items were administered in the two surveys.

Ful l Report September 2008
103
Older minority workers also have experienced more potentially stressful and disruptive family-related changes in the last five years such as having an adult child move back home, having their last child move out of the house, and getting married or divorced. Together, these findings strongly suggest that older Hispanic and African American workers, on average, bear a greater burden when it comes to caregiving and family responsibilities than do older white workers.
Illnesses, Deaths, and Mid-Life CrisesOver one-quarter of Hispanics (26%) report having survived a major illness in the past five years, compared to 21% of African Americans and 18% of whites. African Americans, on the other hand, are more likely than other workers to have experienced the loss of a close relative or friend (77% vs. 68% for Hispanics and 62% for whites). Both minorities are nearly twice as likely as whites to have experienced a mid-life crisis within the past five years (28% of African Americans and 29% of Hispanics vs. 15% of whites).
Figure 26: Difficulty Keeping Up With New Technology, by Race/Ethnicity
10%
9%
15%
32%
8%
8%
9%
20%
16%
16%
16%
15%
16%
16%
10%
19%
26%
25%
31%
46%
24%
24%
19%
39%
2007
Total (n = 1419)
White (n = 1179)
African American (n = 368)
Hispanic (n = 525)
2002
Total (n = 1400)
White (n = 1184)
African American (n = 366)
Hispanic (n = 331)
Strongly Agree Somewhat Agree
Base: Respondents who are working part-time, full-time, or self-employed
Q13. “Now, I would like you to think about where you are in your work-life. I am going to read you some statements about working and your career. Please tell me if you strongly agree, somewhat agree, somewhat disagree, or strongly disagree with each statement: ‘I have difficulty keeping up with all the new technology required to do my job.’”

STAYING AHEAD OF THE CURVE 2007
10�
Financial Distress/LossSerious financial problems have affected fully half (50%) of older African American workers in the past five years, three of every ten (30%) Hispanic workers, but fewer whites (21%). Respondents in the two minority groups are more likely than whites to have lost health benefits or had them significantly reduced (30% of African Americans, 28% of Hispanics vs. 21% of older white workers). Additionally, African Americans are more likely than other workers to report a loss of—or severe reduction in—pension benefits (18% of African Americans vs. 12% of whites and 11% of Hispanics).
More African Americans and Hispanics also lost their jobs in the past five years (26% of African Americans and 25% of Hispanics vs. 18% of whites). Nearly one-third of older Hispanic workers (32%) say they made a major career change during this period; the proportion of African Americans and whites who changed careers is somewhat lower (25% of African Americans and 24% of whites).
Table 26: Life Experiences in Past Five Years by Race/Ethnicity
Percentage of workers who said they had personally experienced these changes or event in the past five years.
Total 2007 White African American Hispanic
(n=1500) (n=1237) (n=421) (n=601)
% % % %
Having a close relative or friend die 63 62 77 68
Becoming responsible for the care of a parent or an adult relative other than spouse/partner 28 28 30 38
Making a major career change 25 24 25 32
Experiencing SERIOUS financial problems 24 21 50 30
Losing your health benefits or having your health benefits significantly reduced 23 21 30 28
Having your last child move out of the house 21 20 23 29
Losing your job 19 18 26 25
Surviving a major illness 19 18 21 26
Having an adult child move back home 18 16 28 29
Experiencing a midlife crisis 17 15 28 29
Losing your pension or having your pension benefits significantly reduced 12 12 18 11
Beginning to take care of a spouse or a partner on a regular basis 12 11 23 31
Providing child care or daycare to a grandchild on a regular basis 12 9 23 29
Retiring from a job 10 9 8 12
Getting a divorce 7 7 16 9
Getting married 6 6 10 11
Having a spouse or partner die 5 5 11 9
Base: Total
Q10. “I am now going to read you a list of major life changes or events. Please tell me which, if any, of these changes or events you have personally experienced IN THE PAST 5 YEARS. Please respond by answering either “yes” or “no” as I read each item to you.”

Ful l Report September 2008
10�
Fewer in All Groups Now Perceive Age Discrimination Exists/Hispanics More Than Whites Believe It Is Common Compared to 2002, fewer workers in all three groups believe that workers today face age discrimination. The percentage of African Americans who believe age discrimination exists in the workplace dropped from 72 percent to 60 percent, while the percentage of whites sharing this belief dropped from 66 percent to 61 percent, and the decline among Hispanics was from 69 percent to 63 percent. Among older workers who think that age discrimination in the workplace does, in fact, exist, African Americans and Hispanics are more likely than whites to believe it is very common (55% of African Americans and 53% of Hispanics vs. 42% of whites).
African American Workers Are Particularly Likely to Perceive Racial DiscriminationAfrican American workers are twice as likely to say that they have personally been the victims of workplace discrimination on the basis of their race or ethnicity than because of their age: 16 percent say their employer treats them worse than other workers due to their race, but only 8 percent say they are treated worse due to their age (Figure 27). Furthermore, the proportion of older African American workers who believe that their race elicits worse treatment (16%) is more than twice the proportion who believe that their race elicits better treatment (6%).
13%
Figure 27: Personal Experiences with Workplace Discrimination Based on Age and Race/Ethnicity
13%
8%
14%
5%
4%
16%
12%
Total (n = 1282)
White (n = 1049)
African American (n = 386)
Hispanic (n = 530)
Treated worse because of age
Treated worse because of race/ethnicity
Base: Respondents who are working part-time or full-time or are looking for work
Q29. “Thinking about how you are personally treated in the workplace, would you say the following generally cause YOUR EMPLOYER to treat you better, worse, or no differently than other workers?”

STAYING AHEAD OF THE CURVE 2007
10�
Although a sizable share of older Hispanic workers (12%) thinks that their race/ethnicity leads employers to treat them worse than other workers, a statistically identical share of Hispanics (10%) report that their race/ethnicity leads to better treatment. Clearly, Hispanics who feel that their race/ethnicity affects how employers treat them are divided between those who view their race/ethnicity as an
advantage in the workplace and those who view it as a barrier. Compared to both African Americans and Hispanics, whites perceive their race/ethnicity to be much less of a factor. For example, only 9 percent of white workers believe that their race/ethnicity affects how they are treated, with 5 percent feeling that it leads to better treatment and 4 percent reporting that it leads to worse treatment.
68%
31%
22%
10%
4%
1%
1%
30%
79%
29%
21%
16%
11%
1%
2%
19%
75%
24%
20%
20%
7%
2%
2%
23%
Plan to work (net)
Work part-time mainly for interest or enjoyment sake
Work part-time mainly for the needed income it provides
Start your own business or work for yourself (i.e., self-employed)
Retire from current job or career but work full-time doing something else
I do not plan to retire*
Work (something else)*
Not work for pay
Base: Total
Q25. “Which of the following, if any, best represents what you plan to do during your retirement?”
*These responses were not read to respondents but were offered spontaneously by some respondents.

Ful l Report September 2008
10�
Perceptions of Age Discrimination Vary By Race/EthnicityFor older white and Hispanic workers, enduring worse treatment because of their age is the most common type of workplace discrimination, reported by 14 percent of Hispanics and 13 percent of whites. However, almost as many in each group (10% of Hispanics and 7% of whites) feel that their age leads to better treatment.
Overall, slightly more older white and Hispanic workers perceive worse treatment due to age than perceive better treatment due to age. In contrast, older African American workers are more likely to believe that their age elicits better treatment than to believe that it results in worse treatment.
When asked if they have personally experienced certain types of age-related discrimination within the past five years, white, Hispanic, and African American workers report similar incidences of such events. When asked if they have experienced such discrimination ever over the course of their career, reported rates of discrimination are again similar across the three groups with one exception: Whites (16%) and Hispanics (17%) are more likely than African Americans (10%) to say that they have not been hired at some point in their life because of their age.
Plans for Retirement Fewer Whites Than Minorities Plan to Work in RetirementMore older African American workers (79%) than white workers (68%) intend to work for pay during retirement (Figure 28, page 106). Among older Hispanic workers, 75 percent have such expectations.
African Americans and Hispanics Are Entrepreneurially Minded Older minority workers are more likely than white workers to plan to work for themselves in retirement. For example, 16 percent of African Americans and 20 percent of Hispanics compared to only 10 percent of white workers intend to start a business or work for themselves in retirement.
Motivations for Working During Retirement Differ TooWhen asked why they plan to work in retirement, older Hispanic workers are far more likely than African Americans and whites to say they plan to work “to support themselves” (20% of Hispanics vs. 6% of whites and 5% of African American workers). Whites are most likely to attribute their plans to continue working to a desire or need for money (29% of whites vs. 22% of African Americans and 15% of Hispanics). White workers’ next most common reasons for planning to work during retirement, mentioned by 22 percent each, are “to have something interesting to do” and “enjoy working.” “To have something interesting to do” is mentioned less often by Hispanics (12%) and somewhat less often by African American workers (18%). Hispanics (24%) and African Americans (24%) are just as likely as whites to mention “enjoy working.”
Racial/Ethnic Differences in PerspectiveThis chapter has identified many differences among older African American, Hispanic and white workers as well as some similarities. Some of the contrasting experiences, perceptions, and aspirations are most likely due to racial or ethnic differences per se rather than merely due to underlying socio-economic differences among the groups. When all other demographic and employment attributes of the three groups are held constant, some of the observed differences will most likely persist. Other descriptive differences across the three groups in work-related beliefs and experiences, however, are likely to diminish or vanish for workers with similar socio-economic characteristics. Because the older African American, Hispanic, and white worker populations have somewhat different profiles with respect to age, sex, marital and family circumstances, English language proficiency, employment, and other attributes, it is difficult to isolate the drivers of the differences in experiences, perceptions, and plans. But, regardless of the reasons for the differences, the data presented leave little doubt that older African American, Hispanic, and white workers constitute mutually distinctive segments of the 45- to 74-year-old workforce.

STAYING AHEAD OF THE CURVE 2007
108
As shown in the demographic and employment profiles of the survey respondents in Appendix A, the distinguishing characteristics of 45- to 74-year-old Hispanic workers, as a group, include their relatively low education and income levels (compared to non-Hispanic workers), higher concentration in blue-collar jobs and lower presence in executive/professional positions, lower average tenures at their present job, and a lower current rate of employment. Older Hispanic workers are also, of course, more likely than African Americans and whites to have been born outside the U.S.
This section focuses on only Hispanics, taking a closer look at the Hispanic workers in our survey to examine the differences and similarities between subgroups within the older Hispanic workforce. To that end, this section focuses primarily on differences between Hispanic males and females, those in different age segments, those in different socio-economic subgroups (education, income, occupation type), and those born in the U.S. compared with those born in other countries. Overall contrasts between Hispanic workers, African American workers, and white workers are covered in the previous section (Chapter IX).
Employment Characteristic Differences To set the stage for this in-depth look at 45- to 74-year-old Hispanic workers, this section begins with a list of the key ways in which the employment characteristics of certain segments of the older Hispanic workforce differ from one another:
1. Women are more likely to be employed part-time than men; overall, women average 38 hours of work per week and men average 43 hours per week;
2. Full-time workers average 42 hours per week; part-time workers average 27 hours per week (Figure 29, page 111);
3. Of older Hispanic workers with annual household incomes under $30,000, only half are employed full-time, which is far fewer than those with higher incomes;
4. Hispanics born outside the U.S—almost half of the older Hispanic worker population— are somewhat less likely than U.S.-born Hispanic workers to be employed in full-time jobs (Table 27, page 109). Foreign-born workers also have lower household incomes than other Hispanic workers (median household income of $33,100 vs. $57,800 for native-born Hispanics). The median individual annual incomes of native-born and foreign-born Hispanic workers also differ and are $49,400 and $25,800, respectively.
X. A Closer Look at Hispanic Workers
As the fastest growing population in the U.S., Hispanics are becoming an increasingly large
percentage of the workforce. This growth is already affecting the make-up of the pool of 45- to
74-year-old workers, and the trend is likely to continue in the decades ahead. For this reason, this
section of the report examines older Hispanic workers in depth to learn whether they are largely
homogenous in their work-related experiences, perceptions, and future plans, or if subgroups differ
noticeably from one another.

Ful l Report September 2008
10�
Hispanics
Total 2002 Total 2007 U.S.-Born Foreign-Born
(n=400) (n=601) (n=234) (n=363)
% % % %
Average number of years at current job 12 12 14 9
Hispanics
Total 2002 Total 2007 U.S.-Born Foreign-Born
(n=400) (n=601) (n=234) (n=363)
% % % %
Sex
Male 55 52 50 54
Female 45 48 50 47
Household Annual Income
Under $30K 38 28 17 41
$30K to <$50K 19 21 19 23
$50K to <$80K 13 20 28 11
$80K or more (NET)* 15 21 26 15
$80K to <$100K* 7 9 5
$100K or more* 14 17 10
Median Household Annual Income** $34,000 $46,400 $57,800 $33,100
Education
High school or less 55 58 50 67
Some college/votech 19 20 24 17
College graduate 9 14 17 10
Post-graduate 5 7 10 4
Employment
Total employed (NET) 85 86 90 83
Full-time 59 66 72 59
Part-time 13 12 10 13
Self-employed 13 9 7 11
Looking for work 15 14 10 18
Occupation Type
Blue-collar 38 42 37 48
White-collar 22 22 24 20
Executive/professional 15 20 26 13
Marital Status
Married/living as married 66 71 68 75
Single 15 8 12 4
Widowed/divorced 11 17 20 14
Tenure
Table 27: Profile of Older Hispanic Workers
Base: Total Hispanics.
*In the 2002 survey, the highest income category specified was $80,000 or more.
**Median incomes were estimated based on the percentage of respondents who reported that their income fell into each of the above income categories.

STAYING AHEAD OF THE CURVE 2007
110
Reasons for Working When asked to identify the major reasons that they are in the workforce, Hispanic men tend to cite more major reasons than do women. For example, Hispanic men are more likely than women to cite reasons related to family economic support such as “need to support other family members” and “need to pay for health costs for self or others in family,” but they are also more likely than women to say they work because they like to work, because work keeps them busy, and because it makes them feel useful.
Hispanic workers in the older age category (age 55 to 74), some of whom are presumably already receiving Social Security checks and/or retirement pensions, are more likely than 45- to 54-year-olds to report that they are working because it keeps them busy and makes them feel useful. Workers in the 45 to 54 age bracket more often stress the need to support other family members than do those 55 and older.
Foreign-born Hispanics are more likely than the native born to name all 11 reasons as major reasons for working. A similar tendency to name more major reasons for working was apparent to a slightly lesser degree among Hispanics with less education and lower incomes (compared to their better-educated and higher-income counterparts). This may reflect a cultural tendency of less assimilated Hispanics and, to a certain extent, lower socio-economic segments to acquiesce in response to survey questioning.
The Most and Second Most Important Reasons for WorkingWhen respondents are forced to select the single most important and next most important reasons for working, issues related to immediate financial security such as “need the money” and “need to support other family members” are the motivating factors that rise to the top. Foreign-born Hispanic workers are less likely than the native-born to identify “need the money” as a first or second most important reason for working, and they are more likely than
the native-born to emphasize family needs such as “support other family members” and “health care costs for self or others in family” (Table 28, page 112).
Hispanic women stress the need to maintain health insurance more often than men do when naming their two most important reasons for working. Maintenance of health insurance is also more prominently mentioned by workers with relatively high household incomes than by their lower-income counterparts, possibly because those with higher incomes are more likely to have such employer-based insurance.
Working “Only for the Money” Is More Common Among the Lower Socio-Economic StrataSimilar to older workers from lower socio-economic strata within the general population, older Hispanic workers in lower socio-economic categories (those with less formal education, lower household incomes, blue-collar jobs) are more likely than others to agree with the statement: “The only reason I continue to work is because I need the money.” For example, fully 90 percent of Hispanic workers with incomes under $30,000 endorse that view, compared with just 75 percent of those with incomes of $30,000 to under $50,000 and 62 percent of those with incomes of $50,000 or more.
Work-Related Challenges Like other older workers, Hispanics who feel their job does not utilize their skills and talents are significantly more concerned than those whose skills are utilized that their job might be eliminated in the next year (33% vs. 14%). In fact, the degree to which workers feel that their skills are utilized is among only a few of the many factors examined in the survey that appear to influence perceived likelihood of job elimination. Workers in the higher age bracket (ages 55 to 74) and those in the lowest income bracket (less than $30,000 per year) appear to be more concerned than those ages 45 to 54 and those with higher incomes about the possibility that their job could be eliminated.

Ful l Report September 2008
111
Men and Women Offer Differing Accounts of Their Employment Future Male and female Hispanic workers who think that their job could be eliminated cite different types of reasons. Men tend to refer to slow business or the weak economy, whereas women are somewhat more likely to refer to the potential obsolescence of their skills—expressing concern that there is no longer a need for the type of work that they do—or to their individual job performance.71
Of Hispanic workers who think that their job could be eliminated, virtually none (only one percent) cite age as a reason.
Confidence in Finding New Work Varies Across SegmentsMale workers, those with more education, workers with higher incomes, those in white-collar positions,
and workers who feel that their job utilizes their skills are more confident than other segments of the older Hispanic workforce that they would be able to find a new job quickly, if their job was eliminated. The contrasts in confidence levels expressed by certain segments are substantial. For example, 81 percent of Hispanic men but only 63 percent of women express confidence in their ability to find a new job. (In the general population, confidence does not vary significantly by sex.) More than eight in ten (85%) Hispanic college graduates but only 66 percent of Hispanics with a high school education or less feel confident about finding a replacement job. Similar differences exist by occupation type: 85 percent of white-collar workers are confident versus 68 percent of blue-collar workers.
Figure 29: Hours Worked by Hispanic Workers
43
38
42
27
48
Gender
Men (n = 202)
Women (n = 323)
Employment
Full-time (n = 356)
Part-time (n = 98)
Self-employed (n = 71)
Average hours worked per week
Base: Hispanic respondents who are working part-time, full-time, or self-employed (excludes unemployed)
Q12. “About how many hours do you work during an average week?’” (Chart shows the average number of hours worked per week.)
71 This comparison of reasons given by men and women when explaining why their job may be eliminated is based on small sub-samples of men and women who think that their job may be eliminated. Although the differences between the explanations given by men and women appear strong, the differences are not statistically significant due to the small sizes of the sub-samples.
STAYING AHEAD OF THE CURVE 2007
112
72 This comparison of reasons given by men and women when explaining why they are not confident in their ability to find another job is based on small sub-samples of men and women who expressed a lack of confidence in their ability to find a new job quickly if their job were eliminated. For this reason, although the differences between the explanations given by men and women appear strong, the differences are not statistically significant due to the small sizes of the sub-samples. (Interestingly, although Hispanic women were more likely than men to cite age, the average age of Hispanic women and men respondents was the same at the time of the survey—53.)
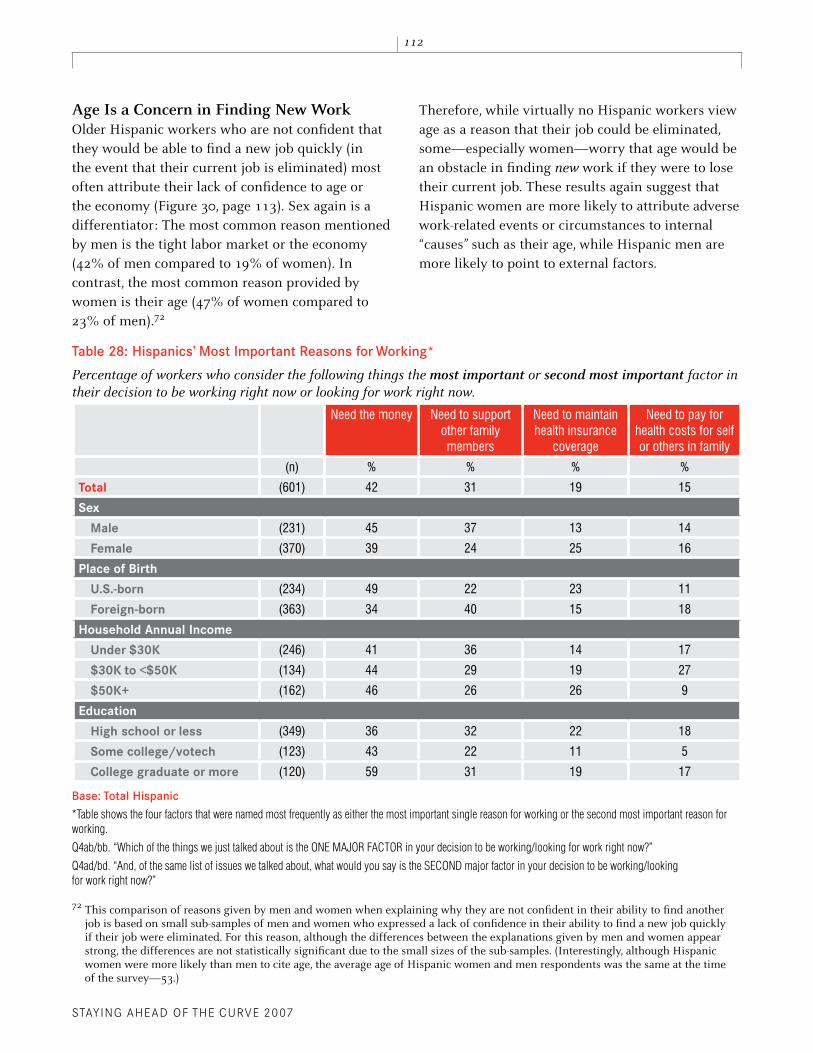
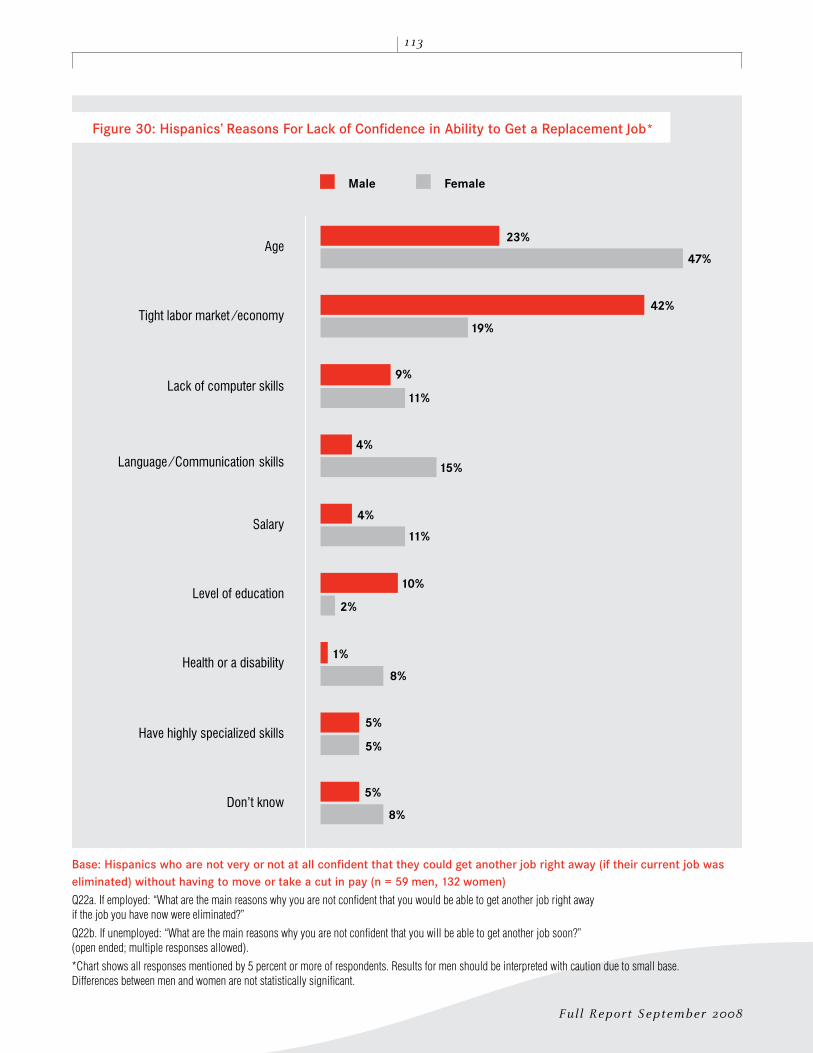
Age Is a Concern in Finding New Work Older Hispanic workers who are not confident that they would be able to find a new job quickly (in the event that their current job is eliminated) most often attribute their lack of confidence to age or the economy (Figure 30, page 113). Sex again is a differentiator: The most common reason mentioned by men is the tight labor market or the economy (42% of men compared to 19% of women). In contrast, the most common reason provided by women is their age (47% of women compared to 23% of men).72
Therefore, while virtually no Hispanic workers view age as a reason that their job could be eliminated, some—especially women—worry that age would be an obstacle in finding new work if they were to lose their current job. These results again suggest that Hispanic women are more likely to attribute adverse work-related events or circumstances to internal “causes” such as their age, while Hispanic men are more likely to point to external factors.
Table 28: Hispanics’ Most Important Reasons for Working*
Percentage of workers who consider the following things the most important or second most important factor in their decision to be working right now or looking for work right now.
Need the money Need to support other family members
Need to maintain health insurance
coverage
Need to pay for health costs for self or others in family
(n) % % % %
Total (601) 42 31 19 15
Sex
Male (231) 45 37 13 14
Female (370) 39 24 25 16
Place of Birth
U.S.-born (234) 49 22 23 11
Foreign-born (363) 34 40 15 18
Household Annual Income
Under $30K (246) 41 36 14 17
$30K to <$50K (134) 44 29 19 27
$50K+ (162) 46 26 26 9
Education
High school or less (349) 36 32 22 18
Some college/votech (123) 43 22 11 5
College graduate or more (120) 59 31 19 17
Base: Total Hispanic
*Table shows the four factors that were named most frequently as either the most important single reason for working or the second most important reason for working.
Q4ab/bb. “Which of the things we just talked about is the ONE MAJOR FACTOR in your decision to be working/looking for work right now?”
Q4ad/bd. “And, of the same list of issues we talked about, what would you say is the SECOND major factor in your decision to be working/looking for work right now?”
Ful l Report September 2008
113
Figure 30: Hispanics’ Reasons For Lack of Confidence in Ability to Get a Replacement Job*
Male Female
23%
42%
9%
4%
4%
10%
1%
5%
5%
47%
19%
11%
15%
11%
2%
8%
5%
8%
Age
Tight labor market / economy
Lack of computer skills
Language / Communication skills
Salary
Level of education
Health or a disability
Have highly specialized skills
Don't know
Base: Hispanics who are not very or not at all confident that they could get another job right away (if their current job was eliminated) without having to move or take a cut in pay (n = 59 men, 132 women)
Q22a. If employed: “What are the main reasons why you are not confident that you would be able to get another job right away if the job you have now were eliminated?”
Q22b. If unemployed: “What are the main reasons why you are not confident that you will be able to get another job soon?” (open ended; multiple responses allowed).
*Chart shows all responses mentioned by 5 percent or more of respondents. Results for men should be interpreted with caution due to small base. Differences between men and women are not statistically significant.

STAYING AHEAD OF THE CURVE 2007
11�
Utilization of Job SkillsThe degree to which older Hispanic workers feel that they use their skills and talents on the job varies considerably across segments of the older Hispanic workforce. For example, twice as many foreign-born workers as native-born workers say that their current job allows them to use their skills and talents only a little or not at all (20% vs. 10%).
Women, too, are less likely to hold jobs that fully utilize their skills and talents: 19 percent say their job utilizes their skill only somewhat or less compared to 10 percent of men. (In the general older worker population, there is no difference between men and women workers.) Not surprisingly, utilization of skills increases with income. Only 7 percent of Hispanics with household incomes of $50,000 or more report that their job does not fully utilize their skills and talents compared to 18 percent of older workers with lower incomes.
One of the consequences of under-utilization of job skills is a worker’s sense of professional progress or development: Those working in jobs that utilize their skills a lot are more likely to agree with the statement “I am continuing to grow in my work” (91% vs. 73% among those whose jobs do not use their skills a lot).
New Workplace Technology Has Differential ImpactsProblems keeping up with new technology are more likely to be experienced by foreign-born Hispanic workers, blue-collar workers, and those with lower incomes and less education (even more so than among lower socio-economic status groups in the overall workforce). In addition, older Hispanic workers with a high school education or less are more likely than those with at least some college education to feel that they should not have to learn new skills at the current stage of their work life (43% vs. 16%). Other Hispanic workers who are more likely to express reluctance to learning new skills include lower-income workers, those in the older age group (55+), and foreign-born workers.
Hispanic Men Are Particularly Likely to Seek Better Work-Life BalanceThe degree of interest in achieving better work-life balance is another factor that distinguishes the segments of older Hispanic workers from one another. Hispanic men express this desire more often than Hispanic women (86% vs. 69%)— a contrast which does not exist in the general population (Figure 31, page 115). It may be that the paternalism embedded in the culture creates additional stress for Hispanic men, who may feel an extra sense of family responsibility beyond what exists in the broader U.S. society.
Balancing work and personal life is also particularly likely to be a desire of foreign-born Hispanic workers, those with the least education, and those with the lowest incomes.
Essential Features of the Ideal Job When asked to identify which of 19 attributes are absolutely essential parts of their ideal job, male and female Hispanic workers differ significantly in their opinions about the importance of just three: Females are more likely than males to choose “opportunity for part-time work” (58% vs. 43%)—possibly because they are more likely than men to be working part-time. Additionally, females are less likely than males, though still very likely, to select “chance to use your skills and talents” (90% vs. 98%) and “competitive pay” (75% vs. 91%). (On these last two items, older men and women workers in the general population do not differ.)
Foreign-born and native-born Hispanic workers differ in the importance that they attach to 10 of the 19 job features. In each case, foreign-born workers identify the attribute as essential more often than do native-born workers, which may reflect a culturally determined response inclination more than substantive differences between those segments.
Hispanic workers from lower socio-economic statuses (those having less education and/or lower incomes) also are more likely than those in higher socio-economic strata to identify many of the

Ful l Report September 2008
11�
Total 2007 (n = 525)
Male (n = 202)
Female (n = 323)
U.S.-Born (n = 212)
Foreign-Born (n = 309)
<$30K (n = 202)
$30K to <$50K (n = 116)
$50K+ (n = 155)
Percentage of Hispanic workers strongly and somewhat agreeing with the statement, “I am looking for ways to better balance work with my personal life.”
Base: Hispanic respondents who are working part-time, full-time, or self-employed
Q13. “Now, I would like you to think about where you are in your work-life. I am going to read you some statements about working and your career. Please tell me if you strongly agree, somewhat agree, somewhat disagree, or strongly disagree with each statement: ‘I am looking for ways to better balance work with my personal life.’”

STAYING AHEAD OF THE CURVE 2007
11�
job features as absolutely essential. For example, workers with no college education are more likely than those with more education to identify eight of the job features as essential; and workers with incomes of less than $30,000 are more likely than those with higher incomes to select 10 of the job features as essential. None of the 19 job characteristics is regarded as absolutely essential more often by college graduates (vs. those with less education) or by workers with incomes of at least $50,000 (vs. those with lower incomes). Among the job features eliciting responses that vary based on income is “opportunity to learn something new,” selected by nearly all of workers with household incomes under $30,000 (96%) compared to 80 percent of workers with higher incomes. This might suggest a special openness to professional growth among low-income Hispanic workers.
Three contrasts appear between Hispanic workers ages 45 to 54 and those who are 55+: As might be predicted, the younger group is less interested than the older group in working from home and in working part-time; and, they are more interested in jobs offering adequate paid time off such as sick leave or vacation time.
Life Challenges In the past five years, foreign-born Hispanic workers ages 45 to 74 are more likely than native-born workers to have begun caring for a spouse or partner on a regular basis and to have provided child care or daycare for a grandchild on a regular basis. Foreign-born workers are also more likely to have seen their last child move out of the house, but less likely than the native-born to have had an adult child move back home. Foreign-born workers are also more likely than native-born workers to have gotten married in the past five years. Several of these differences between foreign-born and native-born workers represent potentially stressful life events, which may indicate that foreign-born workers have faced more stress in their personal life in the past five years than have native-born workers.
Those with Less Education and Income Face More ChallengesAssuming regular care of a spouse/partner is more likely to have affected older Hispanic workers with the least education and the lowest incomes. Like other older workers with lower incomes, lower-income Hispanics are also more apt than those with greater financial resources to have encountered other life challenges during the past five years such as the following:
» surviving a major illness,
» having a close friend or relative die,
» having a mid-life crisis,
» experiencing serious financial problems,
» losing a job,
» losing health benefits or having them significantly reduced,
» losing pension benefits or having them significantly reduced, and
» becoming responsible for caring for a parent or other adult relative (Figure 32, page 117).
Age and Other Forms of Discrimination Beliefs about Age Discrimination Vary By Age and SexForeign-born Hispanic workers appear more likely than U.S.-born workers to believe that age discrimination exists in the workplace. Among those who believe age discrimination exists, as in the general older worker population, Hispanic women are more likely than men to believe that workplace age discrimination is very common.
As is the case with non-Hispanics, Hispanic workers are somewhat more likely to believe that their age elicits worse treatment (14%) from their employers than to believe that it elicits better treatment (10%). Interestingly, foreign-born Hispanics (16%) are

Ful l Report September 2008
11�
Figure 32: Life Events/Changes Experienced in the Past Five Years, by Hispanic Income Segment
75%
45%
38%
54%
39%
30%
31%
49%
41%
25%
38%
46%
16%
19%
17%
10%
14%
57%
26%
51%
25%
38%
35%
35%
26%
34%
31%
33%
29%
12%
12%
12%
17%
11%
66%
35%
22%
15%
21%
23%
25%
18%
24%
31%
18%
12%
9%
6%
7%
6%
6%
Having a close relative or friend die
Becoming responsible for the care of aparent or an adult relative other than
spouse / partner
Making a major career change
Beginning to take care of a spouse or partneron a regular basis
Experiencing SERIOUS financial problems
Having your last child move out of the house
Providing child care or daycare to agrandchild on a regular basis
Losing your health benefits or having healthbenefits significantly reduced
Experiencing a midlife crisis
Having an adult child move back home
Surviving a major illness
Losing your job
Retiring from a job
Losing your pension or having your pensionbenefits significantly reduced
Getting married
Getting a divorce
Having a spouse or partner die
<$30K $30K to <$50K $50K+
Base: Total Hispanics within each household income group. (<$30,000: n = 246; $30,000 to $50,000: n = 134; $50,000+: n = 162)
Q10. “I am now going to read you a list of major life changes or events. Please tell me which, if any, of these changes or events you have personally experienced IN THE PAST 5 YEARS. Please respond by answering either “yes” or “no” as I read each item to you.”

STAYING AHEAD OF THE CURVE 2007
118
Table 29: Hispanics’ Experiences with Various Forms of Age Discrimination Ever
Percentage of Hispanic workers who report that the following specific discriminatory things have ever happened to them at work.
Hispanic
Total 2002 Total 2007 U.S.-Born Foreign- Born
(n = 400) (n = 601) (n = 234) (n = 363)
% % % %
Passed up for a promotion or a chance to get ahead because of your age
15 11 11 12
Not getting hired for a job you applied for because of your age
14 17 17 17
Laid-off, fired, or forced out of a job because of your age
9 8 3 13
Passed up for a raise because of your age
9 8 8 8
Denied access to training or professional development opportunities because of your age
– 8 7 10
Base: Total Hispanic
Q30. “Please tell me whether each of the following has EVER happened to you at work?”
significantly more likely than U.S.-born Hispanics (5%) to think that they receive better treatment due to their age. In fact, foreign-born Hispanics are just as likely to view age as a cause of better treatment (16%) as they are to consider it a cause of worse treatment (16%).
Perceptions of Ethnic Discrimination Depend on Level of EducationRoughly equal numbers of Hispanic workers believe that their race/ethnicity elicits better treatment from their employer as believe that it elicits worse treatment. However, the likelihood of Hispanics to believe that their race/ethnicity leads to better or worse treatment varies by education and occupation type. Those with the least education are more likely to feel that their race/ethnicity leads to better treatment (11%) than to believe that it leads to worse treatment (6%; Figure 33, page 119). College graduates are more likely to view it as a cause of worse treatment (28%) than better treatment (15%). Executives and professionals also are more likely to view their Hispanic ethnicity as a disadvantage (in terms of treatment by their employer) than an advantage.
Most Vulnerable Workers Lose Jobs More Often Because of Their AgeForeign-born workers and workers with low household incomes report a higher incidence than native-born workers and those with higher incomes of having been laid-off, fired, or forced out of a job due to their age at some point during their working years. For example, 13 percent of the foreign-born say this has happened to them compared to just 3 percent of native-born Hispanic workers (Table 29). Seventeen percent of workers with incomes below $30,000 report such an occurrence compared to only 4 percent of workers with higher incomes.
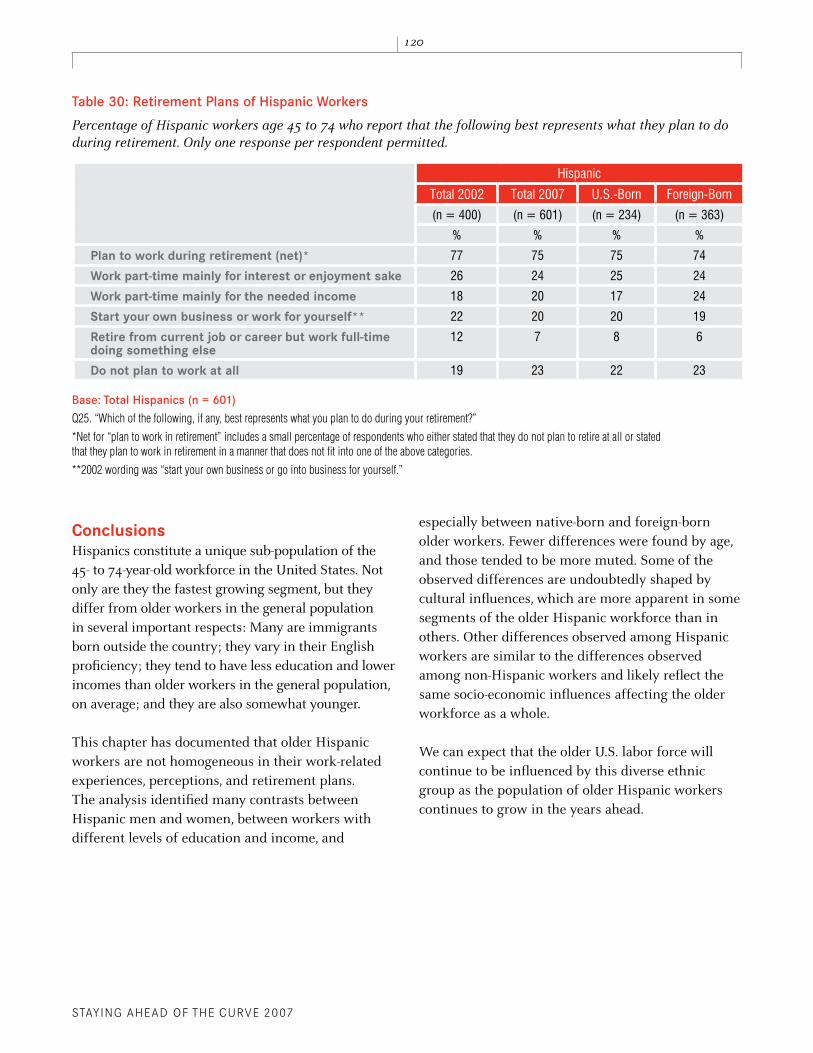
Retirement Plans Three-quarters of older Hispanic workers plan to work for pay (at least part-time) during retirement (Table 30, page 120). This is less true of executives/professionals (61%) and blue-collar workers (70%), compared to other white-collar workers (92%). Hispanic men and women are equally likely to expect to work in retirement—unlike in the general population, where fewer women than men have such expectations.
Compared with women, Hispanic men are more likely to plan to start a business or work for

Ful l Report September 2008
11�
themselves in retirement. Workers with relatively low household incomes (under $30,000) are more likely than those with higher incomes ($50,000+) to plan to work mainly for the income.
When Hispanic workers who expect to work in retirement are asked to explain the reasons for those expectations, foreign-born workers are more likely than native-born workers to say they will work in order to support themselves and also to stay physically active. Men who expect to work in retirement are more likely than women to attribute these expectations to the fact that they enjoy working, while women are more likely than men to cite a desire to be around people.
On average, 45- to 74-year-old Hispanic workers who expect to stop working at some point plan to work
another 12 years before stopping work completely, which is similar to the general population. Among Hispanic workers who are employed full-time or part-time, a majority (56%) plan to continue working for their current employer until they stop working, while 28 percent expect to change employers. Workers who feel that their current job does not utilize their skills well are more likely to say they will change employers before fully retiring than are those who say that their skills are utilized (41% vs. 19%). Similarly, white-collar workers not classified as executive/professionals (50% of whom expect to change employers) are more likely than blue-collar workers (20%) and those in executive or professional positions (26%) to expect to switch employers before stopping work completely.
Figure 33: Hispanics’ Perceptions of Treatment Due to Race/Ethnicity (by Education Level)
Percent of Hispanic workers who report that their race/ethnicity causes their employer to treat them better, worse, or no different than other workers.
10%
11%
4%
15%
12%
6%
14%
28%
75%
82%
77%
56%
3%
1%
6%
1%
Total (n = 530)
High School or less (n = 308)
Some college / votech (n = 113)
College graduate (n = 101)
BetterWorseNo DifferentDon't Know / Refused
Base: Hispanic respondents who are working part-time or full-time or are looking for work (n=530)
Q29b. “Thinking about how you are personally treated in the workplace, would you say YOUR RACE OR ETHNICITY generally causes YOUR EMPLOYER to treat you better, worse, or no differently than other workers?”
STAYING AHEAD OF THE CURVE 2007
120
Table 30: Retirement Plans of Hispanic Workers
Percentage of Hispanic workers age �� to �� who report that the following best represents what they plan to do during retirement. Only one response per respondent permitted.
Hispanic
Total 2002 Total 2007 U.S.-Born Foreign-Born
(n = 400) (n = 601) (n = 234) (n = 363)
% % % %
Plan to work during retirement (net)* 77 75 75 74
Work part-time mainly for interest or enjoyment sake 26 24 25 24
Work part-time mainly for the needed income 18 20 17 24
Start your own business or work for yourself** 22 20 20 19
Retire from current job or career but work full-time doing something else
12 7 8 6
Do not plan to work at all 19 23 22 23
Base: Total Hispanics (n = 601)
Q25. “Which of the following, if any, best represents what you plan to do during your retirement?”
*Net for “plan to work in retirement” includes a small percentage of respondents who either stated that they do not plan to retire at all or stated that they plan to work in retirement in a manner that does not fit into one of the above categories.
**2002 wording was “start your own business or go into business for yourself.”
ConclusionsHispanics constitute a unique sub-population of the 45- to 74-year-old workforce in the United States. Not only are they the fastest growing segment, but they differ from older workers in the general population in several important respects: Many are immigrants born outside the country; they vary in their English proficiency; they tend to have less education and lower incomes than older workers in the general population, on average; and they are also somewhat younger.
This chapter has documented that older Hispanic workers are not homogeneous in their work-related experiences, perceptions, and retirement plans. The analysis identified many contrasts between Hispanic men and women, between workers with different levels of education and income, and
especially between native-born and foreign-born older workers. Fewer differences were found by age, and those tended to be more muted. Some of the observed differences are undoubtedly shaped by cultural influences, which are more apparent in some segments of the older Hispanic workforce than in others. Other differences observed among Hispanic workers are similar to the differences observed among non-Hispanic workers and likely reflect the same socio-economic influences affecting the older workforce as a whole.
We can expect that the older U.S. labor force will continue to be influenced by this diverse ethnic group as the population of older Hispanic workers continues to grow in the years ahead.