it sector update, march 2013
TRANSCRIPT

7/29/2019 IT Sector Update, March 2013
http://slidepdf.com/reader/full/it-sector-update-march-2013 1/17
Please refer to important disclosures at the end of this report 1
The global economy is set to improve going ahead with global GDP predicted to
grow by 3.5% in CY2013 and 4.1% in CY2014. Global IT - business process
management (BPM) spend is expected to grow in the range of 5-6% over the next
two years and global sourcing is set to grow faster at ~8% during 2013 and
2014. India continues to be the global sourcing leader, but it accounts for only
~10% of the total global IT-BPM spend of US$124-130bn, which implies that the
market is huge and presents immense untapped opportunity. Indian IT-BPM firms
are well positioned to take advantage of these trends by working towards
developing new capabilities, servicing the entire IT services value chain and
expanding their focus to new geographies, technologies and industry verticals.
Indian companies grabbing market share vs global peers: We expect worldwide
IT spending (excluding hardware) to post a three-year CAGR of 4.4% while the
total sourcing market is expected to grow by ~7-8% (~2x of worldwide spend).
Top IT service players globally have been increasing their market share every year
in the overall IT-BPM spending and have gained ~110bp per annum share
annually since the last five years. While the worldwide IT services market has
posted a five year CAGR of just ~3.5% and global sourcing market having posted
a CAGR of ~9% commensurately, Indian software services revenue has posted a
16% CAGR (almost 2x of growth in global sourcing); primary reason for the same
being the labor arbitrage or cost savings to clients. The top-5 Indian IT companies
have been increasingly gaining market share since last five years in the overall
revenues from biggies of IT services sector globally.
Indian IT - Large cap companies leading the growth: The top-5 Indian IT services
vendors have increased their share of Indian IT exports by ~135bp per annum.
This supplements the fact that Indian large-cap players have been surpassing
mid-cap companies in terms of grabbing market share. Taking into notice the
average market share gains over the past six years (FY2007-12) and 7-8% CAGR
in global sourcing spend for the next three years, the top-5 Indian IT companies
are likely to grow at ~14% CAGR over the next three years.
Valuation: We continue to remain positive on TCS and HCL Tech from a longer
term perspective, though current valuations preclude us from taking any
considerable upsides from current levels for the next couple of quarters. We
expect TCS and HCL Tech to lead the growth in tier-I IT pack by growing higher
than the industry average in FY2014. We recommend Accumulate rating on TCS
and HCL Tech with target price of ` 1,624 and ` 875, respectively. The PE
premium commanded by TCS over Infosys has reduced now, given Infosys’
outperformance during 3QFY2013 after six quarters of disappointing results. We
maintain Accumulate rating on Infosys as well as Wipro with target price of
` 3,132 and ` 473, respectively.
Tech Mahindra remains one of our preferred picks in the entire IT space as the
company has recently acquired two companies which will give it inorganic boost.
Also, post its merger with Mahindra Satyam, the risks which the company is facing
right now such as client concentration and industry concentration will be curtailed
and the company will be able to reap benefits from Mahindra Satyam’s capability in enterprise services. Along with Tech Mahindra, we like KPIT Cummins among
mid-caps at the current level with a target price of ` 130, owing to recent
correction in the stock price despite industry leading revenue growth.
Ankita Somani
022-39357800 Ext: [email protected]
IT Sector
Indian IT - Long term growth outlook intact
Sector Update | IT
March 20, 2013

7/29/2019 IT Sector Update, March 2013
http://slidepdf.com/reader/full/it-sector-update-march-2013 2/17
Sector Update | March 2013
March 20, 2013 2
Worldwide IT spending
On the face of a volatile economic environment, 2012 recorded a steady growth
for technology and related services sector, with worldwide spending of US$1.9tn, a
growth rate of 4.8% yoy. Of the worldwide technology spend of ~US$1.9tn inCY2012, software products, IT, and BPM services contributed ~US$1.1tn (58%)
while hardware accounted for the balance ~US$797bn (42%). Worldwide,
hardware spending grew by 7%, IT services spend increased by 3.3%, BPM grew
by 4.9% and spend on software products increased by 3.3%. In line with growth in
global IT spend, the global sourcing market also grew to US$124-130bn, ie a
growth of 9% over 2011, which is nearly twice the growth in global IT spend. As
per Nasscom, lingering concerns about global economy also impacted contracts in
2012 as volumes fell by ~13%. However, average contract value remained fairly
steady at US$21bn largely on the back of number of mega deals signed in the
BPM space. As per Nasscom, accelerated IT spending is likely to be witnessed in
2013 with areas like mobility, cloud, and social media expected to grow muchfaster, thereby shifting the overall spend in technology.
Exhibit 1: Worldwide technology spend
(USD bn) CY2008 CY2009 CY2010 CY2011 CY2012E CY2013E CY2014E
Worldwide services 591 566 586 605 625 651 677
Worldwide BPO 130 152 147 153 160 169 176
Worldwide software products 304 272 293 309 319 340 362
Worldwide hardware 600 563 599 747 797 841 883
Total 1,625 1,554 1,625 1,814 1,902 2,001 2,098
Source: IDC, Angel Research
Exhibit 2: Global technology spend (excluding hardware)
Source: Nasscom, Angel Research
We expect worldwide IT spending (excluding hardware) to post a three-year CAGR
of 4.4% with growth being led by emerging industry verticals such as retail, energy
& utilities and lifesciences & healthcare. Worldwide IT services spends have grown
at a CAGR of 3.4% over the past 8 years. New requirements in legal and
regulatory work, process improvement and demand for new applications are
expected to aid growth in legacy industry verticals – BFSI and manufacturing. The
telecom industry vertical is expected to remain sluggish in the near term. The year
witnessed a pronounced shift to smaller contracts while mature verticals and
segments were the growth drivers for global sourcing deals.
(3.3)
3.64.0
3.5
5.0 4.8
-4
-3
-2
-1
0
1
2
3
4
5
6
800
900
1,000
1,100
1,200
1,300
2009 2010 2011 2012E 2013E 2014E
( % )
( U S D b n )
Global technology spend % growth (yoy)
The worldwide IT spending grew by
4.8% yoy in CY2012 to US$1.9tn. In
line with growth in global IT spend, the
global sourcing market also grew toUS$124-130bn, ie a growth of 9% over
2011, which is nearly twice the growth
in global IT spend.
We expect worldwide IT spending
(excluding hardware) to post a
three-year CAGR of 4.4% while the total
sourcing market is expected to grow by
~7-8%.

7/29/2019 IT Sector Update, March 2013
http://slidepdf.com/reader/full/it-sector-update-march-2013 3/17
Sector Update | March 2013
March 20, 2013 3
Indian IT industry
The Indian IT services and BPM industry is an integral part of the global sourcing
strategy and has been increasingly contributing to the domestic economy over the
years. During FY2013, IT industry in India is estimated to aggregate revenues of
US$108bn in FY2013, with the IT software and services sector (excluding
hardware) accounting for US$95bn of revenues. Exports revenues (excluding
hardware) are estimated to be at US$75.8bn in FY2013, up 10.2% yoy, and
contributed ~80% to the total IT-BPM revenues (excluding hardware). Domestic
IT-BPM revenue (excluding hardware) is expected to grow at 2% to US$19.3bn in
FY2013. As a proportion of national GDP, the sector revenues have grown from
1.2% in FY1998 to ~8% in FY2013. For CY2013, growth for the Indian IT industry
exports has been predicted to be in the range of 12-14%.
Exhibit 3: IT-BPM – one of the highest impact sectors for India
Source: Nasscom, Angel Research
India'sIT-BPMsector
contributed~8% to
India's GDP;grew >6x inthe last 15
years
23-25%contribution
to Indianexports; grew
>6x in thelast 15 years
~7% share intotal FDI;
sector ranked4th in
contributionto total FDI
~380 crossborder
acquistionsduring
FY2008-12
directemployement
to ~3mnpeople; oneof the largestprivate sector
employers
US$3.2bnPE/VC
investments;accounts for~37% of the
totalinvestments in
India
India has emerged as the preferred
outsourcing destination; Indian IT
exports revenues (excluding hardware)
are estimated to be at US$75.8bn inFY2013, up 10.2% yoy, and contribute
~80% to the total IT-BPM revenues
(excluding hardware).

7/29/2019 IT Sector Update, March 2013
http://slidepdf.com/reader/full/it-sector-update-march-2013 4/17
Sector Update | March 2013
March 20, 2013 4
Exhibit 4: Indian IT industry revenues (domestic + export) – FY2008-13E
(USD mn) FY2008 FY2009 FY2010 FY2011 FY2012 FY2013E
Exports Domestic Exports Domestic Exports Domestic Exports Domestic Exports Domestic Exports Domestic
IT services 22,203 7,882 25,800 8,226 27,290 9,070 33,478 11,004 39,890 12,170 43,853 12,443BPO 9,915 1,576 11,699 1,932 12,401 2,304 14,172 2,791 15,915 3,068 17,848 3,087
Software prdts and ER&D 8,300 2,234 9,600 2,690 9,999 2,960 11,385 3,495 12,979 3,721 14,132 3,788
Hardware 500 10,293 395 9,006 395 9,746 395 11,732 415 12,710 415 12,882
Total 40,918 21,985 47,494 21,854 50,085 24,080 59,430 29,022 69,199 31,669 76,248 32,200
Aggregate revenues 62,903 69,348 74,165 88,452 100,868 108,448
Source: Nasscom, Angel Research
The growth rate for the Indian IT sector has moderated in the last couple of years
from 40% CAGR (FY2003-07) to ~15.9% CAGR (FY2007-13E). The key reasons
for the decline are: 1) increasing revenue base, 2) comparable offshore employeebase of MNCs such as IBM, Accenture, Capgemini, 3) weak macro-environment
over the past few years and 4) increasing commoditization of services like ADM.
MNCs vs Indian IT companies: Indian companies increasingly
capturing market share
Top IT services players globally have been increasing their market share every year
in the overall IT-BPM spending. These top companies have been gaining share by
~110bp per annum annually since the last five years. We expect this trend to
continue going forward with large IT companies taking advantage from scale of
operations, diversified presence, strong client mining skills and flexible cost
structures.
Exhibit 5: Revenue profile of large IT service players globally
(USD mn) FY2007 FY2008 FY2009 FY2010 FY2011 FY2012
IBM 48,291 54,144 58,891 55,000 56,424 60,613
Fujitsu 31,570 32,722 31,399 33,468 35,293 34,935
Accenture 21,453 25,314 23,171 23,094 27,353 29,778
HP 15,617 15,329 21,745 34,680 35,276 35,702
CSC 14,855 16,500 16,740 15,921 16,042 15,877
Capgemini 7,700 8,703 8,710 8,371 8,697 9,693
Atos 5,397 5,855 5,624 5,127 5,021 6,813
Logica 4,465 6,149 6,645 5,796 5,714 6,289
TCS 4,131 5,684 6,015 6,339 8,186 10,170
Infosys 3,090 4,178 4,663 4,804 6,041 6,994
Wipro 2,460 3,647 4,324 4,391 5,221 5,921
Cognizant 1,424 2,136 2,816 3,279 4,592 6,121
HCL Tech 1,390 1,879 2,180 2,705 3,545 4,152
Total 161,842 182,240 192,921 202,974 217,405 233,058
Share in total IT-BPM 25.2% 27.1% 26.8% 28.3% 29.7% 30.7%
Source: Company, Angel Research
The top IT services companies globally
have been gaining share by ~110bp
per annum annually since the last five
years.

7/29/2019 IT Sector Update, March 2013
http://slidepdf.com/reader/full/it-sector-update-march-2013 5/17
Sector Update | March 2013
March 20, 2013 5
While in the past two decades Indian IT had been a story of market share shift
from MNCs like IBM, HP, Capgemini, Accenture, CSC to India based outsourcers -
Infosys, TCS, Wipro, Cognizant and HCL Tech, driven by labor arbitrage. Although
the labor cost advantage has been on a declining trend, there still is a comfortable20-25% cost saving for clients along with availability of a young workforce. The
market share of top 5 Indian IT players – TCS, Infosys, Cognizant, Wipro and HCL
Tech – has been increasing since last six years in the overall IT spend from top IT
companies globally and we expect this trend to continue going forward.
Exhibit 6: Market share of top 5 Indian IT players showing a rising trend
(%) FY2007 FY2008 FY2009 FY2010 FY2011 FY2012
IBM 29.8 29.7 30.5 27.1 26.0 26.0
Fujitsu 19.5 18.0 16.3 16.5 16.2 15.0
Accenture 13.3 13.9 12.0 11.4 12.6 12.8
HP 9.6 8.4 11.3 17.1 16.2 15.3
CSC 9.2 9.1 8.7 7.8 7.4 6.8
Capgemini 4.8 4.8 4.5 4.1 4.0 4.2
Atos 3.3 3.2 2.9 2.5 2.3 2.9
Logica 2.8 3.4 3.4 2.9 2.6 2.7
MNC's market share 92.3 90.4 89.6 89.4 87.3 85.7
TCS 2.6 3.1 3.1 3.1 3.8 4.4
Infosys 1.9 2.3 2.4 2.4 2.8 3.0
Wipro 1.5 2.0 2.2 2.2 2.4 2.5
Cognizant 0.9 1.2 1.5 1.6 2.1 2.6
HCL Tech 0.9 1.0 1.1 1.3 1.6 1.8
Indian players market share 7.7 9.6 10.4 10.6 12.7 14.3 Source: Company, Angel Research
While the worldwide IT services market has posted a five year CAGR of just ~3.5%
and global sourcing market of ~9%, Indian software services revenue has grown
at a CAGR of 16%. The primary reason for the same is the benefit accruing out of
labor arbitrage, leading to cost savings for clients. Along with large players in the
global IT industry, the top-5 Indian IT companies have been increasingly gaining
market share since the last five years in overall revenue terms, in some cases
cannibalizing into the market share of global IT biggies. Indian IT is becoming
competitive in terms of services being offered to the clients globally in addition to
cost advantage.
Indian IT-BPM: Large-cap companies to continue to surpass mid-
caps in revenue market share.
Worldwide, IT services spends have grown at a CAGR of 3.4% over the past six
years. During this period, Indian IT services’ revenue market share has grown at
an average of 85bp per annum. The top-5 Indian IT services vendors have
increased their share in India’s IT exports by ~135bp per annum over the same
period. This supplements the fact that Indian large-cap players have been
surpassing mid-cap companies in terms of grabbing market share. Also, with mid-
caps facing issues such as demand pressures, limited pricing power, high clientconcentration, limited bench, limited margin levers and high revenue base, we
expect large-caps to lead in terms of revenue growth and grab incremental market
share.
Top-5 Indian IT companies have been
increasingly gaining market share since
last five years in the overall revenues
from biggies of IT services sector
globally.
During FY2007-12, Indian IT services’
revenue market share has grown at an
average of 85bp per annum. The top-5
Indian IT services vendors have
increased their share in India’s IT
exports by ~135bp per annum over the
same period; supplementing the fact
that Indian large-cap players have been
surpassing mid-cap companies in terms
of grabbing market share.

7/29/2019 IT Sector Update, March 2013
http://slidepdf.com/reader/full/it-sector-update-march-2013 6/17
Sector Update | March 2013
March 20, 2013 6
Exhibit 7: Historic market share gains
FY2007 FY2008 FY2009 FY2010 FY2011 FY2012 FY2013E
Worldwide spend (USD bn) 641 672 721 718 733 758 785
% growth yoy 4.8 7.3 (0.4) 2.0 3.4 3.6Indian IT (USD bn) 31 42 48 51 61 71 77
% growth yoy 33.8 14.6 7.2 20.3 15.6 8.7
Market share of Indian IT 4.8% 6.2% 6.6% 7.1% 8.4% 9.4% 9.8%
Market share gain (bp) 134 42 50 127 99 46
India top tier revenues (USD bn) 12 18 20 22 28 33 37
% growth yoy 40.3 14.1 7.6 28.2 20.9 11.8
Top tier as % of Indian IT 40.2 42.1 42.0 42.1 44.9 47.0 48.3
Top tier market share gain (bp) 193 (19) 18 276 206 131
Source: Company, Angel Research
Assuming the average market share gains over the past six years and 3.4% CAGR in worldwide IT services spend, the top-5 Indian IT companies are likely to grow at
~14% CAGR over the next three years.
Cognizant led the growth in Indian IT market share
Going by data on incremental market share gains over the past five years for
Indian players, we believe Cognizant has been a clear outperformer, primarily due
to its strong focus and investments in the fastest growing US market. Excluding
Cognizant, growth for the top-4 IT companies is lower by 2-3 percentage points.
Exhibit 8: Historic market share – Ex cognizant
FY2007 FY2008 FY2009 FY2010 FY2011 FY2012 FY2013 FY2007-13E
Market share - Indian IT services 4.8 6.2 6.6 7.1 8.4 9.4 9.8
Top tier as % of worldwide spends 1.9 2.6 2.8 3.0 3.8 4.4 4.7
Top tier market share in Indian IT (%) 40.2 42.1 42.0 42.1 44.9 47.0 48.3 805
Top tier market share ex-Cognizant (%) 35.6 37.0 36.1 35.7 37.4 38.3 38.8 312
Source: Company, Angel Research
India IT-BPM industry to continue to maintain its leadership
globally
Indian IT has been continuously gaining market share in the global IT spend withIndia being one of the preferred offshoring destination. The India IT-BPM industry’s
value proposition, low development costs, cheap skilled workforce and competitive
billing has supported the country to emerge as one of the key outsourcing
destinations.
The IT-BPM industry is at an inflexion point – it has evolved dramatically over the
last decade in terms of scale and complexity, key service offerings and the value it
provide to its customers – from a legacy service-based solution provider to
strategic partner providing end-to end services. Globally, India has been accepted
as one of the dominating forces in the IT-BPM market, growing at a CAGR of 25%
during FY2000-13, which is four times higher than the global IT-BPM spend duringthe same period (Source: Nasscom). This was achieved through an India-centric
FTE-based delivery model relying primarily on cost arbitrage, tapping labor pool
from major Indian cities and offering application development and maintenance
The Indian IT-BPM industry’s value proposition, low development costs,
cheap skilled workforce and
competitive billing have supported in
the country emerging as one of the
key outsourcing destinations.
7/29/2019 IT Sector Update, March 2013
http://slidepdf.com/reader/full/it-sector-update-march-2013 7/17
Sector Update | March 2013
March 20, 2013 7
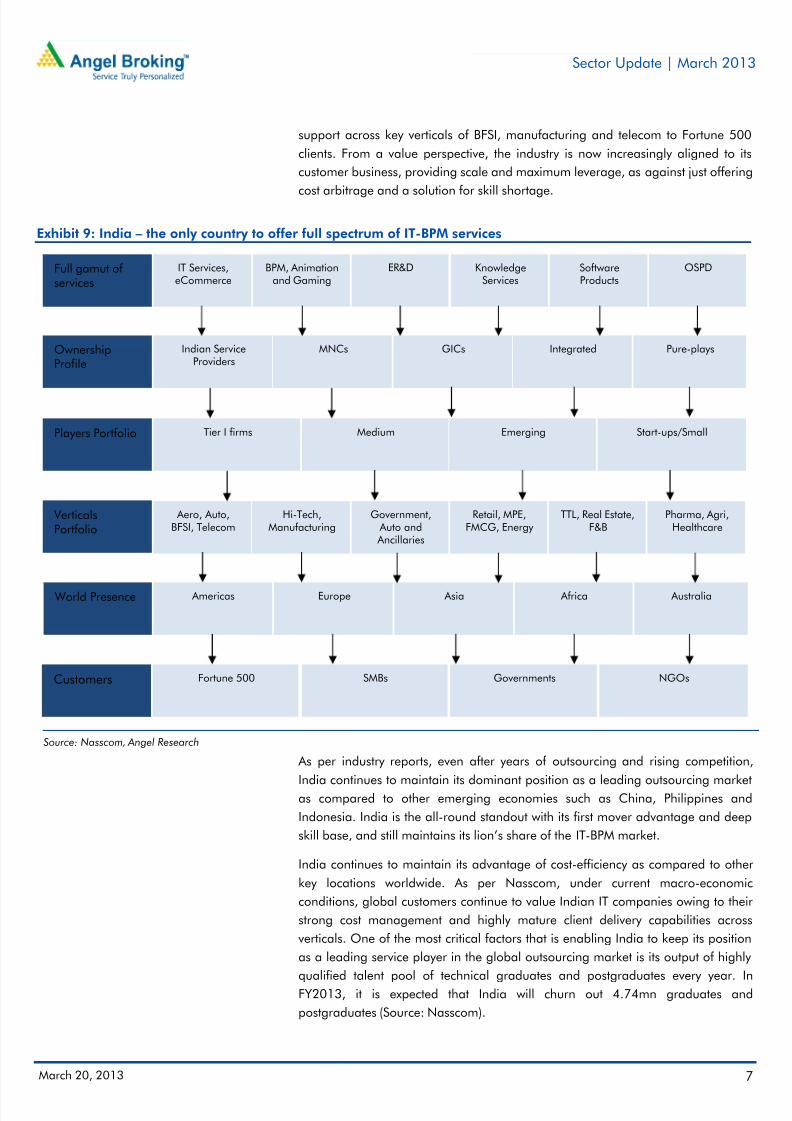
support across key verticals of BFSI, manufacturing and telecom to Fortune 500
clients. From a value perspective, the industry is now increasingly aligned to its
customer business, providing scale and maximum leverage, as against just offering
cost arbitrage and a solution for skill shortage.
Exhibit 9: India – the only country to offer full spectrum of IT-BPM services
Source: Nasscom, Angel Research
As per industry reports, even after years of outsourcing and rising competition,
India continues to maintain its dominant position as a leading outsourcing marketas compared to other emerging economies such as China, Philippines and
Indonesia. India is the all-round standout with its first mover advantage and deep
skill base, and still maintains its lion’s share of the IT-BPM market.
India continues to maintain its advantage of cost-efficiency as compared to other
key locations worldwide. As per Nasscom, under current macro-economic
conditions, global customers continue to value Indian IT companies owing to their
strong cost management and highly mature client delivery capabilities across
verticals. One of the most critical factors that is enabling India to keep its position
as a leading service player in the global outsourcing market is its output of highly
qualified talent pool of technical graduates and postgraduates every year. InFY2013, it is expected that India will churn out 4.74mn graduates and
postgraduates (Source: Nasscom).
Full gamut ofservices
IT Services,eCommerce
BPM, Animationand Gaming
ER&D KnowledgeServices
SoftwareProducts
OSPD
OwnershipProfile
Indian ServiceProviders
MNCs IntegratedGICs Pure-plays
Players Portfolio Tier I firms Medium Emerging Start-ups/Small
VerticalsPortfolio
Aero, Auto,BFSI, Telecom
Government, Auto and Ancillaries
Hi-Tech,Manufacturing
Retail, MPE,FMCG, Energy
TTL, Real Estate,F&B
Pharma, Agri,Healthcare
World Presence Americas Europe Asia Africa Australia
Customers Fortune 500 SMBs Governments NGOs

7/29/2019 IT Sector Update, March 2013
http://slidepdf.com/reader/full/it-sector-update-march-2013 8/17
Sector Update | March 2013
March 20, 2013 8
Exhibit 10: Indian IT maintaining cost competitiveness
Source: Everest Research, Nasscom, Angel Research
Offshore employee base of MNCs now comparable to Indian vendors
IBM last reported its India headcount at 74,000 in its 2007 annual report. As per
media reports, IBM currently has an employee headcount of ~130,000 (more than
one-third of its employee base) in India. From less than 10,000 people in 2002,
IBM’s India operations now account for nearly US$3bn in revenue including the
business it earns from serving local customers. IBM along with Accenture has come
a long way since its IT outsourcing business was challenged by rising Indian rivals -
Infosys and TCS - in the late 1990s. Back then, Indian tech firms offered to deliver
software projects at rates that were one-fourth of that in the US. Both IBMand Accenture have been hiring hundreds of thousands of software engineers
since then in order to compete better. Accenture also currently has got ~110,000
employees in India. Offshore delivery led growth, which was a disruptive force over
2000-2005, is no longer a big differentiator. So India continues to remain one of
the biggest destinations for offshoring of IT services.
Industry vertical wise growth: New verticals to surpassgrowth in matured verticals aided by lower base
In line with the past trend, BFSI and manufacturing industry verticals have
remained two of the largest verticals in terms of total share in IT spending, with
more than ~42% share. Emerging verticals such as retail, healthcare, lifesciences
and utilities have contributed ~30% to the total spend in 2012. As per Nasscom,
growth during CY2012 was driven by emerging industry verticals such as retail,
healthcare and utilities, growing at a consolidated 12%, even as the traditional
industry verticals BFSI and manufacturing recorded just an industry average growth
rate. We expect this trend to continue going ahead as well.
10
30
50
70
90
110
S i n g a p o r e
P r a g u e
M o n t e r r e y
K u a l a L u m p u r
B e i j i n g
B a n g k o k
B u e n o s A i r e s
M e t r o M a n i l a
B e n g a l u r u
P u n e
( U S D ' 0 0 0 )
Operating cost per FTE per annum for IT services: ADM 2012
Going ahead, we expect growth to be
driven by emerging industry verticals
such as retail, healthcare and utilities,
even as the traditional industry verticalsBFSI and manufacturing record industry
average growth rates.
79-81
57.5-59.5
49.5-51.542-44
79-81
57.5-59.5
79-81
38-4031-33 30-32 25-27
21-23 19-21
49.5-51.542-44
57.5-59.5
79-81

7/29/2019 IT Sector Update, March 2013
http://slidepdf.com/reader/full/it-sector-update-march-2013 9/17
Sector Update | March 2013
March 20, 2013 9
BFSI - Matured vertical, growth driven by market share churn
The BFSI vertical has been one of the earliest adaptors to technology due to high
volume of transactions involved, which required more and more applications and
systems for improving customer experiences and increased efficiencies. The BFSI
industry is the most mature in terms of offshoring and IT has permeated across
most of the BFSI value chain. This industry accounts for the largest share of more
than 41% of Indian IT-BPO exports. Going forward, technology services spending
in the BFSI segment will be driven by the key imperatives of integration,
optimization and regulation (Basel III, Dot France etc.) and increasing shift of BPO
business on platforms. Key areas of investment in this industry segment include
customer service solutions through cloud, smarter analytics, business intelligence,
m-commerce, cloud computing and virtualization. In this scenario, IT services
providers in India have a huge opportunity, with potential to upsell, upgrade,
customize and take advantage of the limited internal expertise within theseorganizations. Worldwide spend in the BFSI vertical is expected to post a three-year
CAGR of 3.1%. India's domestic IT spends are valued at US$30.4bn, out of which
the BFSI sector contributes 11.1%; the sector is fast growing in terms of IT
investment. Domestic firms made the maximum investment in hardware products,
with 53% spend set aside for this category, followed by IT services at 32% and
software at 15%.
Manufacturing - Matured vertical, limited churn in market share
Likewise to BFSI, the manufacturing industry vertical has also been one of the large
contributor to worldwide IT spend. The manufacturing industry segment has seenincreased uptake of outsourcing last year, resulting its share having shot up from
16.0% in 2011 to 16.6% in 2012. While large and medium organizations have
been adopting IT to optimize their supply chain management, inventory control
systems, and product/process management among others; smaller players have
been adopting it currently to meet compliance requirements, improving quality of
their products, aligning to new business developments and for better business flow.
Major drivers of growth within the manufacturing vertical are auto, chemical
products, metals and food & beverages. IT spend in the manufacturing industry is
driven by the needs of staying ahead of competition, better customer satisfaction,
informed decision making, globalization and better control of mobile employees.
Worldwide spend in the manufacturing vertical is expected to post a three year
CAGR of 4.4%. Manufacturing is the biggest spender on IT-BPO products and
services in India. This industry segment contributes ~30% to the total domestic IT-
BPO market spending. A majority of the spend is focused around IT services with
significant focus on system integration, custom application development and
hardware/software maintenance. Traditionally manufacturing organizations have
been very low on outsourcing of IT business activities but this phenomenon is
changing fast.
Going forward, technology services
spending in the BFSI segment will be
driven by the key imperatives of
integration, optimization and
regulation. Worldwide spend in BFSI
vertical is expected to post a three-year
CAGR of 3.1%.
The BFSI industry is the most mature in
terms of offshoring and IT has
permeated across most of the BFSI
value chain. This industry accounts for
the largest share of more than 41% of
Indian IT-BPO exports.
Worldwide IT spend in the
manufacturing vertical is expected to
post a three year CAGR of 4.4%.
The manufacturing industry is also one
of the mature industries in terms of
offshoring. Major drivers of growth
within the manufacturing vertical are
auto, chemical products, metals and
food & beverages.

7/29/2019 IT Sector Update, March 2013
http://slidepdf.com/reader/full/it-sector-update-march-2013 10/17
Sector Update | March 2013
March 20, 2013 10
Telecom and Media - Laggards in growth due to worsening
financials
The telecom industry segment has been struggling since recession in FY2009-10
due to focus of US and European firms on expanding in faster growing economies
such as India and China, which resulted in reallocation of budgets in these
geographies. The second reason has been that most of the telecom infrastructure
in developed markets has already been built which has resulted in a shift from
capex model to opex model and hence most work now being outsourced is in the
maintenance space rather than high value development space. IT spend from
telecom equipment manufacturer companies has been sluggish although there are
some signs of improvement seen in spending from telecom services provider
companies with 3G and 4G launches happening in many economies. As a result,
the share of telecom in IT-BPO exports has declined slightly. Mobility remains the
biggest growth opportunity for key players in telecom. While the telecom space hasbeen facing a tough time, the media vertical on the other hand has picked up well
due to increased digitization. Social media is seen as a new marketing tool as the
platform directly offers access to more than millions of connections, thereby
enabling firms to reach their end-customers in almost no time. Social media trends
are also enabling forms to respond to market changes faster and tailor their
products/services to end user demands. Worldwide IT spend in the telecom
industry segment is expected to post a three-year CAGR of 4%.
While matured verticals like BFSI, telecom and manufacturing had been major
contributors to worldwide IT spends (~US$752bn in FY2013), upcoming verticals
like retail, healthcare, travel and utilities; in spite of being one-third of matured
verticals size (~US$301bn in FY2013); have started showing more traction.
Primary reason for the same has been late adoption of technology and data
analytics.
Retail - New technology ties together online and offline stores
In the retail industry segment, online sales, online platforms, and m-commerce are
driving requirement to develop smart applications which can throw useful insights
into customer behavior and patterns. Retail is one of the key emerging industry
segments where the growth is driven by mobility and analytics. Currently, retail
industry is a hybrid model of online and brick-and mortar; however, rapidadvancements in internet and mobile technologies are driving growth of online
retail. Other factors driving this growth include 24x7 convenience, improved
broadband access, web-enabled services, broad selection of online products that
enable comparison of price and features and online payment gateways. Retailers
are looking to technology to enhance customer experience, drive customer loyalty,
reduce costs, enable more efficient inventor/space/human resource management
and manage global supply chains in order to differentiate and stay competitive.
Indian IT firms have been developing domain capabilities across the entire
spectrum of retail value, chain-marketing, merchandising, supplier collaboration,
warehouse and store management. Worldwide IT spend in retail industry segment
is expected to post a three year CAGR of 5.6%.
Telecom industry has been struggling
since recession in FY2009-10, reason
being that most of the telecom
infrastructure in developed markets hasalready been built which has resulted in
a shift from capex to opex model and
hence most work outsourced is in the
maintenance space.
Retail is one of the key emerging
industry segments. In the retail industry
segment, online sales, online platforms,
and m-commerce are driving the need
to develop smart applications.
Worldwide IT spend in retail industry is
expected to post a three year CAGR of
5.6%.

7/29/2019 IT Sector Update, March 2013
http://slidepdf.com/reader/full/it-sector-update-march-2013 11/17
Sector Update | March 2013
March 20, 2013 11
Healthcare - Huge addressable market
In healthcare, data analytics has started playing a key role with significant increase
in clinical trials and processing of patient responses. This industry is one of the
potential adopters but is still on the maturity curve and is working towards
standardization of internal processes. Much of the growth in healthcare spending
is expected to come from spending on Electronic Health Record (EHR) systems,
mobile health applications and efforts to comply with new government standards.
In the US, most of the spending can be attributed to the Healthcare Reform Act, the
new ICD-10 coding system, and adoption of EHR systems, which will be mandated
by 2015. The technological advancements and keen interest of consumers in the
benefits of mobile health technology will be the main drivers for increase in
healthcare-related IT spending. Worldwide spend in this industry segment is
expected to post a three year CAGR of 7.0%.
Travel and Utilities - Huge addressable market to tap
In these industry segments, volume of data thrown out for processing and
converting into information has been growing at an exponential pace. Utilities’ IT
investments will continue to be driven by smart metering roll outs, operational
excellence, cost reductions and need to comply with energy policies and
regulation. We expect worldwide spend in travel and utilities industry segment to
post three year CAGR of 5.7% and 6.7%, respectively.
Exhibit 11: Worldwide industry vertical wise spend – emerging verticals to lead the growth
(USD bn) 2009 2010 2011 2012 2013 2014 2015 3 year CAGR (%)
BFSI 221 225 236 247 254 263 271 3.1%
Manufacturing 238 245 259 273 283 296 310 4.4%
Retail 110 112 118 123 129 135 145 5.6%
Healthcare 46 49 53 56 60 64 69 7.0%
Transportation 37 38 40 42 44 47 50 5.7%
Communications and media 178 184 196 204 215 222 230 4.0%
Utilities and Construction 56 58 61 64 68 73 78 6.7%
Services 98 101 107 113 118 124 131 5.0%
Government 170 175 186 196 207 218 229 5.3%
Others 248 268 294 320 322 326 327 0.7%
Total 1,402 1,456 1,552 1,640 1,701 1,769 1,840 3.9%
Source: IDC, Angel Research
In healthcare, data analytics has
started playing a key role with
significant increase in clinical trials and
processing of patient responses.Worldwide IT spend in this industry
segment is expected to post a three
year CAGR of 7.0%.

7/29/2019 IT Sector Update, March 2013
http://slidepdf.com/reader/full/it-sector-update-march-2013 12/17
Sector Update | March 2013
March 20, 2013 12
Exhibit 12: Industry-wise revenue growth of tier-I Indian IT players
BFSI growth (%) FY2007 FY2008 FY2009 FY2010 FY2011 FY2012
TCS 45.0 42.2 2.7 10.9 28.6 20.9
Infosys 49.2 29.0 6.0 3.3 32.6 13.3HCL Tech 76.7 43.4 6.3 23.4 30.4 12.6
Wipro 47.2 59.0 26.8 1.5 23.0 13.4
Manufacturing growth (%)
TCS 25.0 14.3 41.7 (15.7) 16.8 38.4
Infosys 23.4 29.3 12.7 2.4 (6.2) 6.3
HCL Tech 35.8 20.6 8.9 34.2 23.9
Wipro 25.6 4.7 20.7 6.2
Telecom growth (%)
TCS 67.5 40.9 (12.4) (10.7) 28.1 7.8
Infosys 69.5 51.3 (6.5) (8.4) 0.8 (8.5)
HCL Tech 0.5 37.0 7.6 2.0 11.8 (3.3)
Wipro 26.6 (14.3) 8.3 (1.8) 16.2 4.7
Retail growth (%)
TCS 53.4 49.3 41.6 23.8 17.4 37.8
Infosys 40.9 59.5 19.2 8.7 34.3 28.0
HCL Tech 31.3 45.8 17.9
Wipro 89.0 30.0 (10.4) 22.1 10.5
Energy and utilities growth (%)
TCS 36.0 54.9 9.7 12.9 80.8 18.3
Infosys 61.0 32.6 22.3 6.6 30.0 4.4
HCL Tech 157.1 39.1 12.1
Wipro 27.5 42.5 8.0 12.7 24.1 57.6
Source: Company, Angel Research
APAC and EMEA to bolster growth going forward
During 2012, IT spend from Asia Pacific (APAC) region grew by 6%, nearly 1.6x
faster than mature geographies. IT spend from America remained steady at 5%
and Europe, Middle East and Africa (EMEA) recorded a minimal growth of just 1%
yoy since 2011. In terms of regional contracts, APAC was the sole market in 2012
to have registered significant growth of ~55% (value terms) and increased its
share in total contract value to 15%. EMEA contracts declined by 13% while those
of the Americas declined by ~2.5%. Along with APAC, EMEA (2011 IT spend of
US$258bn) provides significant opportunity for front on IT players as factors like
global companies wanting to expand footprints in these geographies, cost cutting
initiatives and demand for robust systems present huge opportunities. The
penetration levels in these geographies currently are very low. In addition, as theEuropean market is becoming more amenable to offshoring, growth in this
geography is expected to firm up further.

7/29/2019 IT Sector Update, March 2013
http://slidepdf.com/reader/full/it-sector-update-march-2013 13/17
Sector Update | March 2013
March 20, 2013 13
Exhibit 13: Geography-wise revenue growth of tier-I Indian IT players
Growth from US (%) FY2007 FY2008 FY2009 FY2010 FY2011 FY2012
TCS 38.5 35.0 7.9 7.8 29.1 21.9
Infosys 40.3 32.4 13.8 7.3 24.8 13.3HCL Tech 29.8 34.2 23.1 24.5 23.3 19.6
Wipro 33.6 37.5 19.3 (1.8) 13.6 7.3
Growth from Europe (%)
TCS 67.0 40.1 7.6 (4.6) 20.0 25.2
Infosys 54.5 43.9 4.9 (10.2) 17.5 17.9
HCL Tech 73.0 35.7 9.4 20.6 29.2 18.8
Wipro 38.5 32.5 13.0 0.8 23.0 18.4
Source: Company, Angel Research
SAMC – Social, Analytics, Mobility and Cloud – emergingtechnologies which could reshape the future of IT-BPMindustry
As per industry sources and commentary from Managements of various IT
companies, consumerism and the ubiquity of connected smart devices have led to
convergence of four forces: social, mobile, cloud and analytics.
Social analytics brings together elements of segmentation, targeting, predictive
marketing and effective customer relationships to translate into a revenue
mechanism that affects profitability of business. Enterprise mobility helpsenterprises meet strategic imperatives, improve operational efficiencies, real-time
connectivity across functions and create engaging customer experiences. Cloud
envisages virtualization, elastics selling, service automation and immense cost
improvement through dynamic abstraction of IT services. Big data offers a unique
suite of advanced analytics for better intelligence and derive meaningful insights
from customer data to increase sales, better target customers, improve reach and
gain competitive advantage. As per IDC, Indian IT vendors are expected to
generate more than US$225bn from SMAC related revenue by 2020. SMAC has
reoriented the business model of traditional IT firms by shifting focus from cutting
costs and managing IT infrastructure to a move towards creative solutions that help
clients’ businesses grow.
As per Gartner, enterprise mobility market is expected to reach ~US$140bn by
2020, a CAGR of ~15%. Global market of big data is expected to grow by 45%
annually to reach ~US$25bn in 2015 while global market of cloud is expected to
reach US$650-700bn by 2020. (Source: Nasscom). International Data
Corporation (IDC) predicts that 2013 will be a year of big jumps in SME
businesses’ cloud use.
s per IDC, Indian IT vendors are
expected to generate more than
US$225bn from SMAC related revenue
by 2020.

7/29/2019 IT Sector Update, March 2013
http://slidepdf.com/reader/full/it-sector-update-march-2013 14/17
Sector Update | March 2013
March 20, 2013 14
Outlook
India has retained its position as a leading global shoring destination with a
50-55% share in global sourcing market and has been able to maintain and inch
up its share despite challenges. With customers increasingly engaging with Indian
service providers as a strategic partner rather than just a technology service
provider, key players of the Indian software industry have capitalized on areas
such as continued focus on cost-efficiency, scalable environment, availability of
human capital and customer centric approach.
We continue to remain positive on the overall Indian IT sector, especially on
large- cap companies. The global economy is set to improve going ahead with
global GDP predicted to grow by 3.5% in CY2013 and 4.1% in CY2014.
Emerging geographies are coming up in a big way as important trade
destinations. Nasscom suggests that five major technology changes are expected
to open new opportunities for service providers – smart computing, software-as-a-
service, social technologies, mobility and analytics. These factors are expected to
drive growth in overall technology spend by ~6% in 2013. Global sourcing is set
to grow faster at ~7-8% during 2013 and 2014.
India continues to be the global sourcing leader, but the total global IT-BPM
sourcing market of US$124-130bn accounts for only ~10% of the global IT-BPM
spend, which implies that the market is huge and presents immense untapped
opportunities. Indian IT-BPM firms are well set to take advantage from these trends
by working towards developing new capabilities, servicing the entire IT services
value chain and expanding their focus to new geographies, technologies and
industry verticals. Indian IT companies are investing into building platforms to drive
further growth opportunities. These domain solutions and technology platforms will
offer improved revenue leverage vs talent employed in the industry. Nasscom
indicated that FY2014 total revenues from India (domestic + exports, excluding
hardware) are expected to grow by ~13-15% to reach US$106-111bn and out of
this, exports are likely to be in the range of US$84-87bn, ie a growth of 12-14%
yoy. Gartner has recently indicated an optimistic outlook and has increased IT
spending growth forecast for CY2013 to 4.2%, up from the prior forecast of 3.8%,
mentioning that uncertainty around the globe is coming to end and the same is
likely to lead to an increase in IT spending. In addition, IDC also predicts
worldwide IT spending to exceed US$2.1tr, up 5.7% yoy in CY2013.
We expect tier-I companies to lead growth during FY2014 with volume growth to
be 10%+. In terms of mid-cap IT companies, we expect challenges to persist due
to factors such as high client concentration, demand pressures, restricted pricing
power, limited margin levers, and limited bench sizes.
Global IT-BPM spend is expected to
grow in the range of 5-6% over the next
two years and global sourcing is set to
grow faster at ~7-8% during 2013 and
2014.
India continues to be the global
sourcing leader, but it accounts for only
~10% of the total global IT-BPM spend
of US$124-130bn, which implies that
the market is huge and presents
immense untapped opportunity
We expect tier-I companies to lead the
growth going ahead.
7/29/2019 IT Sector Update, March 2013
http://slidepdf.com/reader/full/it-sector-update-march-2013 15/17
Sector Update | March 2013
March 20, 2013 15
Valuation
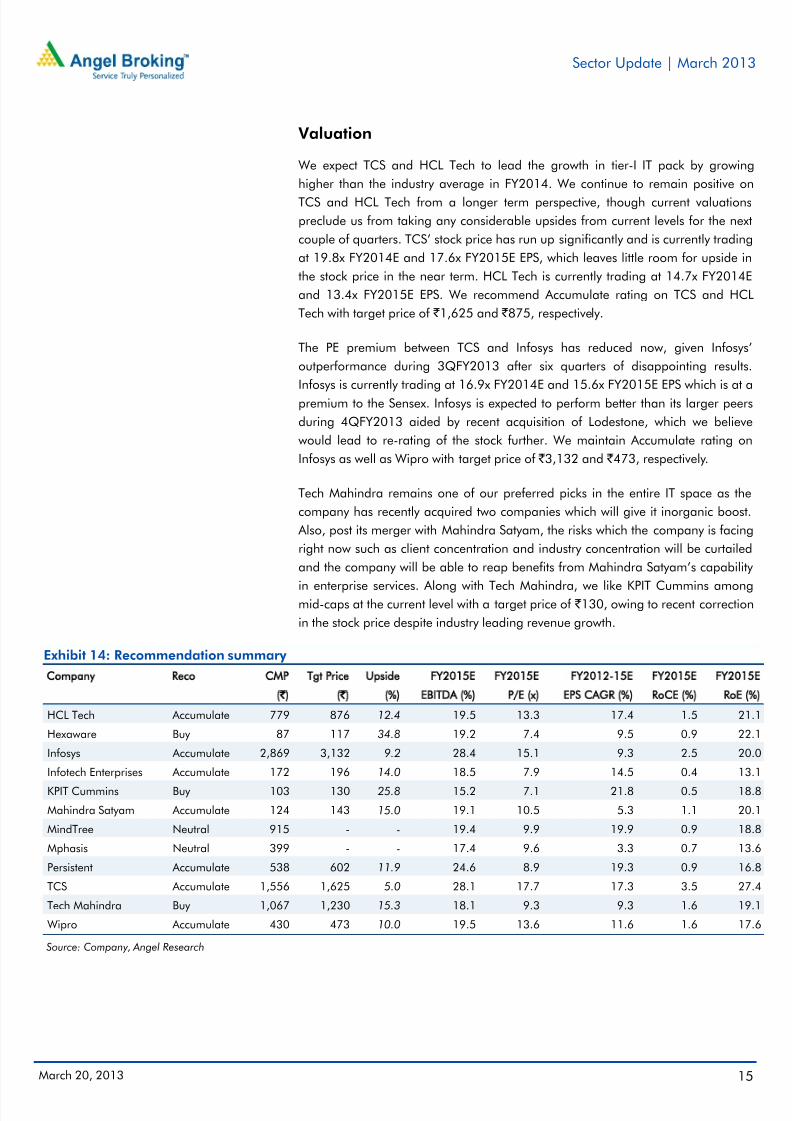
We expect TCS and HCL Tech to lead the growth in tier-I IT pack by growing
higher than the industry average in FY2014. We continue to remain positive on
TCS and HCL Tech from a longer term perspective, though current valuations
preclude us from taking any considerable upsides from current levels for the next
couple of quarters. TCS’ stock price has run up significantly and is currently trading
at 19.8x FY2014E and 17.6x FY2015E EPS, which leaves little room for upside in
the stock price in the near term. HCL Tech is currently trading at 14.7x FY2014E
and 13.4x FY2015E EPS. We recommend Accumulate rating on TCS and HCL
Tech with target price of ` 1,625 and ` 875, respectively.
The PE premium between TCS and Infosys has reduced now, given Infosys’
outperformance during 3QFY2013 after six quarters of disappointing results.
Infosys is currently trading at 16.9x FY2014E and 15.6x FY2015E EPS which is at a
premium to the Sensex. Infosys is expected to perform better than its larger peers
during 4QFY2013 aided by recent acquisition of Lodestone, which we believe
would lead to re-rating of the stock further. We maintain Accumulate rating on
Infosys as well as Wipro with target price of ` 3,132 and ` 473, respectively.
Tech Mahindra remains one of our preferred picks in the entire IT space as the
company has recently acquired two companies which will give it inorganic boost.
Also, post its merger with Mahindra Satyam, the risks which the company is facing
right now such as client concentration and industry concentration will be curtailed
and the company will be able to reap benefits from Mahindra Satyam’s capability
in enterprise services. Along with Tech Mahindra, we like KPIT Cummins amongmid-caps at the current level with a target price of ` 130, owing to recent correction
in the stock price despite industry leading revenue growth.
Exhibit 14: Recommendation summary
Company Reco CMP Tgt Price Upside FY2015E FY2015E FY2012-15E FY2015E FY2015E
(`) (`) (%) EBITDA (%) P/E (x) EPS CAGR (%) RoCE (%) RoE (%)
HCL Tech Accumulate 779 876 12.4 19.5 13.3 17.4 1.5 21.1
Hexaware Buy 87 117 34.8 19.2 7.4 9.5 0.9 22.1
Infosys Accumulate 2,869 3,132 9.2 28.4 15.1 9.3 2.5 20.0
Infotech Enterprises Accumulate 172 196 14.0 18.5 7.9 14.5 0.4 13.1
KPIT Cummins Buy 103 130 25.8 15.2 7.1 21.8 0.5 18.8
Mahindra Satyam Accumulate 124 143 15.0 19.1 10.5 5.3 1.1 20.1
MindTree Neutral 915 - - 19.4 9.9 19.9 0.9 18.8
Mphasis Neutral 399 - - 17.4 9.6 3.3 0.7 13.6
Persistent Accumulate 538 602 11.9 24.6 8.9 19.3 0.9 16.8
TCS Accumulate 1,556 1,625 5.0 28.1 17.7 17.3 3.5 27.4
Tech Mahindra Buy 1,067 1,230 15.3 18.1 9.3 9.3 1.6 19.1
Wipro Accumulate 430 473 10.0 19.5 13.6 11.6 1.6 17.6
Source: Company, Angel Research

7/29/2019 IT Sector Update, March 2013
http://slidepdf.com/reader/full/it-sector-update-march-2013 16/17
Sector Update | March 2013
March 20, 2013 16
Research Team Tel: 022 - 39357800 E-mail: [email protected] Website: www.angelbroking.com
DISCLAIMER
This document is solely for the personal information of the recipient, and must not be singularly used as the basis of any investment
decision. Nothing in this document should be construed as investment or financial advice. Each recipient of this document should make
such investigations as they deem necessary to arrive at an independent evaluation of an investment in the securities of the companies
referred to in this document (including the merits and risks involved), and should consult their own advisors to determine the merits and
risks of such an investment.
Angel Broking Limited, its affiliates, directors, its proprietary trading and investment businesses may, from time to time, make
investment decisions that are inconsistent with or contradictory to the recommendations expressed herein. The views contained in this
document are those of the analyst, and the company may or may not subscribe to all the views expressed within.
Reports based on technical and derivative analysis center on studying charts of a stock's price movement, outstanding positions and
trading volume, as opposed to focusing on a company's fundamentals and, as such, may not match with a report on a company's
fundamentals.
The information in this document has been printed on the basis of publicly available information, internal data and other reliable
sources believed to be true, but we do not represent that it is accurate or complete and it should not be relied on as such, as thisdocument is for general guidance only. Angel Broking Limited or any of its affiliates/ group companies shall not be in any way responsible for any loss or damage that may arise to any person from any inadvertent error in the information contained in this report .
Angel Broking Limited has not independently verified all the information contained within this document. Accordingly, we cannot testify,nor make any representation or warranty, express or implied, to the accuracy, contents or data contained within this document. While Angel Broking Limited endeavours to update on a reasonable basis the information discussed in this material, there may be regulatory,compliance, or other reasons that prevent us from doing so.
This document is being supplied to you solely for your information, and its contents, information or data may not be reproduced,
redistributed or passed on, directly or indirectly.
Angel Broking Limited and its affiliates may seek to provide or have engaged in providing corporate finance, investment banking or
other advisory services in a merger or specific transaction to the companies referred to in this report, as on the date of this report or in
the past.
Neither Angel Broking Limited, nor its directors, employees or affiliates shall be liable for any loss or damage that may arise from or inconnection with the use of this information.
Note: Please refer to the important `Stock Holding Disclosure' report on the Angel website (Research Section). Also, please refer to thelatest update on respective stocks for the disclosure status in respect of those stocks. Angel Broking Limited and its affiliates may haveinvestment positions in the stocks recommended in this report.
Disclosure of Interest Statement
Analyst ownership Angel and its Group companies Angel and its Group companies' Broking relationship
of the stock ownership of the stock Directors ownership of the stock with company covered
HCL Tech No No No No
Hexaware No No No No
Infosys No No No NoInfotech Enterprises No No No No
KPIT Cummins No No No No
Mahindra Satyam No No No No
MindTree No No No No
MphasiS No No No No
Persistent No No No No
TCS No No No No
Tech Mahindra No No No No
Wipro No No No No
Ratings (Returns): Buy (> 15%) Accumulate (5% to 15%) Neutral (-5 to 5%)Reduce (-5% to -15%) Sell (< -15%)
Note: We have not considered any Exposure below ` 1 lakh for Angel, its Group companies and Directors

7/29/2019 IT Sector Update, March 2013
http://slidepdf.com/reader/full/it-sector-update-march-2013 17/17
Sector Update | March 2013
6th Floor, Ackruti Star, Central Road, MIDC, Andheri (E), Mumbai- 400 093. Tel: (022) 39357800
Research Team
Fundamental:Sarabjit Kour Nangra VP-Research, Pharmaceutical [email protected]
Vaibhav Agrawal VP-Research, Banking [email protected]
Bhavesh Chauhan Sr. Analyst (Metals & Mining) [email protected]
Viral Shah Sr. Analyst (Infrastructure) [email protected]
Sharan Lillaney Analyst (Mid-cap) [email protected]
V Srinivasan Analyst (Cement, FMCG) [email protected]
Yaresh Kothari Analyst (Automobile) [email protected]
Ankita Somani Analyst (IT, Telecom) [email protected]
Sourabh Taparia Analyst (Banking) [email protected]
Bhupali Gursale Economist [email protected]
Vinay Rachh Research Associate [email protected]
Amit Patil Research Associate [email protected]
Shareen Batatawala Research Associate [email protected]
Twinkle Gosar Research Associate [email protected]
Tejashwini Kumari Research Associate [email protected]
Technicals:
Shardul Kulkarni Sr. Technical Analyst [email protected]
Sameet Chavan Technical Analyst [email protected]
Sacchitanand Uttekar Technical Analyst [email protected]
Derivatives:
Siddarth Bhamre Head - Derivatives [email protected]
Institutional Sales Team:
Mayuresh Joshi VP - Institutional Sales [email protected]
Hiten Sampat Sr. A.V.P- Institution sales [email protected]
Meenakshi Chavan Dealer [email protected]
Gaurang Tisani Dealer [email protected]
Akshay Shah Sr. Executive [email protected]
Production Team:
Tejas Vahalia Research Editor [email protected]
Dilip Patel Production Incharge [email protected]
`
CSO & Registered Office: G-1, Ackruti Trade Centre, Road No. 7, MIDC, Andheri (E), Mumbai - 93. Tel: (022) 3083 7700. Angel Broking Pvt. Ltd: BSE Cash: INB010996539 / BSE F&O: INF010996539, CDSL Regn. No.: IN - DP - CDSL - 234 – 2004, PMS Regn. Code: PM/INP000001546, NSE Cash: INB231279838 /NSE F&O: INF231279838 / NSE Currency: INE231279838, MCX Stock Exchange Ltd: INE261279838 / Member ID: 10500. Angel Commodities Broking (P) Ltd.: MCX Member ID: 12685 / FMC Regn. No.: MCX / TCM / CORP / 0037 NCDEX: Member ID 00220 / FMC Regn. No.: NCDEX / TCM / CORP / 0302.