sector update - media
TRANSCRIPT

8/8/2019 Sector Update - Media
http://slidepdf.com/reader/full/sector-update-media 1/16
Please refer to important disclosures/disclaimers in Appendix A
Overweight
Ankit [email protected]+ 91 22 42159634
Media shines
The media sector reported better-than-expected resultsin FY10. Robust revenue growth and strong marginexpansion resulted in the profitability of somecompanies almost doubling. Others consolidated theiroperations in the financial year. We maintain ourOverweight stance on the sector, and preferbroadcasters to print media.
FMCG advertisers to drive broadcasters’ revenue: Sustained high advertising and promotion expensesby FMCG companies would mainly benefitbroadcasting companies. FMCG accounts for morethan 55% of spending on television.
Consolidation – the mantra in FY10: FY10 was theyear of consolidation for the media industry. Forinstance, the Zee group consolidated its generalentertainment channels (GECs) under ZeeEntertainment. TV Today and DB Corp consolidatedtheir radio businesses and HT Media de-merged itsHindi daily for an IPO.
High dividend payout: Companies paid higher-than-expected or in-line dividends through special orinterim dividends during the year. Broadcastingcompanies have increased the dividend payout ratio,
while print companies have slightly reduced the same.
Prefer broadcasters to print players: Weprefer broadcasters to print companies, consideringthat ad revenue growth for broadcasters is expected tobe over 15%. DTH subscription revenues are expectedto increase. With carriage and placement costsremaining flat and programming expenses undercontrol, we expect margins to expand.
Top picks and top sells: We maintain our Overweightrating on the sector. We have a Buy on Sun TVNetwork, Zee Entertainment and Jagran Prakashan;
Hold on ENIL, HT Media and Info Edge; and Sell onBalaji Telefilms.
Key Performance (%)
1M 6M 1Yr
Balaji Telefilms 12.3 (4.0) (1.6)
Deccan Chronicle 1.2 (21.6) 69.3
ENIL 18.8 22.9 38.7
HT Media 1.8 8.1 61.6
IBN1 8 4.0 (6.7) (13.3)
Info Edge (7.0) 10.9 41.3
Jagran Prakashan 15.5 (2.4) 53.7
NDTV 5.2 (26.0) (22.1)
Sun TV (1.1) 21.0 70.0
T V Today Network (6.9) (21.0) 4.4
Television 18 India 20.5 10.2 (20.5)
Zee Entertainment 1.2 9.7 80.1
Zee News 1.5 (77.3) (66.4)
NIFTY 7.8 6.6 25.5
Source: Bloomberg, Centrum Research* as on 22 June 2010
One Year Stock performance
50
100
150
200
J u n - 0 9
J u l - 0 9
A u g - 0 9
S e p - 0 9
O c t - 0 9
N o v - 0 9
D e c - 0 9
J a n - 1 0
F e b - 1 0
M a r - 1 0
A p r - 1 0
M a y - 1 0
J u n - 1 0
Se nse x b al aj i te le fi lms Ente rtai nme nt
HT Media Info Edge Jagran
SU N TV Zee Ente rtai nme nt
Source: Bloomberg, Centrum Research
PE (x) EV/EBIDTA (x) RoE (%) RoCE (%)Company Name Rating
TargetPrice (Rs)
Upside(%)
M-cap(Rsbn) FY11E FY12E FY11E FY12E FY11E FY12E FY11E FY12E
Sun TV Network BUY 485 17 158.6 22.9 19.9 10.9 9.2 32.8 30.4 30.5 28.7
ZEEL BUY 347 20 141.7 22.9 20.1 15.8 13.3 14.1 14.2 11.9 12.1
Jagran Prakashan BUY 143 14 37.5 18.6 15.8 11.2 9.3 29.3 29.5 26.3 26.7
HT Media HOLD 166 10 34.9 18.7 16.2 9.6 8.2 16.3 16.0 13.0 13.7
Info Edge HOLD 937 9 23.4 30.5 24.8 21.5 15.9 18.3 19.0 13.1 14.1
ENIL HOLD 220 (7) 11.2 145.0 33.7 20.1 12.7 0.6 8.0 1.9 9.7
Balaji Telefilms SELL 49 (11) 3.6 18.2 NA 8.1 NA 4.9 NA 7.0 NA
Source: Company, Centrum Research Estimates
23 June 2010
Update
INDIA
Media Industry

8/8/2019 Sector Update - Media
http://slidepdf.com/reader/full/sector-update-media 2/16
2Media Industry
Q4 results review
The Q4FY10 results of media companies were better-than-expected with many companiesreporting strong YoY growth in both revenue and profit. Broadcasting companies, in particular,showed strong revenue growth backed by increased ad spend. Print companies’ revenues wereinline with expectations. Overall, media companies recorded 14.8% YoY revenue growth, thoughon a QoQ basis, growth was flat. Operating profit surged 150% YoY on the back of margin
expansion across the board. As a result, profitability nearly doubled.
Exhibit 1: Snapshot of Q4FY10 results
Sales EBIDTA PATCompany
Rsmn YoY % QoQ % Rsmn YoY % QoQ % Rsmn YoY % QoQ %
Balaji Telefilms 44.7 (15.6) 13.8 9.9 NM NM 3.4 NM 88.3
Deccan Chronicle 191.7 6.3 (17.9) 81.3 92.5 (35.8) 6.5 (20.2) (91.6)
ENIL* 120.0 20.3 2.8 34.2 NM 94.0 17.1 NM 582.8
H T Media* 385.1 14.1 5.2 56.8 29.4 (23.7) 48.5 107.2 37.5
IBN 18 Broadcast 55.3 17.4 (3.9) (2.8) NM NM (28.2) NM NM
Jagran Prakashan 236.3 17.4 4.1 63.3 62.2 (3.1) 36.4 66.7 (8.4)
NDTV* 142.0 15.2 (15.0) (99.7) NM NM (124.5) NM NMSun T V Network 391.9 42.0 (0.8) 330.9 46.6 5.9 165.1 44.8 8.7
T V Today Network 78.9 46.9 12.0 11.1 117.1 (35.6) (10.1) NM NM
Television Eighteen India 85.8 (15.5) 23.6 27.4 NM 218.1 28.9 408.8 NM
Zee Entertainment Enterprises* 649.3 26.4 22.3 183.6 52.8 16.8 128.8 33.5 2.9
Zee News* 60.1 (56.6) (64.8) 3.9 (81.2) (89.3) 2.8 (67.8) (85.3)
Total 2,441 14.8 (0.1) 695.6 150.1 (9.9) 367.0 193.8 (29.5)
*Note: Consolidated Source: Company, Centrum Research
Exhibit 2: Snapshot of FY10 results snapshot
Sales EBITDA PAT
Company Rsmn YoY (%) Rsmn YoY (%) Rsmn YoY (%)
Balaji Telefilms 164 (45) 11 (76) 15 (42)
Deccan Chronicle 892 10 453 69 261 86
ENIL* 423 (1) 44 NM (22) NM
H T Media* 1,438 8 280 41 135 59
IBN 18 Broadcast 210 15 (13) NM (82) NM
Jagran Prakashan 942 14 282 80 176 92
NDTV* 584 19 (256) NM (215) NM
Sun T V Network 1,395 38 1,111 44 567 30
T V Today Network 285 14 60 36 31 (8)
Television Eighteen India 277 (13) 99 216 (32) NM
Zee Entertainment Enterprises* 2,197 1 609 11 478 (9)Zee News* 529 1 91 9 48 8
Total 9,336 8 2,770 74 1,361 110
*Note: Consolidated Source: Company, Centrum Research

8/8/2019 Sector Update - Media
http://slidepdf.com/reader/full/sector-update-media 3/16
3Media Industry
Revenue growth
Driven by strong advertising growth, media companies posted 14.8% YoY revenue growth, whileon a QoQ basis revenues were flat due to seasonality factor. Broadcasting companies registered16.7% YoY revenue growth, with companies such as Sun TV Network posting 61% YoY ad revenuegrowth, ZEEL posted 14% ad growth ex-RGECs (Regional General Entertainment Channels). Withever high advertising and promotion spend by FMCG companies, broadcasters are expected to
benefit, going forward. Subscription revenues also continue to add to the revenue growth, with apredominant increase in DTH subscribers. ZEEL had an 80% YoY increase in DTH subscriptionrevenues, while Sun TV Network had an 85% YoY increase.
Print companies reported 13% YoY increase in revenue on the back of advertising growth, whilecirculation revenues grew marginally. Jagran Prakashan had an ad revenue growth of 20%, whileHT Media had an 8% YoY increase in ad revenue on the back of a 21% rise in the case of its Hindipublication, while its English daily witnessed 4% YoY growth. We believe the nation’s advertiserswere back to advertising in print media.
For FY10, regional media companies demonstrated higher growth, which could be seen in theresults of Jagran Prakashan, Sun TV Network, Deccan Chronicle and HT Media. The merger of Regional General Entertainment Channels boosted revenues for ZEEL, while TV Today’s
incorporation of the figures from its radio business in its results also affected the quarter’snumbers.
Exhibit 3: Steady growth in sales
5 , 7
9 1
5 , 1
2 7
5 , 1
9 7
6 , 8
7 0
5 , 4
2 2
4 , 9
5 8
4 , 2
9 9
3 , 9
1 1
2 , 7
8 1
5 , 7
4 4
6 , 4
0 6
7 , 7
6 5
6 , 9
9 7
(6.4) (3.3)(17.3)
(43.1) (48.7)
41.338.1
151.6
98.5
49.0
15.9
107.186.6
-
1,000
2,000
3,000
4,000
5,000
6,000
7,000
8,000
Q 4 F Y 0 7
Q 1 F Y 0 8
Q 2 F Y 0 8
Q 3 F Y 0 8
Q 4 F Y 0 8
Q 1 F Y 0 9
Q 2 F Y 0 9
Q 3 F Y 0 9
Q 4 F Y 0 9
Q 1 F Y 1 0
Q 2 F Y 1 0
Q 3 F Y 1 0
Q 4 F Y 1 0
(Rsmn)
(100)
(50)
0
50
100
150
200
(%)
EBITDA YoY Growth
Source: Company, Centrum Research
Exhibit 4: High A&P spend from FMCG companies Exhibit 5: FMCG companies’ noise share in GRP terms (Index)
73 71
41 4131 28
10
125
62
39
20
50
3119
0
20
40
60
80
100
120
140
G o d r e j
G S K
H U L
D a b u r
M a r i c o
B r i t t a n i a
C o l g a t e
(%)
FY10 YoY Growth Q4-FY10 YoY Growth
100103 104
117
148145
80
100
120
140
160
Jan-08 FH 08 SH 08 FH 09 SH 09 MQ 10 Source: Company, Centrum Research Source: HUL presentation, Centrum Research

8/8/2019 Sector Update - Media
http://slidepdf.com/reader/full/sector-update-media 4/16
4Media Industry
Exhibit 6: HUL’s advertising & promotion expenses (as % of sales) were the highest
3 , 4
0 3
2 , 8
4 0
3 , 5
6 4
3 , 3
6 0
3 , 5
4 6
3 , 7
5 9
4 , 3
9 1
4 , 4
6 2
4 , 1
4 7
3 , 8
0 3
4 , 5
0 6
5 , 6
1 1
5 , 7
0 9
3 , 4
5 3
6 , 2
6 5
6 , 3
2 9
9.0
14.314.113.512.5
11.3
8.810.310.7
11.7
10.210.59.7
11.211.111.2
0
1,000
2,000
3,000
4,000
5,000
6,000
7,000
Q 1 F Y 0 7
Q 2 F Y 0 7
Q 3 F Y 0 7
Q 4 F Y 0 7
Q 1 F Y 0 8
Q 2 F Y 0 8
Q 3 F Y 0 8
Q 4 F Y 0 8
Q 1 F Y 0 9
Q 2 F Y 0 9
Q 3 F Y 0 9
Q 4 F Y 0 9
Q 1 F Y 1 0
Q 2 F Y 1 0
Q 3 F Y 1 0
Q 4 F Y 1 0
(Rsmn)
0
4
8
12
16
(%)
Ad Spends Ad Spends as % of sales
Source: Company, Centrum Research
Operating profit
Operating profit for the media companies grew 150% YoY on the back of growth both in print andbroadcasting companies. Print companies had their operating profit jump on back of lowernewsprint cost. Companies such as Balaji, TV18 have become profitable, while NDTV hassignificantly reduced its losses, thereby boosting the profitability for the sector. The operatingmargin for broadcasting companies was at 31%, while for print companies the average operatingmargin was at 24.8%, predominantly due to lower consolidated margins from HT Media.
Exhibit 7: Operating profit on an uptick
5 , 7
9 1
5 , 1
2 7
5 , 1
9 7
6 , 8
7 0
5 , 4
2 2
4 , 9
5 8
4 , 2
9 9
3 , 9
1 1
2 , 7
8 1
5 , 7
4 4
6 , 4
0 6
7 , 7
6 5
6 , 9
9 7
(6.4) (3.3)(17.3)
(43.1) (48.7)
41.338.1
151.6
98.5
49.0
15.9
107.186.6
-
1,000
2,000
3,000
4,000
5,000
6,0007,000
8,000
Q 4 F Y 0 7
Q 1 F Y 0 8
Q 2 F Y 0 8
Q 3 F Y 0 8
Q 4 F Y 0 8
Q 1 F Y 0 9
Q 2 F Y 0 9
Q 3 F Y 0 9
Q 4 F Y 0 9
Q 1 F Y 1 0
Q 2 F Y 1 0
Q 3 F Y 1 0
Q 4 F Y 1 0
(Rsmn)
(100)
(50)
0
50
100
150
200
(%)
EBITDA YoY Growth
Source: Company, Centrum Research
Exhibit 8: Margins continue to remain healthy Exhibit 9: Newsprint price trends
10
15
20
25
30
35
40
Q 4 F Y 0 6
Q 1 F Y 0 7
Q 2 F Y 0 7
Q 3 F Y 0 7
Q 4 F Y 0 7
Q 1 F Y 0 8
Q 2 F Y 0 8
Q 3 F Y 0 8
Q 4 F Y 0 8
Q 1 F Y 0 9
Q 2 F Y 0 9
Q 3 F Y 0 9
Q 4 F Y 0 9
Q 1 F Y 1 0
Q 2 F Y 1 0
Q 3 F Y 1 0
Q 4 F Y 1 0
(%)
Print Broadcasting Sector 15,000
25,000
35,000
45,000
55,000
A p r - 0 7
J u n - 0 7
A u g - 0 7
O c t - 0 7
D e c - 0 7
F e b - 0 8
A p r - 0 8
J u n - 0 8
A u g - 0 8
O c t - 0 8
D e c - 0 8
F e b - 0 9
A p r - 0 9
J u n - 0 9
A u g - 0 9
O c t - 0 9
D e c - 0 9
F e b - 1 0
A p r - 1 0
(Rs)
Do mestic Imported Source: Company, Centrum Research Source: CrisInfac, Centrum Research
8/8/2019 Sector Update - Media
http://slidepdf.com/reader/full/sector-update-media 5/16
5Media Industry
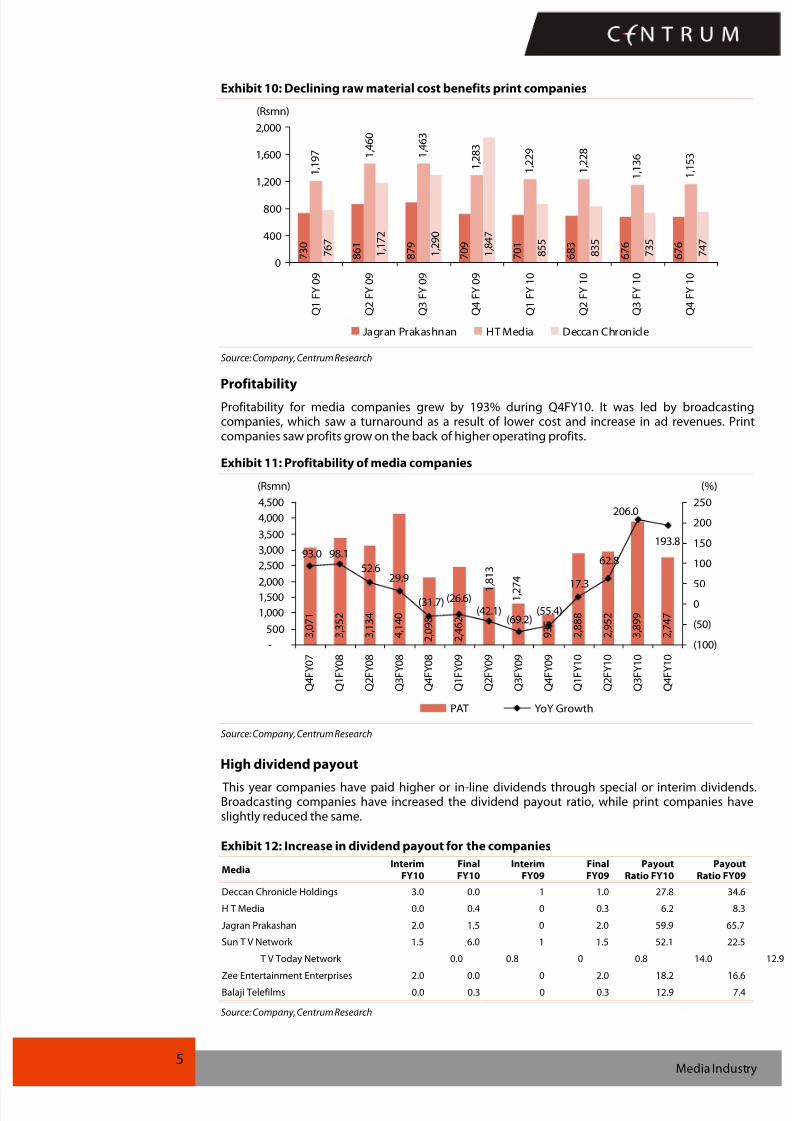
Exhibit 10: Declining raw material cost benefits print companies
7 3 0
8 6 1
8 7 9
7 0 9
7 0 1
6 8 3
6 7 6
6 7 6
1 , 1
9 7 1
, 4 6 0
1 , 4
6 3
1 , 2
8 3
1 , 2
2 9
1 , 2
2 8
1 , 1
3 6
1 , 1
5 3
7 6 7
1 , 1
7 2
1 , 2
9 0
1 , 8
4 7
8 5 5
8 3 5
7 3 5
7 4 7
0
400
800
1,200
1,600
2,000
Q 1 F Y 0 9
Q 2 F Y 0 9
Q 3 F Y 0 9
Q 4 F Y 0 9
Q 1 F Y 1 0
Q 2 F Y 1 0
Q 3 F Y 1 0
Q 4 F Y 1 0
(Rsmn)
Jagran Prakashnan HT Media Deccan Chronicle
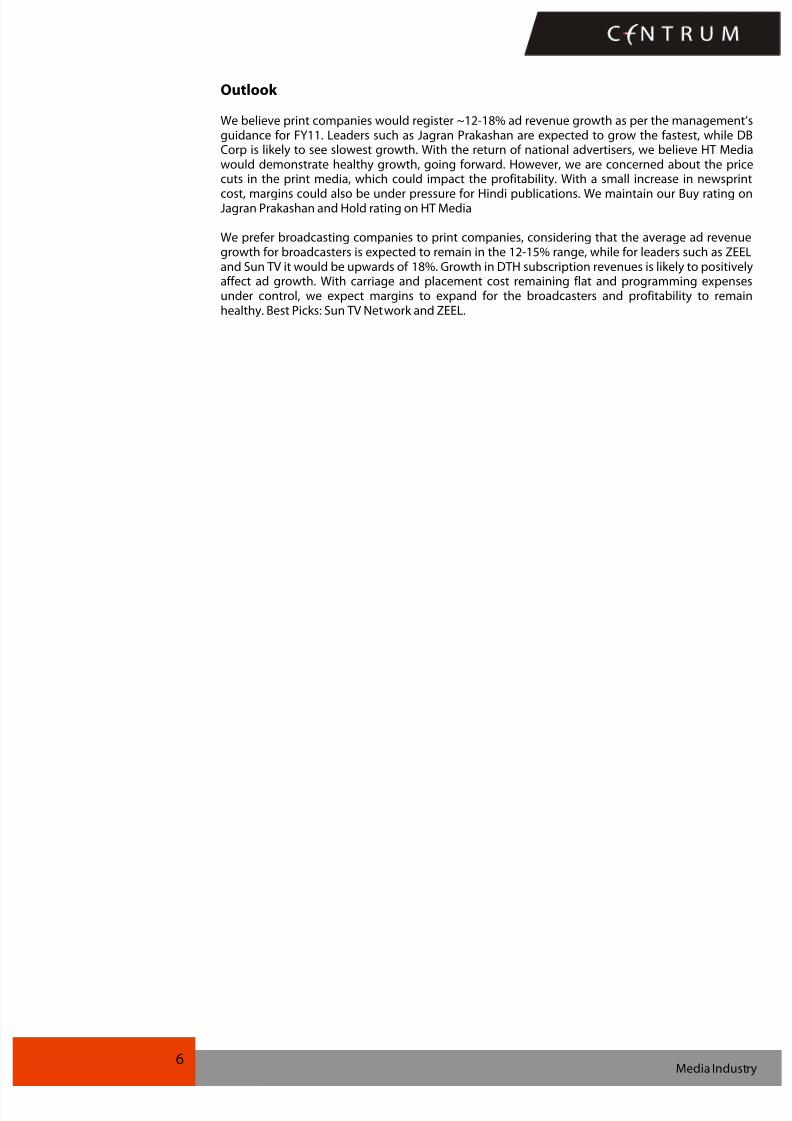
Source: Company, Centrum Research Profitability
Profitability for media companies grew by 193% during Q4FY10. It was led by broadcastingcompanies, which saw a turnaround as a result of lower cost and increase in ad revenues. Printcompanies saw profits grow on the back of higher operating profits.
Exhibit 11: Profitability of media companies
3 , 0
7 1
3 , 3
5 2
3 , 1
3 4
4 , 1
4 0
9 3 5
2 , 8
8 8
2 , 9
5 2
2 , 7
4 7
3 , 8
9 9
2 , 4
6 2
2 , 0
9 8
1 , 8 1
3
1 , 2
7 4
193.8
206.0
17.3
62.8
(55.4)(69.2)
(42.1)(26.6)(31.7)
29.952.6
98.193.0
-
500
1,000
1,500
2,000
2,500
3,000
3,500
4,000
4,500
Q 4 F Y 0 7
Q 1 F Y 0 8
Q 2 F Y 0 8
Q 3 F Y 0 8
Q 4 F Y 0 8
Q 1 F Y 0 9
Q 2 F Y 0 9
Q 3 F Y 0 9
Q 4 F Y 0 9
Q 1 F Y 1 0
Q 2 F Y 1 0
Q 3 F Y 1 0
Q 4 F Y 1 0
(Rsmn)
(100)
(50)
0
50
100
150
200
250
(%)
PAT YoY Growth
Source: Company, Centrum Research
High dividend payout This year companies have paid higher or in-line dividends through special or interim dividends.Broadcasting companies have increased the dividend payout ratio, while print companies haveslightly reduced the same.
Exhibit 12: Increase in dividend payout for the companies
MediaInterim
FY10FinalFY10
InterimFY09
FinalFY09
PayoutRatio FY10
PayoutRatio FY09
Deccan Chronicle Holdings 3.0 0.0 1 1.0 27.8 34.6
H T Media 0.0 0.4 0 0.3 6.2 8.3
Jagran Prakashan 2.0 1.5 0 2.0 59.9 65.7
Sun T V Network 1.5 6.0 1 1.5 52.1 22.5
T V Today Network 0.0 0.8 0 0.8 14.0 12.9Zee Entertainment Enterprises 2.0 0.0 0 2.0 18.2 16.6
Balaji Telefilms 0.0 0.3 0 0.3 12.9 7.4
Source: Company, Centrum Research
8/8/2019 Sector Update - Media
http://slidepdf.com/reader/full/sector-update-media 6/16
6Media Industry
Outlook
We believe print companies would register ~12-18% ad revenue growth as per the management’sguidance for FY11. Leaders such as Jagran Prakashan are expected to grow the fastest, while DBCorp is likely to see slowest growth. With the return of national advertisers, we believe HT Mediawould demonstrate healthy growth, going forward. However, we are concerned about the pricecuts in the print media, which could impact the profitability. With a small increase in newsprint
cost, margins could also be under pressure for Hindi publications. We maintain our Buy rating onJagran Prakashan and Hold rating on HT Media
We prefer broadcasting companies to print companies, considering that the average ad revenuegrowth for broadcasters is expected to remain in the 12-15% range, while for leaders such as ZEELand Sun TV it would be upwards of 18%. Growth in DTH subscription revenues is likely to positivelyaffect ad growth. With carriage and placement cost remaining flat and programming expensesunder control, we expect margins to expand for the broadcasters and profitability to remainhealthy. Best Picks: Sun TV Network and ZEEL.
8/8/2019 Sector Update - Media
http://slidepdf.com/reader/full/sector-update-media 7/16
Please refer to important disclosures/disclaimers in Appendix A
Hold
Target Price: Rs220
CMP: Rs235*Downside: 7%
*as on 22 June 2010
Ankit Kediaankit.kediacentrum.co.in+91 22 4215 9634
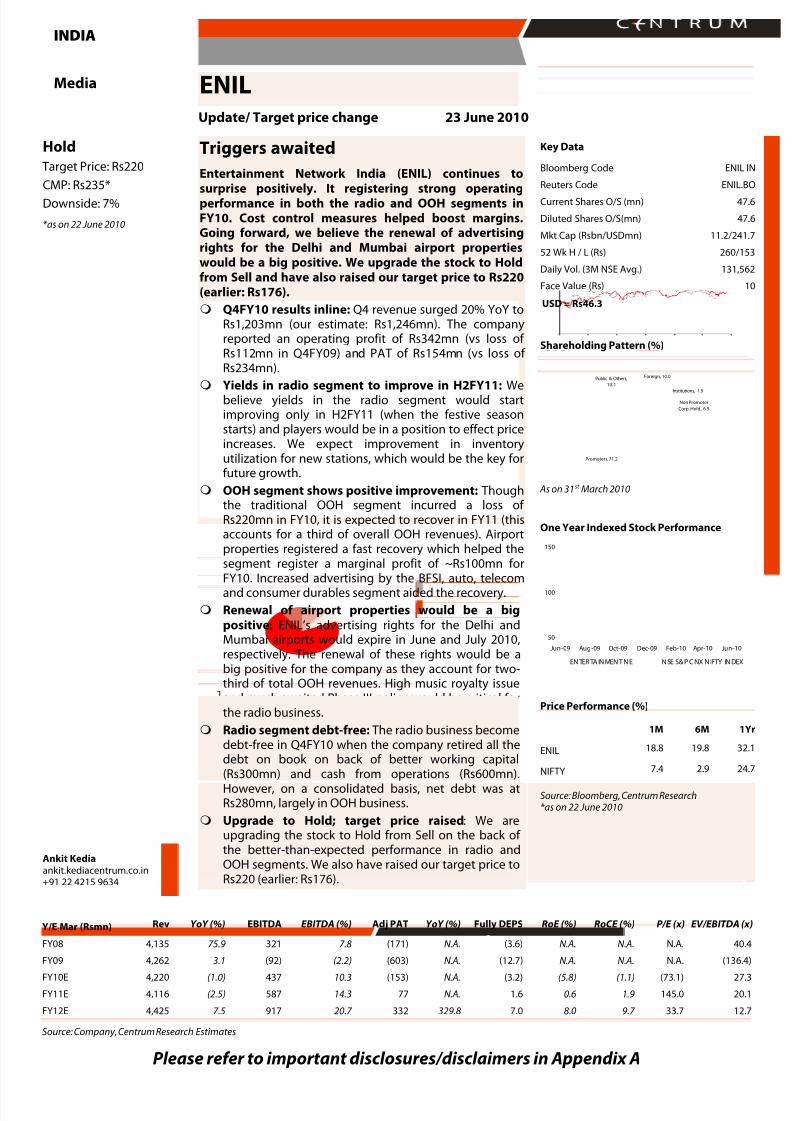
Triggers awaited
Entertainment Network India (ENIL) continues to
surprise positively. It registering strong operatingperformance in both the radio and OOH segments inFY10. Cost control measures helped boost margins.Going forward, we believe the renewal of advertisingrights for the Delhi and Mumbai airport propertieswould be a big positive. We upgrade the stock to Holdfrom Sell and have also raised our target price to Rs220(earlier: Rs176).
Q4FY10 results inline: Q4 revenue surged 20% YoY toRs1,203mn (our estimate: Rs1,246mn). The companyreported an operating profit of Rs342mn (vs loss of Rs112mn in Q4FY09) and PAT of Rs154mn (vs loss of Rs234mn).
Yields in radio segment to improve in H2FY11: Webelieve yields in the radio segment would startimproving only in H2FY11 (when the festive seasonstarts) and players would be in a position to effect priceincreases. We expect improvement in inventoryutilization for new stations, which would be the key forfuture growth.
OOH segment shows positive improvement: Thoughthe traditional OOH segment incurred a loss of Rs220mn in FY10, it is expected to recover in FY11 (thisaccounts for a third of overall OOH revenues). Airportproperties registered a fast recovery which helped thesegment register a marginal profit of ~Rs100mn for
FY10. Increased advertising by the BFSI, auto, telecomand consumer durables segment aided the recovery.
Renewal of airport properties would be a bigpositive: ENIL’s advertising rights for the Delhi andMumbai airports would expire in June and July 2010,respectively. The renewal of these rights would be abig positive for the company as they account for two-third of total OOH revenues. High music royalty issueand much awaited Phase III policy would be critical forthe radio business.
Radio segment debt-free: The radio business becomedebt-free in Q4FY10 when the company retired all thedebt on book on back of better working capital(Rs300mn) and cash from operations (Rs600mn).However, on a consolidated basis, net debt was atRs280mn, largely in OOH business.
Upgrade to Hold; target price raised: We areupgrading the stock to Hold from Sell on the back of the better-than-expected performance in radio andOOH segments. We also have raised our target price toRs220 (earlier: Rs176).
Key Data
Bloomberg Code ENIL IN
Reuters Code ENIL.BO
Current Shares O/S (mn) 47.6
Diluted Shares O/S(mn) 47.6
Mkt Cap (Rsbn/USDmn) 11.2/241.7
52 Wk H / L (Rs) 260/153
Daily Vol. (3M NSE Avg.) 131,562
Face Value (Rs) 10
USD = Rs46.3
Shareholding Pattern (%)
Institutions, 1.9
Non Promoter
Corp. Hold., 6.9
Promoters, 71.2
Public & Others,
10.1
Foreign, 10.0
As on 31st March 2010
One Year Indexed Stock Performance
50
100
150
Jun-09 Aug-09 Oct-09 Dec-09 Feb-10 Apr-10 Jun-10
EN TER TA IN MEN T N E N SE S& P C NX N IFTY IN DEX
Price Performance (%)
1M 6M 1Yr
ENIL 18.8 19.8 32.1
NIFTY 7.4 2.9 24.7
Source: Bloomberg, Centrum Research*as on 22 June 2010
Y/E Mar (Rsmn) Rev YoY (%) EBITDA EBITDA (%) Adj PAT YoY (%) Fully DEPS RoE (%) RoCE (%) P/E (x) EV/EBITDA (x)
FY08 4,135 75.9 321 7.8 (171) N.A. (3.6) N.A. N.A. N.A. 40.4
FY09 4,262 3.1 (92) (2.2) (603) N.A. (12.7) N.A. N.A. N.A. (136.4)
FY10E 4,220 (1.0) 437 10.3 (153) N.A. (3.2) (5.8) (1.1) (73.1) 27.3
FY11E 4,116 (2.5) 587 14.3 77 N.A. 1.6 0.6 1.9 145.0 20.1
FY12E 4,425 7.5 917 20.7 332 329.8 7.0 8.0 9.7 33.7 12.7
Source: Company, Centrum Research Estimates
Media
Update/ Target price change 23 June 2010
INDIA
ENIL
8/8/2019 Sector Update - Media
http://slidepdf.com/reader/full/sector-update-media 8/16
8ENIL
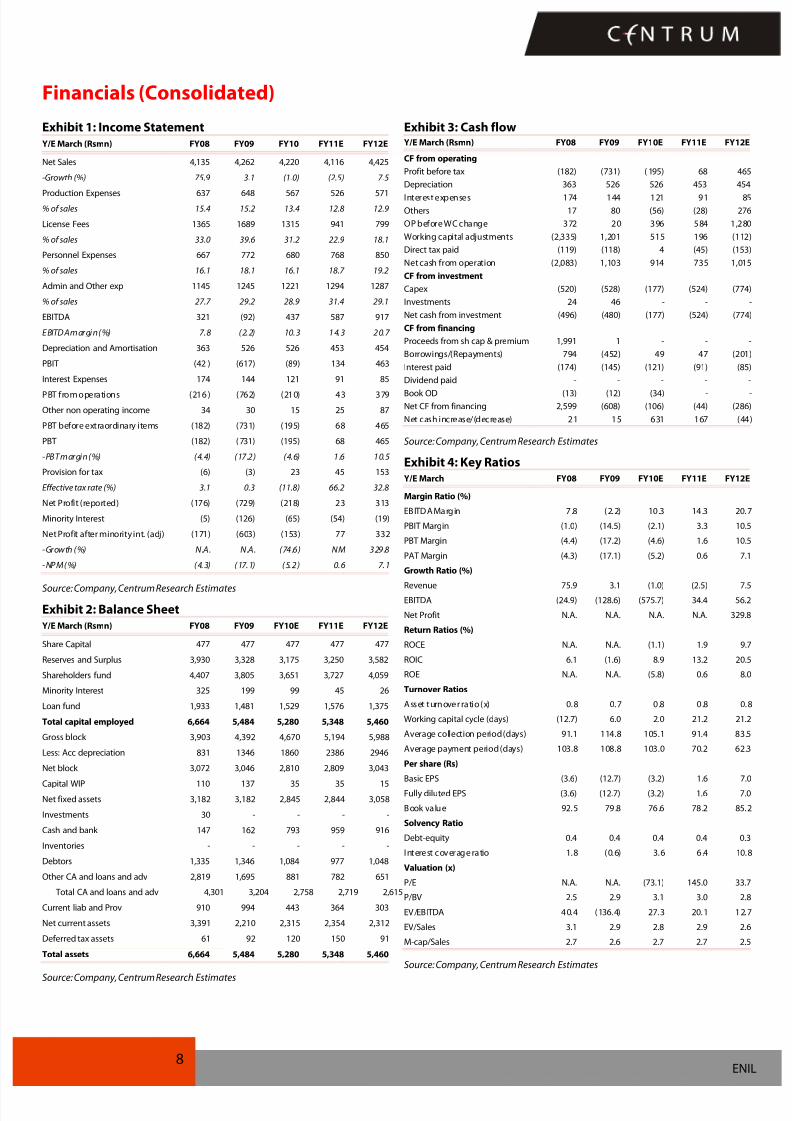
Financials (Consolidated)
Exhibit 1: Income Statement
Y/E March (Rsmn) FY08 FY09 FY10 FY11E FY12E
Net Sales 4,135 4,262 4,220 4,116 4,425
-Growth (%) 75.9 3.1 (1.0) (2.5) 7.5
Production Expenses 637 648 567 526 571
% of sales 15.4 15.2 13.4 12.8 12.9
License Fees 1365 1689 1315 941 799
% of sales 33.0 39.6 31.2 22.9 18.1
Personnel Expenses 667 772 680 768 850
% of sales 16.1 18.1 16.1 18.7 19.2
Admin and Other exp 1145 1245 1221 1294 1287
% of sales 27.7 29.2 28.9 31.4 29.1
EBITDA 321 (92) 437 587 917
EBITD A m argin (%) 7.8 (2.2) 10.3 1 4.3 2 0.7
Depreciation and Amortisation 363 526 526 453 454
PBIT (42 ) (617) (89) 134 463
Interest Expenses 174 144 121 91 85PBT from operations (216 ) (762) (210) 43 379
Other non operating income 34 30 15 25 87
PBT before extraordinary items (182) (731) (195) 68 465
PBT (182) (731) (195) 68 465
-PBT margin (%) (4.4) (17.2) (4.6) 1.6 10.5
Provision for tax (6) (3) 23 45 153
Effective tax rate (%) 3.1 0.3 (11.8) 66.2 32.8
Net Profit (reported) (176) (729) (218) 23 313
Minority Interest (5) (126) (65) (54) (19)
Net Profit after minority int. (adj) (171) (603) (153) 77 332
-Growth (%) N.A. N.A. (74.6) NM 329.8
- NPM (%) (4.3) (17.1) (5.2 ) 0.6 7.1
Source: Company, Centrum Research Estimates
Exhibit 2: Balance SheetY/E March (Rsmn) FY08 FY09 FY10E FY11E FY12E
Share Capital 477 477 477 477 477
Reserves and Surplus 3,930 3,328 3,175 3,250 3,582
Shareholders fund 4,407 3,805 3,651 3,727 4,059
Minority Interest 325 199 99 45 26
Loan fund 1,933 1,481 1,529 1,576 1,375
Total capital employed 6,664 5,484 5,280 5,348 5,460
Gross block 3,903 4,392 4,670 5,194 5,988
Less: Acc depreciation 831 1346 1860 2386 2946
Net block 3,072 3,046 2,810 2,809 3,043
Capital WIP 110 137 35 35 15
Net fixed assets 3,182 3,182 2,845 2,844 3,058
Investments 30 - - - -
Cash and bank 147 162 793 959 916
Inventories - - - - -
Debtors 1,335 1,346 1,084 977 1,048
Other CA and loans and adv 2,819 1,695 881 782 651
Total CA and loans and adv 4,301 3,204 2,758 2,719 2,615
Current liab and Prov 910 994 443 364 303
Net current assets 3,391 2,210 2,315 2,354 2,312
Deferred tax assets 61 92 120 150 91
Total assets 6,664 5,484 5,280 5,348 5,460
Source: Company, Centrum Research Estimates
Exhibit 3: Cash flowY/E March (Rsmn) FY08 FY09 FY10E FY11E FY12E
CF from operating
Profit before tax (182) (731) ( 195) 68 465
Depreciation 363 526 526 453 454
Interest expenses 174 144 121 91 85
Others 17 80 (56) (28) 276
OP before WC change 372 20 396 584 1,280
Working capital adjustments (2,335) 1,201 515 196 (112)
Direct tax paid (119) (118) 4 (45) (153)
Net cash from operation (2,083) 1,103 914 735 1,015
CF from investment
Capex (520) (528) (177) (524) (774)
Investments 24 46 - - -
Net cash from investment (496) (480) (177) (524) (774)
CF from financing
Proceeds from sh cap & premium 1,991 1 - - -
Borrowings/(Repayments) 794 (452) 49 47 (201)
Interest paid (174) (145) (121) (91) (85)
Dividend paid - - - - -Book OD (13) (12) (34) - -
Net CF from financing 2,599 (608) (106) (44) (286)
Net cash increase/(decrease) 21 15 631 167 (44)
Source: Company, Centrum Research Estimates
Exhibit 4: Key RatiosY/E March FY08 FY09 FY10E FY11E FY12E
Margin Ratio (%)
EBITDA Margin 7 .8 (2.2) 10.3 14.3 20.7
PBIT Margin (1.0) (14.5) (2.1) 3.3 10.5
PBT Margin (4.4) (17.2) (4.6) 1.6 10.5
PAT Margin (4.3) (17.1) (5.2) 0.6 7.1
Growth Ratio (%)
Revenue 75.9 3.1 (1.0) (2.5) 7.5
EBITDA (24.9) (128.6) (575.7) 34.4 56.2
Net Profit N.A. N.A. N.A. N.A. 329.8
Return Ratios (%)
ROCE N.A. N.A. (1.1) 1.9 9.7
ROIC 6.1 (1.6) 8.9 13.2 20.5
ROE N.A. N.A. (5.8) 0.6 8.0
Turnover Ratios
Asset turnover ratio (x) 0.8 0.7 0.8 0 .8 0.8
Working capital cycle (days) (12.7) 6.0 2.0 21.2 21.2
Average collection period (days) 91.1 114.8 105.1 91.4 83.5
Average payment period (days) 103.8 108.8 103.0 70.2 62.3
Per share (Rs)Basic EPS (3.6) (12.7) (3.2) 1.6 7.0
Fully diluted EPS (3.6) (12.7) (3.2) 1.6 7.0
Book value 92.5 79.8 76.6 78.2 85.2
Solvency Ratio
Debt-equity 0.4 0.4 0.4 0.4 0.3
Interest coverage ratio 1.8 (0.6) 3.6 6 .4 10.8
Valuation (x)
P/E N.A. N.A. (73.1) 145.0 33.7
P/BV 2.5 2.9 3.1 3.0 2.8
EV/EBITDA 40.4 (136.4) 27.3 20.1 12.7
EV/Sales 3.1 2.9 2.8 2.9 2.6
M-cap/Sales 2.7 2.6 2.7 2.7 2.5
Source: Company, Centrum Research Estimates

8/8/2019 Sector Update - Media
http://slidepdf.com/reader/full/sector-update-media 9/16
Please refer to important disclosures/disclaimers in Appendix A
Hold
Target Price: Rs166
CMP: Rs149*Upside: 10%
*as on 22 June 2010
Ankit [email protected]+91 22 4215 9634
On the growth track
HT Media is on a positive growth trajectory buoyed by
the recovery in the media and advertising industry.Hindustan Times is expected to register marginexpansion on the back of ad revenue growth, whilelosses at Mint are expected to reduce. However, weremain cautious on the outlook as DB Corp, publisher of Hindi daily, Dainik Bhaskar, forays into Bihar and Jharkhand, and HT Media’s internet division continuesto incur losses. We maintain Hold with a revised targetprice of Rs166 (earlier Rs144), valuing the stock at 18xFY12E consolidated earnings.
Q4 results better than expected: Q4 revenue grew12.5% YoY to Rs3,851mn (vs our estimate of Rs3,872mn)and adjusted PAT came to Rs480mn (our estimate:
Rs370mn). Ad revenue and circulation revenue grew 8%and 5%, respectively. Margin expanded to 24.1% from7.3% in Q4FY09 on the back of 15% reduction in rawmaterial costs and 6% reduction in employee expenses.
Hindustan Times back on track: Hindustan Times’ adrevenue declined by 5% in FY10. However, it isexpected to register 8% CAGR in ad revenue over thenext two years. We believe the national advertisingmarket is back on track with advertisers more confidentnow. Mint, which incurred an EBIDTA loss of Rs180mn inFY10, is expected to breakeven in H1FY12E.
Hindustan – ready for IPO: HT Media plans to raiseRs3bn through an IPO of the Hindi daily in the next 2
months. We expect Hindustan to post revenue of Rs5080mn, EBIDTA of Rs1250mn and PAT of Rs763mn inFY11E.
Internet losses to be capped at Rs350mn: Themanagement has guided that the Internet division’slosses would be capped at Rs350mn in FY11. DuringFY10, the division posted losses of Rs377mn withrevenue at Rs56mn.
Competition to intensify in Bihar and Jharkhand:With entry of DB Corp in Bihar and Jharkhand in FY11,we believe the competition will intensify (Hindustan iscurrently the market leader in these markets). Company
would have to cut its cover price and this would have anegative impact of ~Rs100-150mn in FY11.
HT Burda Media – operationally positive frominception: The printing JV between HT Media andGermany’s Hubert Burda Media JV is expected to postrevenue of over Rs1bn with margin of ~18-20% in FY11.In FY10, it posted revenue of Rs46mn and EBIDTA of Rs31mn.
Key Data
Bloomberg Code HTML IN
Reuters Code HTML.BO
Current Shares O/S (mn) 235.0
Diluted Shares O/S(mn) 235.0
Mkt Cap (Rsbn/USDmn) 34.9/753.4
52 Wk H / L (Rs) 174/76
Daily Vol. (3M NSE Avg.) 49,479
Face Value (Rs) 2
USD = Rs46.3
Shareholding Pattern (%)
Institutions, 13.7
Non Promoter Corp.
Hold.,2.2
Promoters,68.8
Public & Others,2.8Foreign, 12.4
As on 31st March 2010
One Year Indexed Stock Performance
50
100
150
200
Jun-09 Aug-09 Oct-09 Dec-09 Feb-10 Apr-10 Jun-10
HT MEDIA LTD NSE S&P CNX NIFTY INDEX
Price Performance (%)
1M 6M 1Yr
HT Media 1.8 7.0 61.4
NIFTY 7.4 3.0 24.7
Source: Bloomberg, Centrum Research*as on 22 June 2010
Y/E Mar (Rsmn) Rev YoY (%) EBIDTA EBIDTA (%) Adj PAT YoY (%) Fully DEPS RoE (%) RoCE (%) P/E (x) EV/EBIDTA (x)
FY08 12,033 15.7 1,699 14.1 1,013 4.4 4.3 11.9 8.0 34.4 19.8
FY09 13,466 11.9 879 6.5 9 (99.1) 0.0 NM NM NA 39.8
FY10E 14,129 4.9 2,554 18.1 1,359 14,904.9 5.8 13.9 10.3 25.8 12.6
FY11E 16,472 16.6 3,239 19.7 1,871 37.7 8.0 16.3 13.0 18.7 9.6
FY12E 18,688 13.5 3,650 19.5 2,167 15.8 9.2 16.0 13.7 16.2 8.2
Source: Company, Centrum Research Estimates
Media
Update/ Target price change 23 June 2010
INDIA
HT Media

8/8/2019 Sector Update - Media
http://slidepdf.com/reader/full/sector-update-media 10/16
10HT Media
Financials
Exhibit 1: Income Statement
Y/E March (Rsmn) FY08 FY09 FY10 FY11E FY12E
Net Sales 12,033 13,466 14,129 16,472 18,688
Growth (%) 15.7 11.9 4.9 16.6 13.5
Cost of Revenues 4,640 5,589 4,761 4,859 5,525
% of Sales 38.6 41.5 33.7 29.5 29.6
Employee Cost 1,983 2,419 2,520 2,855 3,211
%of Sales 16.5 18.0 17.8 17.3 17.2
Admin & other expenses 3,711 4,579 4,295 5,519 6,302
% of sales 30.8 34.0 30.4 33.5 33.7
EBIDTA 1,699 879 2,554 3,239 3,650
EBIDTA Margins (%) 14.1 6.5 18.1 19.7 19.5
Depreciation 570 688 707 810 890
PBIT 1,129 191 1,847 2,429 2,760
Interest expenses 178 323 295 235 235
PBT for operations 951 (132) 1,552 2,194 2,525
Other non operating income 439 330 409 405 485PBT before extra-ordinary items 1,390 198 1,961 2,599 3,010
Extra-ordinary expense - 189 76 - -
PBT 1,390 9 1,885 2,599 3,010
Provision for tax 377 125 537 728 843
Effective tax rate (%) 27.1 1,405.2 28.5 28.0 28.0
PAT 1,013 (116) 1,348 1,871 2,167
Share of minority interest (0) 125 11 - -
Adjusted PAT 1,013 9 1,359 1,871 2,167
Growth (%) 4 (99.1) 14,904.9 38 16
Source: Company, Centrum Research Estimates
Exhibit 2: Balance Sheet
Y/E March (Rsmn) FY08 FY09 FY10E FY11E FY12E
Share Capital 469 470 470 470 470
Reserves & Surplus 8,060 8,015 9,237 10,998 13,055
Minority Interest 1 (69) 218 218 218
Loan Funds 2,231 3,706 3,125 1,750 1,500
Deferred Tax Liab 122 207 178 178 178
Total Capital Employed 10,882 12,329 13,228 13,614 15,422
Gross Block 7,005 8,238 9,778 10,422 11,422
Accumulated Depreciation 1,765 2,467 3,174 3,984 4,874
Net Block 5,240 5,771 6,604 6,438 6,548
Capital WIP 589 1,946 1,800 1,000 1,000
Total Assets 5,829 7,717 8,404 7,438 7,548
Investments 2,656 3,035 4,755 4,755 4,755
Inventory 1,155 1,756 1,200 1,140 1,202
Debtors 1,983 2,199 2,423 2,798 3,174
Loans & advances 1,287 2,315 1,995 2,148 2,448
Cash & bank balances 774 705 1,085 836 1,979
Total current assets 5,199 6,976 6,703 6,922 8,803
Current liabilities & provisions 2,804 5,399 6,655 5,522 5,706
Net current assets 2,395 1,577 47 1,400 3,097
Misc Expenditure 1 0 22 22 22
Total 10,882 12,329 13,228 13,614 15,422
Source: Company, Centrum Research Estimates
Exhibit 3: Cash flowY/E March (Rsmn) FY08 FY09 FY10E FY11E FY12E
Cash flows from operating
Profit before tax 1,390 9 1,885 2,599 3,010
Depreciation & amortization 570 688 707 810 890Others (113) 284 259 (163) (250)
Operating charges before WC changes 1,846 981 2,850 3,246 3,650
Working capital changes (131) 1,313 1,617 (1,609) (554)
Cash inflow from operations 1,715 2,294 4,468 1,637 3,096
Income tax paid (597) (205) (538) (728) (843)
Net cash inflow from operations 1,118 2,089 3,930 909 2,253
Cash flows from investing
Capex (1,196) (2,597) (1,393) 156 (1,000)
Investments (325) (1,103) (1,720) - -
Other Income 75 256 522 405 485
Cash generated from investment (1,447) (3,443) (2,592) 561 (515)
Cash flow from financing
Equity shares 573 - - - -
Borrowings/ repayments - 1,491 (581) (1,375) (250)
Dividend paid (82) (110) (83) (110) (110)
Interest paid (179) (297) (295) (235) (235)
Cash generated from financing 312 1,084 (959) (1,720) (595)
Net inc./decrease in cash & cash equiv. (17) (270) 380 (249) 1,143
Cash & cash equiv. at beginning of year 637 620 705 1,085 836
Cash at the end of year 620 349 1,085 836 1,979
Source: Company, Centrum Research Estimates
Exhibit 4: Key RatiosY/E March FY08 FY09 FY10E FY11E FY12E
Margin ratios (%)
EBIDTA Margins 14.1 6.5 18.1 19.7 19.5
PBIT Margins 9.4 1.4 13.1 14.7 14.8
PBT Margins 11.6 0.1 13.3 15.8 16.1
PAT Margins 8.4 (0.9) 9.5 11.4 11.6
Growth ratios (%)
Revenues 15.7 11.9 4.9 16.6 13.5
EBIDTA 1.1 (48.3) 190.6 26.8 12.7
Net Profit 4.4 (99.1) 14,905 37.7 15.8
Return Ratios (%)
ROCE 8.0 NM 10.3 13.0 13.7
RoIC 18.3 8.1 21.5 26.0 27.8
ROE 11.9 NM 13.9 16.3 16.0
Turnover Ratios
Average inventory period (days) 90.8 114.7 92.0 85.7 79.4
Average collection period(days) 60.2 59.6 62.6 62.0 62.0
Average payment period (days) 61.4 62.6 58.7 70.6 70.8
Working Capital Cycle (days) 89.6 111.7 95.9 77.1 70.6
Per Share (Rs)
EPS 4.3 0.0 5.8 8.0 9.2
CEPS 6.8 2.4 8.7 11.4 13.0
Book Value 36.4 36.1 41.3 48.8 57.5
Dividend 0.4 0.3 0.4 0.4 0.4
Valuations (x)
PER 34.4 NA 25.8 18.7 16.2
P/BV 4.1 4.1 3.6 3.1 2.6
EV/EBIDTA 19.8 39.8 12.6 9.6 8.2
EV/Sales 2.8 2.6 2.3 1.9 1.6
M-cap/Sales 34.4 NA 25.8 18.7 16.2
Source: Company, Centrum Research Estimates

8/8/2019 Sector Update - Media
http://slidepdf.com/reader/full/sector-update-media 11/16
8/8/2019 Sector Update - Media
http://slidepdf.com/reader/full/sector-update-media 12/16
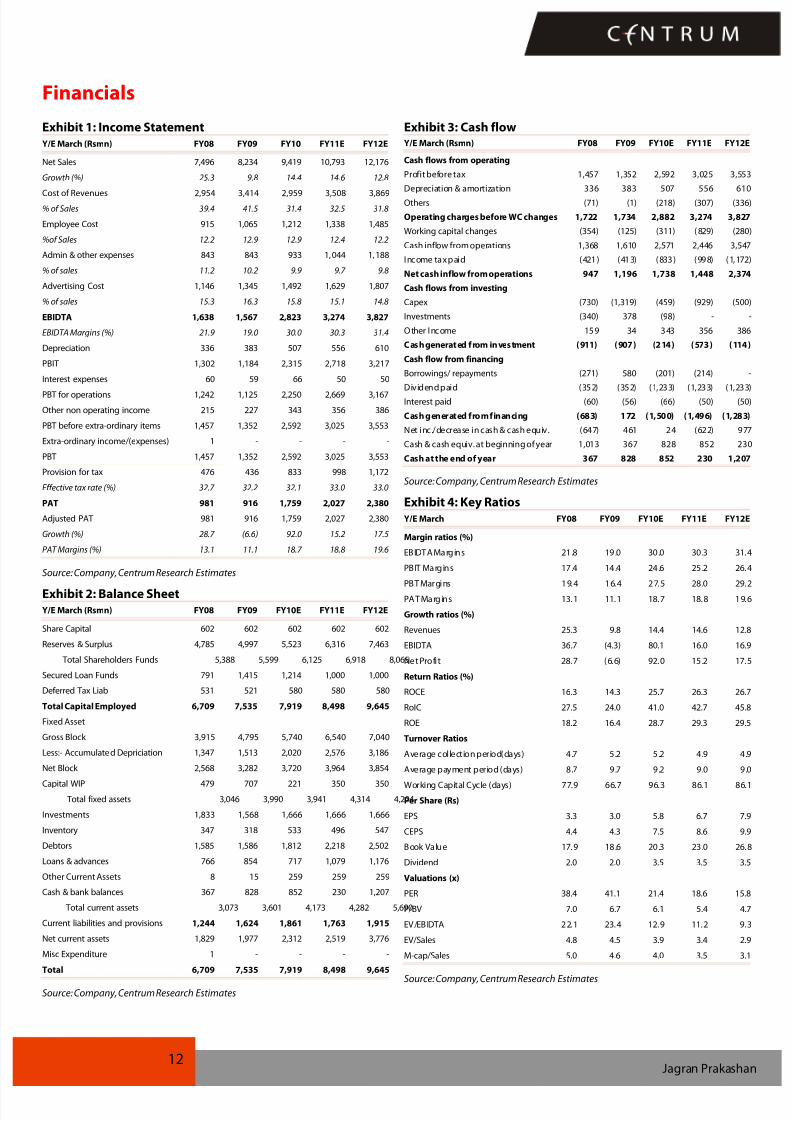
12Jagran Prakashan
Financials
Exhibit 1: Income Statement
Y/E March (Rsmn) FY08 FY09 FY10 FY11E FY12E
Net Sales 7,496 8,234 9,419 10,793 12,176
Growth (%) 25.3 9.8 14.4 14.6 12.8
Cost of Revenues 2,954 3,414 2,959 3,508 3,869
% of Sales 39.4 41.5 31.4 32.5 31.8
Employee Cost 915 1,065 1,212 1,338 1,485
%of Sales 12.2 12.9 12.9 12.4 12.2
Admin & other expenses 843 843 933 1, 044 1,188
% of sales 11.2 10.2 9.9 9.7 9.8
Advertising Cost 1,146 1,345 1,492 1,629 1,807
% of sales 15.3 16.3 15.8 15.1 14.8
EBIDTA 1,638 1,567 2,823 3,274 3,827
EBIDTA Margins (%) 21.9 19.0 30.0 30.3 31.4
Depreciation 336 383 507 556 610
PBIT 1,302 1,184 2,315 2,718 3,217
Interest expenses 60 59 66 50 50PBT for operations 1,242 1,125 2,250 2,669 3,167
Other non operating income 215 227 343 356 386
PBT before extra-ordinary items 1,457 1,352 2,592 3,025 3,553
Extra-ordinary income/(expenses) 1 - - - -
PBT 1,457 1,352 2,592 3,025 3,553
Provision for tax 476 436 833 998 1,172
Effective tax rate (%) 32.7 32.2 32.1 33.0 33.0
PAT 981 916 1,759 2,027 2,380
Adjusted PAT 981 916 1,759 2,027 2,380
Growth (%) 28.7 (6.6) 92.0 15.2 17.5
PAT Margins (%) 13.1 11.1 18.7 18.8 19.6
Source: Company, Centrum Research Estimates
Exhibit 2: Balance SheetY/E March (Rsmn) FY08 FY09 FY10E FY11E FY12E
Share Capital 602 602 602 602 602
Reserves & Surplus 4,785 4,997 5,523 6,316 7,463
Total Shareholders Funds 5,388 5,599 6,125 6,918 8,065
Secured Loan Funds 791 1,415 1,214 1,000 1,000
Deferred Tax Liab 531 521 580 580 580
Total Capital Employed 6,709 7,535 7,919 8,498 9,645
Fixed Asset
Gross Block 3,915 4,795 5,740 6,540 7,040
Less:- Accumulated Depriciation 1,347 1,513 2,020 2,576 3,186
Net Block 2,568 3,282 3,720 3,964 3,854
Capital WIP 479 707 221 350 350
Total fixed assets 3,046 3,990 3,941 4,314 4,204
Investments 1,833 1,568 1,666 1,666 1,666
Inventory 347 318 533 496 547
Debtors 1,585 1,586 1,812 2,218 2,502
Loans & advances 766 854 717 1,079 1,176
Other Current Assets 8 15 259 259 259
Cash & bank balances 367 828 852 230 1,207
Total current assets 3,073 3,601 4,173 4,282 5,690
Current liabilities and provisions 1,244 1,624 1,861 1,763 1,915
Net current assets 1,829 1,977 2,312 2,519 3,776
Misc Expenditure 1 - - - -
Total 6,709 7,535 7,919 8,498 9,645
Source: Company, Centrum Research Estimates
Exhibit 3: Cash flowY/E March (Rsmn) FY08 FY09 FY10E FY11E FY12E
Cash flows from operating
Profit before tax 1,457 1,352 2,592 3,025 3,553
Depreciation & amortization 336 383 507 556 610Others (71) (1) (218) (307) (336)
Operating charges before WC changes 1,722 1,734 2,882 3,274 3,827
Working capital changes (354) (125) (311) (829) (280)
Cash inflow from operations 1,368 1,610 2,571 2,446 3,547
Income tax paid (421) (413) (833) (998) (1,172)
Net cash inflow from operations 947 1,196 1,738 1,448 2,374
Cash flows from investing
Capex (730) (1,319) (459) (929) (500)
Investments (340) 378 (98) - -
Other Income 159 34 343 356 386
Cash generated from investment (911) (907) (214) (573) (114)
Cash flow from financing
Borrowings/ repayments (271) 580 (201) (214) -
Dividend paid (352) (352) (1,233) (1,233) (1,233)
Interest paid (60) (56) (66) (50) (50)
Cash generated from financing (683) 172 (1,500) (1,496) (1,283)
Net inc./decrease in cash & cash equiv. (647) 461 24 (622) 977
Cash & cash equiv. at beginning of year 1,013 367 828 852 230
Cash at the end of year 367 828 852 230 1,207
Source: Company, Centrum Research Estimates
Exhibit 4: Key Ratios
Y/E March FY08 FY09 FY10E FY11E FY12E
Margin ratios (%)
EBIDTA Margins 21.8 19.0 30.0 30.3 31.4
PBIT Margins 17.4 14.4 24.6 25.2 26.4
PBT Margins 19.4 16.4 27.5 28.0 29.2
PAT Margins 13.1 11.1 18.7 18.8 19.6
Growth ratios (%)
Revenues 25.3 9.8 14.4 14.6 12.8
EBIDTA 36.7 (4.3) 80.1 16.0 16.9
Net Profi t 28.7 (6.6) 92.0 15.2 17.5
Return Ratios (%)
ROCE 16.3 14.3 25.7 26.3 26.7
RoIC 27.5 24.0 41.0 42.7 45.8
ROE 18.2 16.4 28.7 29.3 29.5
Turnover Ratios
Average collection period(days) 4.7 5.2 5.2 4.9 4.9
Average payment period (days) 8.7 9.7 9.2 9.0 9.0
Working Capital Cycle (days) 77.9 66.7 96.3 86.1 86.1
Per Share (Rs)
EPS 3.3 3.0 5.8 6.7 7.9
CEPS 4.4 4.3 7.5 8.6 9.9
Book Value 17.9 18.6 20.3 23.0 26.8
Dividend 2.0 2.0 3.5 3.5 3.5
Valuations (x)
PER 38.4 41.1 21.4 18.6 15.8
P/BV 7.0 6.7 6.1 5.4 4.7
EV/EBIDTA 22.1 23.4 12.9 11.2 9.3
EV/Sales 4.8 4.5 3.9 3.4 2.9
M-cap/Sales 5.0 4.6 4.0 3.5 3.1
Source: Company, Centrum Research Estimates
8/8/2019 Sector Update - Media
http://slidepdf.com/reader/full/sector-update-media 13/16
Please refer to important disclosures/disclaimers in Appendix A
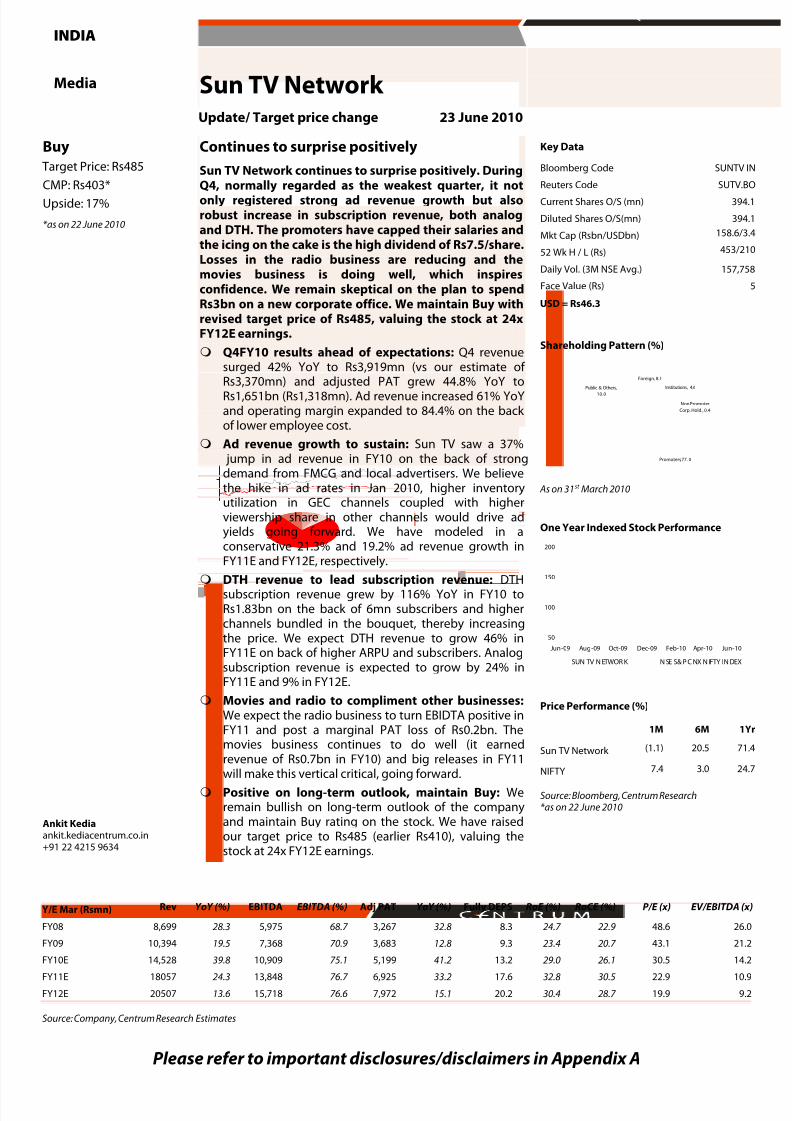
Buy
Target Price: Rs485
CMP: Rs403*Upside: 17%
*as on 22 June 2010
Ankit Kediaankit.kediacentrum.co.in+91 22 4215 9634
Continues to surprise positively
Sun TV Network continues to surprise positively. During
Q4, normally regarded as the weakest quarter, it notonly registered strong ad revenue growth but alsorobust increase in subscription revenue, both analogand DTH. The promoters have capped their salaries andthe icing on the cake is the high dividend of Rs7.5/share.Losses in the radio business are reducing and themovies business is doing well, which inspiresconfidence. We remain skeptical on the plan to spendRs3bn on a new corporate office. We maintain Buy withrevised target price of Rs485, valuing the stock at 24xFY12E earnings.
Q4FY10 results ahead of expectations: Q4 revenuesurged 42% YoY to Rs3,919mn (vs our estimate of
Rs3,370mn) and adjusted PAT grew 44.8% YoY toRs1,651bn (Rs1,318mn). Ad revenue increased 61% YoYand operating margin expanded to 84.4% on the back of lower employee cost.
Ad revenue growth to sustain: Sun TV saw a 37% jump in ad revenue in FY10 on the back of strongdemand from FMCG and local advertisers. We believethe hike in ad rates in Jan 2010, higher inventoryutilization in GEC channels coupled with higherviewership share in other channels would drive adyields going forward. We have modeled in aconservative 21.3% and 19.2% ad revenue growth inFY11E and FY12E, respectively.
DTH revenue to lead subscription revenue: DTHsubscription revenue grew by 116% YoY in FY10 toRs1.83bn on the back of 6mn subscribers and higherchannels bundled in the bouquet, thereby increasingthe price. We expect DTH revenue to grow 46% inFY11E on back of higher ARPU and subscribers. Analogsubscription revenue is expected to grow by 24% inFY11E and 9% in FY12E.
Movies and radio to compliment other businesses:We expect the radio business to turn EBIDTA positive inFY11 and post a marginal PAT loss of Rs0.2bn. Themovies business continues to do well (it earnedrevenue of Rs0.7bn in FY10) and big releases in FY11will make this vertical critical, going forward.
Positive on long-term outlook, maintain Buy: Weremain bullish on long-term outlook of the companyand maintain Buy rating on the stock. We have raisedour target price to Rs485 (earlier Rs410), valuing thestock at 24x FY12E earnings.
Key Data
Bloomberg Code SUNTV IN
Reuters Code SUTV.BO
Current Shares O/S (mn) 394.1
Diluted Shares O/S(mn) 394.1
Mkt Cap (Rsbn/USDbn) 158.6/3.4
52 Wk H / L (Rs) 453/210
Daily Vol. (3M NSE Avg.) 157,758
Face Value (Rs) 5
USD = Rs46.3
Shareholding Pattern (%)
Institutions, 4.6
Non Promoter
Corp. Hold., 0.4
Promoters, 77. 0
Public & Others,
10.0
Foreign, 8.1
As on 31st March 2010
One Year Indexed Stock Performance
50
100
150
200
Jun-09 Aug-09 Oct-09 Dec-09 Feb-10 Apr-10 Jun-10
SUN TV N ETWOR K N SE S& P C NX N IFTY IN DEX
Price Performance (%)
1M 6M 1Yr
Sun TV Network (1.1) 20.5 71.4
NIFTY 7.4 3.0 24.7
Source: Bloomberg, Centrum Research*as on 22 June 2010
Y/E Mar (Rsmn) Rev YoY (%) EBITDA EBITDA (%) Adj PAT YoY (%) Fully DEPS RoE (%) RoCE (%) P/E (x) EV/EBITDA (x)
FY08 8,699 28.3 5,975 68.7 3,267 32.8 8.3 24.7 22.9 48.6 26.0
FY09 10,394 19.5 7,368 70.9 3,683 12.8 9.3 23.4 20.7 43.1 21.2
FY10E 14,528 39.8 10,909 75.1 5,199 41.2 13.2 29.0 26.1 30.5 14.2
FY11E 18057 24.3 13,848 76.7 6,925 33.2 17.6 32.8 30.5 22.9 10.9
FY12E 20507 13.6 15,718 76.6 7,972 15.1 20.2 30.4 28.7 19.9 9.2
Source: Company, Centrum Research Estimates
Media
Update/ Target price change 23 June 2010
INDIA
Sun TV Network
8/8/2019 Sector Update - Media
http://slidepdf.com/reader/full/sector-update-media 14/16
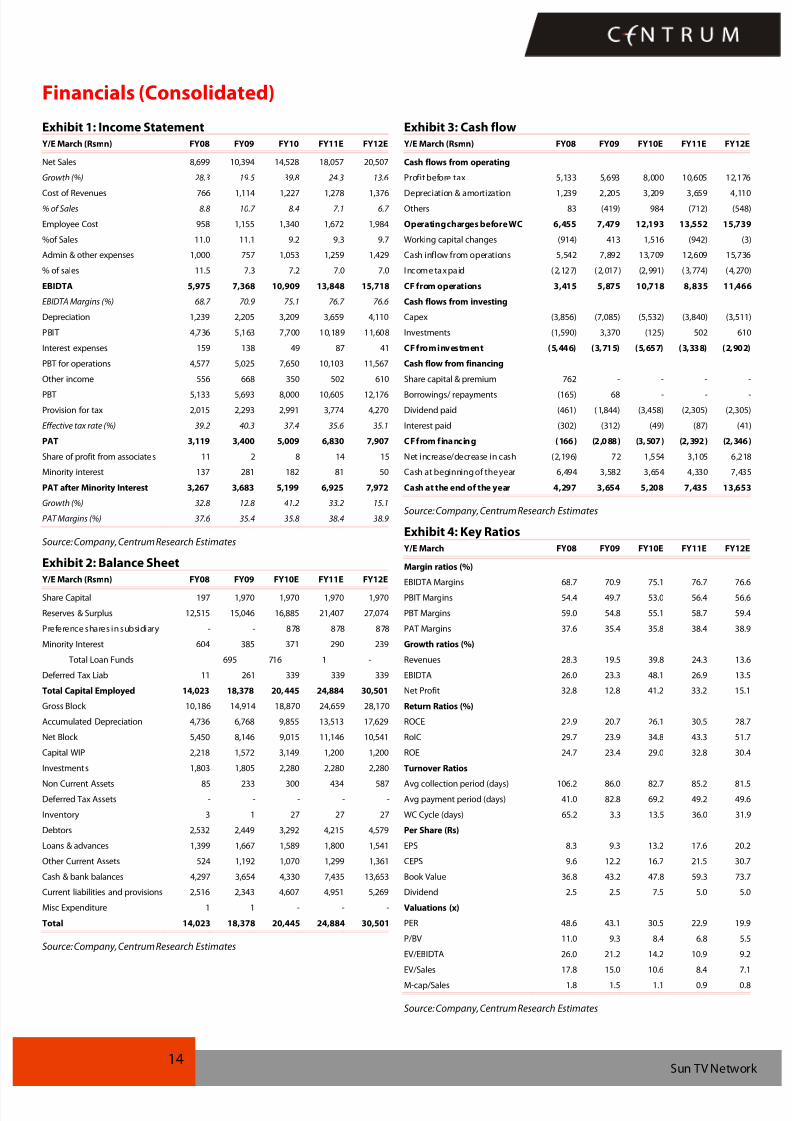
14Sun TV Network
Financials (Consolidated)
Exhibit 1: Income Statement
Y/E March (Rsmn) FY08 FY09 FY10 FY11E FY12E
Net Sales 8,699 10,394 14,528 18,057 20,507
Growth (%) 28.3 19.5 39.8 24.3 13.6
Cost of Revenues 766 1,114 1,227 1,278 1,376
% of Sales 8.8 10.7 8.4 7.1 6.7
Employee Cost 958 1,155 1,340 1,672 1,984
%of Sales 11.0 11.1 9.2 9.3 9.7
Admin & other expenses 1,000 757 1,053 1,259 1,429
% of sales 11.5 7.3 7.2 7.0 7.0
EBIDTA 5,975 7,368 10,909 13,848 15,718
EBIDTA Margins (%) 68.7 70.9 75.1 76.7 76.6
Depreciation 1,239 2,205 3,209 3,659 4,110
PBIT 4,736 5,163 7,700 10,189 11,608
Interest expenses 159 138 49 87 41
PBT for operations 4,577 5,025 7,650 10,103 11,567
Other income 556 668 350 502 610PBT 5,133 5,693 8,000 10,605 12,176
Provision for tax 2,015 2,293 2,991 3,774 4,270
Effective tax rate (%) 39.2 40.3 37.4 35.6 35.1
PAT 3,119 3,400 5,009 6,830 7,907
Share of profit from associates 11 2 8 14 15
Minority interest 137 281 182 81 50
PAT after Minority Interest 3,267 3,683 5,199 6,925 7,972
Growth (%) 32.8 12.8 41.2 33.2 15.1
PAT Margins (%) 37.6 35.4 35.8 38.4 38.9
Source: Company, Centrum Research Estimates
Exhibit 2: Balance Sheet
Y/E March (Rsmn) FY08 FY09 FY10E FY11E FY12E
Share Capital 197 1,970 1,970 1,970 1,970
Reserves & Surplus 12,515 15,046 16,885 21,407 27,074
Preference shares in subsidiary - - 878 878 878
Minority Interest 604 385 371 290 239
Total Loan Funds 695 716 1 - -
Deferred Tax Liab 11 261 339 339 339
Total Capital Employed 14,023 18,378 20,445 24,884 30,501
Gross Block 10,186 14,914 18,870 24,659 28,170
Accumulated Depreciation 4,736 6,768 9,855 13,513 17,629
Net Block 5,450 8,146 9,015 11,146 10,541
Capital WIP 2,218 1,572 3,149 1,200 1,200
Investments 1,803 1,805 2,280 2,280 2,280
Non Current Assets 85 233 300 434 587
Deferred Tax Assets - - - - -
Inventory 3 1 27 27 27
Debtors 2,532 2,449 3,292 4,215 4,579
Loans & advances 1,399 1,667 1,589 1,800 1,541
Other Current Assets 524 1,192 1,070 1,299 1,361
Cash & bank balances 4,297 3,654 4,330 7,435 13,653
Current liabilities and provisions 2,516 2,343 4,607 4,951 5,269
Misc Expenditure 1 1 - - -
Total 14,023 18,378 20,445 24,884 30,501
Source: Company, Centrum Research Estimates
Exhibit 3: Cash flow
Y/E March (Rsmn) FY08 FY09 FY10E FY11E FY12E
Cash flows from operating
Profit before tax 5,133 5,693 8,000 10,605 12,176
Depreciation & amortization 1,239 2,205 3,209 3,659 4,110
Others 83 (419) 984 (712) (548)
Operating charges before WC 6,455 7,479 12,193 13,552 15,739
Working capital changes (914) 413 1,516 (942) (3)
Cash inflow from operations 5,542 7,892 13,709 12,609 15,736
Income tax paid (2,127) (2,017) (2,991) (3,774) (4,270)
CF from operations 3,415 5,875 10,718 8,835 11,466
Cash flows from investing
Capex (3,856) (7,085) (5,532) (3,840) (3,511)
Investments (1,590) 3,370 (125) 502 610
CF from investment (5,446) (3,715) (5,657) (3,338) (2,902)
Cash flow from financing
Share capital & premium 762 - - - -Borrowings/ repayments (165) 68 - - -
Dividend paid (461) (1,844) (3,458) (2,305) (2,305)
Interest paid (302) (312) (49) (87) (41)
CF from financing (166) (2,088) (3,507) (2,392) (2,346)
Net increase/decrease in cash (2,196) 72 1,554 3,105 6,218
Cash at beginning of the year 6,494 3,582 3,654 4,330 7,435
Cash at the end of the year 4,297 3,654 5,208 7,435 13,653
Source: Company, Centrum Research Estimates
Exhibit 4: Key Ratios
Y/E March FY08 FY09 FY10E FY11E FY12E
Margin ratios (%)
EBIDTA Margins 68.7 70.9 75.1 76.7 76.6
PBIT Margins 54.4 49.7 53.0 56.4 56.6
PBT Margins 59.0 54.8 55.1 58.7 59.4
PAT Margins 37.6 35.4 35.8 38.4 38.9
Growth ratios (%)
Revenues 28.3 19.5 39.8 24.3 13.6
EBIDTA 26.0 23.3 48.1 26.9 13.5
Net Profit 32.8 12.8 41.2 33.2 15.1
Return Ratios (%)
ROCE 22.9 20.7 26.1 30.5 28.7
RoIC 29.7 23.9 34.8 43.3 51.7
ROE 24.7 23.4 29.0 32.8 30.4
Turnover Ratios
Avg collection period (days) 106.2 86.0 82.7 85.2 81.5
Avg payment period (days) 41.0 82.8 69.2 49.2 49.6
WC Cycle (days) 65.2 3.3 13.5 36.0 31.9
Per Share (Rs)
EPS 8.3 9.3 13.2 17.6 20.2
CEPS 9.6 12.2 16.7 21.5 30.7
Book Value 36.8 43.2 47.8 59.3 73.7
Dividend 2.5 2.5 7.5 5.0 5.0
Valuations (x)
PER 48.6 43.1 30.5 22.9 19.9
P/BV 11.0 9.3 8.4 6.8 5.5
EV/EBIDTA 26.0 21.2 14.2 10.9 9.2
EV/Sales 17.8 15.0 10.6 8.4 7.1
M-cap/Sales 1.8 1.5 1.1 0.9 0.8
Source: Company, Centrum Research Estimates

8/8/2019 Sector Update - Media
http://slidepdf.com/reader/full/sector-update-media 15/16
Appendix A
Disclaimer
Centrum Broking Pvt. Ltd. (“Centrum”) is a full-service, Stock Broking Company and a member of The Stock Exchange, Mumbai (BSE) and National Stock Exchange of India Ltd. (NSE). Ourholding company, Centrum Capital Ltd, is an investment banker and an underwriter of securities. As a group Centrum has Investment Banking, Advisory and other business relationshipswith a significant percentage of the companies covered by our Research Group. Our research professionals provide important inputs into the Group's Investment Banking and otherbusiness selection processes.
Recipients of this report should assume that our Group is seeking or may seek or will seek Investment Banking, advisory, project finance or other businesses and may receive commission,
brokerage, fees or other compensation from the company or companies that are the subject of this material/report. Our Company and Group companies and their officers, directors andemployees, including the analysts and others involved in the preparation or issuance of this material and their dependants, may on the date of this report or from, time to time have "long"or "short" positions in, act as principal in, and buy or sell the securities or derivatives thereof of companies mentioned herein. Centrum or its affiliates do not own 1% or more in the equity of this company Our sales people, dealers, traders and other professionals may provide oral or written market commentary or trading strategies to our clients that reflect opinions that arecontrary to the opinions expressed herein, and our proprietary trading and investing businesses may make investment decisions that are inconsistent with the recommendations expressedherein. We may have earlier issued or may issue in future reports on the companies covered herein with recommendations/ information inconsistent or different those made in this report.In reviewing this document, you should be aware that any or all of the foregoing, among other things, may give rise to or potential conflicts of interest. We and our Group may rely oninformation barriers, such as "Chinese Walls" to control the flow of information contained in one or more areas within us, or other areas, units, groups or affiliates of Centrum. Centrum or itsaffiliates do not make a market in the security of the company for which this report or any report was written. Further, Centrum or its affiliates did not make a market in the subjectcompany’s securities at the time that the research report was published.
This report is for information purposes only and this document/material should not be construed as an offer to sell or the solicitation of an offer to buy, purchase or subscribe to anysecurities, and neither this document nor anything contained herein shall form the basis of or be relied upon in connection with any contract or commitment whatsoever. This documentdoes not solicit any action based on the material contained herein. It is for the general information of the clients of Centrum. Though disseminated to clients simultaneously, not all clientsmay receive this report at the same time. Centrum will not treat recipients as clients by virtue of their receiving this report. It does not constitute a personal recommendation or take intoaccount the particular investment objectives, financial situations, or needs of individual clients. Similarly, this document does not have regard to the specific investment objectives, financialsituation/circumstances and the particular needs of any specific person who may receive this document. The securities discussed in this report may not be suitable for all investors. Thesecurities described herein may not be eligible for sale in all jurisdictions or to all categories of investors. The countries in which the companies mentioned in this report are organized mayhave restrictions on investments, voting rights or dealings in securities by nationals of other countries. The appropriateness of a particular investment or strategy will depend on aninvestor's individual circumstances and objectives. Persons who may receive this document should consider and independently evaluate whether it is suitable for his/ her/their particularcircumstances and, if necessary, seek professional/financial advice. Any such person shall be responsible for conducting his/her/their own investigation and analysis of the informationcontained or referred to in this document and of evaluating the merits and risks involved in the securities forming the subject matter of this document.
The projections and forecasts described in this report were based upon a number of estimates and assumptions and are inherently subject to significant uncertainties and contingencies.Projections and forecasts are necessarily speculative in nature, and it can be expected that one or more of the estimates on which the projections and forecasts were based will notmaterialize or will vary significantly from actual results, and such variances will likely increase over time. All projections and forecasts described in this report have been prepared solely bythe authors of this report independently of the Company. These projections and forecasts were not prepared with a view toward compliance with published guidelines or generallyaccented accounting principles. No independent accountants have expressed an opinion or any other form of assurance on these projections or forecasts. You should not regard theinclusion of the projections and forecasts described herein as a representation or warranty by or on behalf of the Company, Centrum, the authors of this report or any other person thatthese projections or forecasts or their underlying assumptions will be achieved. For these reasons, you should only consider the projections and forecasts described in this report aftercarefully evaluating all of the information in this report, including the assumptions underlying such projections and forecasts.
The price and value of the investments referred to in this document/material and the income from them may go down as well as up, and investors may realize losses on any investments.Past performance is not a guide for future performance. Future returns are not guaranteed and a loss of original capital may occur. Actual results may differ materially from those set forth inprojections. Forward-looking statements are not predictions and may be subject to change without notice. Centrum does not provide tax advice to its clients, and all investors are stronglyadvised to consult regarding any potential investment. Centrum and its affiliates accept no liabilities for any loss or damage of any kind arising out of the use of this report. Foreigncurrencies denominated securities are subject to fluctuations in exchange rates that could have an adverse effect on the value or price of or income derived from the investment. In addition,investors in securities such as ADRs, the value of which are influenced by foreign currencies effectively assume currency risk. Certain transactions including those involving futures, options,and other derivatives as well as non-investment-grade securities give rise to substantial risk and are not suitable for all investors. Please ensure that you have read and understood thecurrent risk disclosure documents before entering into any derivative transactions.
This report/document has been prepared by Centrum, based upon information available to the public and sources, believed to be reliable. No representation or warranty, express or impliedis made that it is accurate or complete. Centrum has reviewed the report and, in so far as it includes current or historical information, it is believed to be reliable, although its accuracy andcompleteness cannot be guaranteed. The opinions expressed in this document/material are subject to change without notice and have no obligation to tell you when opinions orinformation in this report change.
This report or recommendations or information contained herein do/does not constitute or purport to constitute investment advice in publicly accessible media and should not bereproduced, transmitted or published by the recipient. The report is for the use and consumption of the recipient only. This publication may not be distributed to the public used by thepublic media without the express written consent of Centrum. This report or any portion hereof may not be printed, sold or distributed without the written consent of Centrum.
This report has not been prepared by Centrum Securities LLC. However, Centrum Securities LLC has reviewed the report and, in so far as it includes current or historical information, it isbelieved to be reliable, although its accuracy and completeness cannot be guaranteed.
The distribution of this document in other jurisdictions may be restricted by law, and persons into whose possession this document comes should inform themselves about, and observe,any such restrictions. Neither Centrum nor its directors, employees, agents or representatives shall be liable for any damages whether direct or indirect, incidental, special or consequentialincluding lost revenue or lost profits that may arise from or in connection with the use of the information.
This document does not constitute an offer or invitation to subscribe for or purchase or deal in any securities and neither this document nor anything contained herein shall form the basis of any contract or commitment whatsoever. This document is strictly confidential and is being furnished to you solely for your information, may not be distributed to the press or other mediaand may not be reproduced or redistributed to any other person. The distribution of this report in other jurisdictions may be restricted by law and persons into whose possession this reportcomes should inform themselves about, and observe any such restrictions. By accepting this report, you agree to be bound by the fore going limitations. No representation is made that thisreport is accurate or complete.
The opinions and projections expressed herein are entirely those of the author and are given as part of the normal research activity of Centrum Broking and are given as of this date and aresubject to change without notice. Any opinion estimate or projection herein constitutes a view as of the date of this report and there can be no assurance that future results or events will beconsistent with any such opinions, estimate or projection.
This document has not been prepared by or in conjunction with or on behalf of or at the instigation of, or by arrangement with the company or any of its directors or any other person.Information in this document must not be relied upon as having been authorized or approved by the company or its directors or any other person. Any opinions and projections containedherein are entirely those of the authors. None of the company or its directors or any other person accepts any liability whatsoever for any loss arising from any use of this document or itscontents or otherwise arising in connection therewith.
Centrum and its affiliates have not managed or co-managed a public offering for the subject company in the preceding twelve months. Centrum and affiliates have not receivedcompensation from the companies mentioned in the report during the period preceding twelve months from the date of this report for service in respect of public offerings, corporatefinance, debt restructuring, investment banking or other advisory services in a merger/acquisition or some other sort of specific transaction.
As per the declaration given by him Mr Ankit Kedia analyst and the author of this report and/or any of his/her family members do not serve as an officer, director or are any way connected tothe company/companies mentioned in this report. Further, as declared by them, they have not received any compensation from the above companies in the preceding twelve months. Ourentire research professionals are our employees and are paid a salary. They do not have any other material conflict of interest of the research analyst or member of which the researchanalyst knows of has reason to know at the time of publication of the research report or at the time of the public appearance.
While we would endeavor to update the information herein on a reasonable basis, Centrum, it's associated companies, their directors and employees are under no obligation to update orkeep the information current. Also, there may be regulatory, compliance or other reasons that may prevent Centrum from doing so.
Non-rated securities indicate that rating on a particular security has been suspended temporarily and such suspension is in compliance with applicable regulations and/or Centrum policies,in circumstances where Centrum is acting in an advisory capacity to this company, or any certain other circumstances
8/8/2019 Sector Update - Media
http://slidepdf.com/reader/full/sector-update-media 16/16
Key to Centrum Investment Rankings
Buy: Expected outperform Nifty by>15%, Accumulate: Expected to outperform Nifty by +5 to 15%, Hold: Expected to outperformNifty by -5% to +5%, Reduce: Expected to underperform Nifty by 5 to 15%, Sell: Expected to underperform Nifty by>15%
Centrum Broking Private LimitedMember (NSE, BSE, MCX-SX), Depository Participant (CDSL) and SEBI registered Portfolio
Manager
Regn Nos
CAPITAL MARKET SEBI REGN. NO.: BSE: INB 011251130, NSE: INB231251134 DERIVATIVES SEBI REGN. NO.: NSE: INF 231251134 (TRADING & SELF CLEARING MEMBER)
CDSL DP ID: 12200. SEBI REGISTRATION NO.: IN-DP-CDSL-20-99 PMS REGISTRATION NO.: INP000000456
MCX – SX (Currency Derivative segment) REGN. NO.: INE 261251134
Website: www.centrum.co.in Investor Grievance Email ID: [email protected]
REGD. OFFICE AddressBombay Mutual Bldg.,2nd Floor, Dr. D. N. Road, Fort,
Mumbai - 400 001
Correspondence AddressCentrum House, 6th Floor, CST Road, Near Vidya Nagari Marg,
Kalina, Santacruz (E), Mumbai 400 098. Tel: (022) 4215 9000