it sector census main results 2015 edition - mbi.com.br · iso 29110 iso 900x moprosoft mps.br...
TRANSCRIPT

IT Sector CensusIT Sector CensusMain Results Main Results 2015 Edition2015 Edition
IntroductionIntroduction
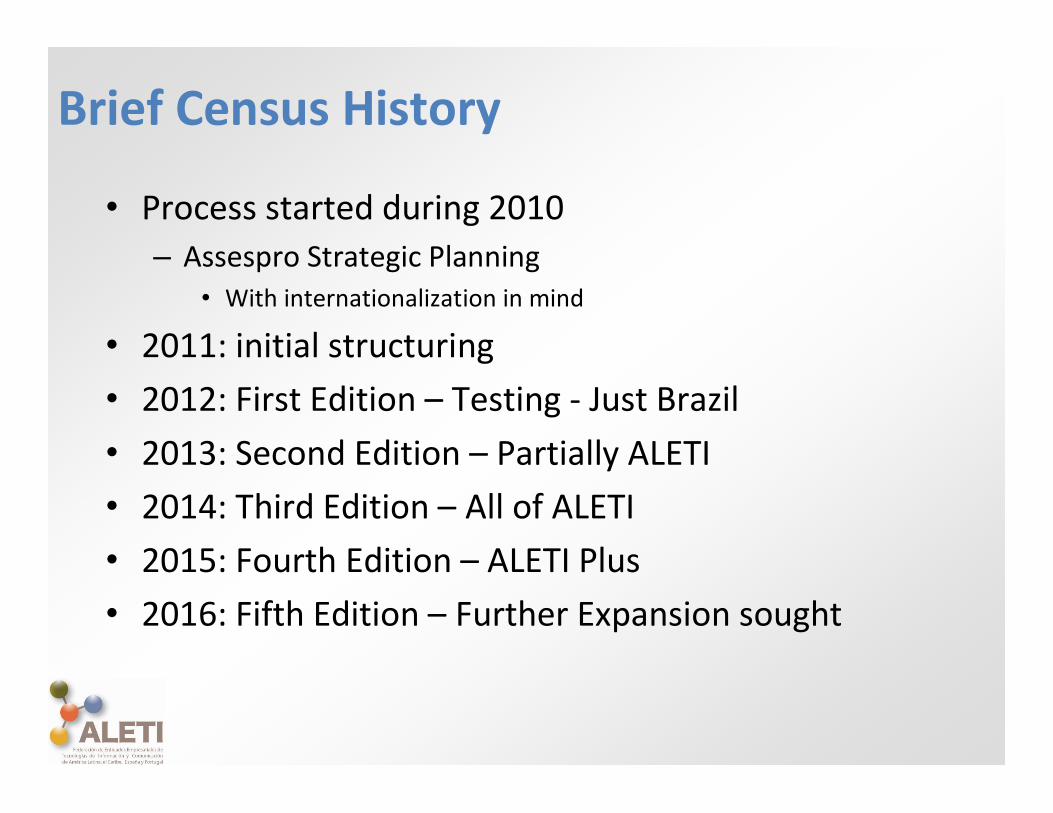
Brief Census History
• Process started during 2010– Assespro Strategic Planning
• With internationalization in mind
• 2011: initial structuring• 2012: First Edition – Testing - Just Brazil• 2013: Second Edition – Partially ALETI• 2014: Third Edition – All of ALETI• 2015: Fourth Edition – ALETI Plus• 2016: Fifth Edition – Further Expansion sought

2015 Participation
• 945 companies from 30 countries• 555 answers considered in this analysis
Latin America87,6%
Europe7,4%Africa
5,0%
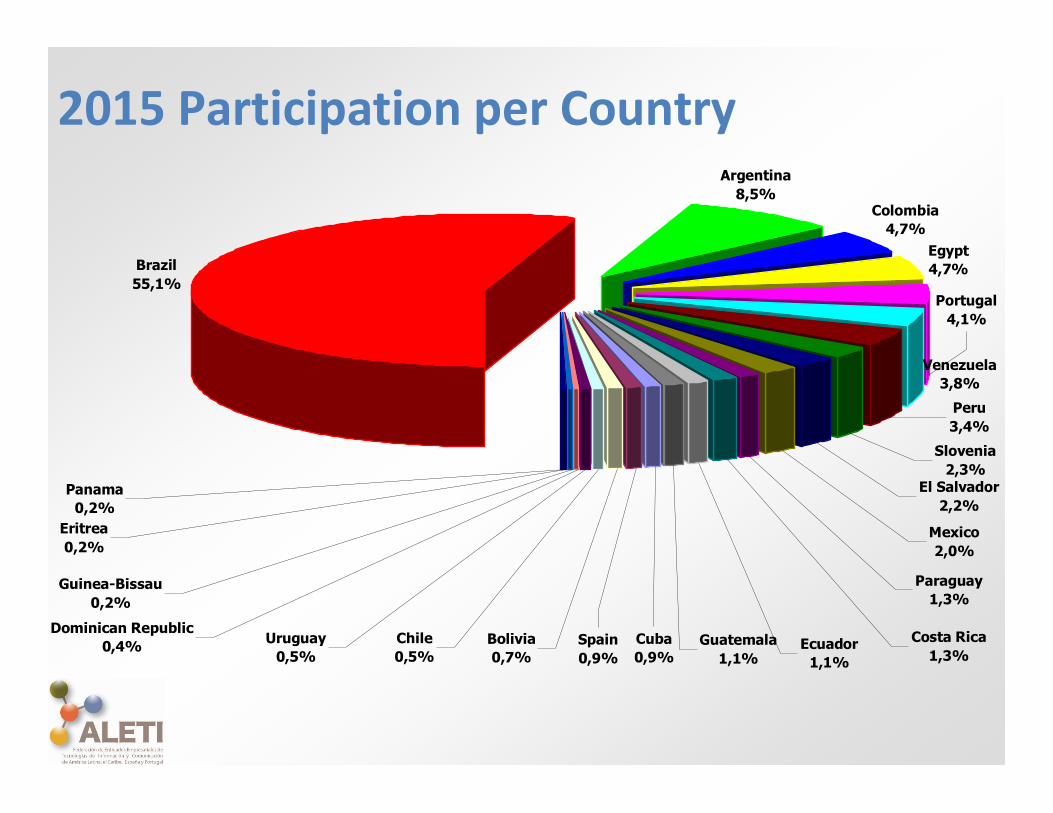
2015 Participation per Country
Brazil55,1%
Egypt4,7%
Slovenia2,3%
El Salvador2,2%
Mexico2,0%
Argentina8,5%
Colombia4,7%
Portugal4,1%
Venezuela3,8%
Eritrea0,2%
Guinea-Bissau0,2%
Panama0,2%
Dominican Republic0,4% Uruguay
0,5%Chile0,5%
Bolivia0,7%
Spain0,9%
Cuba0,9%
Guatemala1,1%
Ecuador1,1%
Costa Rica1,3%
Paraguay1,3%
Peru3,4%

Thanks to our sponsors
• Companies Sponsoring the IT Census
MBIwww.mbi.com.br
SurveyMonkeywww.surveymonkey.com
Companies' General ProfileCompanies' General Profile

Companies' Size (in revenue)0% 10% 20% 30% 40% 50% 60% 70% 80% 90% 100%
Africa
Europe
Latin America
More than USD 500 Million From USD 100M to 500 MillionFrom USD 50M to 100 Million From USD 20M to 50 MillionFrom USD 10M to 20 Million From USD 5M to 10 MillionFrom USD 1,8M to 5 Million From USD 600K to 1,8 MillionFrom USD 180K to 600 Thousand Up to USD 180K
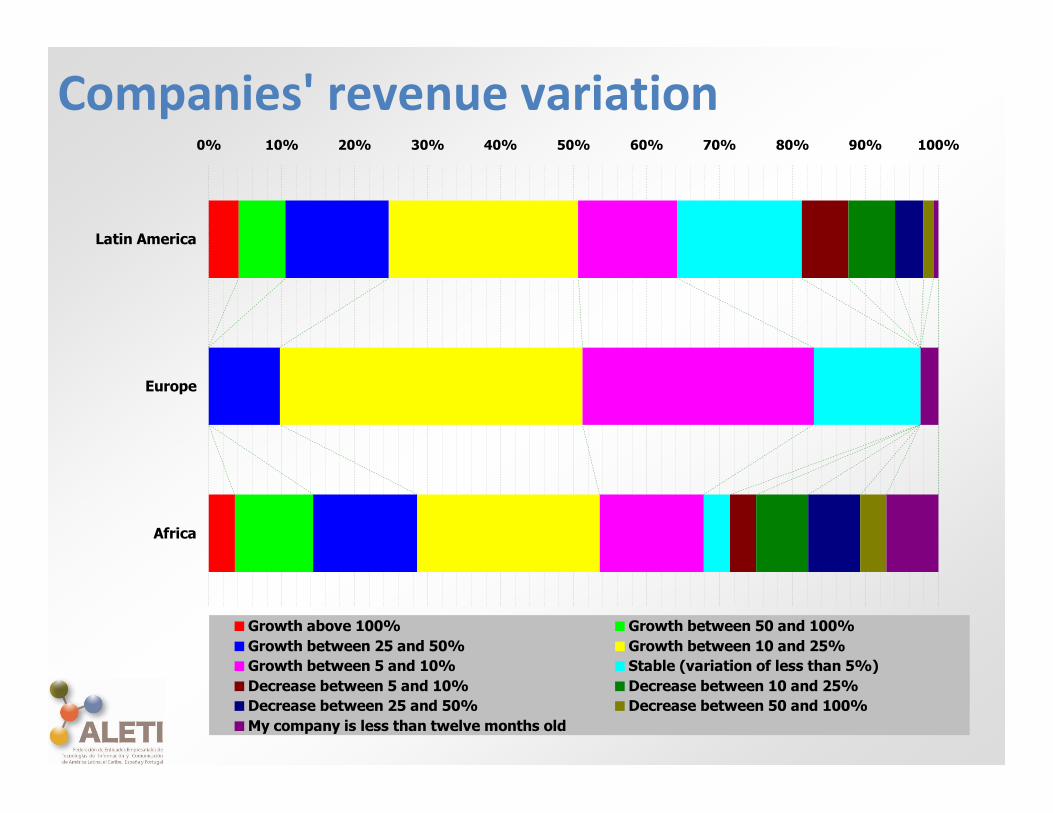
Companies' revenue variation0% 10% 20% 30% 40% 50% 60% 70% 80% 90% 100%
Africa
Europe
Latin America
Growth above 100% Growth between 50 and 100%Growth between 25 and 50% Growth between 10 and 25%Growth between 5 and 10% Stable (variation of less than 5%)Decrease between 5 and 10% Decrease between 10 and 25%Decrease between 25 and 50% Decrease between 50 and 100%My company is less than twelve months old
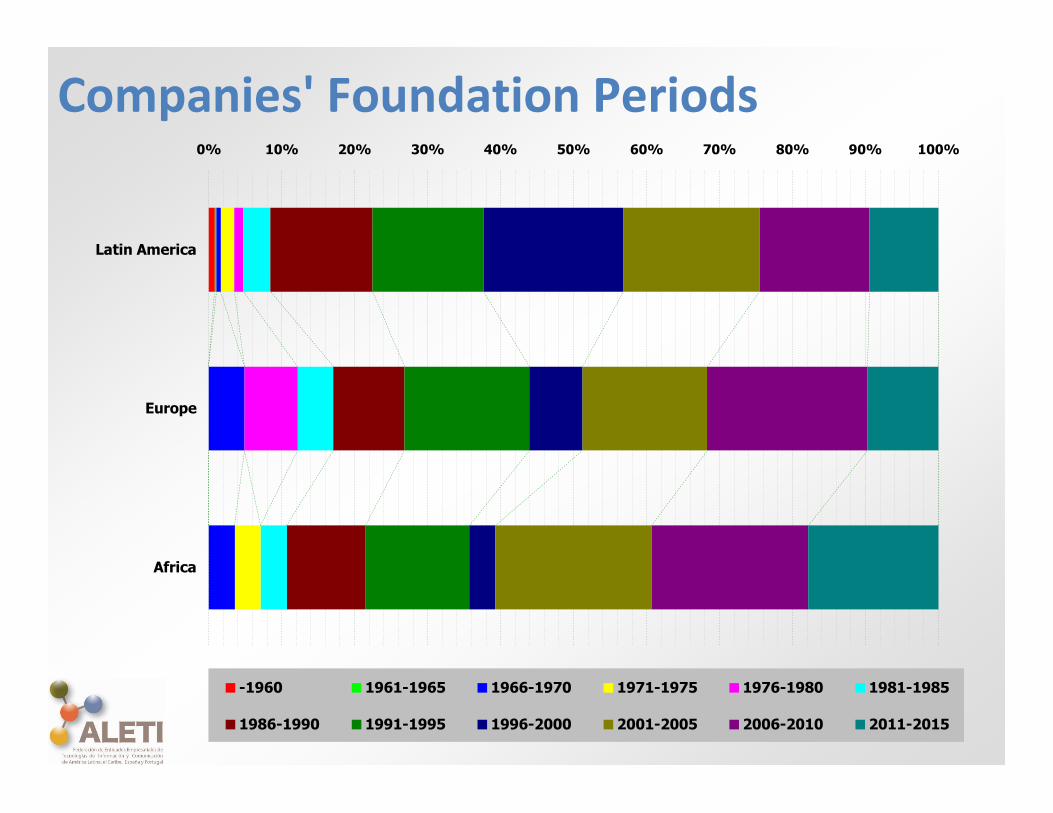
Companies' Foundation Periods0% 10% 20% 30% 40% 50% 60% 70% 80% 90% 100%
Africa
Europe
Latin America
-1960 1961-1965 1966-1970 1971-1975 1976-1980 1981-1985
1986-1990 1991-1995 1996-2000 2001-2005 2006-2010 2011-2015
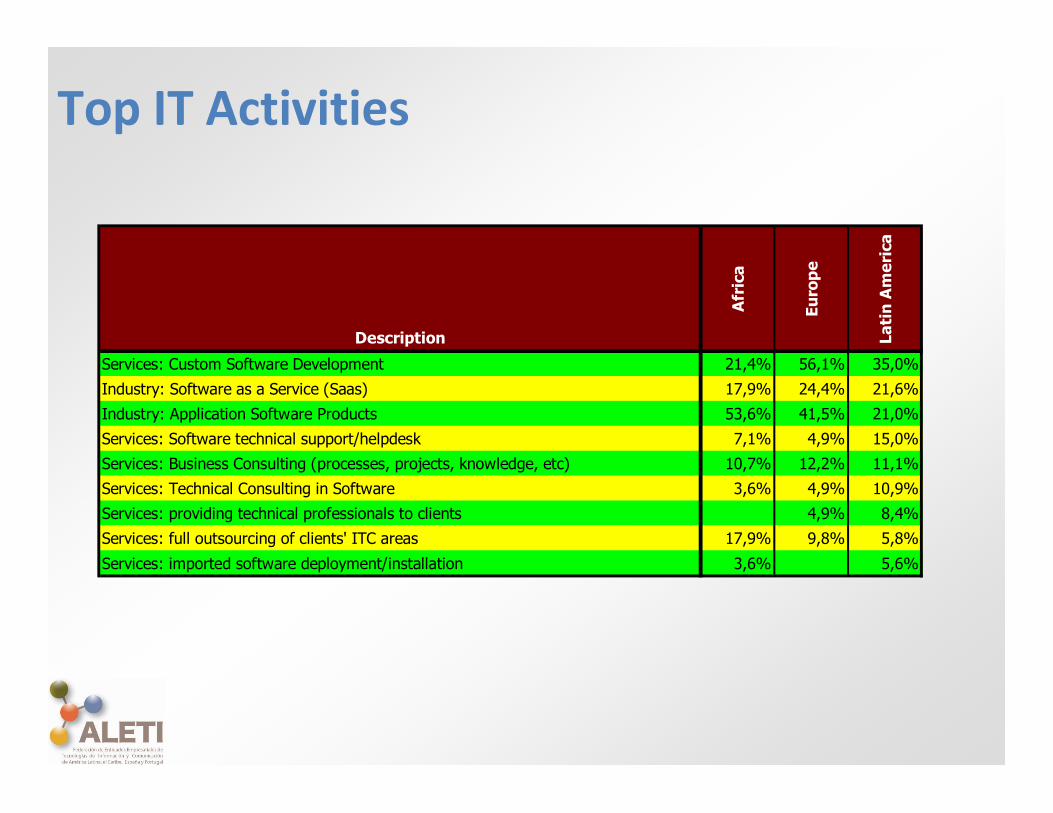
Top IT Activities
Description
Afri
ca
Euro
pe
Lati
n Am
eric
a
Services: Custom Software Development 21,4% 56,1% 35,0%Industry: Software as a Service (Saas) 17,9% 24,4% 21,6%Industry: Application Software Products 53,6% 41,5% 21,0%Services: Software technical support/helpdesk 7,1% 4,9% 15,0%Services: Business Consulting (processes, projects, knowledge, etc) 10,7% 12,2% 11,1%Services: Technical Consulting in Software 3,6% 4,9% 10,9%Services: providing technical professionals to clients 4,9% 8,4%Services: full outsourcing of clients' ITC areas 17,9% 9,8% 5,8%Services: imported software deployment/installation 3,6% 5,6%
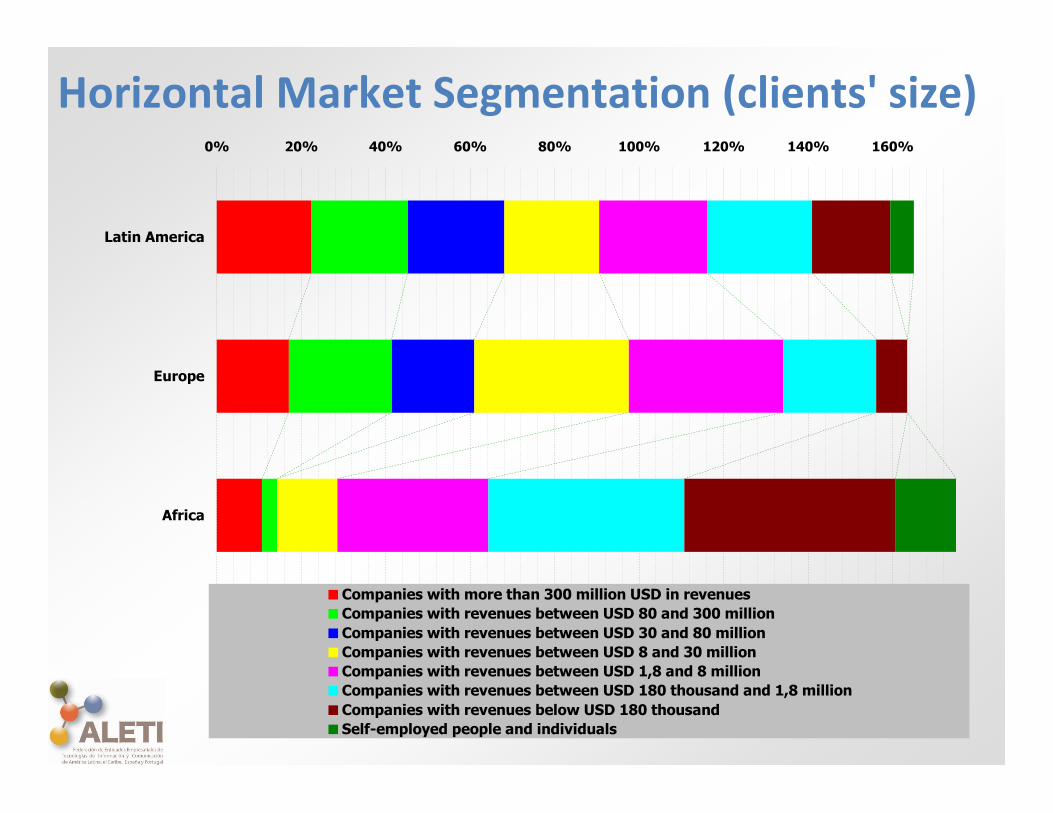
Horizontal Market Segmentation (clients' size)0% 20% 40% 60% 80% 100% 120% 140% 160%
Africa
Europe
Latin America
Companies with more than 300 million USD in revenuesCompanies with revenues between USD 80 and 300 millionCompanies with revenues between USD 30 and 80 millionCompanies with revenues between USD 8 and 30 millionCompanies with revenues between USD 1,8 and 8 millionCompanies with revenues between USD 180 thousand and 1,8 millionCompanies with revenues below USD 180 thousandSelf-employed people and individuals
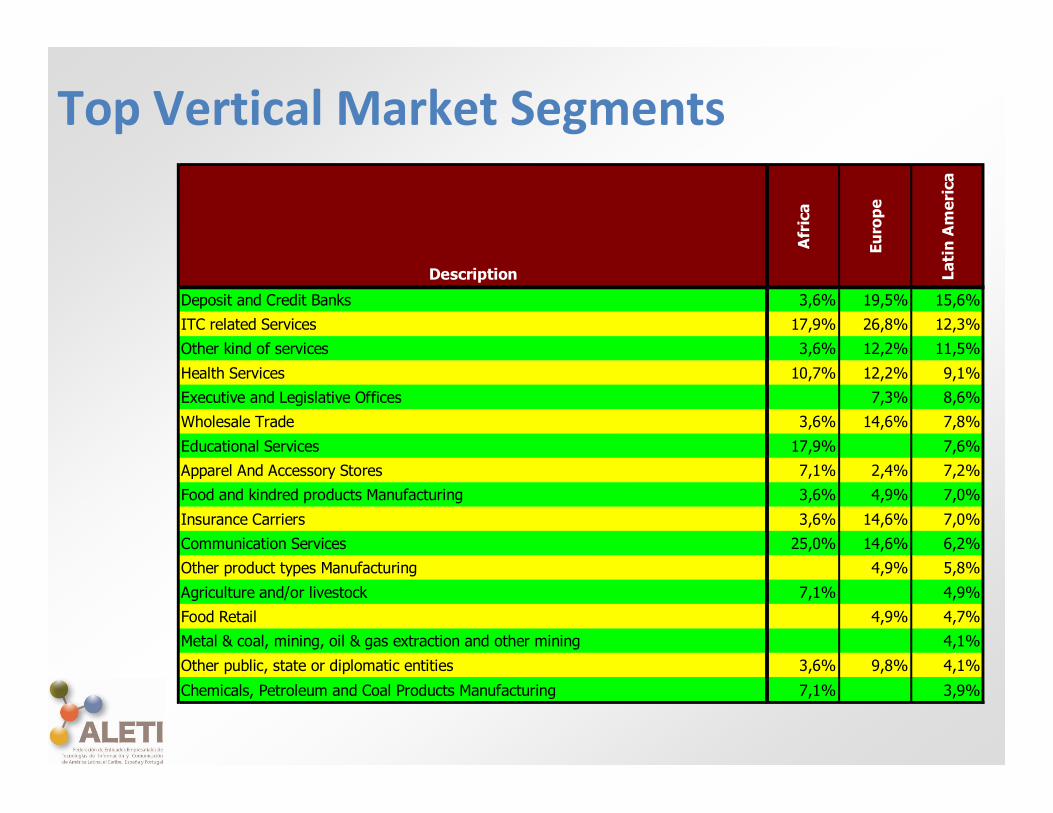
Top Vertical Market Segments
Description
Afric
a
Euro
pe
Lati
n Am
eric
a
Deposit and Credit Banks 3,6% 19,5% 15,6%ITC related Services 17,9% 26,8% 12,3%Other kind of services 3,6% 12,2% 11,5%Health Services 10,7% 12,2% 9,1%Executive and Legislative Offices 7,3% 8,6%Wholesale Trade 3,6% 14,6% 7,8%Educational Services 17,9% 7,6%Apparel And Accessory Stores 7,1% 2,4% 7,2%Food and kindred products Manufacturing 3,6% 4,9% 7,0%Insurance Carriers 3,6% 14,6% 7,0%Communication Services 25,0% 14,6% 6,2%Other product types Manufacturing 4,9% 5,8%Agriculture and/or livestock 7,1% 4,9%Food Retail 4,9% 4,7%Metal & coal, mining, oil & gas extraction and other mining 4,1%Other public, state or diplomatic entities 3,6% 9,8% 4,1%Chemicals, Petroleum and Coal Products Manufacturing 7,1% 3,9%
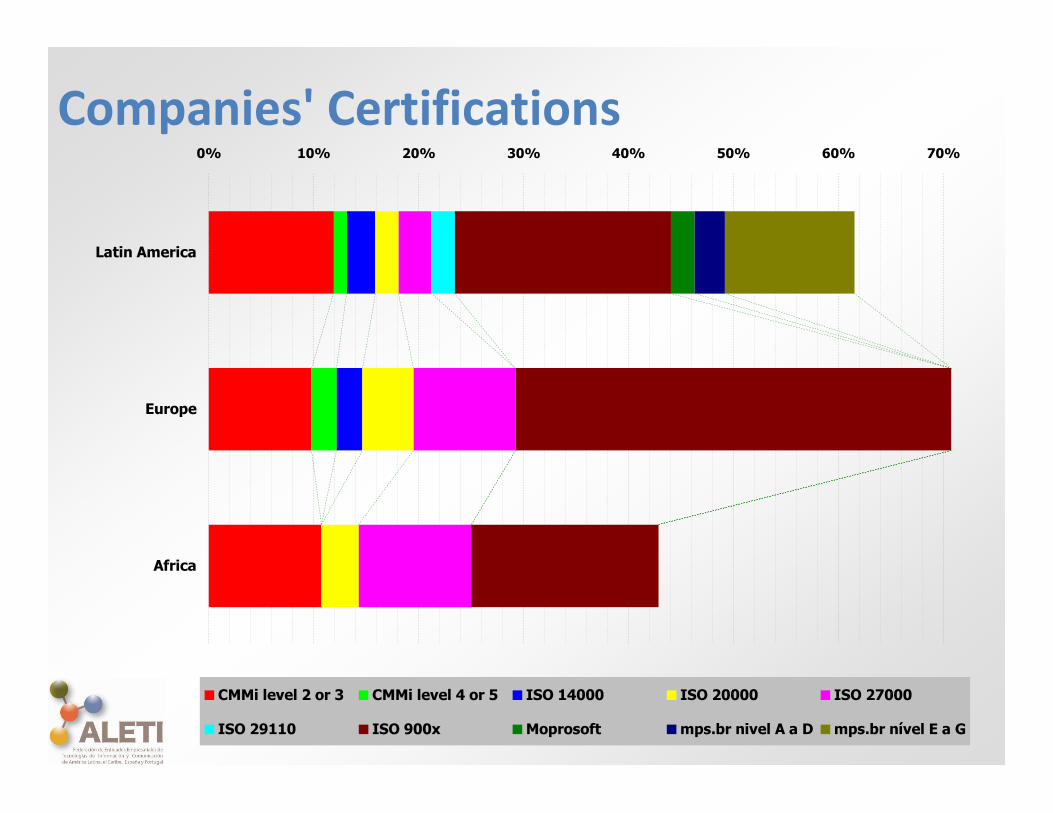
Companies' Certifications0% 10% 20% 30% 40% 50% 60% 70%
Africa
Europe
Latin America
CMMi level 2 or 3 CMMi level 4 or 5 ISO 14000 ISO 20000 ISO 27000
ISO 29110 ISO 900x Moprosoft mps.br nivel A a D mps.br nível E a G

Formal Partnerships
Description
Afri
ca
Euro
pe
Latin
Am
eric
a
Microsoft 21,4% 46,3% 35,2%Oracle/Sun 21,4% 29,3% 16,3%IBM 25,0% 19,5% 11,5%Dell 10,7% 4,9% 6,8%Cisco 10,7% 7,3% 6,2%HP 14,3% 14,6% 6,0%Amazon 2,4% 5,6%Google 7,3% 5,6%SAP 9,8% 5,3%VMWare 3,6% 7,3% 4,5%Adobe 3,6% 7,3% 4,1%Intel 3,6% 2,4% 3,7%Red Hat 3,6% 4,9% 3,5%Symantec 7,1% 2,4% 2,9%Redhat 3,6% 2,4% 2,5%EMC 14,3% 7,3% 2,3%Huawei 7,1% 4,9% 2,1%McAfee 3,6% 4,9% 2,1%Apple 1,9%
Financial AspectsFinancial Aspects
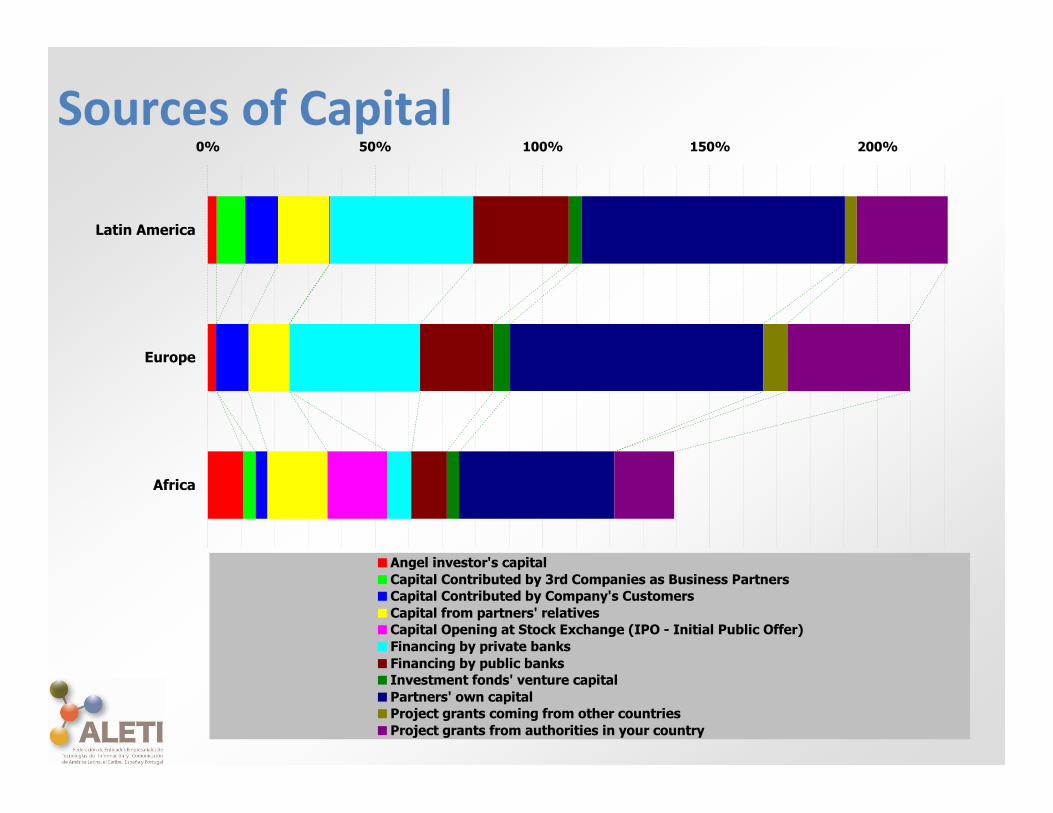
Sources of Capital0% 50% 100% 150% 200%
Africa
Europe
Latin America
Angel investor's capitalCapital Contributed by 3rd Companies as Business PartnersCapital Contributed by Company's CustomersCapital from partners' relativesCapital Opening at Stock Exchange (IPO - Initial Public Offer)Financing by private banksFinancing by public banksInvestment fonds' venture capitalPartners' own capitalProject grants coming from other countriesProject grants from authorities in your country
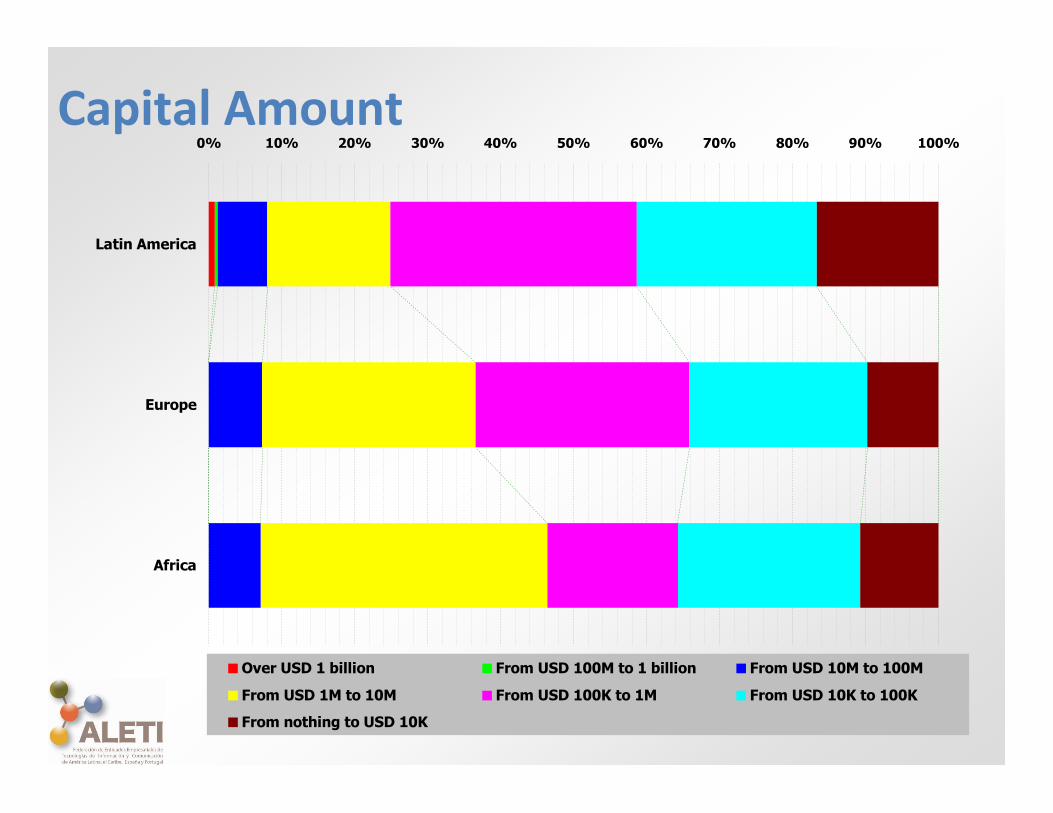
Capital Amount0% 10% 20% 30% 40% 50% 60% 70% 80% 90% 100%
Africa
Europe
Latin America
Over USD 1 billion From USD 100M to 1 billion From USD 10M to 100M
From USD 1M to 10M From USD 100K to 1M From USD 10K to 100K
From nothing to USD 10K
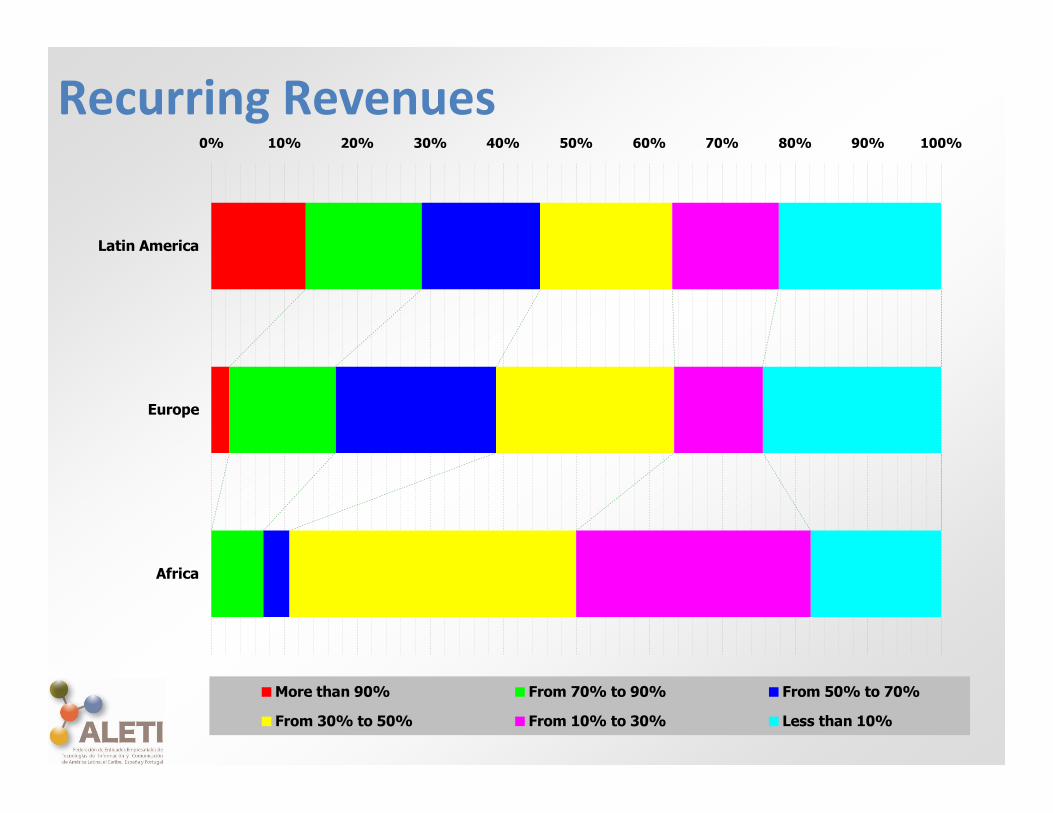
Recurring Revenues0% 10% 20% 30% 40% 50% 60% 70% 80% 90% 100%
Africa
Europe
Latin America
More than 90% From 70% to 90% From 50% to 70%
From 30% to 50% From 10% to 30% Less than 10%

Human ResourcesHuman Resources
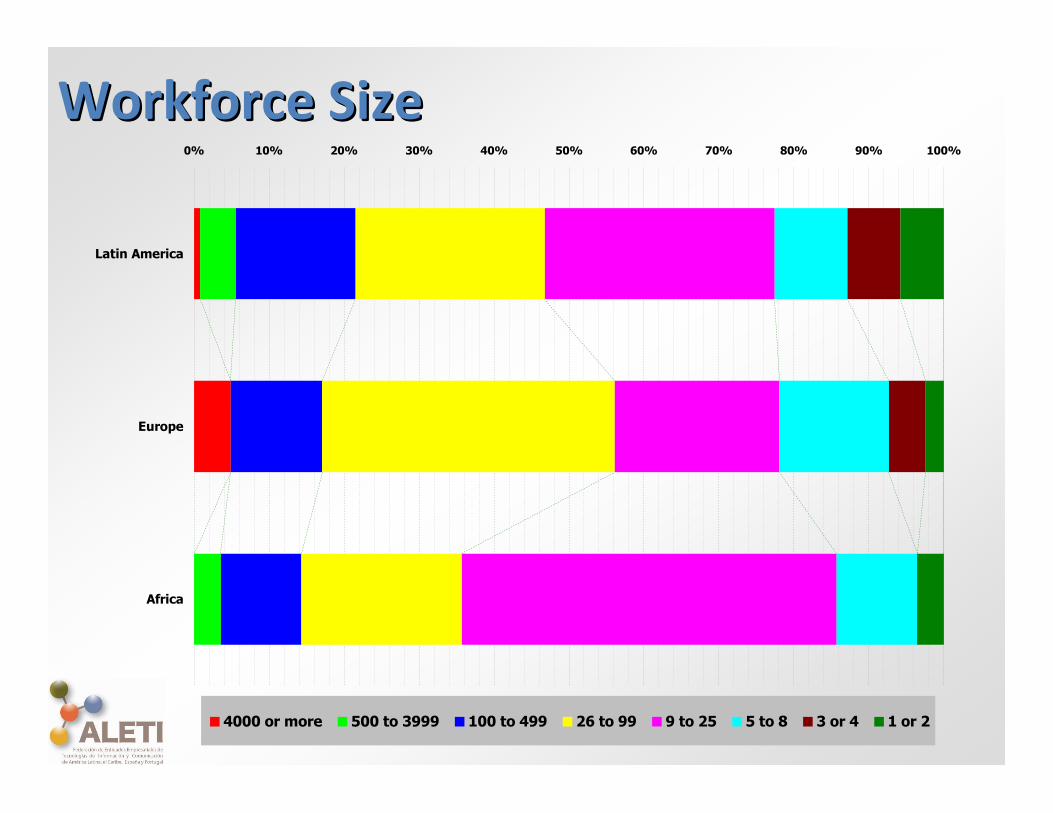
WorkWorkforceforce SizeSize0% 10% 20% 30% 40% 50% 60% 70% 80% 90% 100%
Africa
Europe
Latin America
4000 or more 500 to 3999 100 to 499 26 to 99 9 to 25 5 to 8 3 or 4 1 or 2
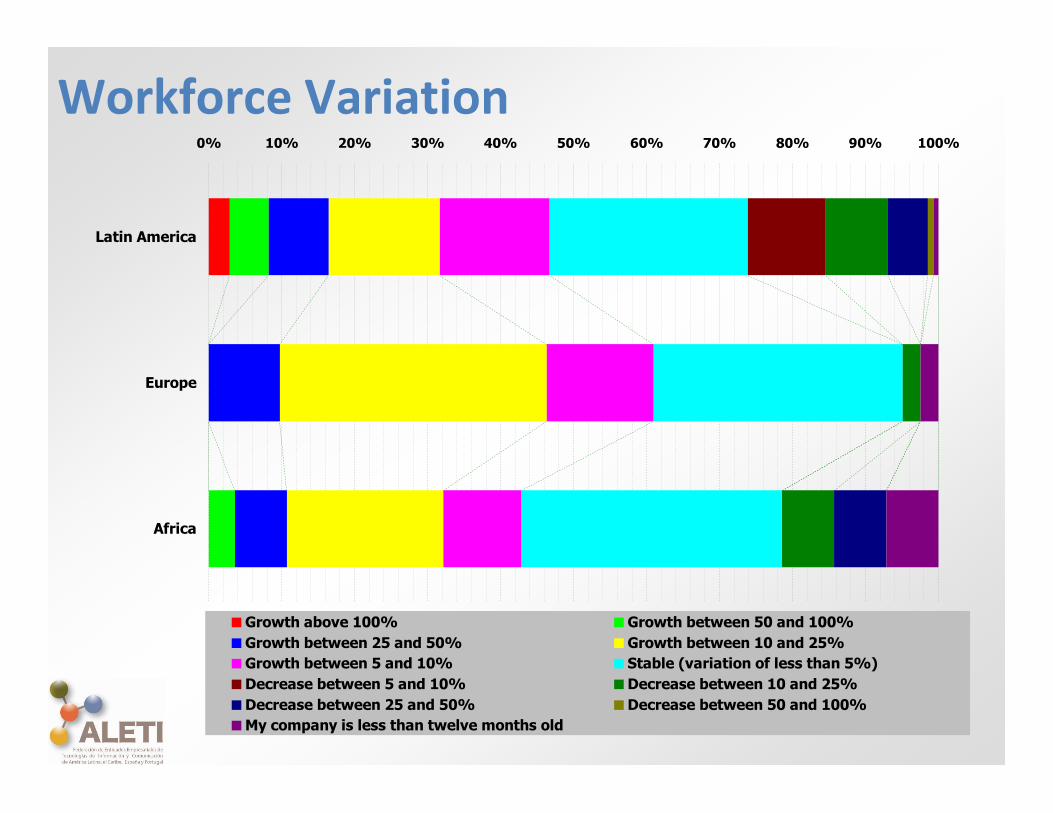
Workforce Variation0% 10% 20% 30% 40% 50% 60% 70% 80% 90% 100%
Africa
Europe
Latin America
Growth above 100% Growth between 50 and 100%Growth between 25 and 50% Growth between 10 and 25%Growth between 5 and 10% Stable (variation of less than 5%)Decrease between 5 and 10% Decrease between 10 and 25%Decrease between 25 and 50% Decrease between 50 and 100%My company is less than twelve months old

Technical Update Investment0% 10% 20% 30% 40% 50% 60% 70% 80% 90% 100%
Africa
Europe
Latin America
8% or more From 4% to 7,99% From 2% to 3,99%
From 1% to 1,99% From 0,5% to 0,99% Less than 0,5%

Technical AspectsTechnical Aspects
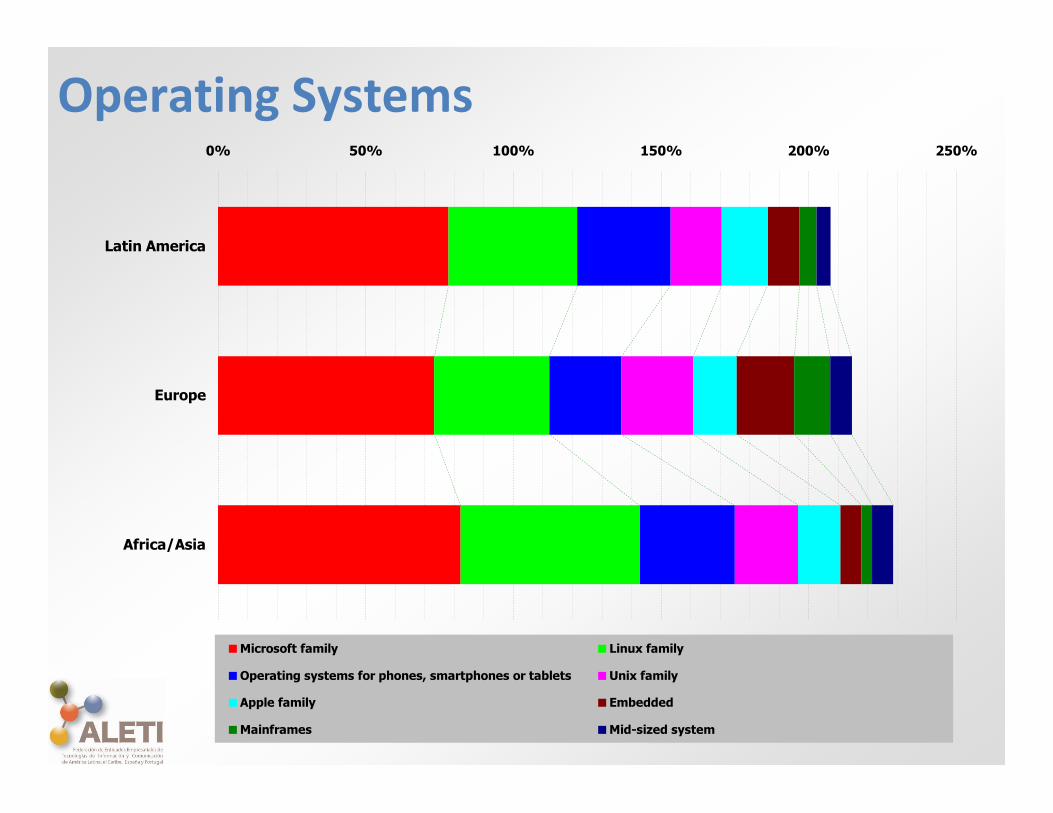
Operating Systems0% 50% 100% 150% 200% 250%
Africa/Asia
Europe
Latin America
Microsoft family Linux family
Operating systems for phones, smartphones or tablets Unix family
Apple family Embedded
Mainframes Mid-sized system
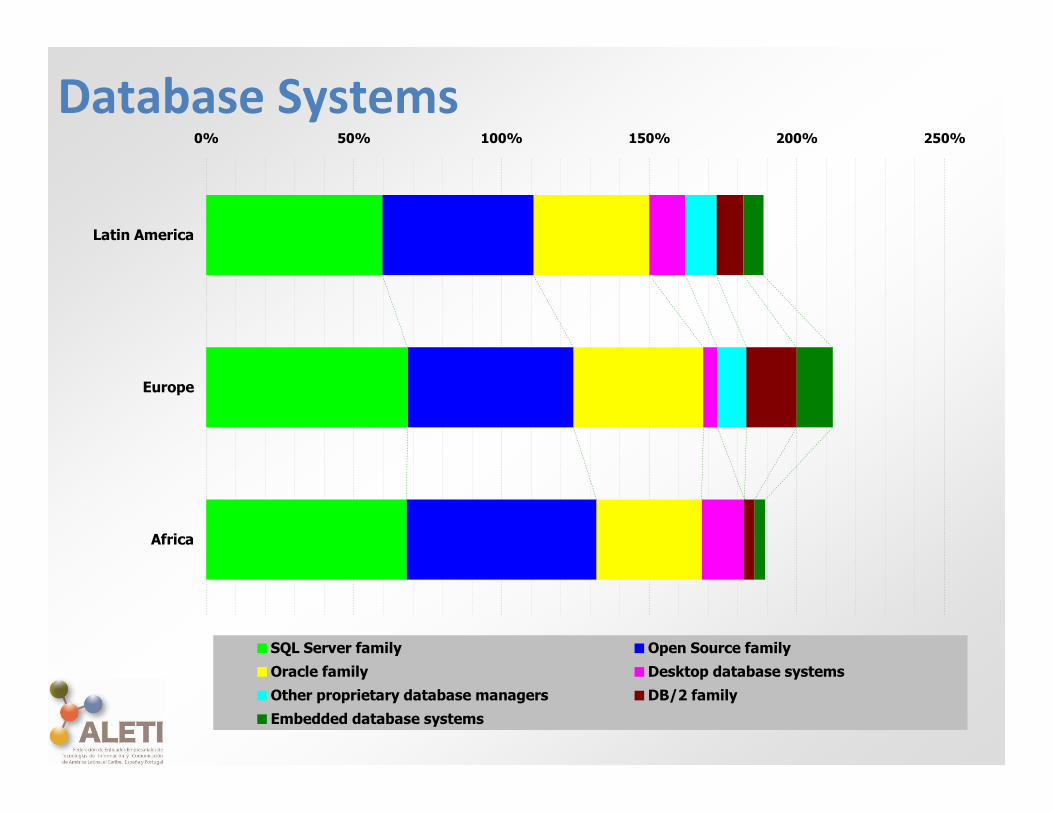
Database Systems0% 50% 100% 150% 200% 250%
Africa
Europe
Latin America
SQL Server family Open Source familyOracle family Desktop database systemsOther proprietary database managers DB/2 familyEmbedded database systems
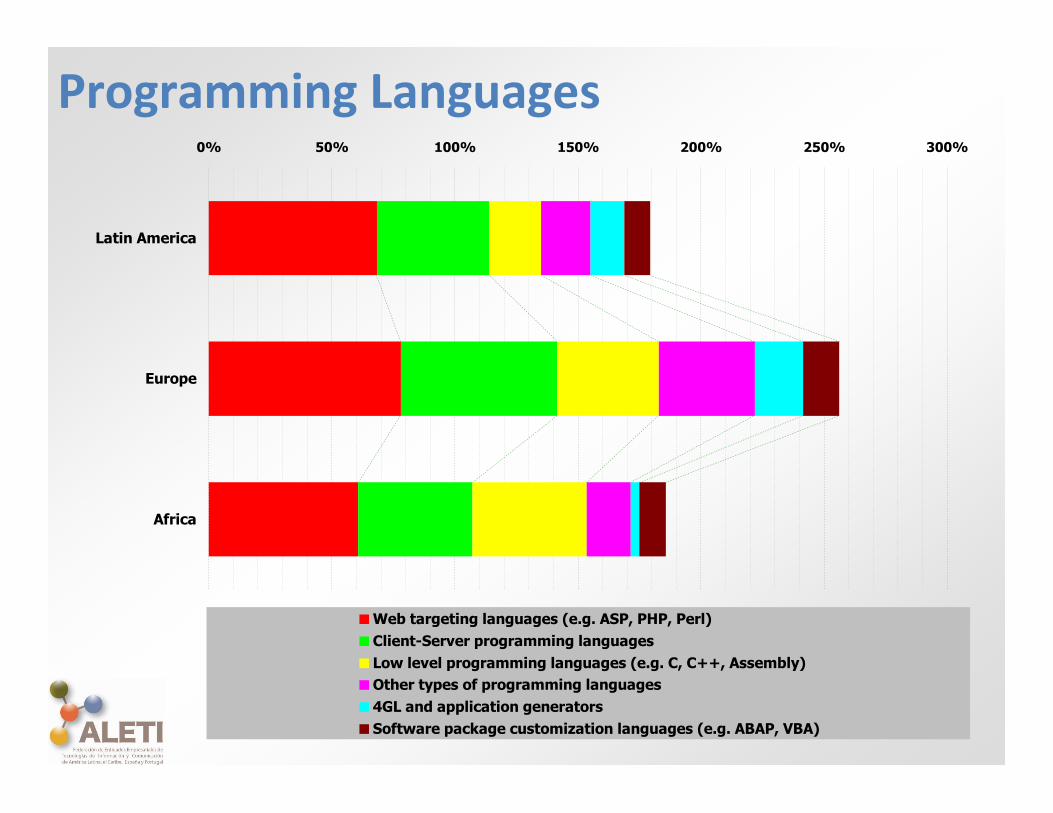
Programming Languages0% 50% 100% 150% 200% 250% 300%
Africa
Europe
Latin America
Web targeting languages (e.g. ASP, PHP, Perl)Client-Server programming languagesLow level programming languages (e.g. C, C++, Assembly)Other types of programming languages4GL and application generatorsSoftware package customization languages (e.g. ABAP, VBA)
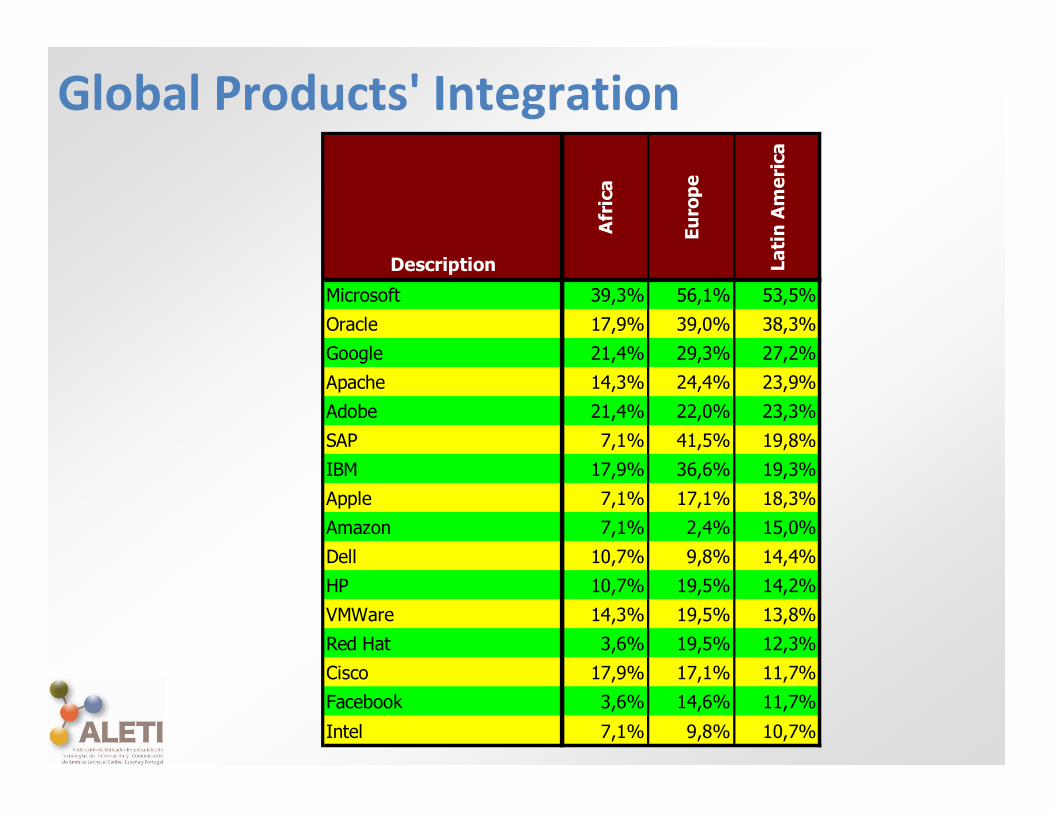
Global Products' Integration
Description
Afri
ca
Euro
pe
Latin
Am
eric
a
Microsoft 39,3% 56,1% 53,5%Oracle 17,9% 39,0% 38,3%Google 21,4% 29,3% 27,2%Apache 14,3% 24,4% 23,9%Adobe 21,4% 22,0% 23,3%SAP 7,1% 41,5% 19,8%IBM 17,9% 36,6% 19,3%Apple 7,1% 17,1% 18,3%Amazon 7,1% 2,4% 15,0%Dell 10,7% 9,8% 14,4%HP 10,7% 19,5% 14,2%VMWare 14,3% 19,5% 13,8%Red Hat 3,6% 19,5% 12,3%Cisco 17,9% 17,1% 11,7%Facebook 3,6% 14,6% 11,7%Intel 7,1% 9,8% 10,7%

ExportsExports

Export RevenuesExport Revenues0% 10% 20% 30% 40% 50% 60% 70% 80% 90% 100%
Africa
Europe
Latin America
More than 80% From 60 to 80% From 30 to 60% From 15 to 30% From 4 to 15%
From 1 to 4% From 0,25 to 1% Less than 0,25% Doesn't export

Exports' Variation0% 10% 20% 30% 40% 50% 60% 70% 80% 90% 100%
Africa
Europe
Latin America
Growth above 100% Growth between 50 and 100%Growth between 25 and 50% Growth between 10 and 25%Growth between 5 and 10% Stable (variation of less than 5%)Decrease between 5 and 10% Decrease between 10 and 25%Decrease between 25 and 50% Decrease between 50 and 100%

InnovationInnovation
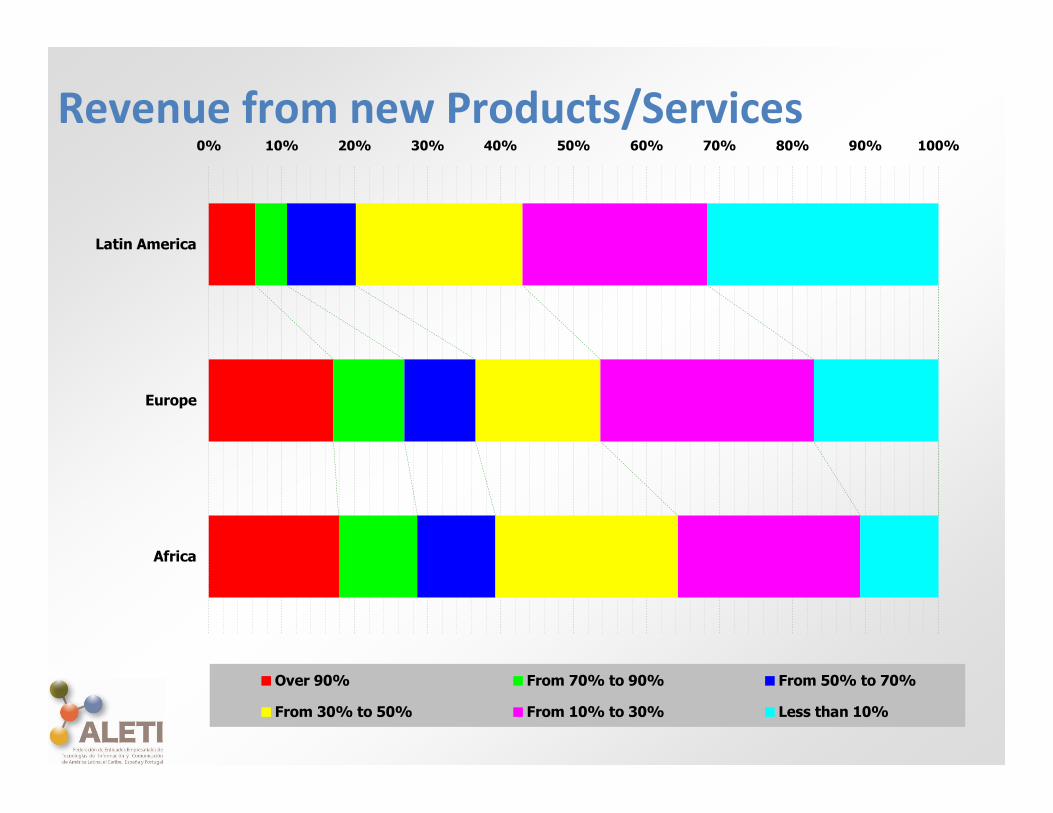
Revenue from new Products/Services0% 10% 20% 30% 40% 50% 60% 70% 80% 90% 100%
Africa
Europe
Latin America
Over 90% From 70% to 90% From 50% to 70%
From 30% to 50% From 10% to 30% Less than 10%
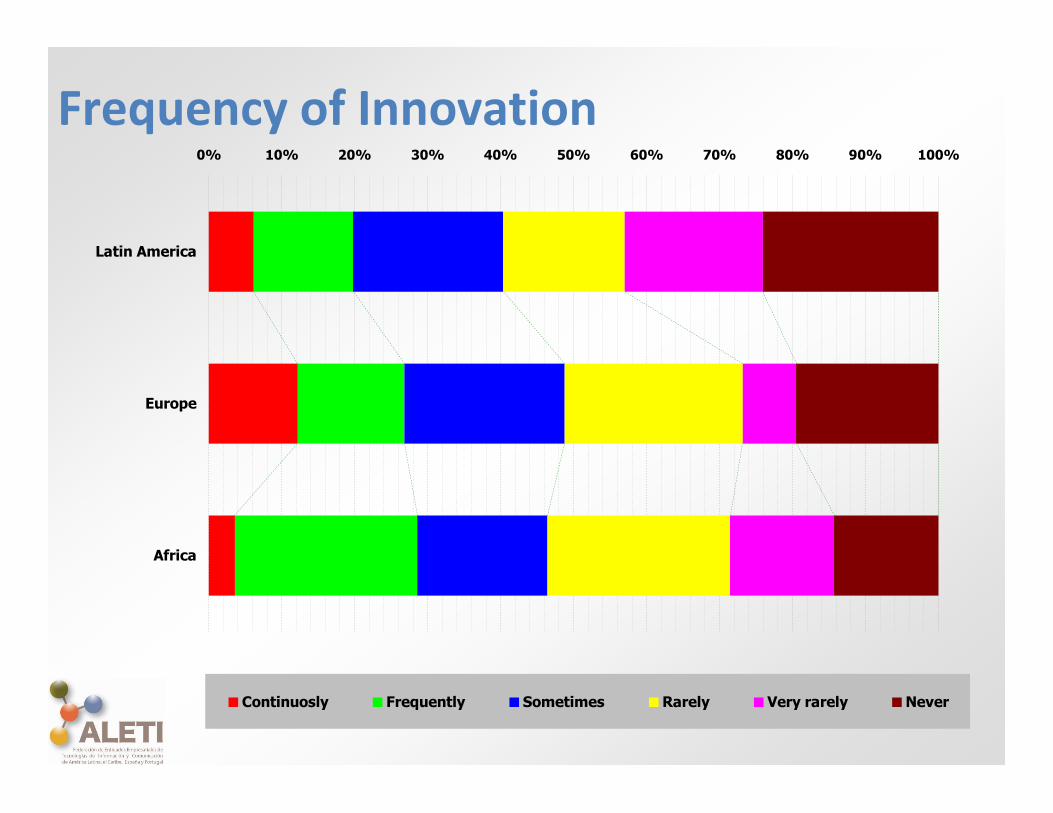
Frequency of Innovation0% 10% 20% 30% 40% 50% 60% 70% 80% 90% 100%
Africa
Europe
Latin America
Continuosly Frequently Sometimes Rarely Very rarely Never
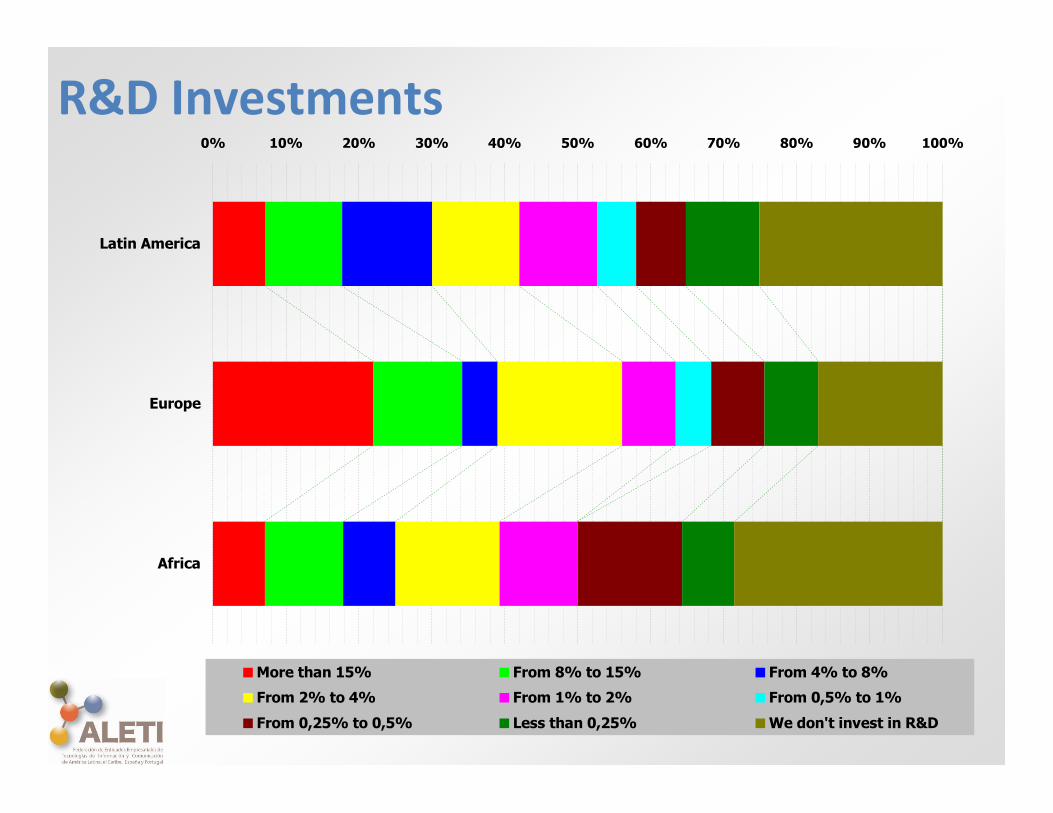
R&D Investments0% 10% 20% 30% 40% 50% 60% 70% 80% 90% 100%
Africa
Europe
Latin America
More than 15% From 8% to 15% From 4% to 8%From 2% to 4% From 1% to 2% From 0,5% to 1%From 0,25% to 0,5% Less than 0,25% We don't invest in R&D
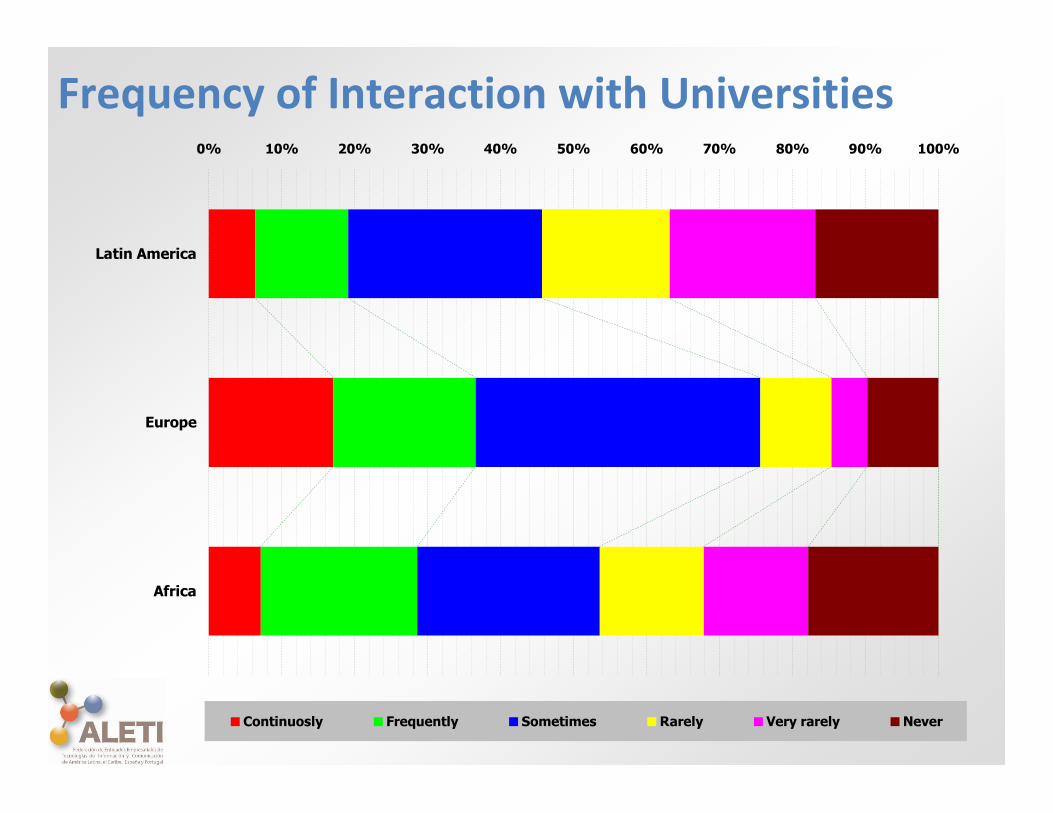
Frequency of Interaction with Universities0% 10% 20% 30% 40% 50% 60% 70% 80% 90% 100%
Africa
Europe
Latin America
Continuosly Frequently Sometimes Rarely Very rarely Never
IT Census inIT Census in--depthdepth
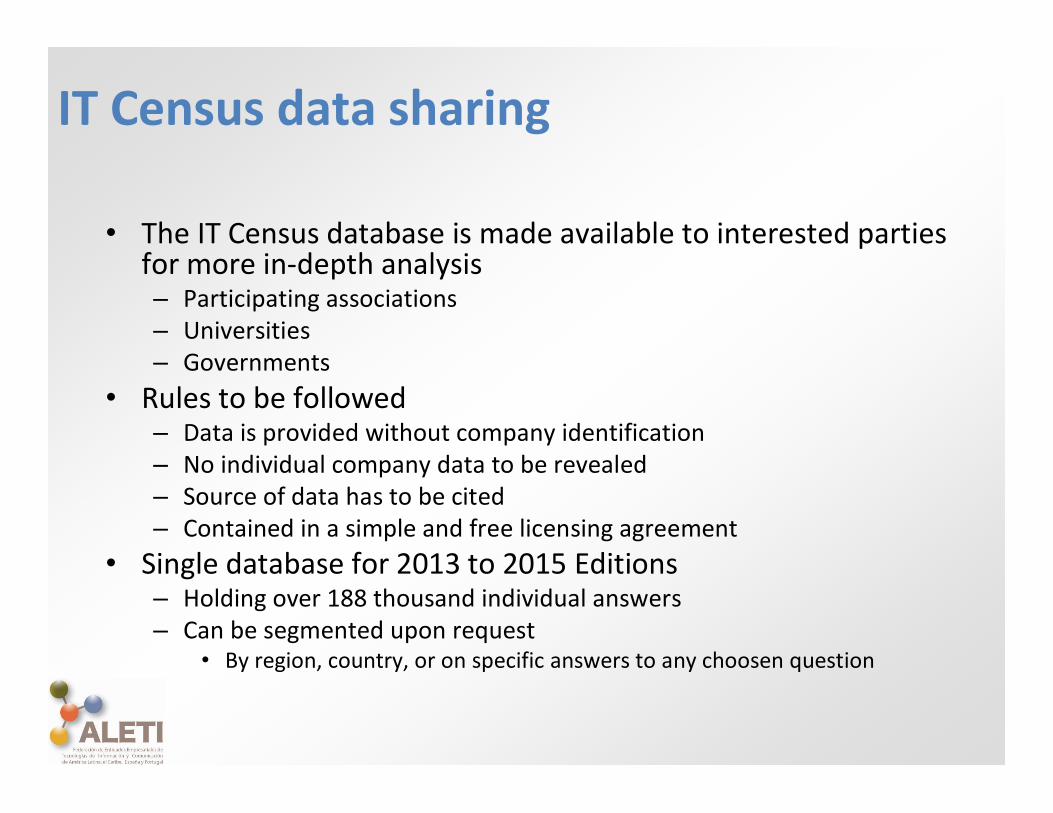
IT Census data sharing
• The IT Census database is made available to interested parties for more in-depth analysis– Participating associations– Universities– Governments
• Rules to be followed– Data is provided without company identification– No individual company data to be revealed– Source of data has to be cited– Contained in a simple and free licensing agreement
• Single database for 2013 to 2015 Editions– Holding over 188 thousand individual answers– Can be segmented upon request
• By region, country, or on specific answers to any choosen question