issue 3: value for money assessment - sestran · 1.3 structure of this task note ... 2.4 stagecoach...
TRANSCRIPT

Issue 3: Value for Money Assessment SEStran October 08 Final

Freedom of Information Act 2000
The TAS Partnership Limited regards the daily and hourly rates that are charged to clients, and the terms of engagement under which any projects are undertaken, as trade secrets, and therefore exempt from disclosure under the Act.
In many of the Reports and Task Notes we produce, The TAS Partnership Limited uses commercially or personally sensitive data provided under confidentiality agreements by third parties to inform projects, and disclosure of this information could constitute an actionable breach of confidence. The detailed content of such Reports and Task Notes is therefore likely to be exempt from disclosure under the Act.
Consequently, The TAS Partnership Limited will expect to be consulted before any content of our Reports and Task Notes is released under a Freedom of Information Act 2000 request.
Copyright
The contents of this document are copyright The TAS Partnership Ltd., with the exceptions set out below. Reproduction in any form, in part or in whole, is expressly forbidden without the written consent of a Director of The TAS Partnership Ltd.
Cartography derived from Ordnance Survey mapping is reproduced by permission of Ordnance Survey on behalf of the Controller of HMSO under licence number WL6576 and is © Crown Copyright – all rights reserved.
Other Crown Copyright material, including census data and mapping, policy guidance and official reports, is reproduced with the permission of the Controller of HMSO and the Queen’s Printer for Scotland under licence number C02W0002869.
Quality Assurance
DOCUMENT INFORMATION
Document Title
Issue 3: Value for Money Assessment
First Draft Created On Last Revision Saved On Name of File File Size Version (Revision) Number Total Prep & Editing Time (Minutes) To Date
04/01/2008 09:56:00 30/07/2008 11:32:00 20010 TN3 Issue 3 Fares Review.doc 3167232 kb 218 6938
QUALITY ASSURANCE Revision First Draft Prepared by Checked by Approved by Date 16/10/2008 LT/SW SW PT

©The TAS Partnership Limited ▪ October 08
Issue 3: Value for Money Assessment ▪ Contents ▪ 1
Contents
1 Introduction ..................................................................................5
1.1 Background.........................................................................................5
1.2 Methodology .......................................................................................7
1.3 Structure of this Task Note..................................................................11
2 Fares Structure ............................................................................ 13
2.1 Overview ..........................................................................................13
2.2 Lothian Buses....................................................................................13
2.3 First in Edinburgh...............................................................................14
2.4 Stagecoach Fife .................................................................................18
2.5 One Ticket Multi Operator and Multi Modal tickets ...................................21
2.6 Rail Tickets .......................................................................................32
2.7 PlusBus ............................................................................................33
2.8 Other Operators.................................................................................34
2.9 Advertising Fares and Ticketing............................................................35
2.10 Fares – Related Conditions on Secured Services .....................................41
2.11 Summary of Ticket Availability .............................................................45
3 Quality and Value for Money Assessment ......................................... 51
3.1 Introduction ......................................................................................51
3.2 Headline Quality Scores ......................................................................51
3.3 Generalised Journey Time ...................................................................53
4 Conclusions ................................................................................. 65
4.1 Overarching Findings ..........................................................................65
4.2 Pricing and Quality .............................................................................65
4.3 Delivering Quality and Value for Money .................................................66
4.4 Perceptions .......................................................................................67
4.5 Competition ......................................................................................68
4.6 Local Authority Influence.....................................................................68

©The TAS Partnership Limited ▪ October 08
Issue 3: Value for Money Assessment ▪ Introduction ▪ 5
Introduction 1
1.1 Background
1.1.1 This document is the third of four covering separate Issues for the SEStran Bus Initiatives project. It deals with Value for Money, assessing the different quality standards in the area and relating these to fares.
1.1.2 In order to evaluate this we undertook a mystery shopper survey of 243 journeys on a sample of routes by area, operator and distance. Journeys were rated against 32 criteria covering the total travel experience including waiting environment, vehicle presentation, information and driver standards.
1.1.3 It is critical to understand the role of price in the travel market. Price is a key component in two related areas:
a) The generation of passengers – the relative cost of bus fares, allied to the time spent accessing, waiting and travelling on the journey, when related to the cost/time of the car is a fundamental influencer of travel choice
Allied to which speed of boarding assists the speed and predictability of journey times
b) Revenue generated from fares is, naturally, is key to ensuring economic viability of operations (both commercial and secured).
1.1.4 Price therefore has to balance the need meet revenue targets while remaining attractive to users. Typically lowering a price will generate more passengers but not enough to generate the same revenue achievable with a higher price.
1.1.5 Benchmarking on price is not straightforward. There are several variables:
• Operator pricing policy, particularly the relationship between single and period tickets
• Levels of competition
• Population distribution along the route –
dense urban routes can generate their target revenue from many origin points along a relatively short route
routes from outlying communities may need to generate revenue from their outer extremity with unproductive mileage to the destination – and may have heavily peaked flows. Fares may therefore need to be higher to achieve revenue from fewer passengers
• Demographic profile – an above average elderly population may reduce the scope to generate revenue from fare paying passengers (and vice versa).
©The TAS Partnership Limited ▪ October 08
Issue 3: Value for Money Assessment ▪ Introduction ▪ 6
• Variation in operating costs.
• Economic conditions – a declining market may lead to higher fares to deliver the target revenue.
1.1.6 The above influences the realistic outcomes of this study. As price is critical to the industry model, bus operators naturally wish to retain full control of fare levels. It is therefore not realistic to expect fare reductions to arise from this study. In the bus users’ eyes there is a linkage between fares and quality – i.e. value for money. Our experience shows that bus users benchmark fare levels against the previous year’s prices for their regular journeys or others available locally, rather than comparative fare levels from other parts of the country. Likewise they are likely to respond to improvements in value for money on their route(s) and benchmarks with other local authorities may not be directly relevant to them.
1.1.7 Our analysis therefore focuses on assessing quality and measuring ‘Generalised Journey Time. This aims to normalise the components of a journey and therefore its relative attractiveness. The components are:
a) Access time – walk to bus stop
b) Waiting time – wait time at stop
c) Excess waiting time – delay caused by late running services
d) In vehicle time
e) Fare
f) Boarding penalty – reduced by quality score identified in our survey
1.1.8 Details of the method of calculation for these components are shown in chapter 3.
1.1.9 The outcomes of this analysis therefore highlight variances in the quality standard delivered. Transport law enshrines clear responsibilities for local authorities and bus operators in delivery of the bus product:
• Bus operators are responsible for route and timetable design, fare levels, vehicle standards and operational delivery
• Local authorities are responsible for highways, bus stops and shelters.
1.1.10 There are overlaps however – information can be operator led, authority led or shared and where partnership working is most effective each partner can feasible influence each other’s policies through co-ordinated investment. For example an authority may commit to highway investment on the proviso that an operator invests in higher quality vehicles.

©The TAS Partnership Limited ▪ October 08
Issue 3: Value for Money Assessment ▪ Introduction ▪ 7
1.1.11 Recommendations as to address poor value for money are covered in our summary final report.
1.2 Methodology
1.2.1 The methodology of the mystery shopper surveys is described in detail in Appendix A to Task Note 2. In summary for every journey made, the surveyor purchased a single fare (unless the driver recommended a cheaper option) and made notes on several aspects of each journey en route. This included scores for the correct fare, correct change and correct ticket issued. Once all trips were made, the survey data was collated and analysed so that comparisons could be drawn between different operators, journey distances and journey types. Mileages were measured using mapping software using routes as close to the bus route as possible.
1.2.2 The two surveyors covered a total of 278 journeys, scheduled between December 2007 and February 2008, to determine the range of single fares available across the SEStran area.
1.2.3 Thirty five of the scheduled journeys were not completed due to various reasons such as late running services, missed connections, missing journeys, surveyor error and weather problems. The remaining 243 journeys were successfully completed and these are analysed in this section of the report. A full list of journeys surveyed is included in Appendix A to Task Note 2.
1.2.4 Journeys were undertaken across all eight SEStran constituent council areas using a total of fifteen different bus operators. They ranged in distance from under one mile to over 95 miles for a single journey. In all cases our surveyor asked for a single ticket and in the vast majority of cases this is what was issued, although there were some cases where drivers issued alternative, better value tickets without prompting. These included two return tickets on Stagecoach Fife’s Edinburgh express services and one through ticket issued by Munro’s of Jedburgh for two connecting journeys.
1.2.5 From fleet data we estimated an approximate market share in each local authority area. Our aim was to represent this proportion in the surveys as closely as possible, but skewed slightly toward those areas where there is a high proportion of independent operators. In those areas with a small number of services run by independent operators, we attempted to achieve at least one sample journey on each operator. Edinburgh had a sample lower than its market share as we decided to attempt as wide a range of coverage as possible in preference to undertaking multiple journeys within Edinburgh where the flat fare applies.
1.2.6 The majority of journeys were planned using the Traveline website1and the operators’ own websites. The desired mix of journeys involved using as many
1 www.travelinescotland.com

©The TAS Partnership Limited ▪ October 08
Issue 3: Value for Money Assessment ▪ Introduction ▪ 8
different operators as possible over a wide range of distances. Journeys that people were likely to make, such as travelling to hospitals, employment centres, retail developments and universities, were included across all eight constituent council areas.
1.2.7 Problems were encountered when trying to achieve the right balance of sensible connection times between trips for the surveyor and using a range of different operators. This proved especially difficult in the Scottish Borders, as services are less frequent and often designed to have short connection times in order to provide through trips and ticketing between towns. A particular journey planning problem involved the naming of specific destinations on Traveline, including the distinction of street names in Edinburgh’s New Town and Old Town and the format that Bo’ness, near Falkirk, was entered in. These are all difficulties which the general public would face.
1.2.8 Figure A shows the journeys surveyed, broken down by the council area in which the bus was boarded. The major population centres of Edinburgh and Fife account for just over half of all trips and the three Lothian councils account for a further 26% of journeys.
Figure A: Breakdown of Journeys Surveyed by Council Area2
Borders11.9%
Fife21.8%
Midlothian9.1%
West Lothian8.2%
Outside SEStran1.2%
Clackmannanshire2.9%
Falkirk6.2%
Edinburgh29.6%
East Lothian9.1%
1.2.9 Table 1 relates our survey to number of vehicles based in each district as a proxy for market share.
2 Measured by counting both boarding and alighting points.

©The TAS Partnership Limited ▪ October 08
Issue 3: Value for Money Assessment ▪ Introduction ▪ 9
Table 1: Comparison of Market Share by Vehicle with Survey Percentages
LA Area3 Buses %ge Surveys %ge Difference
Borders 175 11% 29 12% 1%
Midlothian 89 6% 22 9% 3%
East Lothian 68 4% 22 9% 5%
West Lothian 200 13% 20 8% -5%
Falkirk 96 6% 15 6% 0%
Clackmannanshire 26 2% 7 3% 1%
Fife 359 23% 53 22% -1%
Edinburgh 540 35% 72 30% -5%
Total 1,553 243
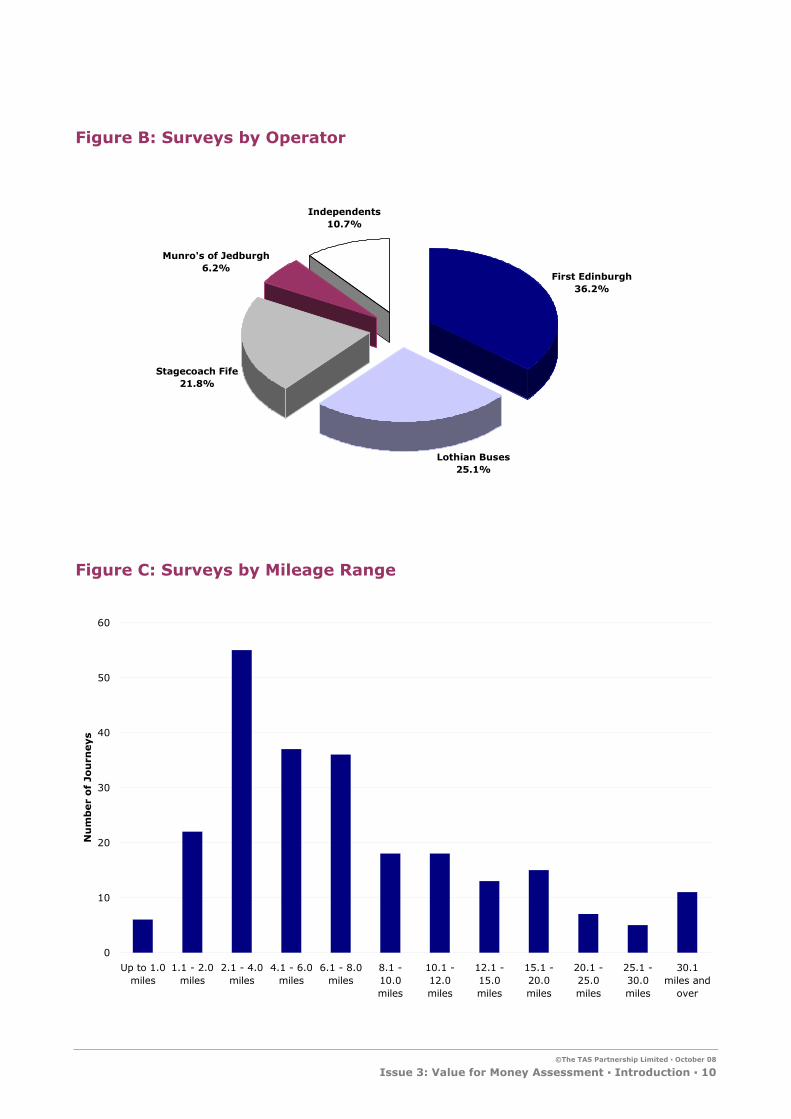
1.2.10 Table 2 summarises the surveys by operator and journey length with a summary by operator in Figure B and distance in Figure C.
Table 2: Analysis of Surveys by Operator and Journey Length
Distance Band First Lothian Munro's Stagecoach Others Total
Up to 1.0 miles 1 2 0 1 2 6
1.1 - 2.0 miles 8 8 1 5 0 22
2.1 - 4.0 miles 16 20 4 10 5 55
4.1 - 6.0 miles 14 14 1 5 3 37
6.1 - 8.0 miles 14 10 1 8 3 36
8.1 - 10.0 miles 5 6 2 2 3 18
10.1 - 12.0 miles 10 1 1 4 2 18
12.1 - 15.0 miles 4 0 0 7 2 13
15.1 - 20.0 miles 5 0 2 3 5 15
20.1 - 25.0 miles 3 0 0 4 0 7
25.1 - 30.0 miles 2 0 2 1 0 5
30.1 miles & over 6 0 1 3 1 11
Grand Total 88 61 15 53 26 243
3 Includes estimates for areas where vehicle allocation and service delivery are in different local authority areas
©The TAS Partnership Limited ▪ October 08
Issue 3: Value for Money Assessment ▪ Introduction ▪ 10
Figure B: Surveys by Operator
First Edinburgh36.2%
Lothian Buses25.1%
Independents10.7%
Munro's of Jedburgh6.2%
Stagecoach Fife21.8%
Figure C: Surveys by Mileage Range
0
10
20
30
40
50
60
Up to 1.0miles
1.1 - 2.0miles
2.1 - 4.0miles
4.1 - 6.0miles
6.1 - 8.0miles
8.1 -10.0miles
10.1 -12.0miles
12.1 -15.0miles
15.1 -20.0miles
20.1 -25.0miles
25.1 -30.0miles
30.1miles and
over
Nu
mb
er
of
Jou
rneys

©The TAS Partnership Limited ▪ October 08
Issue 3: Value for Money Assessment ▪ Introduction ▪ 11
1.3 Structure of this Task Note
1.3.1 The remainder of this task note is structured as:
• Chapter 2 contains analysis of the fares structure of the main operators
• Chapter 3 reports on our survey analysis of quality and our Generalised Journey Time calculations
• Chapter 4 presents our conclusions.
• Appendix A summarises the legal basis for fares and ticketing.


©The TAS Partnership Limited ▪ October 08
T:\20010C SEStran Bus Initiatives\Task Note and Reports\20010 TN3 Issue 3 Fares Review.doc ▪ Overview ▪ 13
Fares Structure 2
2.1 Overview
2.1.1 This section summarises the fares structures of the main operators in the area. Individual sections are provided for each main operator plus multi operator and multi modal tickets. Data is relevant to spring 2008.
2.2 Lothian Buses
2.2.1 At the time of analysis Lothian Buses had a £1 flat single fare for an adult which reduces to 60p for children, though prices have since been increased. The only services with non-standard fares are the Airlink service, night buses and special tourist-oriented services. It also offers a range of day and period tickets as outlined in Table 3. The monthly tickets are keenly priced at less than three times the cost of weekly tickets. This ensures that the operator receives a good return from visitors to the city while regular commuters receive a good deal. Day tickets can be bought singly on bus or in advance either online or from travel shops (provided a minimum quantity of eight is purchased), while weekly and longer period tickets need to be purchased at Lothian Buses travel shops or online, although they can also be renewed at PayPoint agents in the area. A pack of 21 single journey vouchers is also available online or from travel shops for the price of 20 journeys.
2.2.2 Lothian Buses’ pricing structure encourages the use of monthly tickets renewed by direct debit, as the weekly tickets in particular are not advantageous for those making just one return journey per day five or six days per week. This is a very creditable approach, it encourages renewal of tickets by default as the customer has to actively decide not to renew which not only retains the revenue stream for Lothian Buses but also helps retain the modal share of buses in Edinburgh and assists bus speeds by reducing the amount of cash transactions on the bus. It should be noted that the cost of twelve monthly tickets by direct debit is also cheaper than the purchase of an Annual ticket. Weekly and longer period tickets are also valid on the Airport service thus reducing the cost of regular use of this service which otherwise has a premium fare of £3 single.
2.2.3 Our Lothian Buses data comprises 61 records, 49 for journeys originating in Edinburgh, 9 for journeys originating within Midlothian and 3 for journeys starting within East Lothian. They are broken down by distance:
• Short journeys under 2 miles – 15
• 2 to 4 miles – 20
• 4 to 6 miles - 17

©The TAS Partnership Limited ▪ October 08
T:\20010C SEStran Bus Initiatives\Task Note and Reports\20010 TN3 Issue 3 Fares Review.doc ▪ First in Edinburgh ▪ 14
• 6 to 8 miles - 6
• 8 to 10 miles – 3
2.2.4 The average fare was £1.07 as we included two journeys on Airlink service 100 – otherwise the flat fare is £1.00. Table 3 shows the ticket and price range for Lothian Buses. We have benchmarked each ticket by assessing the price per trip based on people making two journeys per weekday. However the period tickets encourage opportunity travel and therefore actual average trips by ticket holder may be higher than this. This is certainly the case in Edinburgh which has a good service level and usage in the evenings and at weekends and prices here reflect the likelihood of greater trip making. However we have used the same trip rates for all operators to ensure comparisons are consistent.
Table 3: Lothian Buses Price Range
Ticket Type Fare Fare/Trip4 % of Average Single
Single Fare (Flat) £1.00 £1.00 100%
Day £2.50 £1.25 125%
Week £13.00 £1.30 130%
4 Week £37.00 £0.93 93%
Monthly (Direct Debit) £35.00 £0.88 88%
Annual £444.00 £0.94 94%
2.2.5 The One Ticket (see section 2.5) Travel Zone 1 area coincides with Lothian Buses network area and Table 4 we show the premium payable for multi operator travel in this area.
Table 4: One Ticket Comparison with Lothian Buses Fares
Travel Zone 1 (Bus) Premium Over Lothian Fares
Day £3.60 44%
Week £17.50 35%
28 Day £52 41%
2.3 First in Edinburgh
2.3.1 First’s operations cover all of the SEStran area districts except for Fife. We have 118 records for First journeys and have categorised these into groups related to First’s the different parts of First’s territory:
4 Assumes Day ticket = 2 journeys, Weekly Ticket = 10 journeys, 4 Week or Monthly = 40 journeys, 3 Monthly=120 journeys, Annual = 470 journeys
©The TAS Partnership Limited ▪ October 08
T:\20010C SEStran Bus Initiatives\Task Note and Reports\20010 TN3 Issue 3 Fares Review.doc ▪ First in Edinburgh ▪ 15
• Borders – journeys to/from Scottish Borders
• Central - journeys to/from Falkirk and Clackmannanshire
• Edinburgh & The Lothians – journeys within Edinburgh and to/from West Lothian, East Lothian and Midlothian.
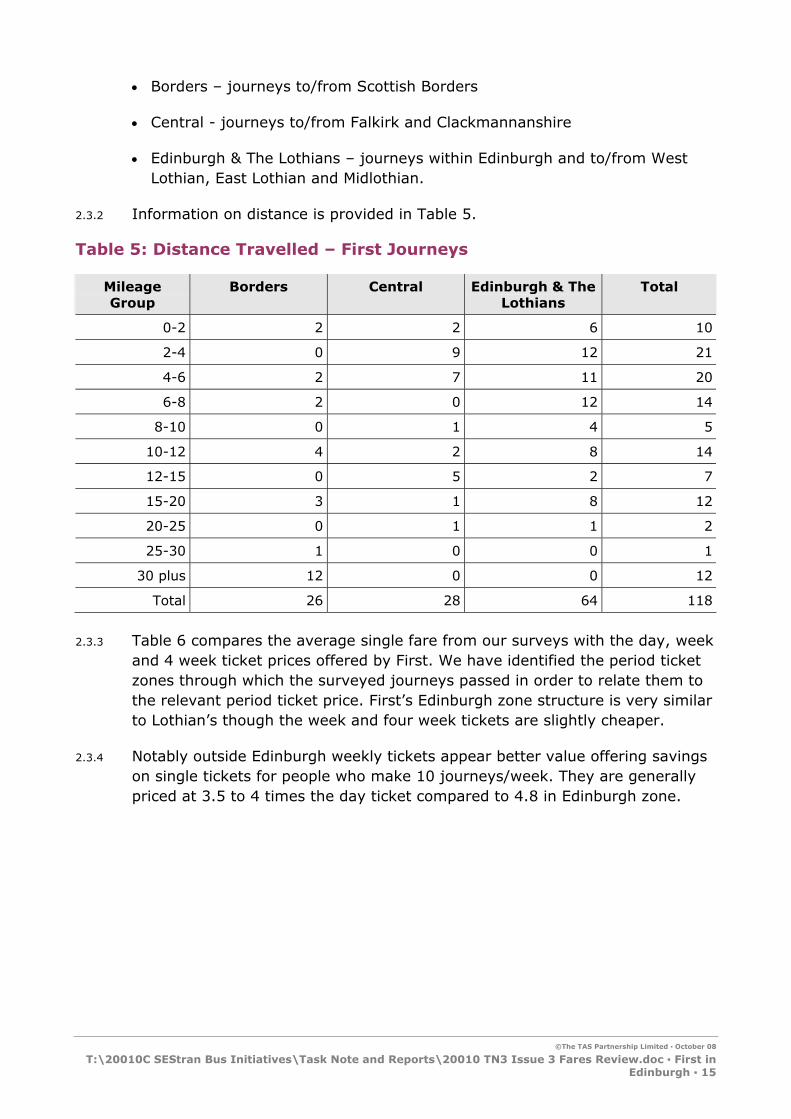
2.3.2 Information on distance is provided in Table 5.
Table 5: Distance Travelled – First Journeys
Mileage Group
Borders Central Edinburgh & The Lothians
Total
0-2 2 2 6 10
2-4 0 9 12 21
4-6 2 7 11 20
6-8 2 0 12 14
8-10 0 1 4 5
10-12 4 2 8 14
12-15 0 5 2 7
15-20 3 1 8 12
20-25 0 1 1 2
25-30 1 0 0 1
30 plus 12 0 0 12
Total 26 28 64 118
2.3.3 Table 6 compares the average single fare from our surveys with the day, week and 4 week ticket prices offered by First. We have identified the period ticket zones through which the surveyed journeys passed in order to relate them to the relevant period ticket price. First’s Edinburgh zone structure is very similar to Lothian’s though the week and four week tickets are slightly cheaper.
2.3.4 Notably outside Edinburgh weekly tickets appear better value offering savings on single tickets for people who make 10 journeys/week. They are generally priced at 3.5 to 4 times the day ticket compared to 4.8 in Edinburgh zone.

©The TAS Partnership Limited ▪ October 08
T:\20010C SEStran Bus Initiatives\Task Note and Reports\20010 TN3 Issue 3 Fares Review.doc ▪ First in Edinburgh ▪ 16
Table 6: First Price Range
Ticket Type Fare Fare/Trip5 % of Average Single
Edinburgh Zone (41 Journeys)
Average Single £0.99 £0.99 100%
Day £2.50 £1.25 126%
Week £12.00 £1.20 121%
4 Week £36.00 £0.90 91%
One Zone (outside Edinburgh 27 Journeys)
Average Single £1.56 £1.56 100%
Day £3.50 £1.75 113%
Week £14.00 £1.40 90%
4 Week £50.00 £1.25 80%
Two Zones (27 Journeys)
Single £2.19 £2.19 100%
Day £5.50 £2.75 125%
Week £19.00 £1.90 87%
4 Week £68.00 £1.70 78%
3 to 5 Zones (21 Journeys)
Single £4.25 £4.25 100%
Day £6.80 £3.40 80%
Week £25.00 £2.50 59%
4 Week £95.00 £2.38 56%
Six or More Zones (2 Journeys)
Single £5.50 £5.50 100%
Day £10.00 £5.00 91%
Week £35.00 £3.50 64%
4 Week £130.00 £3.25 59%
2.3.5 The zones shown in the above tables are mainly based on travel areas, although there is often some link to political boundaries as well. First Edinburgh day and weekly tickets can be purchased on the bus while weekly or longer tickets can be purchased at PayPoint outlets.
5 Assumes Day ticket = 2 journeys, Weekly Ticket = 10 journeys, 4 Week or Monthly = 40 journeys, 3 Monthly=120 journeys, Annual = 470 journeys
©The TAS Partnership Limited ▪ October 08
T:\20010C SEStran Bus Initiatives\Task Note and Reports\20010 TN3 Issue 3 Fares Review.doc ▪ First in Edinburgh ▪ 17
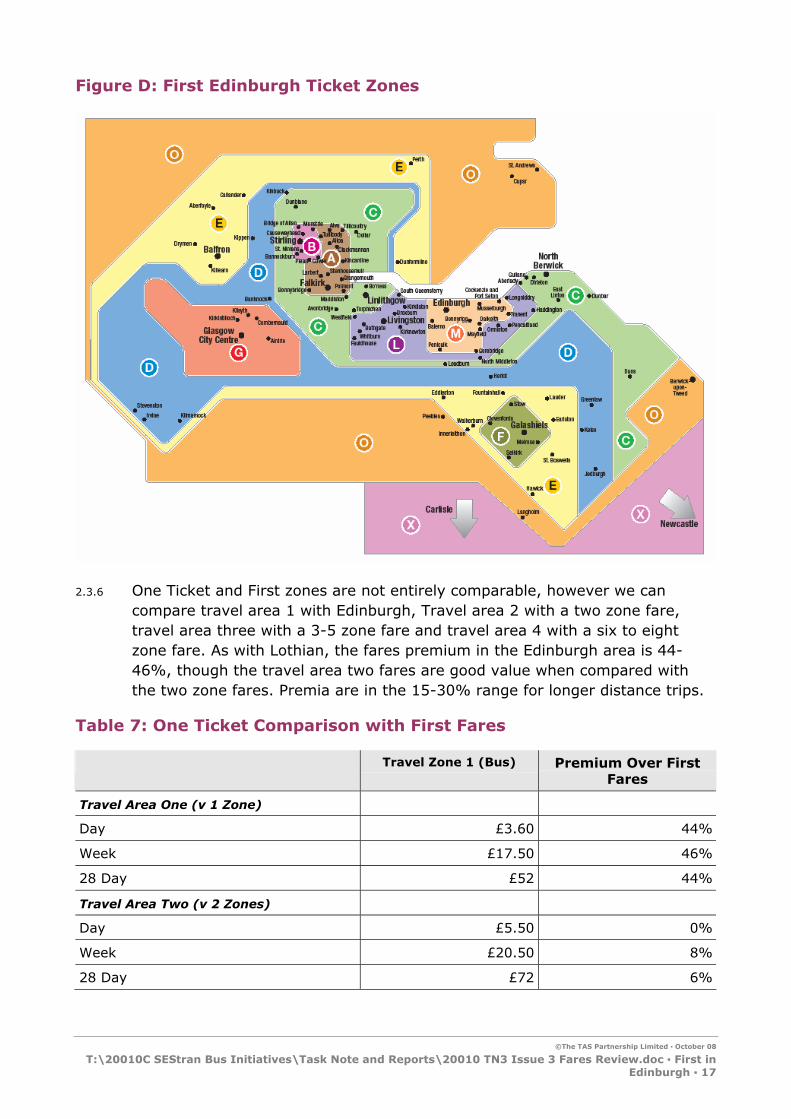
Figure D: First Edinburgh Ticket Zones
2.3.6 One Ticket and First zones are not entirely comparable, however we can compare travel area 1 with Edinburgh, Travel area 2 with a two zone fare, travel area three with a 3-5 zone fare and travel area 4 with a six to eight zone fare. As with Lothian, the fares premium in the Edinburgh area is 44-46%, though the travel area two fares are good value when compared with the two zone fares. Premia are in the 15-30% range for longer distance trips.
Table 7: One Ticket Comparison with First Fares
Travel Zone 1 (Bus) Premium Over First Fares
Travel Area One (v 1 Zone)
Day £3.60 44%
Week £17.50 46%
28 Day £52 44%
Travel Area Two (v 2 Zones)
Day £5.50 0%
Week £20.50 8%
28 Day £72 6%
©The TAS Partnership Limited ▪ October 08
T:\20010C SEStran Bus Initiatives\Task Note and Reports\20010 TN3 Issue 3 Fares Review.doc ▪ Stagecoach Fife ▪ 18
Travel Zone 1 (Bus) Premium Over First Fares
Travel Area Three (v 3-5 Zones)
Day £8.20 21%
Week £32.80 31%
28 Day £114 20%
Travel Area Four (v 6-8 Zones)
Day £11.45 15%
Week £39.30 12%
28 Day £134 3%
Borders Bus (v 2 zones)
Day £6.70 22%
Week £29.30 54%
28 Day £99.00 46%
Central bus (v 2 zones)
Day £6.50 18%
Week £27.50 45%
28 Day £98.00 44%
West Lothian Bus (v 1 zone)
Day £4.80 37%
Week £20.10 44%
28 Day £71.00 42%
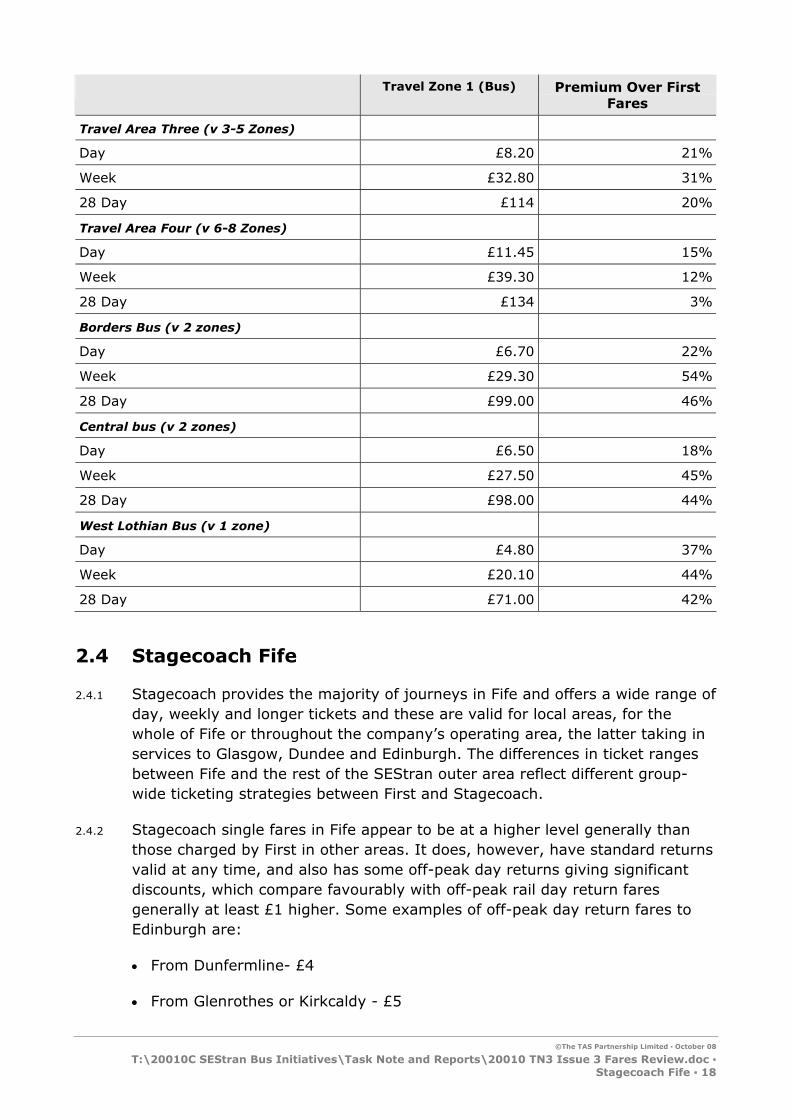
2.4 Stagecoach Fife
2.4.1 Stagecoach provides the majority of journeys in Fife and offers a wide range of day, weekly and longer tickets and these are valid for local areas, for the whole of Fife or throughout the company’s operating area, the latter taking in services to Glasgow, Dundee and Edinburgh. The differences in ticket ranges between Fife and the rest of the SEStran outer area reflect different group-wide ticketing strategies between First and Stagecoach.
2.4.2 Stagecoach single fares in Fife appear to be at a higher level generally than those charged by First in other areas. It does, however, have standard returns valid at any time, and also has some off-peak day returns giving significant discounts, which compare favourably with off-peak rail day return fares generally at least £1 higher. Some examples of off-peak day return fares to Edinburgh are:
• From Dunfermline- £4
• From Glenrothes or Kirkcaldy - £5

©The TAS Partnership Limited ▪ October 08
T:\20010C SEStran Bus Initiatives\Task Note and Reports\20010 TN3 Issue 3 Fares Review.doc ▪ Stagecoach Fife ▪ 19
2.4.3 Stagecoach has also had various promotions and fares experiments, including fare reductions fares between South Queensferry and Edinburgh and its recent Making the Connection promotion on buses between Kirkcaldy and Glenrothes.
2.4.4 Stagecoach day and weekly tickets are summarised in Table 8 and Table 9. The day ticket is known as Dayrider and the local weekly tickets are all known as Megariders in line with group policy. It is notable that while there is a slight variation in the price of day tickets, presumably to take account of the local market and the relative availability of services in each location, the local weekly tickets are always £9. In most areas the weekly ticket is less than three times the day ticket price and would be significantly less than the cost of purchasing single tickets to make an outward and return journey four days a week, assuming a single fare of over £1 in most areas.
2.4.5 At the time of the survey Stagecoach had no versions of its Megariders valid for longer than one week, but from April 2008 Stagecoach introduced four weekly, 13 weekly and annual Megariders on its Fife services. These longer period tickets also introduce the ability to buy or renew tickets online.
Table 8: Stagecoach Price Range (relevant to survey)
Ticket Type Fare Fare/Trip6 % of Average Single
Local Areas (15 journeys)
Single £1.26 £1.26 100%
Day (Leven) £2.50 £1.25 99%
Day (St Andrews) £3.00 £1.50 119%
Day (Dunfermline, Glenrothes, Kirkcaldy) £3.50 £1.75 138%
Week £9.00 £0.90 71%
4 Week £34.00 £0.85 67%
Fife Area (32 journeys)
Average Single £2.61 £2.61 100%
Day £5.80 £2.90 111%
Week £22.00 £2.20 84%
4 Week £83.00 £2.08 80%
Super Area (12 journeys)
Single £4.63 £4.63 100%
Day £10.00 £5.00 108%
Week £35.00 £3.50 76%
4 Week £133.00 £3.33 72%
6 Assumes Day ticket = 2 journeys, Weekly Ticket = 10 journeys, 4 Week or Monthly = 40 journeys, 3 Monthly=120 journeys, Annual = 470 journeys

©The TAS Partnership Limited ▪ October 08
T:\20010C SEStran Bus Initiatives\Task Note and Reports\20010 TN3 Issue 3 Fares Review.doc ▪ Stagecoach Fife ▪ 20
Table 9: Full Summary of Stagecoach Range
Town or Area of Validity Dayrider Weekly 4 Week 13 Week Annual
St. Andrews £3.00 £9 £34 £103 £374
Dunfermline £3.50 £9 £34 £103 £374
Glenrothes £3.50 £9 £34 £103 £374
Kirkcaldy £3.50 £9 £34 £103 £374
Leven £2.50 £9 £34 £103 £374
Fife £5.80 £22 £83 £252 £915
All of operating area plus Perth and former Strathtay network (Super Dayrider or Megarider) £10.00 £35 £133 £400 £1,456
All direct services to Edinburgh (Edinburgh Megarider) N/A £21 £80 £240 £874
Ferrytoll Megarider N/A £21 £80 £240 £874
Service 99 (St. Andrews- Dundee) N/A £23 £87 £263 £957
Service 19 (Ballingry- Rosyth) N/A £11.50 £44 £132 £478
2.4.6 A second type of period ticket outside the usual Megarider range is available in Fife and this is known as the Multiride. The use of these tickets addresses some of the anomalies in the Megarider ticket range and notably allows tickets to be purchased to suit the exact travel patterns of users for whom Megariders are not appropriate. Multiride ticket prices are based on around fifty small zones and the prices are shown in Table 10. For many journeys the Multiride price is the same as the Megarider for the relevant link but the Multiride has the advantage of being available for local journeys across Megarider boundaries as well as being available in lower cost 28 day and annual versions. Prices are shown in Table 10.
2.4.7 Multiride tickets, unlike the Megarider range, can only be purchased at Stagecoach travel shops (located in most bus stations in Fife) as well as at a number of agents. For less frequent travellers Stagecoach also has Flexirider ticket valid for one month and giving 12 journeys for the price of 10 for any ticket value. The All Zone Multiride ticket includes all services operated by Stagecoach Glasgow and Stagecoach in Perth in addition to Fife and Edinburgh services and equates to the Super Megarider boundary.
2.4.8 Although this combination of Megariders and Multiride tickets constitutes a comprehensive range of tickets, it must be recognised that understanding and policing the use of such a wide range of possible ticket combinations poses difficulties, with drivers having to recognise a large number of boundary points.

©The TAS Partnership Limited ▪ October 08
T:\20010C SEStran Bus Initiatives\Task Note and Reports\20010 TN3 Issue 3 Fares Review.doc ▪ One Ticket Multi Operator and Multi Modal tickets ▪ 21
Table 10: Stagecoach in Fife Multiride Ticket Prices (Adult)
Number of Zones Week 28 days Annual
One £8 £27 £290
Two £13 £44 £480
Three £18 £61 £660
Four £22 £76 £820
Five £26 £92 £990
All £30 £103 £1,120
2.4.9 One tickets in the Stagecoach Fife area comprise premiums of 21-34% within Fife, 43-64% when comparing Travel Area Three with the Edinburgh Megarider and 1-15% when comparing Travel Area Four to the Super Megarider. Stagecoach operates over 95% of services in Fife. The One Ticket is not currently valid on any smaller operator in Fife (including the second largest provider, Moffat and Williamson), and until this is the case then there appears little utility in a multi operator ticket.
Table 11: One Ticket Comparison with Stagecoach Fares
Travel Zone 1 (Bus) Premium Over Stagecoach Fares
Fife (v Fife Day/Megarider)
Day £7.00 21%
Week £28.00 27%
28 Day £111.00 34%
Travel Area Three (v Day Return and Edinburgh Megarider)
Day £8.20 64%
Week £32.80 56%
28 Day £114 43%
Travel Area Four (v Super Day/Megarider)
Day £11.45 15%
Week £39.30 12%
28 Day £134 1%
2.5 One Ticket Multi Operator and Multi Modal tickets
2.5.1 The One Ticket range was started in 2002 as a SEStran initiative and includes a range of tickets valid on buses of more than one operator as well as versions valid on buses and trains. It is administered by an operator led limited company operating in partnership with SEStran and the local authorities. This
©The TAS Partnership Limited ▪ October 08
T:\20010C SEStran Bus Initiatives\Task Note and Reports\20010 TN3 Issue 3 Fares Review.doc ▪ One Ticket Multi Operator and Multi Modal tickets ▪ 22
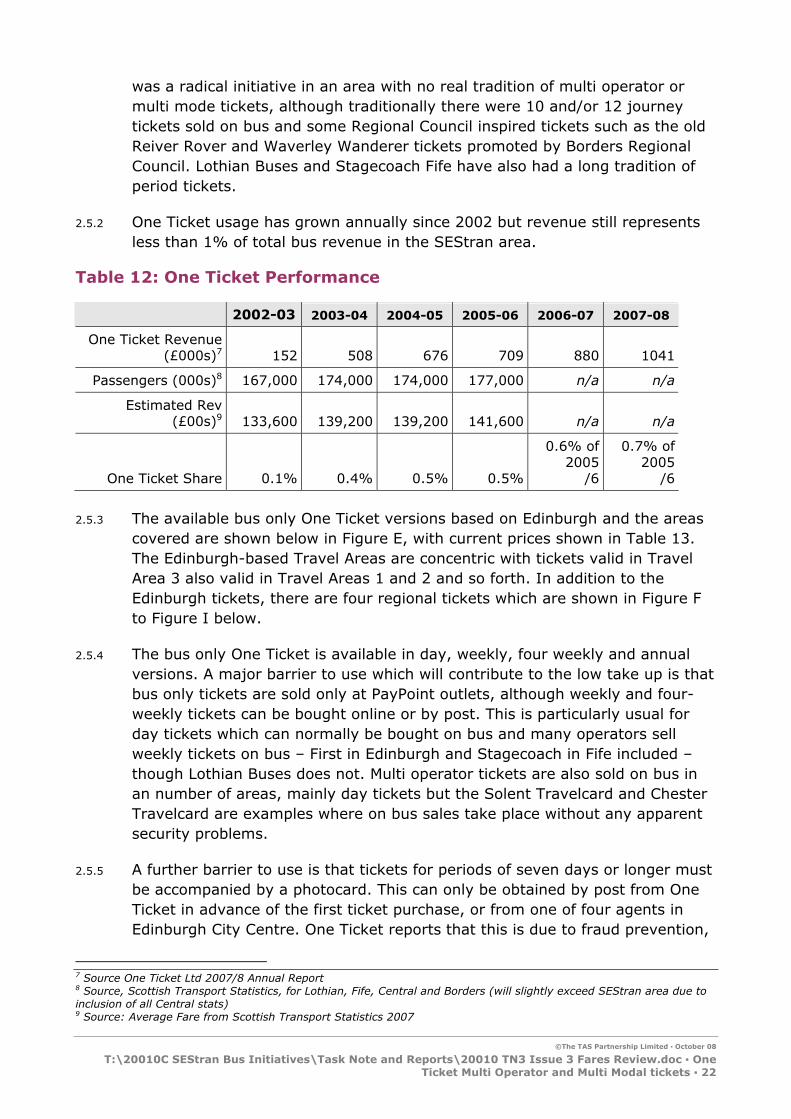
was a radical initiative in an area with no real tradition of multi operator or multi mode tickets, although traditionally there were 10 and/or 12 journey tickets sold on bus and some Regional Council inspired tickets such as the old Reiver Rover and Waverley Wanderer tickets promoted by Borders Regional Council. Lothian Buses and Stagecoach Fife have also had a long tradition of period tickets.
2.5.2 One Ticket usage has grown annually since 2002 but revenue still represents less than 1% of total bus revenue in the SEStran area.
Table 12: One Ticket Performance
2002-03 2003-04 2004-05 2005-06 2006-07 2007-08
One Ticket Revenue (£000s)7 152 508 676 709 880 1041
Passengers (000s)8 167,000 174,000 174,000 177,000 n/a n/a
Estimated Rev (£00s)9 133,600 139,200 139,200 141,600 n/a n/a
One Ticket Share 0.1% 0.4% 0.5% 0.5%
0.6% of 2005
/6
0.7% of 2005
/6
2.5.3 The available bus only One Ticket versions based on Edinburgh and the areas covered are shown below in Figure E, with current prices shown in Table 13. The Edinburgh-based Travel Areas are concentric with tickets valid in Travel Area 3 also valid in Travel Areas 1 and 2 and so forth. In addition to the Edinburgh tickets, there are four regional tickets which are shown in Figure F to Figure I below.
2.5.4 The bus only One Ticket is available in day, weekly, four weekly and annual versions. A major barrier to use which will contribute to the low take up is that bus only tickets are sold only at PayPoint outlets, although weekly and four-weekly tickets can be bought online or by post. This is particularly usual for day tickets which can normally be bought on bus and many operators sell weekly tickets on bus – First in Edinburgh and Stagecoach in Fife included – though Lothian Buses does not. Multi operator tickets are also sold on bus in an number of areas, mainly day tickets but the Solent Travelcard and Chester Travelcard are examples where on bus sales take place without any apparent security problems.
2.5.5 A further barrier to use is that tickets for periods of seven days or longer must be accompanied by a photocard. This can only be obtained by post from One Ticket in advance of the first ticket purchase, or from one of four agents in Edinburgh City Centre. One Ticket reports that this is due to fraud prevention,
7 Source One Ticket Ltd 2007/8 Annual Report 8 Source, Scottish Transport Statistics, for Lothian, Fife, Central and Borders (will slightly exceed SEStran area due to inclusion of all Central stats) 9 Source: Average Fare from Scottish Transport Statistics 2007

©The TAS Partnership Limited ▪ October 08
T:\20010C SEStran Bus Initiatives\Task Note and Reports\20010 TN3 Issue 3 Fares Review.doc ▪ One Ticket Multi Operator and Multi Modal tickets ▪ 23
however given that other operators – including one ticket members – do not require photocards and earn much more revenue from their period tickets. First Week and Stagecoach Megariders are transferable to other family members and providing only one person travels with the ticket at once, we don’t see how this could be considered fraudulent. Our experience of ticketing schemes – single and multi operators – has consistently shown that on bus sales and a lack of photocard requirement stimulate sales.
2.5.6 Paypoint is used as a sales agent for off bus sales of these tickets. Although there is a good concentration of PayPoint agencies in most parts of the area there is a lack of PayPoint outlets in some town centres as well as in more remote areas. Some councils in the area also perceive advertising at the point of sale to be poor.
Table 13: Bus Only One Ticket Prices as at January 2008
Travel Area10 One Day 7 Day 28 Day Annual
Travel area ONE £3.60 £17.50 £52 £560
Travel area TWO £5.50 £20.50 £72 £720
Travel area THREE £8.20 £32.80 £114 £1235
Travel area FOUR £11.45 £39.30 £134 £1460
Central (C) £6.50 £27.50 £98 £945
Fife (F) £7.00 £28.00 £111 £1165
Scottish Borders (SB) £6.70 £29.30 £99 £960
West Lothian (WL) £4.80 £20.10 £71 £735
10 Figure E defines the areas covered by Travel Areas 1 to 4.

©The TAS Partnership Limited ▪ October 08
T:\20010C SEStran Bus Initiatives\Task Note and Reports\20010 TN3 Issue 3 Fares Review.doc ▪ One Ticket Multi Operator and Multi Modal tickets ▪ 24
Figure E: Edinburgh-Based One Ticket Bus Only Zone Map

©The TAS Partnership Limited ▪ October 08
T:\20010C SEStran Bus Initiatives\Task Note and Reports\20010 TN3 Issue 3 Fares Review.doc ▪ One Ticket Multi Operator and Multi Modal tickets ▪ 25
Figure F: One Ticket Bus Only Central Zone Map
Figure G: One Ticket Bus Only Fife, Perth and Tayside Zone Map

©The TAS Partnership Limited ▪ October 08
T:\20010C SEStran Bus Initiatives\Task Note and Reports\20010 TN3 Issue 3 Fares Review.doc ▪ One Ticket Multi Operator and Multi Modal tickets ▪ 26
Figure H: One Ticket Bus Only West Lothian Zone Map
Figure I: One Ticket Bus Only Scottish Borders Zone Map
2.5.7 Bus and Rail tickets are available in weekly, monthly and annual versions and must be purchased from staffed railway stations and accompanied by a photocard, which those rail stations can also issue. This again limits take-up, particularly for the initial purchase. This is naturally common for rail only tickets, however may be a barrier for bus/rail tickets which elsewhere can be bought at other offices and agents. SPT for example sell Zonecards at their offices and travel centres. Figure J shows the rail and bus Zones with the 25 staffed stations marked out by a red triangle, twenty of which lie within the SEStran boundary. It can be clearly seen that distribution of staffed stations is far from even, including almost all stations on the lines from Edinburgh to Dundee and Perth, but none on the North Berwick and Bathgate lines and no staffed station between Shotts and Haymarket.

©The TAS Partnership Limited ▪ October 08
T:\20010C SEStran Bus Initiatives\Task Note and Reports\20010 TN3 Issue 3 Fares Review.doc ▪ One Ticket Multi Operator and Multi Modal tickets ▪ 27
2.5.8 Rail travel is not available on a zonal basis as for buses, but is limited to travel between Edinburgh zone stations and one other nominated station in the east central Scotland area, with bus travel in the relevant zone included at both ends of the train journey. The travel zones correspond in most areas to the bus only travel areas except to the south of Edinburgh.
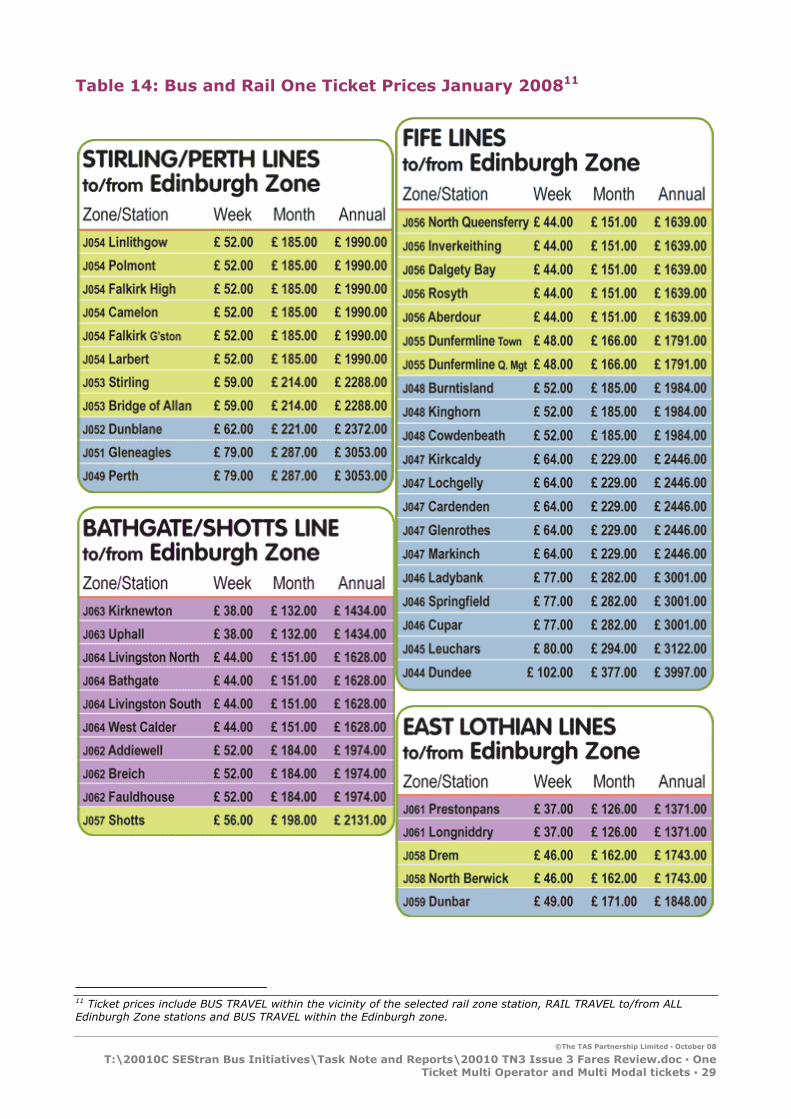
2.5.9 Prices for bus and rail tickets vary by zone and in rough proportion to the prevailing rail season ticket rates – shown in Table 14. Thus there can be significant price differences for journeys of broadly equivalent length, for example to Livingston at £41 against Linlithgow at £49, although the £49 ticket covers journeys out as far as Larbert. One omission from the range of tickets listed in Table 14 is a bus and rail version covering the equivalent of the bus only travel area 1 (Edinburgh), priced at £25 per week, £83 per month and £925 per year.
2.5.10 It is also notable that the areas are not equivalent. Purchasers of bus only travel area 4 tickets have the freedom of participating bus operators between Dundee or Perth and Hawick or Berwick, yet the equivalent Zone 4 Bus and Rail ticket excludes the bus services in the Borders.

©The TAS Partnership Limited ▪ October 08
T:\20010C SEStran Bus Initiatives\Task Note and Reports\20010 TN3 Issue 3 Fares Review.doc ▪ One Ticket Multi Operator and Multi Modal tickets ▪ 28
Figure J: One Ticket Rail and Bus Zones
∆
∆ ∆
∆
∆ ∆ ∆
∆ ∆
∆
∆
∆
∆
∆
∆ ∆
∆ ∆ ∆
∆
∆
∆
∆
∆ ∆
©The TAS Partnership Limited ▪ October 08
T:\20010C SEStran Bus Initiatives\Task Note and Reports\20010 TN3 Issue 3 Fares Review.doc ▪ One Ticket Multi Operator and Multi Modal tickets ▪ 29
Table 14: Bus and Rail One Ticket Prices January 200811
11 Ticket prices include BUS TRAVEL within the vicinity of the selected rail zone station, RAIL TRAVEL to/from ALL Edinburgh Zone stations and BUS TRAVEL within the Edinburgh zone.

©The TAS Partnership Limited ▪ October 08
T:\20010C SEStran Bus Initiatives\Task Note and Reports\20010 TN3 Issue 3 Fares Review.doc ▪ One Ticket Multi Operator and Multi Modal tickets ▪ 30
2.5.11 It is notable that there is a difference in period of validity between four weekly tickets for the bus versions and monthly tickets for the rail and bus versions. This probably reflects the historical ticketing preferences of the major operators concerned – First Edinburgh for bus tickets and Scotrail for rail tickets.
2.5.12 One Ticket extends beyond the SEStran area into the entire Stirling council area and as far as Perth, Dundee and Berwick upon Tweed (the latter for bus only tickets). The tickets are valid on most bus operators in Edinburgh, the Lothians and the Scottish Borders, but fewer operators participate in the scheme in the more outlying areas, with independent operator availability particularly poor in Fife and Clackmannanshire. Indeed of the operators listed on the one-ticket website Stagecoach in Fife is the only major operator of commercial services in Fife to participate. Moffat & Williamson – operator of local services in Glenrothes and elsewhere - presently does not which suggests the utility of a multi operator ticket in Fife is poor.
2.5.13 The complicated nature of the ticket range –with 81 different price options-coupled with poor availability contributes to poor take up of the ticket range. Price is another factor in the poor take up with very high premia compared to single operator tickets. In order to examine this in detail Table 15 below lists the cheapest option for each mode of travel for three representative journeys into Edinburgh from Kirkcaldy, Livingston and North Berwick. Each combination was considered on the basis of lowest available price, operator flexibility and convenience.
Table 15: Comparison of Weekly Ticket Options in SEStran area (Jan 2008)
Journey Mode of Travel
Ticket Type Weekly Price
Prem-ium
(Bus)
Prem-ium
(Rail)
Bus only Stagecoach Fife- Edinburgh week
Bus only One Ticket Area 4
£19.00
£39.30 107%
Train only Weekly standard season ticket £45.40
Kirkcaldy to Edinburgh Waverley
Bus & train Rail & Bus One Ticket £60.00 216% 32%
Bus only FirstWeek zones L & M
Bus only One Ticket Area 2
£19.00
£20.25 7%
Train only Weekly standard season ticket £28.30
Livingston North to Edinburgh Waverley
Bus & train Rail & Bus One Ticket £41.00 116% 45%
Bus Only First Week zones C, L & M
Bus Only One Ticket Area 3
£25.00
£32.80
31%
Train only Weekly standard season ticket £32.50
North Berwick to Edinburgh Waverley
Bus & train Rail & Bus One Ticket £43.00 72% 32%

©The TAS Partnership Limited ▪ October 08
T:\20010C SEStran Bus Initiatives\Task Note and Reports\20010 TN3 Issue 3 Fares Review.doc ▪ One Ticket Multi Operator and Multi Modal tickets ▪ 31
2.5.14 It can be clearly seen that passengers pay a significant premium to switch to rail travel, upgrading from bus only to rail only from North Berwick to Edinburgh attracts a premium of 23% and from Livingston 33%. The premium is even higher from Kirkcaldy, with the rail only ticket being over double the cost of the Stagecoach weekly ticket. This is understandable given the difference in journey times – rail passengers cover the equivalent journeys in a much shorter time.
2.5.15 To include both bus and rail travel in a single ticket increases these premia to 216%, 116% and 72% respectively over the basic bus only single operator option. If we consider a typical local feeder bus journey to a station to cost around £1.30, over five typical working days per week the additional £13 weekly cost is close to the premium paid for a joint bus and rail ticket. Thus passengers could save money by buying separate tickets rather than the combined version. This is notably the case in Kirkcaldy where a local Stagecoach Megarider is £9 per week but the premium for a One Ticket bus and rail ticket is £14.60 above a rail only season. This does not consider, however, that holders of bus and rail One Tickets can also make bus journeys at the Edinburgh end, though we anticipate a three leg three operator journey to be uncommon. There are further comparative costs of One Ticket shown below under each local authority heading.
2.5.16 Thus while the principle behind One Ticket is sound, it appears to be significantly overpriced and certainly does not reflect the price comparisons in the English PTE areas, for example, where a 25-35% premium would be more typical for a multi modal ticket. Strathclyde ZoneCards, a long standing comparable scheme in west central Scotland, have lower prices compared to One Ticket products, but the zones are smaller, so direct comparisons are difficult. Sample premia from the English PTEs include:
• Tyne & Wear:
3 zone network ticket (bus, metro, train) at £16.60 – 38% premium over Stagecoach Newcastle area Megarider Plus (£12)
All zones network ticket at £19.50 a 36% premium compared to Go North East Buzz Card covering most of Tyne & Wear (£14.30)
• Greater Manchester
System One bus only tickets at 16% premium for day tickets, 8% Premium for off peak day tickets and 14% premium for weekly tickets compared to First Manchester prices
Rail, Metro and Bus Tickets are a fixed £6.30 weekly add on price to the normal rail or tram tickets
• South Yorkshire

©The TAS Partnership Limited ▪ October 08
T:\20010C SEStran Bus Initiatives\Task Note and Reports\20010 TN3 Issue 3 Fares Review.doc ▪ Rail Tickets ▪ 32
Multi modal Travel master at 22% premium v First South Yorkshire weekly ticket.
2.5.17 The presentation of the One Ticket range is also fairly confusing with many sub variations. Thus while the idea of promoting joint bus and rail ticketing is laudable, it is unlikely to be successful unless the issue of these price differentials is addressed and greater simplicity is pursued.
2.5.18 As examples for comparison, for a journey between Gourock and central Glasgow (including local travel and travel on all buses and trains en route), a similar distance to that between Edinburgh and North Berwick, the weekly ticket would be £34.30 compared to £43 for the bus and rail One Ticket. From Shotts, almost equidistant between Glasgow and Edinburgh, travel to Glasgow using a ZoneCard is £28 per week whereas the One Ticket from Shotts to Edinburgh would be £53 per week, 89% higher than the Glasgow ended price where the rail only tickets are 48% higher suggesting higher premia.
2.5.19 Fundamentally, such price differences as these must distort both employment patterns and modal split for commuting journeys.
2.5.20 There is a further issue affecting bus/rail joint ticketing related to ticket machine hardware. Generally the bus and rail ticketing systems are incompatible and bus ticket machines cannot issue tickets compatible with the railway’s systems and revenue allocation practices. There are few problems in the reverse direction – rail tickets accepted on buses - as the bus operators generally have a greater degree of flexibility and few physical barriers other than a need for a driver to check the ticket and record its use appropriately.
2.5.21 There is more scope in Scotland as for the most part only one rail franchisee (First Scotrail) is involved, but the number of schemes across the UK where tickets can be bought on bus for onward rail travel is very small and even then these are generally limited to a small range of destination stations and a single train operator.
2.5.22 The particular challenge for One Ticket is to manage the needs of the partners and the market. User and non user surveys will regularly identify a desire for a ticket that can be used across the network. They would be willing to pay a small premium for this marginal utility, yet the risks to bus operator revenue and market share of selling a marginally priced ticket are high. Unless this can resolved, One Ticket will remain a very minor part of the public transport market and have minimal impact against its objective of modal switch and an increase in public transport use.
2.6 Rail Tickets
2.6.1 Although rail services are outside the scope of this work, some reference to rail fares is pertinent for comparative purposes and due to the fact that rail fares have a significant influence on the pricing of multi modal tickets.

©The TAS Partnership Limited ▪ October 08
T:\20010C SEStran Bus Initiatives\Task Note and Reports\20010 TN3 Issue 3 Fares Review.doc ▪ PlusBus ▪ 33
2.6.2 Rail travel in the SEStran area is focussed primarily upon travel to and from Edinburgh rather than between local towns. Weekly season tickets are available between any two nominated stations, with varying prices depending on the stations in question. For regular commuters, these tickets offer significant savings compared to the cost of purchasing standard open day returns on a daily basis – all tickets are priced lower than the cost of five standard open day returns.
2.6.3 Local rail fares within some areas outside Edinburgh are often at or below the prevailing level of bus fares, particularly in the off-peak. A prime example of this is in West Lothian, where there is a £2.60 standard day return fare from Livingston North to Bathgate, 90 pence below the cheapest bus option (a £3.50 FirstDay one zone ticket).
2.6.4 Prices are undoubtedly constrained by the existing rail fares and these have historically been lower in the Strathclyde PTE area compared to the equivalent journeys based on Edinburgh which form the basis of the pricing of the One Ticket bus and rail product.
2.6.5 Rail fares on the Edinburgh local network are significantly higher than those on the Glasgow suburban services, due to high levels of support from Strathclyde PTE (SPT) in the past. Now that the Scottish Executive has, since the passing of the Transport (Scotland) Act 2005, responsibility for all rail services in Scotland this bias in fare levels, and hence levels of financial support, seems difficult to justify. This is a key element in pricing of the One Ticket range by comparison to the SPT range of tickets (see 2.6.4 below).
2.7 PlusBus
2.7.1 In addition to One Tickets aimed at regular commuters the nationwide PlusBus scheme is available as a rail ticket add-on at a number of stations within the SEStran area. These take the form of unlimited bus travel in a specific area around the rail station and are generally purchased on the outward journey for bus travel at the destination station, though tickets can also be purchased in advance (generally only at rail stations and not online) for travel to the origin station. The locations where PlusBus tickets are available and their prices are outlined in Table 16.
2.7.2 In most areas a PlusBus ticket gives unlimited travel within a defined area, but this area is larger in some cases (such as in Falkirk/Larbert and Livingston/Bathgate) than in others (for example the Fife towns). Travel is generally only permitted on the services of the dominant bus operator, this being First in Falkirk and West Lothian and Stagecoach in Fife. However, the Edinburgh ticket is more generous, being available on all operators in the city and having a wider area of validity, extending into outlying areas similar to the Lothian and First Edinburgh zones.

©The TAS Partnership Limited ▪ October 08
T:\20010C SEStran Bus Initiatives\Task Note and Reports\20010 TN3 Issue 3 Fares Review.doc ▪ Other Operators ▪ 34
2.7.3 In addition to the PlusBus range, there are a number of through rail to bus tickets which are available within the SEStran area, although these are only issued from rail stations, online or at agents. These cover journeys from Edinburgh to Galashiels, Hawick, Selkirk and Peebles; from Falkirk to Grangemouth and from Stirling to Alloa. Through tickets to Borders destinations from the south are also valid through Carlisle.
Table 16: PlusBus Locations and Add-on Prices in the SEStran Area
Location Prices
(one day)
Cowdenbeath £2.00
Dunfermline £3.00
Falkirk and Larbert £2.00
Kirkcaldy £3.00
Livingston and Bathgate £2.00
Linlithgow £1.50
Edinburgh (Waverley) £2.50
2.8 Other Operators
2.8.1 Munro’s offers single, return and 10 journeys tickets, with the latter aimed at regular passengers and offering significant discounts. It also offers day rover tickets; these cost £6.00 for the Borders and Berwick, with day tickets valid for travel to and from Edinburgh costing £9.50. These prices are fairly similar to those of First and reflect the fact that Munro’s general fare scales are at similar levels and also that many of its services and fare structures were inherited from First. Other operators in this area limit themselves to single and return tickets.
2.8.2 The independent operators in the West Lothian area generally only issue single fares on their services. However, both Davidson and Horsburgh offer 10 journey tickets for the price of nine, being limited by the age and inflexibility of their ticket machines. However, The Scottish Executive is funding new ticket machines for bus operators which should be installed during 2008. This will give new opportunities on the range of ticket types which operators can offer. All except Davidson participate in One Ticket.
2.8.3 The smaller independent operators running commercial or contracted services around Falkirk generally only issue single and return tickets. Two of the independent bus operators in the area, Bryan’s of Denny and Myles, are participants in the One Ticket scheme, although the largest competing operator, Goosecroft Coaches, is not.
2.8.4 Smaller bus operators in Clackmannanshire generally only offer their own single and return tickets, though some offer 10 journey tickets as well. None
©The TAS Partnership Limited ▪ October 08
T:\20010C SEStran Bus Initiatives\Task Note and Reports\20010 TN3 Issue 3 Fares Review.doc ▪ Advertising Fares and Ticketing ▪ 35
of the smaller independent operators in the Clackmannanshire council area participates in the One Ticket scheme.
2.9 Advertising Fares and Ticketing
2.9.1 In common with many bus operators across the UK, most operators in the SEStran area appear not to make great efforts to promote fares and tickets. The exception here is Lothian Buses, where bus stop information routinely includes fare and ticket details, as illustrated in the example in Figure K.

©The TAS Partnership Limited ▪ October 08
T:\20010C SEStran Bus Initiatives\Task Note and Reports\20010 TN3 Issue 3 Fares Review.doc ▪ Advertising Fares and Ticketing ▪ 36
Figure K: Stop at Riccarton Campus Showing Lothian Buses’ Fares and Ticket Detail

©The TAS Partnership Limited ▪ October 08
T:\20010C SEStran Bus Initiatives\Task Note and Reports\20010 TN3 Issue 3 Fares Review.doc ▪ Advertising Fares and Ticketing ▪ 37
2.9.2 There is also some other fare related advertising on Lothian Buses, its buses routinely carry advertising for its day ticket and there is advertising on various vehicles for Ridacards (see Figure L), the Airport service and the ‘Door to Door’ airport minibus. Fare-related advertising for Lothian Buses was also found in its travel information centres.
2.9.3 Fares information on Lothian Buses’ website12 is largely the same as that available on their bus stop information panels, with the prices of single fares, day tickets, Ridacards and Airlink services available. Some more detailed information includes a map of the locations of the on-street ticket machines and the various travel restrictions imposed on using some types of tickets on night bus and other special services.
Figure L: Lothian Buses Vehicle at the Jewel with Rear Advertising for Ridacard
2.9.4 The low level of on bus fares promotion at Stagecoach Fife is unusual. As a group, Stagecoach keenly promotes its Dayrider and Megarider range and appropriate adverts on buses are the norm. The range of tickets available in Fife coupled to the deployment of buses precludes advertising specific tickets, but even so there is a lack of even generic advertising on buses. However, printed information on the Stagecoach ticket range was freely available at the many travel offices in Fife and at Lothian Buses’ outlets in Edinburgh and
12 http://www.lothianbuses.com/tickets.php

©The TAS Partnership Limited ▪ October 08
T:\20010C SEStran Bus Initiatives\Task Note and Reports\20010 TN3 Issue 3 Fares Review.doc ▪ Advertising Fares and Ticketing ▪ 38
Figure M below shows an example of Stagecoach fare advertising at a bus stop in Tayport, Fife.
2.9.5 Stagecoach Fife’s website13 has details of the various period tickets available in each of the main towns of Dunfermline, Glenrothes, Kirkcaldy, Leven and St Andrews, as well as prices between Fife and Edinburgh and the central Scotland Multiride tickets. Maps showing the approximate coverage zones for these areas and information on where to purchase the tickets are also provided. However, there is no single fares information available apart from the inevitable ‘ask the driver as you board’.
Figure M: Bus Stop in Tayport, Fife, with Stagecoach Fife Fare Advertisement
2.9.6 First, however, has no such travel office outlets to promote its products and our surveys showed low levels of self-advertising on or in buses. As might be
13 http://www.stagecoachbus.com/fife/localoffersgetlucky_1607.html

©The TAS Partnership Limited ▪ October 08
T:\20010C SEStran Bus Initiatives\Task Note and Reports\20010 TN3 Issue 3 Fares Review.doc ▪ Advertising Fares and Ticketing ▪ 39
expected, there was no evidence of fare or ticket promotion on the smaller operators’ buses.
2.9.7 First Edinburgh’s website14, in common with Stagecoach Fife, has prices listed for each of the various period tickets available, along with a map showing the approximate zone coverage. Information on where to purchase the tickets is also provided. Guidance on the prices of single fares is restricted to the local customer services telephone number and a note that that not all of their buses are able to give change, so it helps to have the exact fare ready.
2.9.8 Few advertisements were found for One Ticket in the SEStran area, this includes Lothian Buses’ travel information centres and some tourist information centres in the Borders although there is a degree of at-stop advertising outside Edinburgh as Figure N below shows.
2.9.9 The One Ticket website15 has details of the prices of each zone ticket available, as well as a journey planner and maps to help the customer decide which zone combination is most appropriate for them. Information on where to purchase the tickets is also provided.
14 http://www.firstgroup.com/ukbus/scotland/sescot/fares/index.php 15 http://www.one-ticket.co.uk/bus/fares.html

©The TAS Partnership Limited ▪ October 08
T:\20010C SEStran Bus Initiatives\Task Note and Reports\20010 TN3 Issue 3 Fares Review.doc ▪ Advertising Fares and Ticketing ▪ 40
Figure N: One Ticket Advertisements in Fife (Top) and West Lothian (Bottom)
©The TAS Partnership Limited ▪ October 08
T:\20010C SEStran Bus Initiatives\Task Note and Reports\20010 TN3 Issue 3 Fares Review.doc ▪ Fares – Related Conditions on Secured Services ▪ 41
2.9.10 Munro’s of Jedburgh’s website16 has information covering the price of single fares, day returns, 10 journey tickets and rover tickets between several main origin points and their destinations en route. All of these tickets are available to buy on the bus.
2.9.11 The only independent operator in the area we found to have single fares listed on their website was Prentice Westwood17. This is the same as their entry in West Lothian Council’s guide18 to all bus and train timetables in the area available from council offices and local libraries, but nevertheless provides customers with an indication of how much their journey on these services will cost.
2.10 Fares – Related Conditions on Secured Services
2.10.1 Six of the SEStran constituent councils – Clackmannanshire, Falkirk, Fife, Midlothian, Scottish Borders and West Lothian – provided information about their conditions of contract for the provision of local bus services. No conditions of contract are available for East Lothian and City of Edinburgh councils. This section summarises the policies of the local authorities in relation to fares.
2.10.2 The type of contract will have an influence on fares and ticketing, with the local authority having greater influence where contracts are cost based – where the council takes the revenue risk. This could introduce an additional complication in that the local authority could protect its own revenue and prevent the issue and acceptance of the operator’s own brand tickets. To the credit of the local authorities involved we are not aware of this happening. In reality there is probably a balance between extra revenue taken by the sale of multi journey tickets set against the loss of revenue resulting from the acceptance of tickets sold on other services, although evening contracts pose more of a risk to local authority revenue, but to the benefit of its residents.
Clackmannanshire Council
2.10.3 For Clackmannanshire Council, its conditions of contract are very similar in terms listed and wording used to those for Falkirk Council, both derived from former Central Region documentation. The term ‘purchaser’ here means the Council, and the term ‘supplier’ means the bus operator.
2.10.4 The supplier is responsible for the issue of tickets to passengers, including scholars’ season tickets, boarding passes and pupil journey vouchers, at no cost to the purchaser. All buses used on the contract must be fitted with a suitable electronic ticket issue machine capable of enabling records of tickets
16 http://www.munrosofjedburgh.co.uk/Fares.htm 17 http://www.prenticewestwoodcoaches.co.uk/timetables.cfm 18 http://www.westlothian.gov.uk/1523/1525/

©The TAS Partnership Limited ▪ October 08
T:\20010C SEStran Bus Initiatives\Task Note and Reports\20010 TN3 Issue 3 Fares Review.doc ▪ Fares – Related Conditions on Secured Services ▪ 42
and financial statistics to be kept. The supplier is required to participate in the One Ticket scheme operated by SEStran.
2.10.5 Adult single fares for individual journeys on contracted services must not be set higher than those of adjacent commercial services. The purchaser reserves the right to set the farescale used on the contract. The purchaser will normally allow fare scales to be increased from time to time, broadly in line with retail price inflation. Any fares increase on a contract service must be agreed with the purchaser at least 56 days in advance of the first day on which an increased fare would be charged.
Falkirk Council
2.10.6 Falkirk Council, as mentioned above, has very similar conditions of contract to Clackmannanshire Council. The difference in relation to fares is that it is specified that the supplier may operate multi journey ticket schemes, the cost of which shall be determined by the supplier but the supplier is not required to accept multi journey tickets issued by another operator.
Fife Council
2.10.7 Fife Council is the only local authority in the SEStran area to specify fare scales set by distance in its conditions of contract – these are shown in Table 17 below. The contractor is not allowed to charge fares any higher than these specified rates, and must carry the relevant fare tables and fare stages in each vehicle used on the service.
Table 17: Fare scales for Fife Council Tendered Services19
Distance (Miles) Relevant Fare (£)
0.00 – 0.75 £0.65
0.76 – 1.25 £0.80
1.26 – 1.75 £0.95
1.76 – 2.25 £1.10
2.26 – 3.00 £1.20
3.01 – 4.00 £1.40
4.01 – 5.00 £1.65
5.01 – 6.00 £1.85
6.01 – 7.00 £2.05
7.01 – 8.50 £2.35
8.51 – 10.00 £2.60
10.01 – 11.50 £2.85
11.51 – 13.00 £3.10
19 Fares effective from 18th August 2008

©The TAS Partnership Limited ▪ October 08
T:\20010C SEStran Bus Initiatives\Task Note and Reports\20010 TN3 Issue 3 Fares Review.doc ▪ Fares – Related Conditions on Secured Services ▪ 43
Distance (Miles) Relevant Fare (£)
13.01 – 14.50 £3.30
14.51 – 16.00 £3.55
16.01 – 18.00 £3.85
18.01 – 20.00 £4.15
20.01 – 22.00 £4.45
22.01 – 24.00 £4.80
24.01 – 26.00 £5.10
26.01 – 28.00 £5.40
28.01 – 30.00 £5.75
30.01 – 32.00 £6.05
32.01 – 34.00 £6.35
34.01 – 36.00 £6.70
36.01 – 38.00 £7.00
38.01 – 40.00 £7.30
2.10.8 The fare scales in Table 17 above are based on Fife Council’s indicative fare bands, and are likely to increase annually in line with trends for fares in commercial services. Where there is a comparable existing commercial service covering all or a significant part of the proposed tendered route, the commercial fare would normally apply. Any fares increases have to be negotiated with the council. If no comparable fares exist, then the council’s indicative farescale applies.
2.10.9 Bidders who wish to charge lower fares need to propose this by means of an alternative tender. However, the council reserves the right to cancel the contract if the level of any subsequent fares increase for such an accepted alternative tender is considered to be excessive. In addition, the contractor must accept and participate in the One Ticket scheme. However, unique to Fife Council is that the tickets issued on a tendered service must display ‘Fife Council Supported Service’ in a ‘reasonable sized’ font on the front of the ticket, subject to the ticket machine having the appropriate technology to do this.
Midlothian Council
2.10.10 Midlothian Council has two versions of contract conditions for net subsidy and cost-based contracts. For net subsidy contracts Midlothian sets maximum fare levels. The contractor must participate in any pass-based integrated ticketing system as agreed with the council (this includes One Ticket, although it is not mentioned by name). The contractor must also participate in any through ticketing scheme detailed in the contract specification.

©The TAS Partnership Limited ▪ October 08
T:\20010C SEStran Bus Initiatives\Task Note and Reports\20010 TN3 Issue 3 Fares Review.doc ▪ Fares – Related Conditions on Secured Services ▪ 44
2.10.11 For cost-based contracts, fares are specified by the council. The contractor may allow passengers to use other prepaid passes issued by the contractor provided that this is agreed in advance and the council receives a credit value for the use of each pass as agreed. The contractor must accept any other ticket type as instructed by the council.
Scottish Borders Council
2.10.12 Scottish Borders Council’s most recent contracts have been minimum cost contracts, where the council specifies the fare levels and the range of tickets to be offered to passengers which may include through tickets to other services. Where there is a history of season tickets, 10 journey or day return tickets this is continued, with the contracts being let using the operator’s standard charging rate. The One Ticket multi operator scheme is required to be valid on all contracted local bus services.
2.10.13 In the case of minimum subsidy contracts the council agrees maximum fares levels and the range of tickets to be offered to passengers, which again may include through tickets to other services. Proposed fare tables must be agreed with the council at least two weeks prior to the start of the contract. The contractor is also required to participate in any other multi operator ticketing scheme specified. The contractor is also to be responsible for any costs associated with the implementation of up to two fare revisions per annum.
2.10.14 As an example, the details from minimum cost contract service 60 (Galashiels - Tweedmouth) were supplied. The council specifies the fare levels and the range of tickets to be offered. This includes the issue of through tickets between service 60 and connecting services at Chirnside, Duns and Earlston. The contractor’s or other operators’ own commercial period or area tickets will be accepted if a rate of reimbursement is agreed in advance with the council.
West Lothian Council
2.10.15 In West Lothian contracts maximum fares are given. The fares adopted may be increased by a maximum of 10p for fares below £2 and 20p above £2 every 2 years. One Ticket must be accepted on all contracted services.
2.10.16 For cost-based contracts the fares are as specified in the Schedule of Rates in the contract. The Contractor must also accept any other ticket type. As in Midlothian, the Council must be credited for acceptance of other ticket types not specified in the contract.
2.10.17 Dogs may be carried on contracted services at half fare. Only one dog shall occupy each deck of the bus at any given time.
©The TAS Partnership Limited ▪ October 08
T:\20010C SEStran Bus Initiatives\Task Note and Reports\20010 TN3 Issue 3 Fares Review.doc ▪ Summary of Ticket Availability ▪ 45
2.11 Summary of Ticket Availability
2.11.1 The major bus operators take different approaches to ticketing and this largely reflects their wider corporate policies. Throughout the UK the practice of current single fares largely reflecting historical stage structures and distance-based fares remains, with a general practice of rounding fare values to the nearest multiple of five or ten pence. The SEStran area is no different to the general picture. Even at Lothian Buses, it traditionally had a very simple fare structure and the flat fare structure has been achieved by a steady process of further simplification.
Figure O: Comparative Fare Scales – Short Journeys
£0.00
£0.20
£0.40
£0.60
£0.80
£1.00
£1.20
£1.40
£1.60
£1.80
£2.00
Lothian First (Edinburgh) First (Other Areas) Stagecoach (Local)
Avera
ge F
are
per
Tri
p
Single Day Week Month

©The TAS Partnership Limited ▪ October 08
T:\20010C SEStran Bus Initiatives\Task Note and Reports\20010 TN3 Issue 3 Fares Review.doc ▪ Summary of Ticket Availability ▪ 46
Figure P: Comparative Fare Scales – Medium and Long Journeys
£0.00
£1.00
£2.00
£3.00
£4.00
£5.00
£6.00
First (Two Zones) Stagecoach (Fife) First (3-5 Zones) First (6 plus Zones) Stagecoach (Super)
Avera
ge F
are
per
Tri
p
Single Day Week Month
2.11.2 A fundamental element of all three major operators is the ability to purchase the key multi journey tickets on bus. This includes weekly tickets for First and Stagecoach. Lothian’s weekly tickets cannot be purchased on bus but the price is roughly equivalent to five day tickets so this offers a viable alternative. Here simplicity is the key and such complications as photocards have generally been dispensed with. It is notable and creditable that none of the multi journey ticket options is artificially restricted by local authority boundaries, but instead these are defined by established travel patterns and bus network structures.
2.11.3 First Edinburgh largely matches the fares policies of Lothian within the Edinburgh area but it charges higher fares outside the Edinburgh area. Its offer of zoned day, weekly and longer period tickets is unusual for a First subsidiary20, but reflects the huge operating area which it covers. Outside the Edinburgh area First retains its fine stage to stage distance-based fare structure.
2.11.4 Lothian Buses has a low flat single fare of £1 across its network, coupled to heavily-discounted monthly tickets renewed by direct debit and a keenly priced day ticket. At the extremities of its network, such as Midlothian, the £1 flat fare offers significantly lower single fare levels than those which applied many years ago. For all but the shortest journeys, the £1 fare offers good
20 The only other First subsidiaries which offer a zonal ticket structure are First Somerset and Avon and First Eastern Counties which cover similarly large operating areas.

©The TAS Partnership Limited ▪ October 08
T:\20010C SEStran Bus Initiatives\Task Note and Reports\20010 TN3 Issue 3 Fares Review.doc ▪ Summary of Ticket Availability ▪ 47
value and is below the prevailing level of local fares in many areas. At some point, however, the simple £1 fare will have to increase.
2.11.5 Stagecoach emphasises local Megarider weekly buy on-bus tickets, which are not sold for periods longer than one week, and offers good value tickets for specific commuting journeys, particularly those into Edinburgh from Fife. The Stagecoach local tickets are notably cheaper than their First equivalents, although the geographic areas covered are generally smaller. The Stagecoach Multiride tickets are unusual, but in essence approximate to old-style point to point season tickets.
2.11.6 Smaller independent operators generally only offer single and return fares although some offer ten journey tickets that are normally priced at a similar level to the weekly tickets for comparable journeys by the larger operators. It appears that only one independent operator in the SEStran area, Munro’s, offers day tickets for its own services, but Munro’s is also different in that it has a widespread network.
2.11.7 Rail fares are higher than in comparable metropolitan areas of Scotland and England and this largely reflects the historical lack of subsidies for links from Edinburgh (which tended to be charged at standard UK levels) compared to subsidised fares in Glasgow and English PTE areas which have historically been subsidised to encourage use. Notwithstanding this, there are many rail journeys in the area for which an off-peak day return is cheaper than the equivalent bus fare.
2.11.8 One Ticket has introduced the concept of multi operator and multi mode ticketing to the Edinburgh travel-to-work area. The multi operator bus tickets offer a comprehensive range of tickets but in most cases at a significant premium above the equivalent single operator products. The tickets are most useful in areas that do not have a single dominant operator as well as in areas where the single operator zone structure is less advantageous. The Travel Areas are mostly logical with one major exception, Clackmannanshire, where its position in Travel Area 4 poses difficulties for some logical travel patterns. The utility of the ticket range, however, is limited by inflexibility in purchasing arrangements, particularly for the one day tickets and also by the failure of all operators to participate.
2.11.9 Unless there are significant developments in the One Ticket range (which is potentially possible), there are effectively two tickets, with wholly separate arrangements for bus only and bus and rail tickets. The prices of the One Ticket bus and rail tickets are based on the prevailing level of peak rail fares and as a result are significantly higher in price than their bus only equivalents. In many cases it is cheaper (and more convenient) for passengers to buy separate rail and bus season tickets. It is difficult to see how the products could be priced substantially lower without a general increase in subsidy for the rail element of the journey, although this could be a specific political decision to do so. It also appears that the bus add-on element is over-priced

©The TAS Partnership Limited ▪ October 08
T:\20010C SEStran Bus Initiatives\Task Note and Reports\20010 TN3 Issue 3 Fares Review.doc ▪ Summary of Ticket Availability ▪ 48
in some cases. Certainly the level of price premium needs to reduce significantly to increase the appeal of the tickets overall.
2.11.10 Both the bus only and bus and rail versions of One Ticket are focussed on Edinburgh. Whilst this might be understandable in terms of the primary aim of these tickets, it leads to a lack of appropriate tickets at some of the outer extremities where travel patterns might focus on Stirling, Perth or Dundee. For the south western part of the SEStran area there is undoubtedly some focus on Glasgow and there are no equivalent tickets to cover passenger flows into Glasgow, although there are appropriate single operator tickets of both First and Stagecoach which include Glasgow.
2.11.11 Unfortunately, the range of different tickets with different areas or zones of validity, although fairly logically derived in most cases, poses real problems of recognition of limits of validity for both operating staff and the travelling public:
• At First, its own Zones and One Ticket Travel Areas have different boundaries
And there are some differences between Bus Only and Bus and Rail travel area boundaries.
• At Stagecoach, operating staff need to know One Ticket travel area boundaries, a range of Megarider boundaries and many different zone limits for Multiride tickets.
• The One Ticket local area tickets have boundaries of their own which do not reflect travel zones.
2.11.12 Maps showing Zone and Travel Area boundaries are clear with regard to the general areas which tickets cover, but specific boundary stops and travel limits are difficult to establish. This lack of clarity could lead to problems of overriding and disputes between operating staff and passengers regarding ticket validity.
2.11.13 Contract provisions in relation to fares are generally similar across the authorities which comprise SEStran. Each has the ability to specify maximum fare levels thus placing restrictions on excessive fare levels on contracted services, although in some cases the fare levels are not finely specified – merely that they should ‘not be above commercial levels’. This policy will therefore shadow Lothian Buses’ £1 flat fare where appropriate.
2.11.14 For secured evening services there is no general policy for operators of contracted services to be forced or encouraged to accept the usual tickets issued and accepted by the main daytime operator.
2.11.15 Here there is particular credit to Scottish Borders Council, whose approach encourages continuity of ticketing arrangements in addition to service

©The TAS Partnership Limited ▪ October 08
T:\20010C SEStran Bus Initiatives\Task Note and Reports\20010 TN3 Issue 3 Fares Review.doc ▪ Summary of Ticket Availability ▪ 49
patterns. This goes some considerable way to reducing the major upheaval which can accompany the switch of contracts between operators, particularly important in the area with the highest proportion of tendered journeys.
2.11.16 A fundamental issue remains with so many ticketing options available, that of impartial information on guidance. Whereas Traveline clearly offers such information on times (subject to the limitations of the journey planners), there are no equivalent information sources for fares. In some of our comparisons given above we have taken considerable time to compare websites, charges and maps – this option might not be readily available to passengers or intending passengers.
Sales Outlets
2.11.17 Sales of tickets at offices or agents, by post, online or by telephone is limited to the tickets offered by the three major operators and One Ticket. But within these groups there are significant variations. First has no travel offices within the area. Weekly and four weekly tickets can be bought at PayPoint agents while four weekly and annual tickets can be purchased by telephone or online.
2.11.18 Stagecoach has six travel shops in Fife, together with four ticket agents in Edinburgh (including the three Lothian Buses offices) and other agencies in Cumbernauld, Dundee, Glasgow, Oakley and Perth which handle sales of Multiride tickets.
2.11.19 Lothian has three travel shops of its own and its ‘Ridacard’ season tickets can be recharged at Paypoint outlets. As Ridacards use smartcard technology, the initial purchase has to be from a Lothian Buses office. The full range of Lothian tickets, including single journey vouchers, is available online. Lothian is alone in offering automatic ticket renewal by direct debit.
2.11.20 Issue and renewal procedure for the One Ticket range varies between bus only versions and bus and rail versions. For bus only versions the initial ticket must be bought from One Ticket by post or from one of the four agents in Edinburgh (the three Lothian Buses offices and the Citylink office). Renewals can be carried out by post, by phone, online or at Paypoint agents, except for the annual version which must be renewed online or by post. The bus and rail versions can only be bought or renewed at staffed railway stations.

©The TAS Partnership Limited ▪ October 08
T:\20010C SEStran Bus Initiatives\Task Note and Reports\20010 TN3 Issue 3 Fares Review.doc ▪ Summary of Ticket Availability ▪ 50
Figure Q: Locations of Lothian Buses On-Street Ticket Machines

©The TAS Partnership Limited ▪ October 08
T:\20010C SEStran Bus Initiatives\Task Note and Reports\20010 TN3 Issue 3 Fares Review.doc ▪ Introduction ▪ 51
Quality and Value for Money Assessment 3
3.1 Introduction
3.1.1 This section undertakes an analysis of the quality scores from our survey and relates them to price to determine if there is a linkage between price and quality and where improvements in value for money are needed.
3.2 Headline Quality Scores
3.2.1 The headline quality scores from the survey are summarised in the charts that follow. The Bus Stop Waiting Environment (Figure R) is primarily the responsibility of the local authority – though sometimes with operator involvement in information. In the majority of cases the sign and shelter received ‘very good’ scores and often additional facilities such as raised kerb, lighting and seating were provided. Regrettably cleanliness standards were much lower than should be expected. Isolated cases of unrepaired vandalism contributed to the poor scores for shelters.
Figure R: Summary Scores – Bus Stop Waiting Environment
0% 10% 20% 30% 40% 50% 60% 70% 80% 90% 100%
Sign
Shelter
At Stop Information
EXtra Facilities
Cleanliness
Number of Journeys
Very Good Good Average Poor Very Poor
3.2.2 Vehicle quality (Figure S) is primarily the responsibility of the bus operator. The basic requirements of correct and clear service number and destination were almost always met. Externally appearance and cleanliness scores were
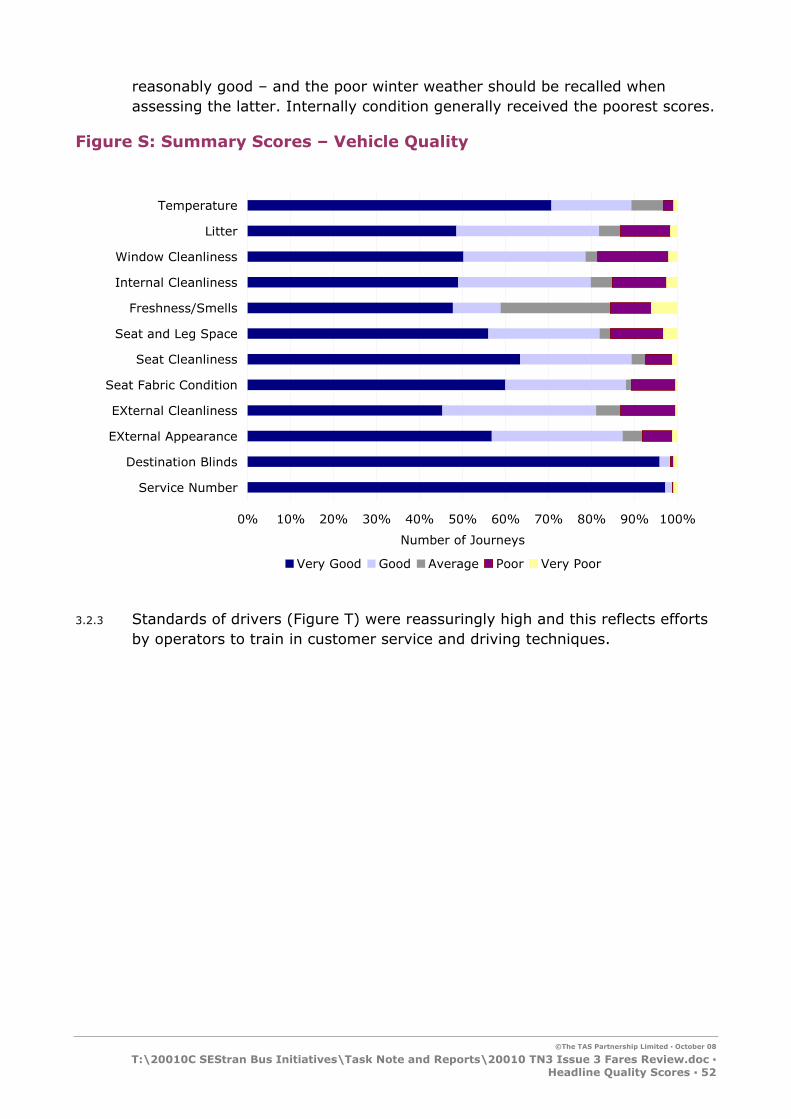
©The TAS Partnership Limited ▪ October 08
T:\20010C SEStran Bus Initiatives\Task Note and Reports\20010 TN3 Issue 3 Fares Review.doc ▪ Headline Quality Scores ▪ 52
reasonably good – and the poor winter weather should be recalled when assessing the latter. Internally condition generally received the poorest scores.
Figure S: Summary Scores – Vehicle Quality
0% 10% 20% 30% 40% 50% 60% 70% 80% 90% 100%
Service Number
Destination Blinds
EXternal Appearance
EXternal Cleanliness
Seat Fabric Condition
Seat Cleanliness
Seat and Leg Space
Freshness/Smells
Internal Cleanliness
Window Cleanliness
Litter
Temperature
Number of Journeys
Very Good Good Average Poor Very Poor
3.2.3 Standards of drivers (Figure T) were reassuringly high and this reflects efforts by operators to train in customer service and driving techniques.

©The TAS Partnership Limited ▪ October 08
T:\20010C SEStran Bus Initiatives\Task Note and Reports\20010 TN3 Issue 3 Fares Review.doc ▪ Generalised Journey Time ▪ 53
Figure T: Summary Score – Drivers
0% 10% 20% 30% 40% 50% 60% 70% 80% 90% 100%
Appearance
Attitude
Correct Fare
Correct Change
Correct Ticket
Driving Style
Care
Stopping
Number of Journeys
Very Good Good Average Poor Very Poor
3.3 Generalised Journey Time
3.3.1 The concept of generalised journey time (GJT) for each journey surveyed, which ‘normalises’ the features of a journey so that a value for money indication can be given, was also analysed. The components of the GJT are:
• Access time – walk to bus stop
• Waiting time – wait time at stop
• Excess waiting time – delay caused by late running services
• In vehicle time
• Fare – converted to time
• Boarding penalty – reduced by survey results of:
Low floor buses
Modern buses
Above average stop, driver, vehicle and journey quality scores.

©The TAS Partnership Limited ▪ October 08
T:\20010C SEStran Bus Initiatives\Task Note and Reports\20010 TN3 Issue 3 Fares Review.doc ▪ Generalised Journey Time ▪ 54
3.3.2 Details of the method of calculation for these components are shown in Table 18 below. Once all these components are taken into account it can be seen why the car appeals as a more convenient method of travel over public transport, as it does not incur any waiting time. The journey component is comprised of:
• Walk time to stop
• Waiting time at stop
• Excess waiting time
• Boarding penalty
• In vehicle time.
Table 18: Generalised Journey Time Costs for Buses
Factor Calculation Remarks
In-vehicle time (IVT) Actual stop to stop journey time Can be adjusted by a multiplier to reflect quality (e.g. tram)
Waiting time Wait time = ½ frequency up to 15 minutes
Twice actual time modelled
Can be adjusted to reflect quality of waiting environment
Access time (from home to bus stop)
Twice actual time taken 5 minutes used as a default
Fare Cash fare converted to minutes by reference to value of time
Value will depend on journey purpose, household income and other factors
Mode constant Fixed number of minutes 7.5 minutes default, reduced by survey score:
1 point for up to 20% of max
2 point for 20-40%
3 points for 40-60%
4 points for 60-80%
5 points for over 80%
3.3.3 Figure U below shows the average GJT components by operator group. Across the SEStran area, the average Generalised Journey Time is 97 minutes, with the journey component comprising 68 minutes, the fare component 25 minutes and the quality component 4 minutes. From this analysis quality appears insignificant in the total journey mix. However in modelling, GJT usually has a -0.9 elasticity, a 1% reduction in GJT should trigger a 0.9% improvement in passenger numbers. Although quality is a small part of GJT it is usually influenceable by capital investment, rather than on going revenue.

©The TAS Partnership Limited ▪ October 08
T:\20010C SEStran Bus Initiatives\Task Note and Reports\20010 TN3 Issue 3 Fares Review.doc ▪ Generalised Journey Time ▪ 55
Compared to increasing frequency or reducing fares, quality improvements have a low cost for a high level of benefit.
3.3.4 Of the operators:
• First (Borders) has the highest fare component at 44.4 minutes and the highest journey component (103 minutes), reflecting its often lengthy rural services which have a high average fare and high average journey length
• Lothian Buses had the lowest fare (14.7 minutes), lowest journey score (54 minutes) and highest quality score (4.3 minutes), reflecting its low maximum fare, high frequency operation and lower average trip length.
• Price represented 26% of the typical GJT, ranging from 20-22% (Lothian and First (Edinburgh)) in the City of Edinburgh area to 31% on Stagecoach services
3.3.5 For clarity the Quality Aspect has been further illustrated in Figure V, the columns of which show the actual average score for each operator (out of a maximum of 96) with the line showing the average boarding penalty (mode constant) offset – out of a maximum of 5. This shows the strong performance on quality of Lothian Buses and Munro’s and the below average performance of First in the Central area.

©The TAS Partnership Limited ▪ October 08
T:\20010C SEStran Bus Initiatives\Task Note and Reports\20010 TN3 Issue 3 Fares Review.doc ▪ Generalised Journey Time ▪ 56
Figure U: Average Generalised Journey Time Components by Operator Group
0
20
40
60
80
100
120
140
160
First (B
orde
rs)
First (C
entra
l)
First (E
din)
Loth
ian
Munro
s
Stag
ecoa
ch
Other
s
SESt
ran
Gen
eral
ised
Cost
(M
ins)
Fare Journey Quality
Figure V: Quality Score and Boarding Penalty Offset by Operator
0
10
20
30
40
50
60
70
80
90
100
First (B
orde
rs)
First (C
entra
l)
First (E
din)
Loth
ian
Munro
s
Stag
ecoa
ch
Other
s
SESt
ran
Qu
ality
Sco
re
0
0.5
1
1.5
2
2.5
3
3.5
4
4.5
5
Bo
ard
ing
Pen
alt
y O
ffse
t
Score Boarding Penalty Offset
©The TAS Partnership Limited ▪ October 08
T:\20010C SEStran Bus Initiatives\Task Note and Reports\20010 TN3 Issue 3 Fares Review.doc ▪ Generalised Journey Time ▪ 57
3.3.6 The range of scores by operator is shown in Figure W. The relationship between the average and the maximum is critical here. Although scores for Lothian Buses range from 9 to 93, the average is 74 reflecting the predominance of high scores, with the lowest being a exception to the norm. Reflecting the general findings of the survey First in the Central area (particularly Falkirk and Clackmannanshire) has the lowest scores.
Figure W: Range of Quality Scores – Operators
0
10
20
30
40
50
60
70
80
90
100
First(Borders)
First(Central)
First (Edin) Lothian Munros Stagecoach Others
Gen
eral
ised
Tim
e
Avg Min Max
3.3.7 In Figure X (page 58) we compare price and quality for each journey surveyed, coded by operator. This highlights that there is no mathematical correlation between fare and quality which is as we would expect given that the fare charged reflects the cost of operation and the intensity of use – i.e. the level of fare required to operate a profitable service. A similar graph (Figure Y on page 59 quality scores by average fare per mile) shows that disaggregating fares by distance does not determine patterns. This illustration does show that there some journeys are low quality travel experiences.

©The TAS Partnership Limited ▪ October 08
T:\20010C SEStran Bus Initiatives\Task Note and Reports\20010 TN3 Issue 3 Fares Review.doc ▪ Generalised Journey Time ▪ 58
Figure X: Comparison between Price and Quality
0
10
20
30
40
50
60
70
80
90
100
£0.00 £1.00 £2.00 £3.00 £4.00 £5.00 £6.00 £7.00 £8.00 £9.00
Single Fare (£)
Qual
ity
Sco
re
First (Borders) First (Central) First (Edin) Lothian Munros Stagecoach Others

©The TAS Partnership Limited ▪ October 08
T:\20010C SEStran Bus Initiatives\Task Note and Reports\20010 TN3 Issue 3 Fares Review.doc ▪ Generalised Journey Time ▪ 59
Figure Y: Comparison between Quality Scores and Single Fare per Mile
0
10
20
30
40
50
60
70
80
90
100
£0.00 £0.20 £0.40 £0.60 £0.80 £1.00 £1.20 £1.40 £1.60
Single Fare per Mile
Qual
ity
Sco
re
First (Borders) First (Central) First (Edin) Lothian Munros Stagecoach Others
©The TAS Partnership Limited ▪ October 08
T:\20010C SEStran Bus Initiatives\Task Note and Reports\20010 TN3 Issue 3 Fares Review.doc ▪ Generalised Journey Time ▪ 60
Analysis by Local Authority Area
3.3.8 When analysed by the origin local authority area of a typical passenger making each journey surveyed, Figure Z below shows that Midlothian has the lowest fare component (13.8 minutes) and lowest in vehicle component (58.7 minutes). Figures for Edinburgh show an average of 20.2 minutes for the fare component and 63.4 minutes for in vehicle, which reflects the inclusion of interurban journeys originating in Edinburgh. Table 19 shows the effect of isolating within district journeys showing how the fare and journey components within Edinburgh are much lower and comparable with Midlothian.

©The TAS Partnership Limited ▪ October 08
T:\20010C SEStran Bus Initiatives\Task Note and Reports\20010 TN3 Issue 3 Fares Review.doc ▪ Generalised Journey Time ▪ 61
Figure Z: Average Generalised Journey Time Components by ‘Home’ Local Authority Area
0
20
40
60
80
100
120
140
Bord
ers
Clac
kman
nans
hire
East Lot
hian
Edinbu
rgh
Falkirk Fif
e
Midloth
ian
Wes
t Lot
hian
SESt
ran
Gen
eral
ised
Cost
(M
ins)
Fare In Vehicle Quality
Table 19: Generalised Journey Time Components – All Journeys v Within District Journeys
All Journeys Within District Journeys
LA Fare Journey Quality Total Fare Journey Quality Total
Borders 36.8 85.9 4.2 126.8 31.1 76.1 4.2 111.3
Clackmannanshire 23.5 64.8 3.0 91.3 21.3 59.6 3.0 83.9
East Lothian 23.3 68.0 4.4 95.7 24.8 66.7 4.4 95.9
Edinburgh 20.3 63.5 4.5 88.2 14.7 53.1 4.5 72.2
Falkirk 25.8 63.3 3.5 92.6 19.4 53.5 3.5 76.5
Fife 31.8 70.2 3.9 106.0 29.8 68.6 3.9 102.3
Midlothian 13.8 58.7 3.5 75.9 13.8 55.8 3.5 73.0
West Lothian 21.5 68.2 3.5 93.1 21.6 65.9 3.3 90.7
SEStran 25.2 68.3 4.0 97.5 22.6 62.7 4.0 89.3
3.3.9 Figure AA shows the quality score and its effect on Generalised Journey Time (as Boarding Penalty Offset). This shows the lower than average quality standards in the Clackmannanshire, Falkirk, Midlothian and West Lothian area.

©The TAS Partnership Limited ▪ October 08
T:\20010C SEStran Bus Initiatives\Task Note and Reports\20010 TN3 Issue 3 Fares Review.doc ▪ Generalised Journey Time ▪ 62
Figure AA: Quality Score and Boarding Time Offset by Authority
0
10
20
30
40
50
60
70
80
90
100
Bord
ers
Clac
kman
nans
hire
East Lot
hian
Edinbu
rgh
Falkirk Fif
e
Midloth
ian
Wes
t Lot
hian
SESt
ran
Qu
ali
ty S
core
0
0.5
1
1.5
2
2.5
3
3.5
4
4.5
5
Bo
ard
ing
Pen
alt
y O
ffse
t
Score Boarding Penalty Offset
3.3.10 Averages can hide examples of good and poor performance. Our experience of quality was that it was highly variable, reflecting different standards across the area. This is illustrated using the hi-low chart in Figure BB. This shows the minimum score (green), average (blue) and maximum (red). Whilst the length of the bar reflects the range of variance, the position of the average is critical. For SEStran as a whole, the range is from 9 to 93, but an average of 67 shows the predominance of higher rather than lower scores.

©The TAS Partnership Limited ▪ October 08
T:\20010C SEStran Bus Initiatives\Task Note and Reports\20010 TN3 Issue 3 Fares Review.doc ▪ Generalised Journey Time ▪ 63
Figure BB: Range of Quality Scores
0
10
20
30
40
50
60
70
80
90
100
Bord
ers
Clac
kman
nans
hire
East Lot
hian
Edinbu
rgh
Falkirk Fif
e
Midloth
ian
Wes
t Lot
hian
SESt
ran
Qu
ali
ty S
core
Avg Min Max
3.3.11 Overall therefore it is clear that quality standards are generally high, however there is still much to be done to meet user expectations. Most of the poor scores come in the Falkirk and Clackmannanshire areas and while this predates some recent fleet investment by First there is still room for improvement particular in the infrastructure areas as discussed in Task Note 4.


©The TAS Partnership Limited ▪ October 08
Issue 3: Value for Money Assessment ▪ First Draft: Error! No text of specified style in document. ▪ 65
Conclusions 4
4.1 Overarching Findings
4.1.1 In the majority of cases bus services in the SEStran area offer good value for money to the user. This is particularly the case in the Greater Edinburgh urban area and many of the weaker services are in the former Central region. Variation in price by area generally reflects market potential.
4.1.2 It is fair to say though that the high quality scores normally only reflect what we would expect a good bus service to achieve. Within the study area there are some excellent examples of ultra high quality on specific corridors. There is a need to increase quality where the scores are low in order to retain and grow patronage.
4.1.3 There is virtually no practical opportunity for local authorities to influence fare levels – and indeed we don’t believe such influence is required. Fare levels are vital to the industries economic model and restraint may damage this. Local authority influence should be to improve quality in partnership with the operators.
4.1.4 We have real concerns though, that there is the capacity to achieve this in terms of financial and human resource. Consultation during this project reveals, shockingly, that some authorities have long standing zero budgets for bus capital investment and little for repairs and maintenance. Operators reported that long established bus priority measures are not adequately maintained and this is impacting on quality.
4.1.5 High level partnership planning is required to focus investment and limited resources into the most appropriate corridors. It is always challenging to co-ordinate investment when decision making and delivery can have different lead times, however this can be resolved through effective partnership and communication.
4.2 Pricing and Quality
4.2.1 The main purpose of this section of our work was to establish value for money and to identify areas where fares might be considered excessive.
4.2.2 Across the area, fare levels are bound to face comparison with Lothian Buses’ flat fare (£1 at time of analysis) and discounted multi journey tickets. The flat fare is a commercial policy of Lothian Buses and the volume of bus travel in Edinburgh allows it to produce a sufficient level of profit to maintain this low fare level and still invest significantly in new buses. With any flat fare scheme there is an inherent level of winners and losers, with short-distance journeys paying above average rates per mile while longer distance journeys are made

©The TAS Partnership Limited ▪ October 08
Issue 3: Value for Money Assessment ▪ First Draft: Error! No text of specified style in document. ▪ 66
at a seeming low fares. Generally this can be defended as studies have shown that fares elasticities are higher for longer journeys and that there is greater resistance to fare increases for longer journeys, though the latter is also the case for very short journeys.
4.2.3 The volume of bus travel in other parts of the SEStran area does not match that in Edinburgh. Coupled with the nature of networks in the suburban areas which have multiple links with no dominant central focus, it is very unlikely that any other operator could successfully adopt a low flat fare policy similar to Lothian’s. There are one or two isolated local journeys outside Edinburgh where there are single fares below £1, but typical fares for other local journeys lie in the £1.20-£1.40 bracket. This is in line with the market rate in much of the UK.
4.2.4 Interurban and suburban journeys vary rather more in fare level. The fares for such journeys in Fife were found to be significantly higher than in other areas, with, for example, single fares above £3 for some journeys of around 25 minutes. We also paid some of the highest single fares for journeys linking Fife with Edinburgh - £7 single. Yet in both cases these high value single fares are only part of the story. Stagecoach Fife has some of the most heavily discounted multi journey tickets and in the off-peak day return fares between Fife and Edinburgh reduce the £7 single fare significantly21. It must also be noted that this is a high quality operation, with recent investment in new vehicles and improved services and the ‘high’ £7 fare compares very favourably with parallel rail fares for those of a limited budget or who are not time constrained and critically to cost of car travel.
4.2.5 Longer distance fares, although high in cash value, offer some of the best bargains in terms of rate per mile. Even our highest single fare paid - £8.50 from Edinburgh to Eyemouth – translates to only fourteen pence per mile. We conclude, therefore, that we have found no evidence that bus travel is unjustifiably expensive.
4.2.6 There is no direct relationship between price and quality, reflecting the fact that operating costs are the key influencers of pricing policy. There are examples, especially in the former central region where the quality of the total travel experience is low. This covers elements in the control of the operators and the authorities.
4.3 Delivering Quality and Value for Money
4.3.1 Whilst our survey focused on single fares, there are significant discounts for more frequent travellers on a daily, weekly, monthly, quarterly or annual basis. The vast majority of journeys made on prepaid tickets involve those of individual operators. While One Ticket provides multi journey and multi model alternatives, take up is low.
21 For one of our sample one-way journeys we were sold a cheaper day return as an alternative to the one-way single.
©The TAS Partnership Limited ▪ October 08
Issue 3: Value for Money Assessment ▪ First Draft: Error! No text of specified style in document. ▪ 67
4.3.2 The mixture of markets served by First and Stagecoach in particulars cause some complexity in the ticket range. Towns such as Falkirk and Dunfermline have their own local markets and tickets for travel within the town only. Allied to this there are tickets for travel throughout the locality and often a third tier allowing travel to/from Edinburgh.
4.3.3 These tickets are effective, especially where payment can be made electronically by direct debit or by card. However some period tickets cannot be bought on bus and even those which can, can pose difficulties, such as purchasing a two zone FirstWeek ticket at £19 on an exact fare only service. One Ticket and others can be bought through PayPoint, but there are gaps in the PayPoint network – Livingston town centre being an example. The inability to purchase the one day One Tickets on bus limits the usefulness of a range of tickets which could offer real benefits to passengers making some journeys where a one operator ticket is unsuitable.
4.3.4 Some perceive such structures to have weaknesses, primarily from a social inclusion objective. Greatest discounts go to those who can afford to buy travel in bulk in advance whereas those on low incomes may not be able to make such a one off outlay. Equally those who do not travel frequently but do travel regularly (eg 2 days/week) get no discount. While such views may be valid it is not clear what the solution is. Broadly speaking the ticket structure provides what the market wants. There are some examples where discounts are available for the occasional user, such as pre-purchase single tickets at a 12 or 13 for the price of 10 offer but generally these have low take up. Legislation does permit public funding to be used to discount fare levels for those with low income in certain circumstances and this remains the most practical way of solving any disparities.
4.3.5 There is one area where we have concerns regarding significant apparent overpricing and this relates to the One Ticket range. Both the bus only and bus – rail versions are priced at very significant premia over the nearest alternative tickets. The bus-rail versions, for example, are often more expensive than buying separate bus and rail season tickets. We consider that this results from a pricing policy which protects revenue at the maximum points of possible use, rather than reflecting points of likely use. As One Ticket is the only multi operator ticket, and the only multi journey ticket available on many of the smaller operators, this is unfortunate.
4.4 Perceptions
4.4.1 We must, however, consider that some fares appear high in value (if not in terms of rate per mile) for journeys which might be considered to be ‘typical’ journeys. Fares which will represent significant outlay to those on a low income, where the actual fare value matters more than the rate per mile. Some examples in our survey include Dunfermline to Glenrothes at £4.25; Falkirk to Bathgate at £3.40 and Peebles to Galashiels at £3.70. The major

©The TAS Partnership Limited ▪ October 08
Issue 3: Value for Money Assessment ▪ First Draft: Error! No text of specified style in document. ▪ 68
operators (and Munro’s) all offer multi journey tickets which can overcome these high fares to a degree, but there are few alternatives where such journeys are provided by smaller operators or if the journeys cross ticket boundaries.
4.5 Competition
4.5.1 There is no evidence that the presence of smaller operators in an area leads to reduction in fare levels. The principal multi operator area is West Lothian and there seems little evidence of lower fares in areas with many operators such as the Whitburn – Bathgate – Livingston corridor. Smaller operators on secured services broadly follow the fare levels adopted by First in most of its area outside Edinburgh – understandable, as this is either guidance or a stipulation of contract conditions. It is a clear equation, lower fares on secured services would lead directly to higher contract prices and therefore probably the inability to continue to support the current level of service within the available budgets.
4.6 Local Authority Influence
4.6.1 It is disappointing that there is little consistency in fares conditions attached to secured services, particularly with regard to accepting tickets issued by the principal main day operator. This is a major way of overcoming some of the shortcomings of having a change of operator at certain times of the day, although Borders does deserve much credit for this and for maintaining fare structures.
4.6.2 Although most authorities do now stipulate acceptance of the ‘One Ticket’ range on secured services, there are exceptions and at least one operator of a major service funded by Bus Route Development Grant (Davidson’s) does not accept One Ticket. This is doubly unfortunate as the service in question provides a strategic link to employment areas.