issn 2231-3265 international journal of health, …ijhpecss.org/healthjournal.pdfissn 2231-3265...
TRANSCRIPT
ISSN 2231-3265 International Journal of Health, Physical Education and Computer Science in Sports
Volume No.2, No.1.
1
ISSN 2231-3265 International Journal of Health, Physical Education and Computer Science in Sports
Volume No.2, No.1.
2
Publisher: Indian Federation of Computer Science in sports www.ijhpecss.org under the auspices of International Association of Computer Science in sports Email:[email protected]
International Journal of Health, Physical Education and Computer Science in sports (ISSN 2231-3265 On-line and Print) Journal published Quarterly for the months of March, June, September and December. IJHPECSS is refereed Journal Published by the Indian Federation of Computer Science in sports
Editorial Board Editors Prof.Syed Ibrahim, Saudi Arabia Dr.Rajesh Kumar, India Dr.L.B.Laxmikanth Rathod, India Associate Editors: Prof. P.Venkat Reddy, India Dr.Kaukab Azeem, Saudi Arabia Y.Emmanuel S. Kumar, India Dr.Quadri Syed Javeed, India Members: Prof.G.L.Khanna, India Prof. Chenlei, China Lila Sabbaghian Rad, Iran Prof.C.V.Prasad Babu, India Dr.Y.Kishore, India Dr.M.Shyam Babu, India J.Prabhakar Rao, India Dr.K.P. Manilal, India Dr.Y.S.Laxmeesha, India Dr.P.Ravi Shankar, India S.R.Prem Raj, India Bikash Karar, India
International Journal of Health, Physical Education and Computer Science in Sports is multidisciplinary peer reviewed journal, mainly publishes original research articles on Health, Physical Education and Computer Science in Sports, including applied papers on sports sciences and sports engineering, computer and information, health managements, sports medicine etc. The International Journal of Health, Physical Education and Computer Science in sports is an open access and print international journal devoted to the promotion of health, fitness, physical Education and computer sciences involved in sports. It also provides an International forum for the communication and evaluation of data, methods and findings in health, physical education and computer science in sports. The Journal publishes original research papers and all manuscripts are peer review.
ISSN 2231-3265 International Journal of Health, Physical Education and Computer Science in Sports
Volume No.2, No.1.
3
Reaction Time of Female with respect to nature of stimulus and Age 7
Dr.Ashoke Kumar Biswas, Dr.Sudip Sundar Das, Shika Debnath, Prof.Sudarshan Bhowmick 7
Physical and Performance Characteristics of Indian Elite Volleyball Players 11
Dr.Sudip Sundar Das, Dr.Ashoke Kumar Biswas, Dr.Amit Sarkar, 11
Sri Tarat Bhatacharya and Prof. A.K.Banerjee 11
Effects of two different fat reduction with aerobic exercise on selected lipid profile status among middle aged women 18
Dr.R.Venkatesan 18
A study on the effect of flexibility training on the change of performance in agility 22
Dr.K.Abdussalam, 22
Private gyms in Pune city – Today and Tomorrow 26
Dr. M.R. Gaikwad 26
The Impact of Lateral Thinking Training (LTT) on the Level of Aspiration and Achievement Motivation of Physical Education Students” 28
Dr. Jayashree S. Reddy. Mr. Amareshwar S. Reddy, 28
Personality traits, emotional intelligence and value orientation of international cricketer Sanjay Bangar 31
Bhandare Prasad and **Prof. Tiwari Pratap Singh 31
Effect of eight week participation in physical education and conditioning programmes on flexibility 35
Mrs. V. Deepika 35
Kinematic analysis of block placements and its effects on stride distance and stride time in sprint starts 37
Dr. S. J.Shabu 37
Analysis of propulsive task related physical fitness in obese and non obese adolescent girls 41
Minaxi M. Patel 41
A Study of Nutritional status of National Level Wrestlers of Maharashtra 43
Dr. Jayant Chatur, 43
Mr. Prakash Dagwar 43
An analytical study on psychological factors of football players & hockey players in Telangana universities 46
Dr.B.Sunil Kumar, 46
Srinivas Nallela, 46
The comparison of body composition of Iranian soccer players in different playing positions during competitions season 48
Attarzadeh Hosseini SR1, (Ph.D); Soltani H
2, (Ph.D.Research Scholar); Farahneia M
3, (MS); Hojati
Z4(Ph.D. Research Scholar). 48
ISSN 2231-3265 International Journal of Health, Physical Education and Computer Science in Sports
Volume No.2, No.1.
4
A Comparative Study-Competition in the institution of rural and urban area of Warangal district 51
Dr.Mohd.Moize Ahmed 51
Effect of sand and land plyometric training on speed and explosive power among volleyball players 53
K.Kamalakkannan* Dr.Kaukab Azeem** Dr.C.Arumugam*** 53
Indian society and sports culture: study of current trends in sports management in sociological perspective 56
Dr. Shafioddin S.Shaikh, 56
A study on the effect of eleven week conditioning and four week deconditioning program on body composition and cardiorespiratory responses of female students 59
Dr. Y. Kishore, 59
Prof.Syed Ibrahim, 59
Effect of Progressive Weight Training on Selected Health Related Physical Fitness Components Among Degree College Male Students in Visakhapatnam 62
A.Raghu 62
Dr.M.Syam Babu 62
Positive Self Talk 65
R.Harinarayana rao 65
Personality traits of athletes and non athletes 67
Dr. Shekhar N. Shirsath 67
A Study of Introvert-Extrovert, and Self-Concept of Interuniversity Badminton Players 69
Dr. Quadri Syed Javeed 69
The effect of yoga on quality of life of for chronic lower back pain patients: a study 72
Dr.L.B.Laxmikanth Rathod 72
A Study of Locus of Control among Wrestlers and Non-Wrestlers 75
Shri. Vidhate Namdeo Jaywantrao 75
A Comparative Study of Physical Fitness of Indoor and Outdoor Players 77
Shri. Dhonde S.P. 77
Effect of Plyometric and Cycle Ergometer Training on Anaerobic ability of Basketballers 79
*Arvind S Sajwan, 79
**Satpal Yadav, 79
***Vinay Sharma, 79
Education & Knowledge creates an aura of creative in a teacher 85
Syed Farooq Kamal 85
Efficacy of intensive and extensive interval training and its cessation on selected speed parameters 87
ISSN 2231-3265 International Journal of Health, Physical Education and Computer Science in Sports
Volume No.2, No.1.
5
*Mr. K. Rajasekhar and **Dr.P.Johnson 87
Periodical assessment for two-year of systematic hockey academy training program on aerobic capacity 90
* Mrs. V. Hymavathi and **Dr. P. Johnson 90
An academic approach to Physical Education 95
Sundar Raj Urs, 95
A comparative study - Anxiety among junior and senior players 98
Dr. Kalpana B. Zarikar 98
A study of the job satisfaction and job stress on secondary school physical education teachers 100
Dr. Bharat Z. Patel 100
A Systematic Review on Life-Change Events and Participation in Physical Activity 103
G.P.Param Jyothi ,S.R.Prem Raj, P.Ravi Shankar 103
AA SSttuuddyy ooff SSeellff--CCoonncceepptt aanndd AAddaappttaabbiilliittyy ooff IInntteerruunniivveerrssiittyy KKaabbaaddddii PPllaayyeerrss 106
Dr. Bhaskar D. Salvi , 106
Dr. Quadri Sayed Javeed , 106
Dr.Jyoti Dhama Prakash, 106
Influence of cardiac fitness for healthy life 109
Mr. Jayaraman.S, 109
Status and recognition of sportswomen in Indian society 111
Vasanthi Kadhiravan 111
A comparative study of physical fitness among students of a.p. tribla welfare and social welfare residential schools in warangal district. 114
J.Somanna, 114
Physical Education and 21st
Century Learners: A Consensus Statement 116
Christopher R. Edginton, 116
Ming-kai Chin, 116
Gulshan Khanna, 116
A study on physical efficiency, mental health and intelligence of rural and urban school children of Krishna district in Andhra Pradesh 119
Dr. Nalluri Srinivasa Rao, 119
Readiness of Instructors Involved in theFields of Physical Education and Sports ScienceTo Welcome Total Quality Management 122
1Lila Sabbaghian Rad,
2Haniyeh Yari 122
A comparative study on the differences in crouch start & standing start in 100 meters run in Athletics 127
Dr.Rajesh Kumar, 127
ISSN 2231-3265 International Journal of Health, Physical Education and Computer Science in Sports
Volume No.2, No.1.
6
Stress Management – The key to success in sports 131
K.Ram Reddy, 131
Rehabilitation of knee injuries in kabbadi players in Punjab 132
Jalawar Singh, 132
Dr.Jagmohan Singh, 132
Dr.Masilmani Neethi, 132
A comparative study on anxiety and aggression among athletes and non-athletes. 134
Sri. Pradeepkumar.U 134
Dr.Chandrappa, 134
Nutritional Supplements in Sports- An over view 136
Dr.M.V.L.Surya Kumari 136
A comparative study on speed among boxers and judokas of Andhra Pradesh 139
K.R.Steven ,(Retd) 139
A study on the physical fitness among basket ball and hand ball players in Hyderabad 142
J.Prabhakar Rao, 142
Motivation in sports psychology 144
Dr.V.Satyanarayana, 144
Sandeep Jadhav, 144
A comparative study on aerobic endurance among athletes and hockey player’s of Hyderabad district 146
Prof.P.Venkat Reddy, E.Jyothi, 146
Sports Management 148
Prof.K.Surender Reddy,M.Emily Rose, 148
A comparative study of aerobic endurance among hand ball players and basket ball players in Hyderabad 150
Dr.I.Balram Reddy, 150
Mr.A.Xavier, 150
Mr.Bikash Karar, 150
Mr.Sunil Dutt, 150
Mr.Y.E.Shashi Kumar, 150
Strategy in Chess 152
K.Kanna Reddy, 152
ISSN 2231-3265 International Journal of Health, Physical Education and Computer Science in Sports
Volume No.2, No.1.
7
Pp7-10
Reaction Time of Female with respect to nature of stimulus and Age
By Dr.Ashoke Kumar Biswas, Dr.Sudip Sundar Das, Shika Debnath, Prof.Sudarshan Bhowmick
ABSTRACT
Objectives: To react to stimulus is a fundamental demand of life. In the field of games & sports reaction ability is a determining factor of performance. So, the reaction time occupies an important area of study and research in physical education and sports. A number of studies have been conducted in the psycho-physiological area to analyze the variation in reaction ability of individuals with respect to nature of stimulus and age. Results indicate that reaction time of an individual varies with change of nature of stimulus and increase of age. Present study was planned to analyze this change in reaction time for different age group of females using three different types of stimuli – visual, auditory, and tactile. Methodology: A total of 800 female subjects of 05 to 70 years of age were selected as subjects. They were divided into 16 equal sized age groups of 50 subjects each. The reaction time was measured by multipurpose digital electronic reaction timer for auditory, visual, and tactile signals as stimuli. Results and Conclusions: Results showed that the mean values of auditory reaction time were the lowest for all the age groups. Results also indicated that with different stimuli the reaction time decreased with increase of age up to 20-25 years and thereafter the reaction time increased gradually with increase of age. The trend of change in reaction time with age for all the three stimuli was similar. The results have been supported by many other research studies. Welford (1980) and Galton (1899) reported from their study that the mean auditory reaction time varied from 140 to 160 ms and visual reaction time varied from 180 to 200ms. Welford (1977), Jevas and Yan (2001), Luchies et al. (2002) and Rose et al. (2002) found the changes in reaction time with respect to age from infancy to late sixty. Key words: Psycho-physiological, Auditory, Visual, and Tactile. INTRODUCTION To react to an external stimulus is a basic property of life and living being. To react to a stimulus is of fundamental importance for adaptation with the environment. So, the ability to react is very important for all living beings. Reaction time influences the reaction ability. Reaction time has been defined as the time elapsing between the onset of a stimulus and the onset of a response to that stimulus. Reaction time has become an important area of research for experimental psychologists since middle of 19
th Century. The researchers have identified different types of reaction time such as simple
reaction time (Luce, 1986), recognition reaction time (Welford, 1980) and choice reaction time (Donders, 1868). For about 120 years the accepted mean values of reaction time for college population have been about 0.19s for light and 0.16s for sound respectively (Brebner and Welford, 1980). METHODOLOGY A total of 800 female subjects taking 50 from each of sixteen age groups of 05 to 07 yrs, 08 to 10 yrs, 11 to 12 yrs, 13 to 15 yrs, 16 to 17 yrs, 18 to 20 yrs, 21 to 25 yrs, 26 to 30 yrs, 31 to 35 yrs, 36 to 40 yrs, 41 to 45 yrs, 46 to 50 yrs, 51 to 55 yrs, 56 to 60 yrs, 61 to 65 yrs and 66 to 70 yrs. were randomly selected as subjects.Three different types of stimuli were used to measure the reaction time. These were visual stimulus, auditory stimulus, and tactile stimulus. Reaction time was measured by a multipurpose digital electronic reaction timer capable of measuring reaction time for one hundredth part of a second. The subjects were tested for reaction time in the afternoon between 4-6 p.m. At first the subjects of a group were assembled in a place and clearly informed about the purpose of the study. Later on, the method to measure reaction time was explained. The visual stimulus was used at first to measure reaction ability. It was followed by the auditory stimulus and at last the tactile stimulus. The collected data were statistically analyzed using ASP software. For descriptive statistics Mean and Standard Deviation were computed. Analysis of variance was done to test the significance of the inter group variation. Post hoc test was also conducted to find out the exact location of the inter group variation.
ISSN 2231-3265 International Journal of Health, Physical Education and Computer Science in Sports
Volume No.2, No.1.
8
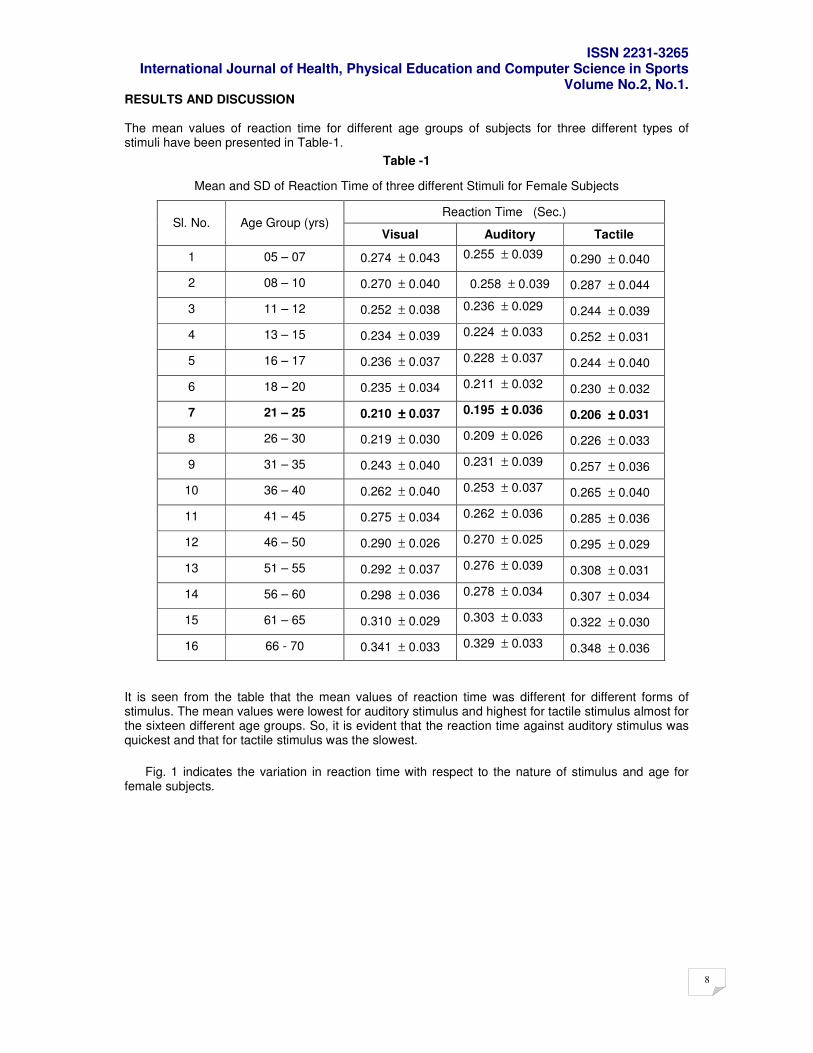
RESULTS AND DISCUSSION The mean values of reaction time for different age groups of subjects for three different types of stimuli have been presented in Table-1.
Table -1
Mean and SD of Reaction Time of three different Stimuli for Female Subjects
Reaction Time (Sec.) Sl. No. Age Group (yrs)
Visual Auditory Tactile
1 05 – 07 0.274 ± 0.043 0.255 ± 0.039 0.290 ± 0.040
2 08 – 10 0.270 ± 0.040 0.258 ± 0.039 0.287 ± 0.044
3 11 – 12 0.252 ± 0.038 0.236 ± 0.029 0.244 ± 0.039
4 13 – 15 0.234 ± 0.039 0.224 ± 0.033 0.252 ± 0.031
5 16 – 17 0.236 ± 0.037 0.228 ± 0.037 0.244 ± 0.040
6 18 – 20 0.235 ± 0.034 0.211 ± 0.032 0.230 ± 0.032
7 21 – 25 0.210 ±±±± 0.037 0.195 ±±±± 0.036 0.206 ±±±± 0.031
8 26 – 30 0.219 ± 0.030 0.209 ± 0.026 0.226 ± 0.033
9 31 – 35 0.243 ± 0.040 0.231 ± 0.039 0.257 ± 0.036
10 36 – 40 0.262 ± 0.040 0.253 ± 0.037 0.265 ± 0.040
11 41 – 45 0.275 ± 0.034 0.262 ± 0.036 0.285 ± 0.036
12 46 – 50 0.290 ± 0.026 0.270 ± 0.025 0.295 ± 0.029
13 51 – 55 0.292 ± 0.037 0.276 ± 0.039 0.308 ± 0.031
14 56 – 60 0.298 ± 0.036 0.278 ± 0.034 0.307 ± 0.034
15 61 – 65 0.310 ± 0.029 0.303 ± 0.033 0.322 ± 0.030
16 66 - 70 0.341 ± 0.033 0.329 ± 0.033 0.348 ± 0.036
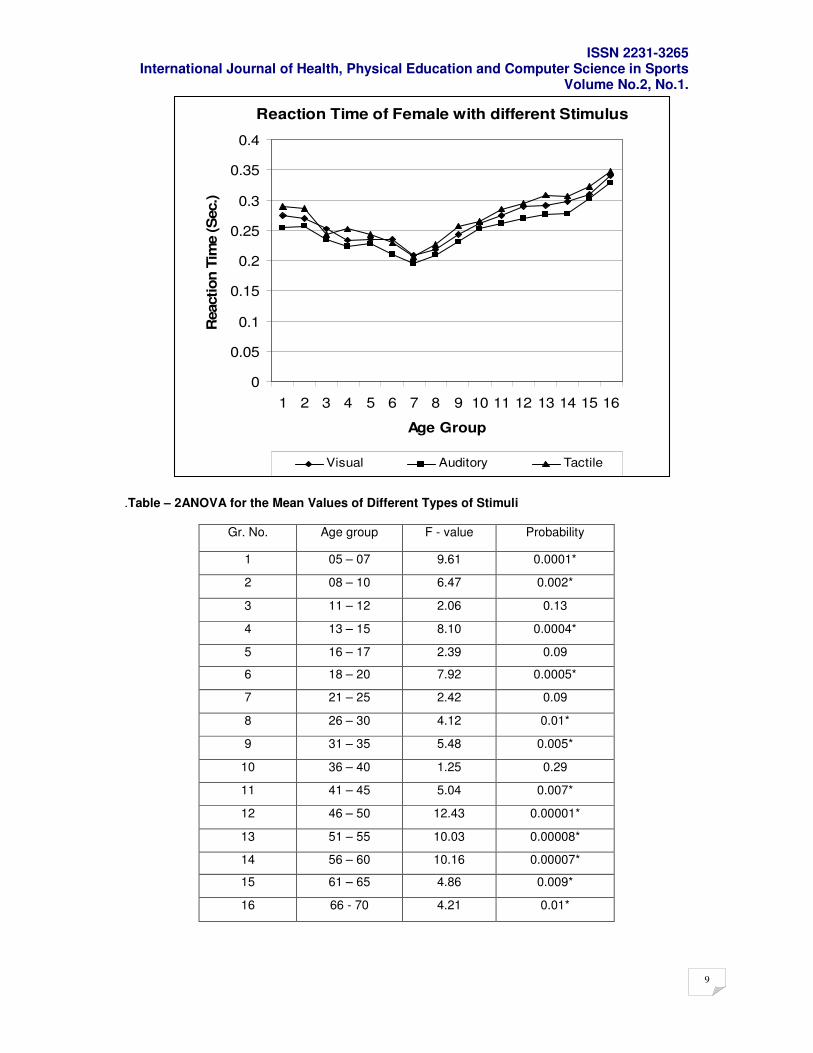
It is seen from the table that the mean values of reaction time was different for different forms of stimulus. The mean values were lowest for auditory stimulus and highest for tactile stimulus almost for the sixteen different age groups. So, it is evident that the reaction time against auditory stimulus was quickest and that for tactile stimulus was the slowest.
Fig. 1 indicates the variation in reaction time with respect to the nature of stimulus and age for female subjects.
ISSN 2231-3265 International Journal of Health, Physical Education and Computer Science in Sports
Volume No.2, No.1.
9
Reaction Time of Female with different Stimulus
0
0.05
0.1
0.15
0.2
0.25
0.3
0.35
0.4
1 2 3 4 5 6 7 8 9 10 11 12 13 14 15 16
Age Group
Reaction T
ime (S
ec.)
Visual Auditory Tactile
.Table – 2ANOVA for the Mean Values of Different Types of Stimuli
Gr. No. Age group F - value Probability
1 05 – 07 9.61 0.0001*
2 08 – 10 6.47 0.002*
3 11 – 12 2.06 0.13
4 13 – 15 8.10 0.0004*
5 16 – 17 2.39 0.09
6 18 – 20 7.92 0.0005*
7 21 – 25 2.42 0.09
8 26 – 30 4.12 0.01*
9 31 – 35 5.48 0.005*
10 36 – 40 1.25 0.29
11 41 – 45 5.04 0.007*
12 46 – 50 12.43 0.00001*
13 51 – 55 10.03 0.00008*
14 56 – 60 10.16 0.00007*
15 61 – 65 4.86 0.009*
16 66 - 70 4.21 0.01*
ISSN 2231-3265 International Journal of Health, Physical Education and Computer Science in Sports
Volume No.2, No.1.
10
It is clear from the table values that in twelve out of sixteen age groups, the differences among mean values of reaction time with three different types of stimuli were statistically significant. Results of the post hoc test indicated that the mean value of reaction time with auditory stimulus was significantly lower than those of both visual and tactile stimuli.Similar results have been reported by Welford (1980) and Galton (1899). As per their report the mean auditory reaction time varied from 140 to 160 ms, whereas the mean value of visual reaction time varied from 180 to 200ms. As the explanation it was mentioned that the auditory stimulus took 8 to 10 ms to reach the brain (Kemp et al., 1973) but the visual stimulus takes 20 to 40 ms for that (Marshall et al., 1943).The table values also indicate a definite pattern of change in reaction time with respect to age. The mean reaction time decreased with increase of age up to the level of 21-25 years. The mean reaction time became the minimum at this period. After that, the mean reaction time increased gradually with increase of age. This pattern of change in reaction time was same for all the three types of stimuli. CONCLUSION Within the limitation of the present study following conclusions were drawn:
a) The auditory stimulus produces quicker reaction than both of visual and tactile stimuli. b) The visual stimulus is better in producing quicker reaction than the tactile stimulus. c) The reaction time decreases with the increase of age up to the age of 21-25 years. d) The reaction time becomes lowest showing quickest reaction ability of an individual during 21-
25 years of age
REFERENCES
Ando, S., N. Kida and S. Oda. Practice effects on reaction time for peripheral and central visual fields. Perceptual and Motor Skills, 95(3), 2002: 747-752.
Bellis, C.J. Reaction time and chronological age. Proceedings of the Society for Experimental Biology
and Medicine, 30, 1933 :801. Brebner, J.T. Reaction time in personality theory. In A.T. Welford (Ed.), Reaction Times. Academic
Press, New York, 1980: 309-320. Brebner, J.T. and A.T. Welford. Introduction : an historical background sketch. In A.T. Welford (Ed.),
Reaction Times. Academic Press, New York, 1980,1-23. Donders, F. C. On the speed of mental processes. Translated by W. G. Koster, 1969. Acta
Psychologica, 30, 1868: 412-431.
ISSN 2231-3265 International Journal of Health, Physical Education and Computer Science in Sports
Volume No.2, No.1.
11
Pp11-14
Physical and Performance Characteristics of Indian Elite Volleyball Players
By
Dr.Sudip Sundar Das, Dr.Ashoke Kumar Biswas, Dr.Amit Sarkar, Sri Tarat Bhatacharya and Prof. A.K.Banerjee
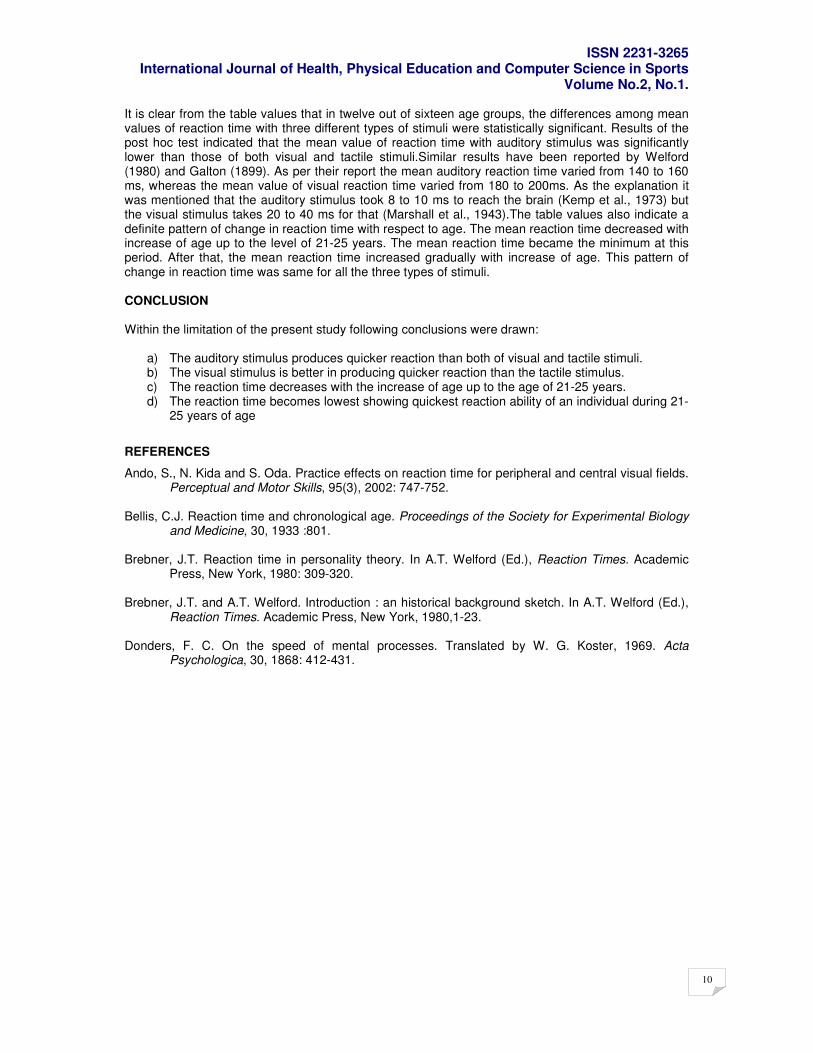
Introduction : Analysis of the performance of Volleyball players indicate that Volleyball game has developed into a highly competitive sport and success in Volleyball is the outcome of display of power, physical fitness abilities, absolute self control, concentration and physique. Another important and integral part of the game is better jumping ability. The physical characteristics of the sports persons is one of the determining factor on which the performance depends, be it individual sport or team games. Puhl et. al. (1982); It has been well established that specific physical characteristics indicate whether the player would be suitable for the competition at the highest level in a specific sport (Claessens, Lefevre, Beunen, & Malina, 1999; Bourgois et al., 2000; Reilly, Bangsbo, & Franks, 2000; Gabbett, 2000; Ackland, Ong, Kerr, & Ridge, 2003; Slater et al., 2005). Spence et. al. (1980) have studied the relationship between human structure and performance and they concluded that height, weight, body composition such as lean body mass, fat percentage affects physical performance. However such studies on Indian Volleyball Players are rare. Hence, the present study was undertaken to look into the prophylactic status of male Indian Volleyball players which are expected to have a positive correlation with performance. Purpose : The purpose was to study the physical and performance characteristics of elite Indian Volleyball Players. To observe the position or to get an idea of their (of Indian Volleyball players) standard in respect of physical and performance characteristics in the light of the present available data of other some of the International team players. Methodology :
The subjects of the study were male volleyball players who have represented their state in the National Championshi.For the study of physical characteristic different components were considered as- Age (Yrs.); Height (cm.); Wight (kg) and Body fat (%) through muscles girths i.e. Biceps, Abdomen, Rt. Thigh and Calf girth (McArdle,.W.D.et.al,1991) . All the measurements were taken according to standard protocol. For performance characteristics different components were (i) Speed; (ii) Strength & Strength endurance of abdominal muscles (iii) Hip flexibility (iv) Agility and (v) Leg power. From the absolute Jump & reach (vertical jump) test scores jump above the net height were computed and percentage of jump above the net according to net height also computed. The tests were conducted according to standard protocol. Following tests were conducted for each performer-
i) 30m dash for speed ii) Sit-ups for abdominal muscular endurance iii) Modified sit & reach test for trunk flexibility iv) Vertical jump for leg power
All the data are presented as the group mean in the various tables. No other statistics have computed as because –(i) it is a presentation about the Indian state level volleyball players status in connection with physical and performance characteristics and (ii) it would be better when another set of data is available in the table and (iii) no individual data is available for the other International teams.
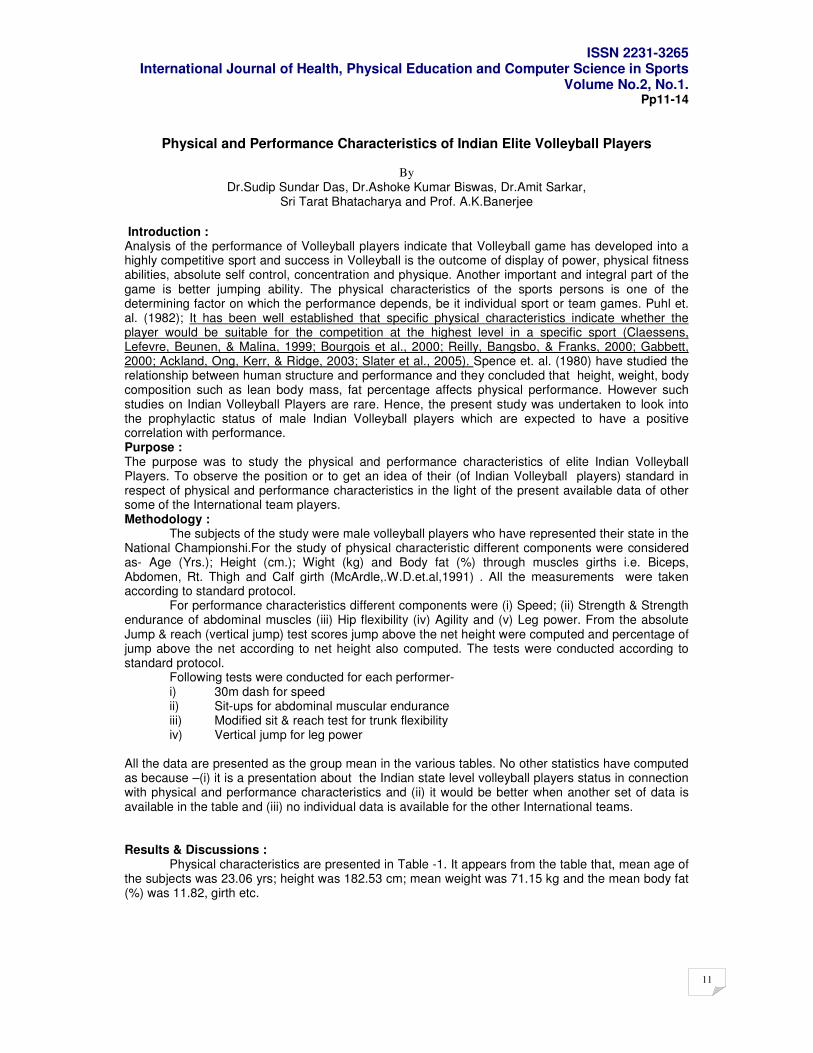
Results & Discussions : Physical characteristics are presented in Table -1. It appears from the table that, mean age of the subjects was 23.06 yrs; height was 182.53 cm; mean weight was 71.15 kg and the mean body fat (%) was 11.82, girth etc.
ISSN 2231-3265 International Journal of Health, Physical Education and Computer Science in Sports
Volume No.2, No.1.
12
Table- 1. Physical Characteristics of the Indian State Level Volleyball Players.
Parameter Age (Yrs) Height (cm) Weight (kg) Body fat (%)
Score 23.06 182.53 71.15 11.8
Performance characteristics are presented in Table -2. It appears from the table that, mean 30m dash (sec) was 3.96; Sit-ups (no) was 48.31; Sit & reach (cm) was 2.31; Shuttle run (sec) score was 6.98; Actual jump and reach height (cm) score was 316.50; Absolute jump and reach height (cm) score was 74.35; Reach above the net (cm) score was 73.50 and % according to net height (cm) was 130.24.
Table- 2. Performance Characteristics of the Indian State Level Volleyball Players
Parameter 30m dash (sec)
Sit-ups (no)
Sit & reach (cm)
Shuttle run (sec)
Actual jump and reach height (cm)
Absolute jump and reach height (cm)
Reach above the net (cm)
% according to net height (cm)
Score 3.96 48.31 2.31 6.98 316.50 74.35 73.50 130.24
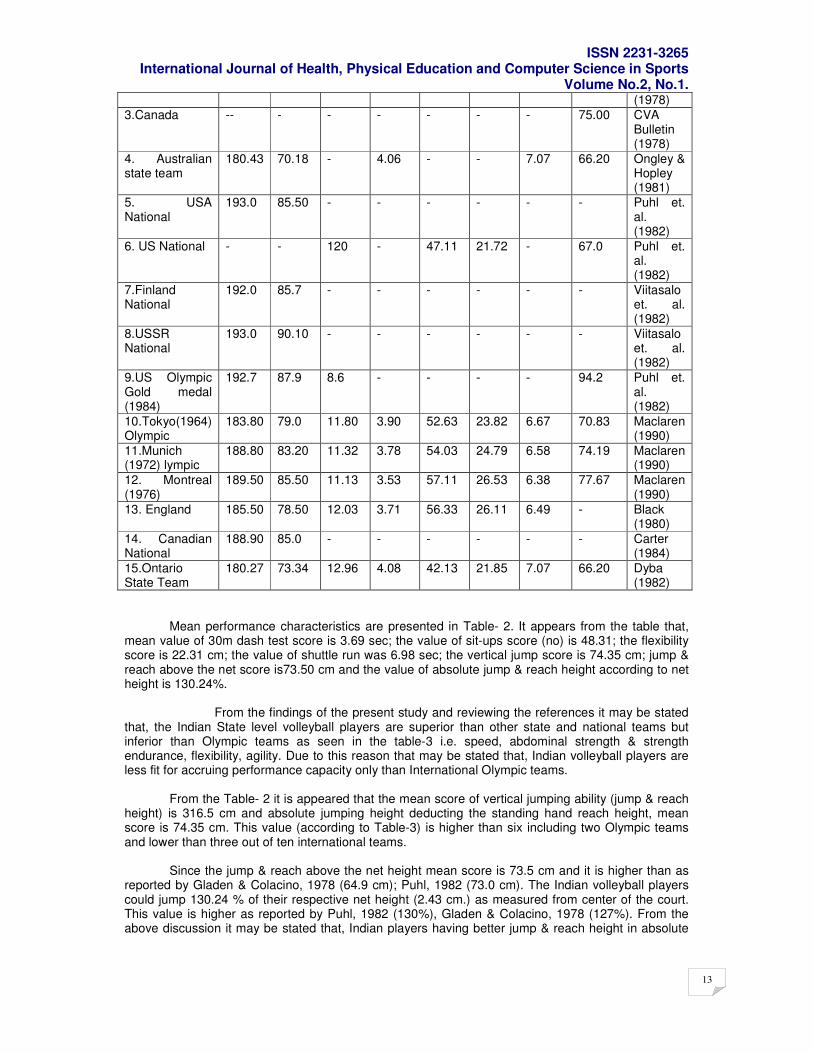
Physical and performance characteristics of Indian state level players and other International Volleyball teams are presented in Table-3. It appears from the Table-3 that, the Indian Volleyball players were taller and heavier than Australian state team and Ontario State Team only but, they (Indian) are shorter and less heavier or well behind other ten (10) international team members. In case of body fat (%)it may be indicated that, variation with international level teams are comparatively less than four and higher than four team members. That means Indian players, are well comparable with other teams in respect of fat (%). Nakmura et. al. (1986) stated that, tall players who are good jumpers are the norm of elite levels of Volleyball game. Fleck et. al. (1985) highlighted that low percentage body fat as the most important physical characteristics in Volleyball. Dey & Sinha (1994) stated that less body fat (%) is a sign of good physical fitness as body fat (%) above a certain level is negatively associated with physical fitness. From the finding of the present study, and reviewing the research reports it may be stated that, Indian players are shorter, less heavier (wt) and having comparatively higher and lower body fat (%) than 50% of the International teams here presented. Although heights is largely genetic factor and can not be increased by training but, less height is positively associated with good jumping ability as Volleyball is played over a net height of 2.43 m. Though body fat (%) have a relation (Dey & Sinha 1994) with good jumping ability but body fat may be decreased by training. It is also stated from the discussion that, less height is a barrier to success in Volleyball and it is untrainable but, fat (%) is very much trainable to reduce and it is expected that, Indian players be able to get success in jumping ability as other teams. Table- 3.. Physical and Performance Characteristics of the Indian State Level Volleyball Players
with the other international players
Name of the team
Ht. (cm)
Wt. (cm)
Fat (%)
30m dash (sec)
Sit- Ups (no)
Sit & reach test (cm)
Shuttle run score (sec)
Vertical jump (cm)
Author(s)
1.Indian state level player
182.53 71.15 11.82 3.96 48.31 22.31 6.98 74.35 *
2.USA Men’s open
- - 12.73 4.11 46.82 - - 67.40 Gladden & Colacino
ISSN 2231-3265 International Journal of Health, Physical Education and Computer Science in Sports
Volume No.2, No.1.
13
(1978)
3.Canada -- - - - - - - 75.00 CVA Bulletin (1978)
4. Australian state team
180.43 70.18 - 4.06 - - 7.07 66.20 Ongley & Hopley (1981)
5. USA National
193.0 85.50 - - - - - - Puhl et. al. (1982)
6. US National - - 120 - 47.11 21.72 - 67.0 Puhl et. al. (1982)
7.Finland National
192.0 85.7 - - - - - - Viitasalo et. al. (1982)
8.USSR National
193.0 90.10 - - - - - - Viitasalo et. al. (1982)
9.US Olympic Gold medal (1984)
192.7 87.9 8.6 - - - - 94.2 Puhl et. al. (1982)
10.Tokyo(1964) Olympic
183.80 79.0 11.80 3.90 52.63 23.82 6.67 70.83 Maclaren (1990)
11.Munich (1972) lympic
188.80 83.20 11.32 3.78 54.03 24.79 6.58 74.19 Maclaren (1990)
12. Montreal (1976)
189.50 85.50 11.13 3.53 57.11 26.53 6.38 77.67 Maclaren (1990)
13. England 185.50 78.50 12.03 3.71 56.33 26.11 6.49 - Black (1980)
14. Canadian National
188.90 85.0 - - - - - - Carter (1984)
15.Ontario State Team
180.27 73.34 12.96 4.08 42.13 21.85 7.07 66.20 Dyba (1982)
Mean performance characteristics are presented in Table- 2. It appears from the table that, mean value of 30m dash test score is 3.69 sec; the value of sit-ups score (no) is 48.31; the flexibility score is 22.31 cm; the value of shuttle run was 6.98 sec; the vertical jump score is 74.35 cm; jump & reach above the net score is73.50 cm and the value of absolute jump & reach height according to net height is 130.24%.
From the findings of the present study and reviewing the references it may be stated that, the Indian State level volleyball players are superior than other state and national teams but inferior than Olympic teams as seen in the table-3 i.e. speed, abdominal strength & strength endurance, flexibility, agility. Due to this reason that may be stated that, Indian volleyball players are less fit for accruing performance capacity only than International Olympic teams. From the Table- 2 it is appeared that the mean score of vertical jumping ability (jump & reach height) is 316.5 cm and absolute jumping height deducting the standing hand reach height, mean score is 74.35 cm. This value (according to Table-3) is higher than six including two Olympic teams and lower than three out of ten international teams. Since the jump & reach above the net height mean score is 73.5 cm and it is higher than as reported by Gladen & Colacino, 1978 (64.9 cm); Puhl, 1982 (73.0 cm). The Indian volleyball players could jump 130.24 % of their respective net height (2.43 cm.) as measured from center of the court. This value is higher as reported by Puhl, 1982 (130%), Gladen & Colacino, 1978 (127%). From the above discussion it may be stated that, Indian players having better jump & reach height in absolute
ISSN 2231-3265 International Journal of Health, Physical Education and Computer Science in Sports
Volume No.2, No.1.
14
jump & reach above the net and are also better in percentage of jump according to net height than some of the international teams. Recent research on elite male volleyball players has illustrated the development of the trend, towards an increase in height and the variation in height for positional play in volleyball game. At the present time the obvious advantage of possessing such an impressive height arises from the fact that volleyball is played over a net, at a height of 2.43 m for men. The higher above the net a player can reach, the more likely he or she is to successfully block or spike past an opponent. Most of the top international male players are expected to spike and block the ball in a zone approximately 3.30 m above ground level, and this would necessitate possessing both great height and vertical jump capability. Indeed, if the players were too short he might then not be physically able to reach the necessary heights despite a good vertical jumping ability (Maclaren, 1990). From the above reviewing research report it may be stated that, Indian volleyball players though they have higher capability in absolute jump & reach and percentage of jump according to net height than some of the teams but, in the context of body height and actual vertical jumping ability Indian players ( 316.50 cm. & 330.0 cm) are less but are comparable with that of international standard. Conclusion : From the above discussion of all the characteristics (physical and performance) it may safely be concluded that the Indian state level volleyball players are lower in height, weight and equal in body fat percentage among physical characteristics. In case of performance characteristics they are lower in all components i.e. speed, abdominal strength & strength endurance, flexibility (trunk), agility than Olympic teams but higher than other State & National teams. It also appears that the vertical jumping ability and absolute jumping height deducting the standing hand reach height, (according to Table-3) is higher than six including two Olympic teams and lower than three out of ten international teams.
Indian State level Volleyball players are well comparable with the international counterparts. They are better specially in vertical jumping ability & absolute jump over the net in respect to physical and performance capacity which are responsible for volleyball players. Reference:
1. Ackland, TR, Ong KB, Kerr DA, Ridge B. Morphological characteristics of Olympic sprint canoe and kayak paddlers.

ISSN 2231-3265 International Journal of Health, Physical Education and Computer Science in Sports
Volume No.2, No.1.
15
This page has been left blank intentionally

ISSN 2231-3265 International Journal of Health, Physical Education and Computer Science in Sports
Volume No.2, No.1.
16
This page has been left blank intentionally

ISSN 2231-3265 International Journal of Health, Physical Education and Computer Science in Sports
Volume No.2, No.1.
17
This page has been left blank intentionally
ISSN 2231-3265 International Journal of Health, Physical Education and Computer Science in Sports
Volume No.2, No.1.
18
pp18-21
Effects of two different fat reduction with aerobic exercise on selected lipid profile status among middle aged women
Dr.R.Venkatesan
Assistant Professor, Department of Exercise Physiology and nutrition, Tamil Nadu Physical Education and Sports University, Tamil Nadu, Chennai – 6
MEANING OF CHOLESTROL: Cholesterol, a waxy substance produced by liver and found in certain foods is needed to make vitamin D and some hormones, build cell walls, and create bile salts that help digest fat, Dennis Lee et.al,(2009). DEPOSITION AND BENEFITS OF CHOLESTEROL: Lipids are fats that are found throughout the body. The liver produces about 1,000 milligrams of cholesterol a day, and 150 to 250 Milligrams in the foods you eat. The body needs cholesterol for digesting dietary fats, making hormones, building cell walls, and other important processes. The bloodstream carries cholesterol in particles called lipoproteins that are like blood-borne cargo trucks delivering cholesterol to various body tissues to be used, stored or excreted. But too much of this circulating cholesterol can injure arteries, especially the coronary ones that supply blood to heart. TYPES OF CHOLESTROL: LOW-DENSITY LIPOPROTEIN (LDL). LDL or "bad" cholesterol is carried through blood throughout the body. LDL cholesterol builds up in the walls of your arteries making them hard and narrow. Standard Value Of LDL Cholesterol (mg/dl): Below 100- Optimal, 100-129- Near Optimal, 130-159- Borderline High, 160-189 – High, Above 190 - Very High HIGH-DENSITY LIPOPROTEIN (HDL). HDL or "good" cholesterol picks up excess cholesterol and takes it back to your liver. Standard value of HDL Cholesterol (mg/dl): Below 40 - Low (undesirable, Above 60 - High (desirable). TRIGLYCERIDES: Triglycerides are a type of fat found in your blood. They are a major source of energy and the most common type of fat in your body. Standard value of Triglycerides (mg/dl): below 150 - Normal, 150-199 - Borderline High, 200-499 – High, above 500 - Very High, Tanaka K et.al ( 2001).METHODS OF STATIN WORK: The drug works by limiting the Liver’s ability to produce cholesterol. Statins cause a significant reduction in LDL “bad” cholesterol levels and a small increase in levels of HDL cholesterol (“good” cholesterol). There is no disputing the facts that Statin does exactly that. It has an almost immediate effect and after about 6 weeks onwards, will have a long term effect.TYPES OF STATINS: Statin is a substance used in a number of common cholesterol reducing drugs including: 1.Lipitor (atorvastatin) 2.Lescol (fluvastatin) 3.Mevacor (lovastatin) 4.Pravachol (pravastatin) 5.Zocor (simvastatin) 6.Crestor (rosuvastatin). NATURAL SUPPLEMENTS TO LOWER HIGH CHOLESTEROL:
1. ONION, 2, TOMATO, 3.GINGER, 4.GARLIC, 5.RED CHILLI, 6.OLIVE OIL SIDE EFFECTS OF STATIN GROUP: As with any drug, there lies the possibility of side effects. People have adverse reactions to all manner of substances and their symptoms range from minor irritation to death. Statin is one of the most commonly prescribed drugs and accounts for billions of dollars in combined sales worldwide. Gastrointestinal problems seem to plague the majority of Statin users, from gas to nausea to upset stomach. Some people develop headaches or fevers after taking the medication. The biggest concerns are liver problems and extreme muscle pain, followed by sexual dysfunction and performance problems, memory loss, irritability, and changes in personality. Rarely, statin side effects may result in a muscle disorder, which makes the muscles weak and sometimes painful. Statins frequently cause people to lose their memories or feel confused. STATEMENT OF THE PROBLEM: The purpose of the study was to investigate effects of two different fat reduction methods with aerobic exercise on selected lipid profile status among middle aged women. MATERIALS AND METHODS - SELECTION OF SUBJECTS: To execute this investigation, the investigator randomly selected ninety middle aged women, belonging to the age group of 30- 40 years. They were divided in to three equal groups of fifteen subjects each and assigned as Experimental Group I, Experimental Group II and Control Group.
ISSN 2231-3265 International Journal of Health, Physical Education and Computer Science in Sports
Volume No.2, No.1.
19
SELECTION OF VARIABLES: The following variables were selected for this study: DEPENDENT VARIABLES: 1. Low density lipoprotein 2. High density lipoprotein 3. Triglycerides.
INDEPENDENT VARIABLES: 1. Experimental group I, 2. Experimental group II, 3. Control Group
EXPERIMENTAL DESIGN: The study was formulated as a true random group design consisting of a Pre test and post test. For this purpose, forty-five middle aged Women, were selected at random and assigned to three equal groups. The groups were assigned as Experimental group I, Experimental group II and Control Group. Pre test were conducted for all three groups on selected Lipid profile status and testosterone variables. The experimental groups were participated in their respective aerobic exercise and supplementations for a period of eight weeks on alternate days. Post tests were conducted on the above Mentioned dependent variables after eight weeks of the training period. STATISTICAL TECHNIQUE: Analysis of Covariance statistical technique was used, to test the significant difference among the treatment groups. If the adjusted post-test results were significant, the scheffe’s post hoc test was used to determine the paired mean significant difference. Thirumalaisamy R. (2004). DATA COLLECTION: Blood sample was collected from individual’s ear lobe in the morning with empty stomach to check the value of the individual total cholesterol, triglycerides, High Density Lipoprotein , Low Density Lipoprotein, and very low density lipoprotein, in pre and post training session. The blood sample was analyzed in the biochemistry lab in Chennai. RESULT AND DISCUSSIONS: The following tables illustrate the statistical results of the effects of two different fat reductions with aerobic exercise on selected lipid profile status and testosterone among middle aged Women and ordered adjusted means and the difference between the means of the groups under study.
TABLE – I COMPUTATION OF ANALYSIS OF COVARIANCE OF LDL
Means EXP - I EXP - II Con.Grup S.V S.S D.F M.S O. F
B 2.96 2 1.478 Pre test Mean
139.63 139.50 139.93 W 3214.33 87 36.95
0.04
B 34100.60 2 17050.30 Post test 102.7 95.00 139.60
W 5011.50 87 57.60 295.99
B 33805.77 2 16902.88 Adj.Post test Mean
102.72 95.08 139.50 W 4440.385 86 51.63
327.37
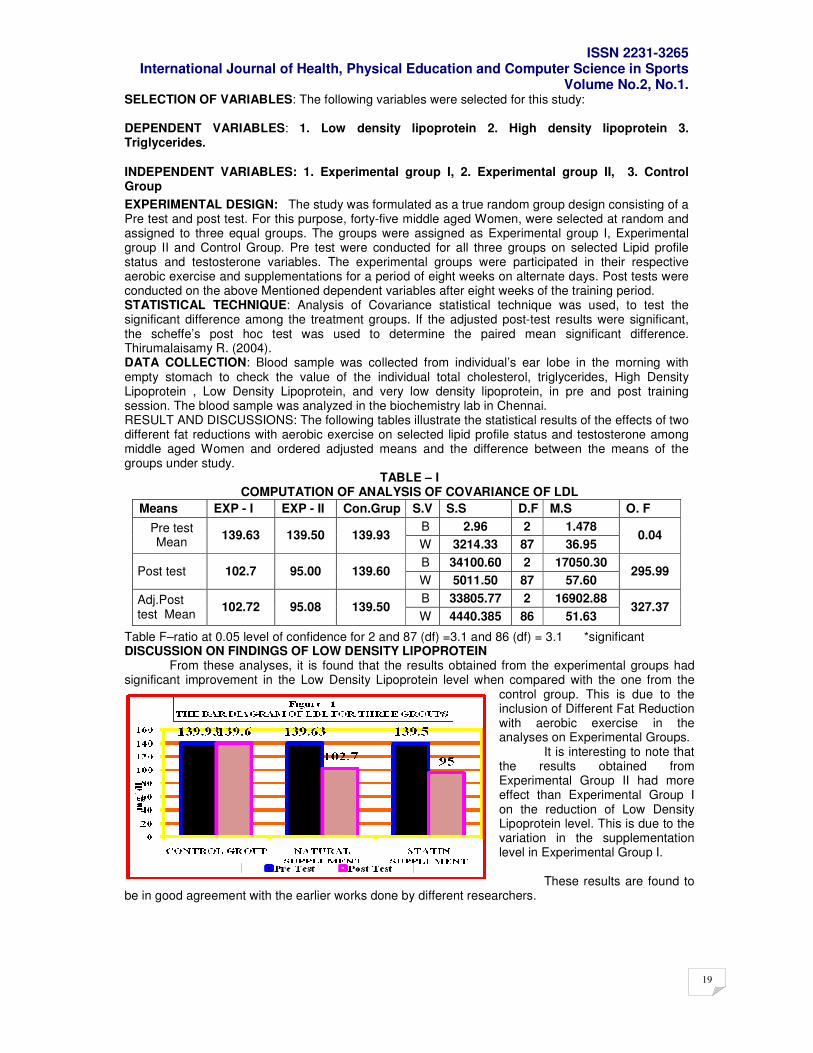
Table F–ratio at 0.05 level of confidence for 2 and 87 (df) =3.1 and 86 (df) = 3.1 *significant DISCUSSION ON FINDINGS OF LOW DENSITY LIPOPROTEIN
From these analyses, it is found that the results obtained from the experimental groups had significant improvement in the Low Density Lipoprotein level when compared with the one from the
control group. This is due to the inclusion of Different Fat Reduction with aerobic exercise in the analyses on Experimental Groups.
It is interesting to note that the results obtained from Experimental Group II had more effect than Experimental Group I on the reduction of Low Density Lipoprotein level. This is due to the variation in the supplementation level in Experimental Group I.
These results are found to be in good agreement with the earlier works done by different researchers.
ISSN 2231-3265 International Journal of Health, Physical Education and Computer Science in Sports
Volume No.2, No.1.
20
Coggan et.al (1990) has proved that the Supplementations with Walk causes a decreased reliance on Low Density Lipoprotein as an energy source during exercise performed at the same absolute intensity due to a lower rate of appearance, disappearance and clearance. After Supplementations with Walk, steady state Low Density Lipoprotein turnover, over a period of Eight Week.
TABLE – II COMPUTATION OF ANALYSIS OF COVARIANCE OF HDL
Means EXP - I EXP - II Con.Grup S.V S.S D.F M.S O. F
B 0.80 2 0.400 Pre test Mean
37.3 37.10 37.10 W 1597.70 87 18.36
0.02
B 506.82 2 253.41 Post test Mean
42.46 39.23 36.67 W 899.50 87 10.34
24.51
B 491.86 2 245.93 Adj.post test Mean
42.41 39.26 36.69 W 627.60 86 7.30
33.70
Table F–ratio at 0.05 level of confidence for 2 and 87 (df) =3.1 and 86 (df) = 3.1 *significant
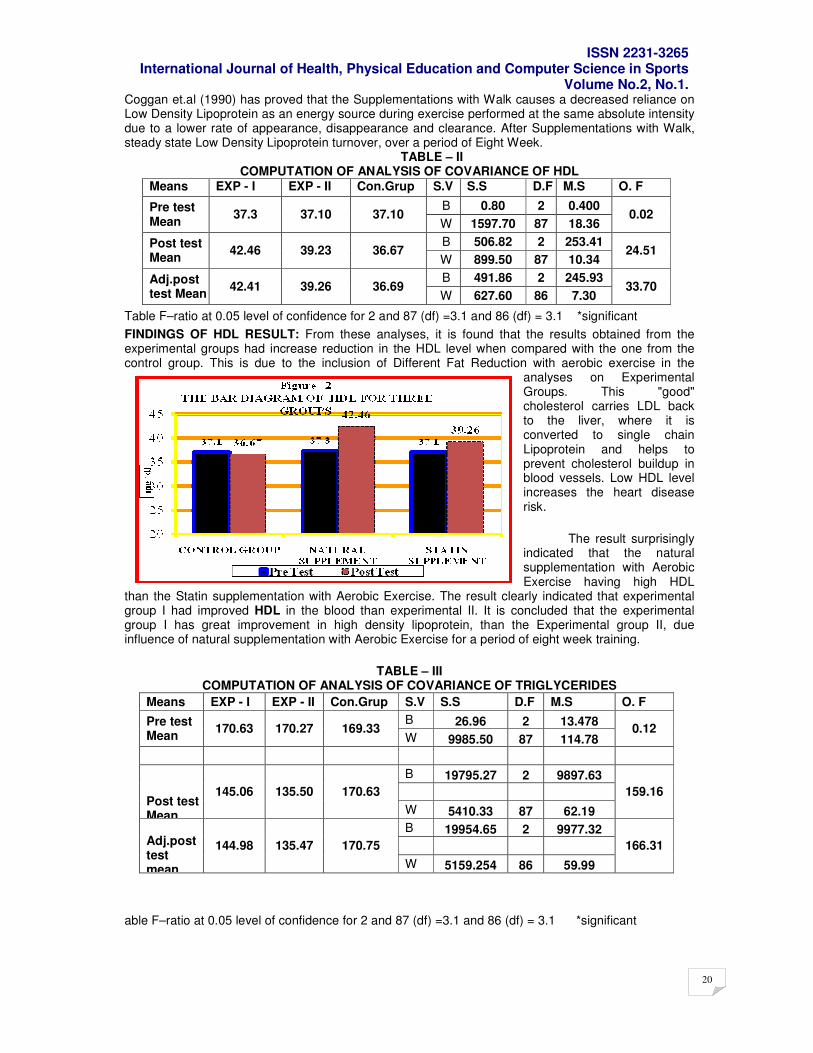
FINDINGS OF HDL RESULT: From these analyses, it is found that the results obtained from the experimental groups had increase reduction in the HDL level when compared with the one from the control group. This is due to the inclusion of Different Fat Reduction with aerobic exercise in the
analyses on Experimental Groups. This "good" cholesterol carries LDL back to the liver, where it is converted to single chain Lipoprotein and helps to prevent cholesterol buildup in blood vessels. Low HDL level increases the heart disease risk.
The result surprisingly indicated that the natural supplementation with Aerobic Exercise having high HDL
than the Statin supplementation with Aerobic Exercise. The result clearly indicated that experimental group I had improved HDL in the blood than experimental II. It is concluded that the experimental group I has great improvement in high density lipoprotein, than the Experimental group II, due influence of natural supplementation with Aerobic Exercise for a period of eight week training.
TABLE – III COMPUTATION OF ANALYSIS OF COVARIANCE OF TRIGLYCERIDES
Means EXP - I EXP - II Con.Grup S.V S.S D.F M.S O. F
B 26.96 2 13.478 Pre test Mean
170.63 170.27 169.33 W 9985.50 87 114.78
0.12
B 19795.27 2 9897.63
Post test Mean
145.06 135.50 170.63
W 5410.33 87 62.19
159.16
B 19954.65 2 9977.32
Adj.post test mean
144.98 135.47 170.75
W 5159.254 86 59.99
166.31
able F–ratio at 0.05 level of confidence for 2 and 87 (df) =3.1 and 86 (df) = 3.1 *significant
ISSN 2231-3265 International Journal of Health, Physical Education and Computer Science in Sports
Volume No.2, No.1.
21
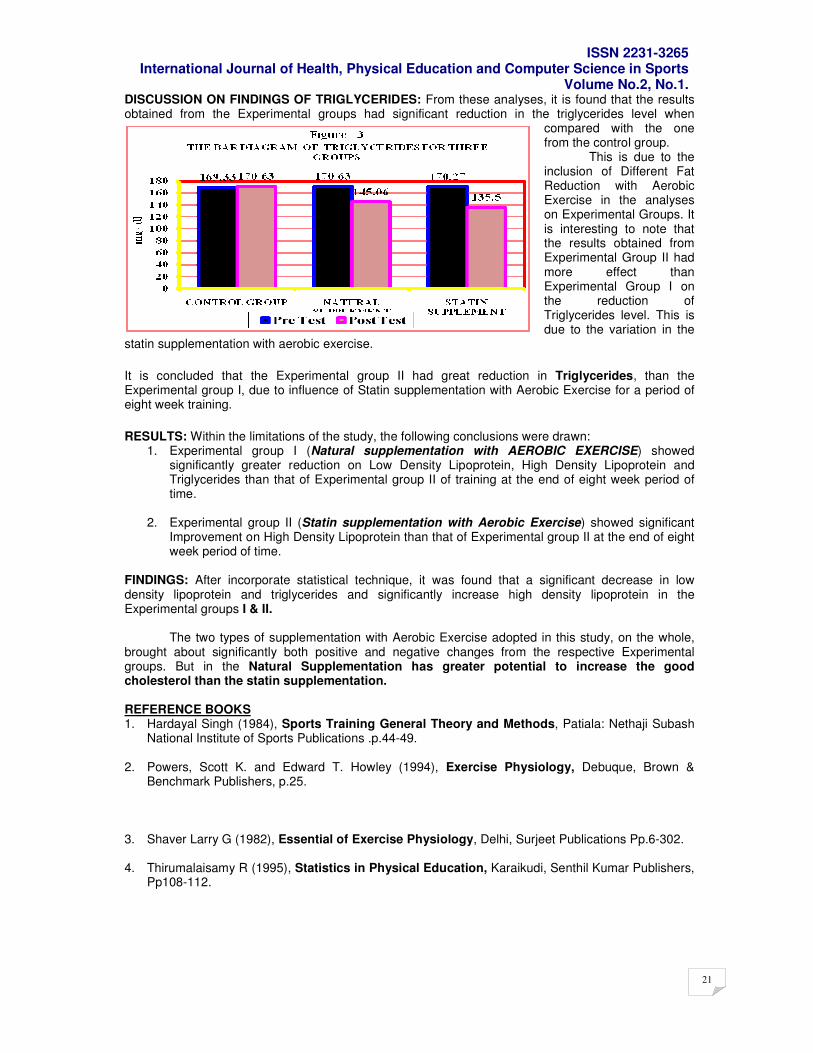
DISCUSSION ON FINDINGS OF TRIGLYCERIDES: From these analyses, it is found that the results obtained from the Experimental groups had significant reduction in the triglycerides level when
compared with the one from the control group. This is due to the inclusion of Different Fat Reduction with Aerobic Exercise in the analyses on Experimental Groups. It is interesting to note that the results obtained from Experimental Group II had more effect than Experimental Group I on the reduction of Triglycerides level. This is due to the variation in the
statin supplementation with aerobic exercise.
It is concluded that the Experimental group II had great reduction in Triglycerides, than the Experimental group I, due to influence of Statin supplementation with Aerobic Exercise for a period of eight week training.
RESULTS: Within the limitations of the study, the following conclusions were drawn: 1. Experimental group I (Natural supplementation with AEROBIC EXERCISE) showed
significantly greater reduction on Low Density Lipoprotein, High Density Lipoprotein and Triglycerides than that of Experimental group II of training at the end of eight week period of time.
2. Experimental group II (Statin supplementation with Aerobic Exercise) showed significant
Improvement on High Density Lipoprotein than that of Experimental group II at the end of eight week period of time.
FINDINGS: After incorporate statistical technique, it was found that a significant decrease in low density lipoprotein and triglycerides and significantly increase high density lipoprotein in the Experimental groups I & II.
The two types of supplementation with Aerobic Exercise adopted in this study, on the whole,
brought about significantly both positive and negative changes from the respective Experimental groups. But in the Natural Supplementation has greater potential to increase the good cholesterol than the statin supplementation. REFERENCE BOOKS 1. Hardayal Singh (1984), Sports Training General Theory and Methods, Patiala: Nethaji Subash
National Institute of Sports Publications .p.44-49.
2. Powers, Scott K. and Edward T. Howley (1994), Exercise Physiology, Debuque, Brown & Benchmark Publishers, p.25.
3. Shaver Larry G (1982), Essential of Exercise Physiology, Delhi, Surjeet Publications Pp.6-302.
4. Thirumalaisamy R (1995), Statistics in Physical Education, Karaikudi, Senthil Kumar Publishers,
Pp108-112.
ISSN 2231-3265 International Journal of Health, Physical Education and Computer Science in Sports
Volume No.2, No.1.
22
Pp22-25
A study on the effect of flexibility training on the change of performance in agility By
Dr.K.Abdussalam,
Faculty in Physical Education Department
King Fahd University of Petroleum & Minerals, Dhahran, Saudi Arabia
Abstract It is needless to stress the fact that agility is the most important factor that contributes to successful performance in a broad spectrum of competitive sports. Here, the very purpose of the study was to examine whether there is any casual relationship with agility performance on the degree of functional flexibility. In order to conduct the experiment, 26 male physical education students of University of Mysore were taken at random to serve as subjects All the twenty six students were tested before they were once again assigned to two experimental conditions viz, treatment and control conditions. The subjects in the treatment group were trained with five stretching exercises (both ballistic and static types) which were specially designed for the purpose for improving flexibility at trunk and hip. All the subjects of both control and experimental groups were tested for agility before the treatment. ‘Right Boomerang Run’ test was used to measure the agility as it was the most reliable and valid agility test compared to any other test. ‘Sit and reach’ test was used to measure the flexibility of the hip and trunk. Each subject was given three trials to do his best. The best trail was used for the analysis. Analysis of Co –Variance (ANCOVA) was used to test the hypothesis. The pre test scores were used as (Covariate) control variable.
Introduction Agility is the ability to change direction quickly and to control body movements, skill requiring rapid movement of the entire body in different directions and in response to unexpected circumstances. In some activities, the ability to stop and start and to change direction accurately and quickly is much more important than in some others (Hockey, 1973). Agility in a general sense is one’s ability to quickly adjust to changing environmental conditions. As related to competitive sports and motor movements, agility is defined as “…… the physical ability, which enable an individual to rapidly change body positions and directions in a précised manner” (Johnson and Nelson, 1979). In the context of human motor movements two types of agility viz, specific and general agility are recognized. Specific agility is concerned with movements of body segments (limbs) as in playing on piano or in ball handling. On the contrary, general agility refers to movement of the body as a whole, as in dodging the opponent or marking an opponent in basketball man to man defense. The present investigation is concerned with general agility.
Method
The purpose of the study was to analyses whether flexibility training has any positive influence on the agility performance. The experimental design adopted, the testing procedure and the statistical analysis involved to realize the purpose of the study are explained in the following sections.
Subject and Sampling Twenty six adult male BPEd students of UCPE Mysore randomly selected for the purpose served as subjects of the study. All the twenty six students were tested before they were once again assigned to two experimental conditions viz, treatment and no treatment (control) conditions. TreatmentThe subjects in the treatment condition were trained with some specific stretching exercises three times a week on alternate days for four weeks before they were tested finally (post – test) . Prior to each training session, the subjects adequately warmed up.
ISSN 2231-3265 International Journal of Health, Physical Education and Computer Science in Sports
Volume No.2, No.1.
23
Testing Procedure All the subjects of control group as well as experimental group were tested before (pre- test) and after the treatment (post – test) for agility performance (dependent / criterion variable) as well as flexibility. The testing procedure was as described below.For the purpose of measuring performance in agility of the subjects, “Right Boomerang Run” (RBR) test was used. RBR test was selected because of its high validity co- efficient (r = 0.82) using the sum of T – scores for sixteen tests of agility as criterion (Johnson & Nelson, 1979). There were no other tests of agility with validity co efficient as high as that of RBR test. In the RBR test, the time duration is noted for completing run through the stipulated path by changing the direction within the shortest possible time. Time was recorded to the nearest tenth of a second. There was a penalty of one tenth of one second for violating rules.For the purpose of measuring performance inflexibility of the subjects “Modified sit and Reach test “is used. The equipment used for this test is flexo measure case with yardstick and tape. Statistical Treatment Analysis of co-variance (ANCOVA) was used to test the stated hypothesis. Since the primary purpose of this type of analysis to provide an adjustment of post test scores for the difference existing among subjects before the start of the experiment, the pretest scores on agility performance was used as the (Co-Variate) control variable to adjust for chance difference among treatment groups ( Keppel, 1973). Campbell and Stanley (1963) have also recommended ANCOVA as more precise and highly desirable in such pre-test post-test control design.
RESULTS The purpose of the study was to see, whether the improvement in flexibility resulting from flexibility training resulted in improvement in agility performance. In order to test the stated hypothesis, the data collected after the treatment conditions (Post-test scores) was subjected to “Analysis of Co-Variance”(ANCOVA) with the test scores collected prior to treatment condition(pre-test scores) as the co Variate or the control variable. The results of statistical analysis and descriptive statistics are presented in the following sections. Presented in table 1 are the descriptive statistics of pre and post test scores of dependent (agility) and independent (flexibility) variables of control and treatment groups. Also presented in the table are the gain scores from pre test to post test which were obtained by subtracting pre test scores out of post test scores. The gain scores thus indicate change in scores from pre to post test situation due to different treatment conditions. Positive gain score in the case of flexibility indicates improvement in flexibility. Since the units of measure for agility is time, the negative gain scores in the case of agility indicates increments in agility performance.
Table 1. Mean and Standard Deviations of Agility and Flexibility Pre-test, Post –test and Gain scores of Control and Flexibility Training Groups
Control group Flexibility training group Variables pre test post test gain score pre test post test gain score Agility X 14. 355 14.465 0.109 14.503 14.317 -0.187 Sd 0.499 0.461 0.473 0.688 0.588 0.285 Flexibility X 11.154 12.923 1.769 8.333 14.667 6.333 Sd 6.162 6.137 2.315 5.025 5.220 2.693
ISSN 2231-3265 International Journal of Health, Physical Education and Computer Science in Sports
Volume No.2, No.1.
24
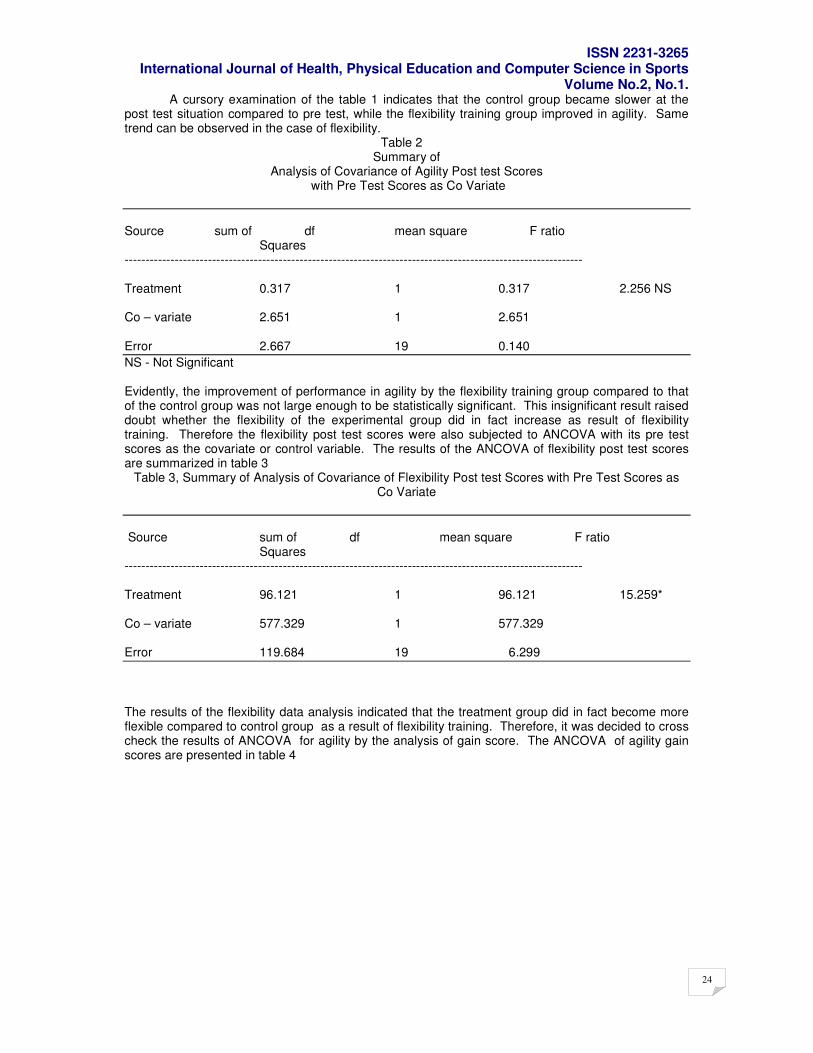
A cursory examination of the table 1 indicates that the control group became slower at the post test situation compared to pre test, while the flexibility training group improved in agility. Same trend can be observed in the case of flexibility.
Table 2 Summary of
Analysis of Covariance of Agility Post test Scores with Pre Test Scores as Co Variate
Source sum of df mean square F ratio
Squares -------------------------------------------------------------------------------------------------------------- Treatment 0.317 1 0.317 2.256 NS Co – variate 2.651 1 2.651 Error 2.667 19 0.140
NS - Not Significant Evidently, the improvement of performance in agility by the flexibility training group compared to that of the control group was not large enough to be statistically significant. This insignificant result raised doubt whether the flexibility of the experimental group did in fact increase as result of flexibility training. Therefore the flexibility post test scores were also subjected to ANCOVA with its pre test scores as the covariate or control variable. The results of the ANCOVA of flexibility post test scores are summarized in table 3
Table 3, Summary of Analysis of Covariance of Flexibility Post test Scores with Pre Test Scores as Co Variate
Source sum of df mean square F ratio
Squares -------------------------------------------------------------------------------------------------------------- Treatment 96.121 1 96.121 15.259* Co – variate 577.329 1 577.329 Error 119.684 19 6.299
The results of the flexibility data analysis indicated that the treatment group did in fact become more flexible compared to control group as a result of flexibility training. Therefore, it was decided to cross check the results of ANCOVA for agility by the analysis of gain score. The ANCOVA of agility gain scores are presented in table 4
ISSN 2231-3265 International Journal of Health, Physical Education and Computer Science in Sports
Volume No.2, No.1.
25
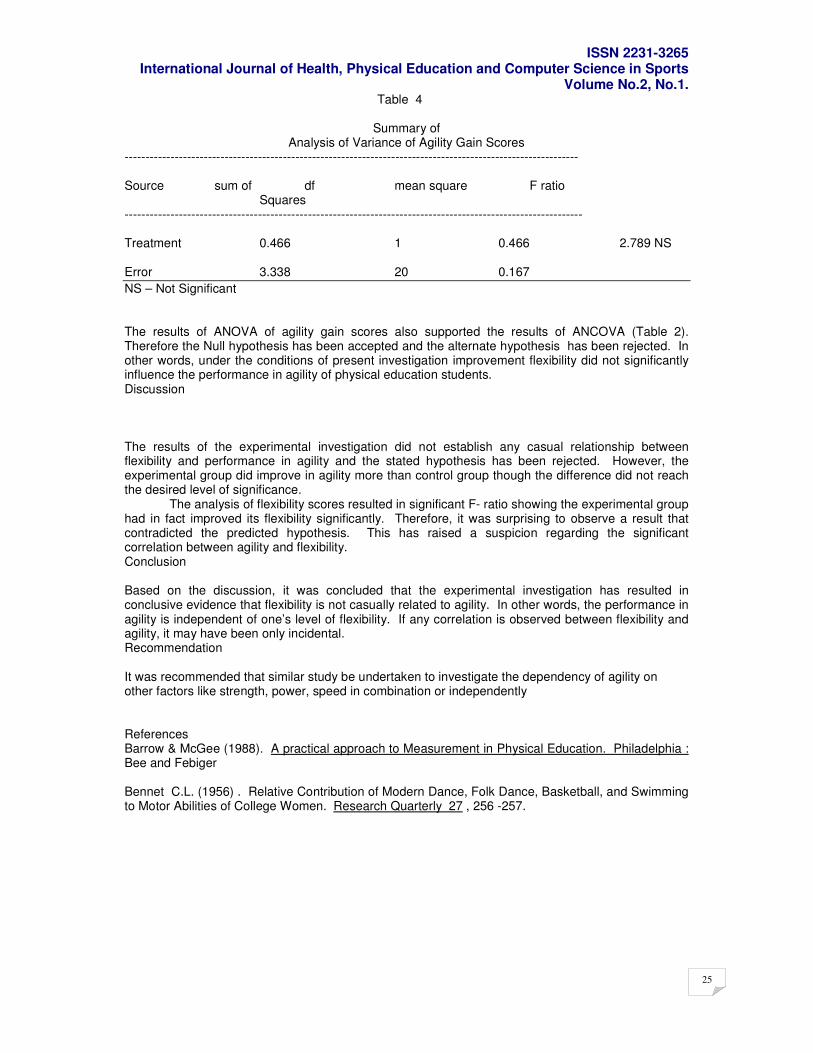
Table 4
Summary of Analysis of Variance of Agility Gain Scores
------------------------------------------------------------------------------------------------------------- Source sum of df mean square F ratio
Squares -------------------------------------------------------------------------------------------------------------- Treatment 0.466 1 0.466 2.789 NS Error 3.338 20 0.167
NS – Not Significant The results of ANOVA of agility gain scores also supported the results of ANCOVA (Table 2). Therefore the Null hypothesis has been accepted and the alternate hypothesis has been rejected. In other words, under the conditions of present investigation improvement flexibility did not significantly influence the performance in agility of physical education students. Discussion The results of the experimental investigation did not establish any casual relationship between flexibility and performance in agility and the stated hypothesis has been rejected. However, the experimental group did improve in agility more than control group though the difference did not reach the desired level of significance. The analysis of flexibility scores resulted in significant F- ratio showing the experimental group had in fact improved its flexibility significantly. Therefore, it was surprising to observe a result that contradicted the predicted hypothesis. This has raised a suspicion regarding the significant correlation between agility and flexibility. Conclusion Based on the discussion, it was concluded that the experimental investigation has resulted in conclusive evidence that flexibility is not casually related to agility. In other words, the performance in agility is independent of one’s level of flexibility. If any correlation is observed between flexibility and agility, it may have been only incidental. Recommendation It was recommended that similar study be undertaken to investigate the dependency of agility on other factors like strength, power, speed in combination or independently References Barrow & McGee (1988). A practical approach to Measurement in Physical Education. Philadelphia : Bee and Febiger Bennet C.L. (1956) . Relative Contribution of Modern Dance, Folk Dance, Basketball, and Swimming to Motor Abilities of College Women. Research Quarterly 27 , 256 -257.
ISSN 2231-3265 International Journal of Health, Physical Education and Computer Science in Sports
Volume No.2, No.1.
26
pp26-27
Private gyms in Pune city – Today and Tomorrow Dr. M.R. Gaikwad
Director of Physical Education, MMCC, Pune Introduction: In the ancient world in all countries there was importance for physical ability. In military and police recruitment chance was given for appointment to the physically able and having good personality candidate. Under the circumstances people have started thinking about improving the personality of their family members and also all round development, muscle movement (expansion and contraction) is taught and done. The first Gym. was started in Pune in 1923. There is no difference in the intention or purpose of places of body exercises and Gym. There is stress on increasing physical ability as well as social qualities. In the present age of science various mechanical devices have been introduced and used and as a result the physical movement of toiling and labour have been reduced. Man is becoming mentally and physically weak and feeble. His capacity is being reduced gradually. Hence Gyms have been started in the lanes and sub-lanes.
Present Scenario of the Private Gyms in Pune City.
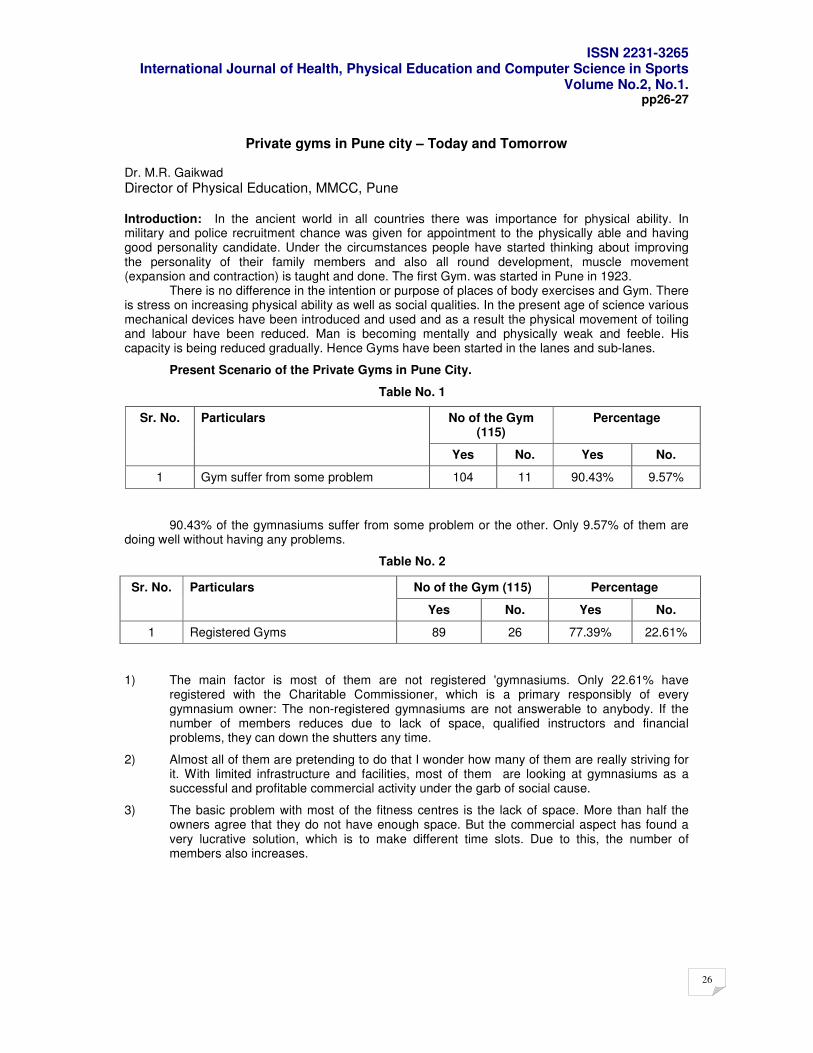
Table No. 1
90.43% of the gymnasiums suffer from some problem or the other. Only 9.57% of them are doing well without having any problems.
Table No. 2
1) The main factor is most of them are not registered 'gymnasiums. Only 22.61% have registered with the Charitable Commissioner, which is a primary responsibly of every gymnasium owner: The non-registered gymnasiums are not answerable to anybody. If the number of members reduces due to lack of space, qualified instructors and financial problems, they can down the shutters any time.
2) Almost all of them are pretending to do that I wonder how many of them are really striving for it. With limited infrastructure and facilities, most of them are looking at gymnasiums as a successful and profitable commercial activity under the garb of social cause.
3) The basic problem with most of the fitness centres is the lack of space. More than half the owners agree that they do not have enough space. But the commercial aspect has found a very lucrative solution, which is to make different time slots. Due to this, the number of members also increases.
No of the Gym (115)
Percentage Sr. No. Particulars
Yes No. Yes No.
1 Gym suffer from some problem 104 11 90.43% 9.57%
No of the Gym (115) Percentage Sr. No. Particulars
Yes No. Yes No.
1 Registered Gyms 89 26 77.39% 22.61%
ISSN 2231-3265 International Journal of Health, Physical Education and Computer Science in Sports
Volume No.2, No.1.
27
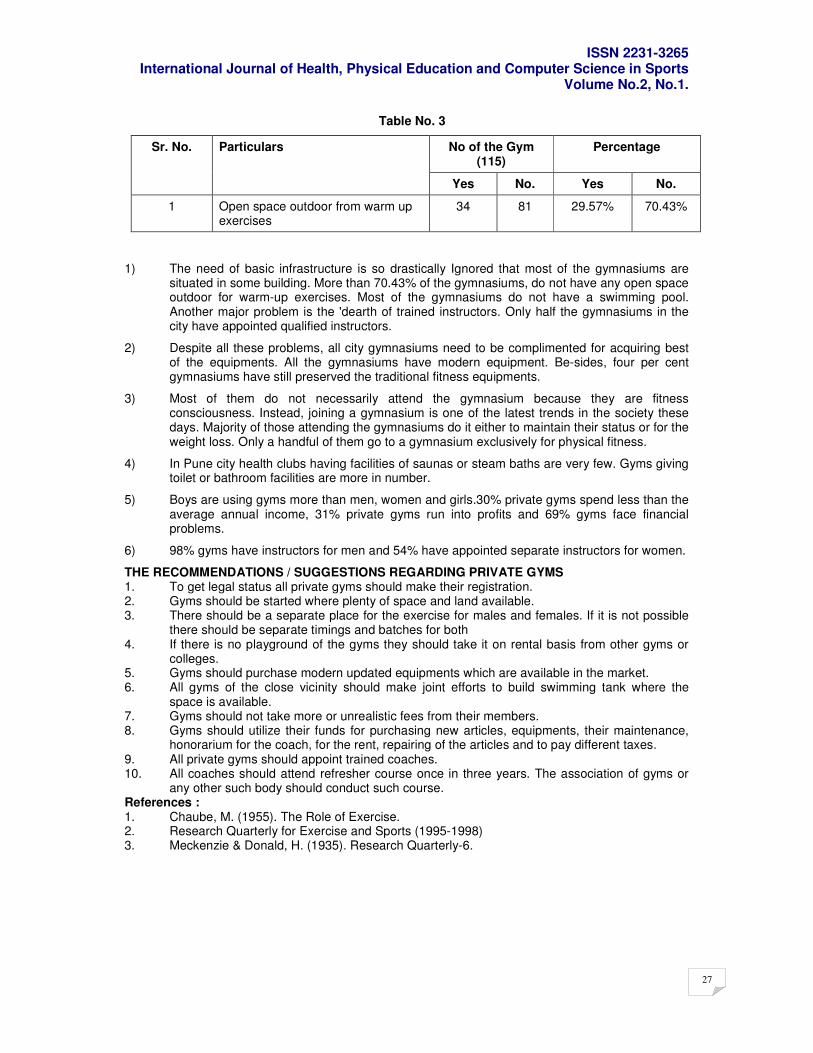
Table No. 3
1) The need of basic infrastructure is so drastically Ignored that most of the gymnasiums are situated in some building. More than 70.43% of the gymnasiums, do not have any open space outdoor for warm-up exercises. Most of the gymnasiums do not have a swimming pool. Another major problem is the 'dearth of trained instructors. Only half the gymnasiums in the city have appointed qualified instructors.
2) Despite all these problems, all city gymnasiums need to be complimented for acquiring best of the equipments. All the gymnasiums have modern equipment. Be-sides, four per cent gymnasiums have still preserved the traditional fitness equipments.
3) Most of them do not necessarily attend the gymnasium because they are fitness consciousness. Instead, joining a gymnasium is one of the latest trends in the society these days. Majority of those attending the gymnasiums do it either to maintain their status or for the weight loss. Only a handful of them go to a gymnasium exclusively for physical fitness.
4) In Pune city health clubs having facilities of saunas or steam baths are very few. Gyms giving toilet or bathroom facilities are more in number.
5) Boys are using gyms more than men, women and girls.30% private gyms spend less than the average annual income, 31% private gyms run into profits and 69% gyms face financial problems.
6) 98% gyms have instructors for men and 54% have appointed separate instructors for women.
THE RECOMMENDATIONS / SUGGESTIONS REGARDING PRIVATE GYMS 1. To get legal status all private gyms should make their registration. 2. Gyms should be started where plenty of space and land available. 3. There should be a separate place for the exercise for males and females. If it is not possible
there should be separate timings and batches for both 4. If there is no playground of the gyms they should take it on rental basis from other gyms or
colleges. 5. Gyms should purchase modern updated equipments which are available in the market. 6. All gyms of the close vicinity should make joint efforts to build swimming tank where the
space is available. 7. Gyms should not take more or unrealistic fees from their members. 8. Gyms should utilize their funds for purchasing new articles, equipments, their maintenance,
honorarium for the coach, for the rent, repairing of the articles and to pay different taxes. 9. All private gyms should appoint trained coaches. 10. All coaches should attend refresher course once in three years. The association of gyms or
any other such body should conduct such course. References : 1. Chaube, M. (1955). The Role of Exercise. 2. Research Quarterly for Exercise and Sports (1995-1998) 3. Meckenzie & Donald, H. (1935). Research Quarterly-6.
No of the Gym (115)
Percentage Sr. No. Particulars
Yes No. Yes No.
1 Open space outdoor from warm up exercises
34 81 29.57% 70.43%
ISSN 2231-3265 International Journal of Health, Physical Education and Computer Science in Sports
Volume No.2, No.1.
28
pp28-30
The Impact of Lateral Thinking Training (LTT) on the Level of Aspiration and Achievement Motivation of Physical Education Students”
Dr. Jayashree S. Reddy. Mr. Amareshwar S. Reddy, Principal,Taj M.Ed P.G.College, Research Scholar Gulbarga. Dravadian Univ. Kuppam
Abstract: LTT enhances student’s need for achievements and brings changes in the level of aspirations of high school students (Ms. Jayashree Reddy, 2005), and motivates students to evaluate themselves favorably. Number of researches were conducted studies to know the factors influencing on achievement motivation and aspirations, such as task design, authority structure, rewards, grouping arrangements, evaluation practices, coaching in physiological skills (Baker-Richard, 2002), critical thinking coaching-enhancing self-sufficiency (Wright-and etal., 2001) etc.
Introduction: “Perhaps most importantly in today’s information age thinking skills are viewed as crucial for educated person’s to cope with a rapidly changing world. The specific knowledge will not be as important to tomorrows workers and citizens as the ability to learn and make sense of new information”- D Gough, 1991.Level of Aspiration and Achievements Motivation are the factors, which act as qualities measures, which are expected to be associated with student’s performance. Students with high Aspiration & Achievements Motivation have shown high performance at curricular & Extra-curricular activities (Survey by Ms. Jayashree Reddy, 2004)Thinking, self-concept, self-confidence, Aspirations and Motivation are interdependent on each other, training in any one of these is expected to enhance another. Number of studies are being conducted in this connection. The programme entitled “Creative Teaching and Technology” (Barak and Dopplet, 1998) encomposed two hours of study every week during an entire school year. They learned thinking tools form CoRT, the Programme developed by Edward de sono (1986,96). Thinking tools such as PMI, CAF, APC, and Six Thinking Hats can be used as ‘Motivators’ to develop interest in people to think. High need for achievements is positively related to high level of aspiration (Ali and Akther, 1973, Jawa, 1972 and Kureshi, 1978) (Bhatia, 1980).The very word “Lateral’ suggested the movement ‘sideways’ to generate alternative patterns instead moving straight ahead with the development of one particular pattern. Objectives of the study: 1) To study the impact of LTT the Level Of Aspiration of physical education Students.
2) To study the impact of LTT on Achievement Motivation of physical education students
Statistical Hypotheses: 1) There is no significant difference between Level of Aspiration in before and after training. 2) There is no significant difference between Achievements Motivation in before and after training Sample: Researcher selected M.P.Ed 3
rd Semester students from Dept. of Physical Education, Gulbarga
University, Gulbarga. Whole of training programme was planned for15 Hrs, one and half hours daily, from 8.00 to 9.30 Am, Interest, Enjoyment and Sportiveness have been shown by almost all experimental group Students, during and after training. Out of 25 students 15 students were selected for the study. All the students were requested to attend the curricular and extra-curricular activities regularly. Researcher then processed instructions, and factors related to training such as place, period, timing, conditions, activities etc. to the students on the first day. All the students were tested
ISSN 2231-3265 International Journal of Health, Physical Education and Computer Science in Sports
Volume No.2, No.1.
29
and results have been recorded for level of aspiration and achievement motivation using the scales developed and standardized by Bhargava and V.P.Bhargava.On the 45
th day, all the students from
both of the groups were again tested and recorded results for the same tests using same scales.
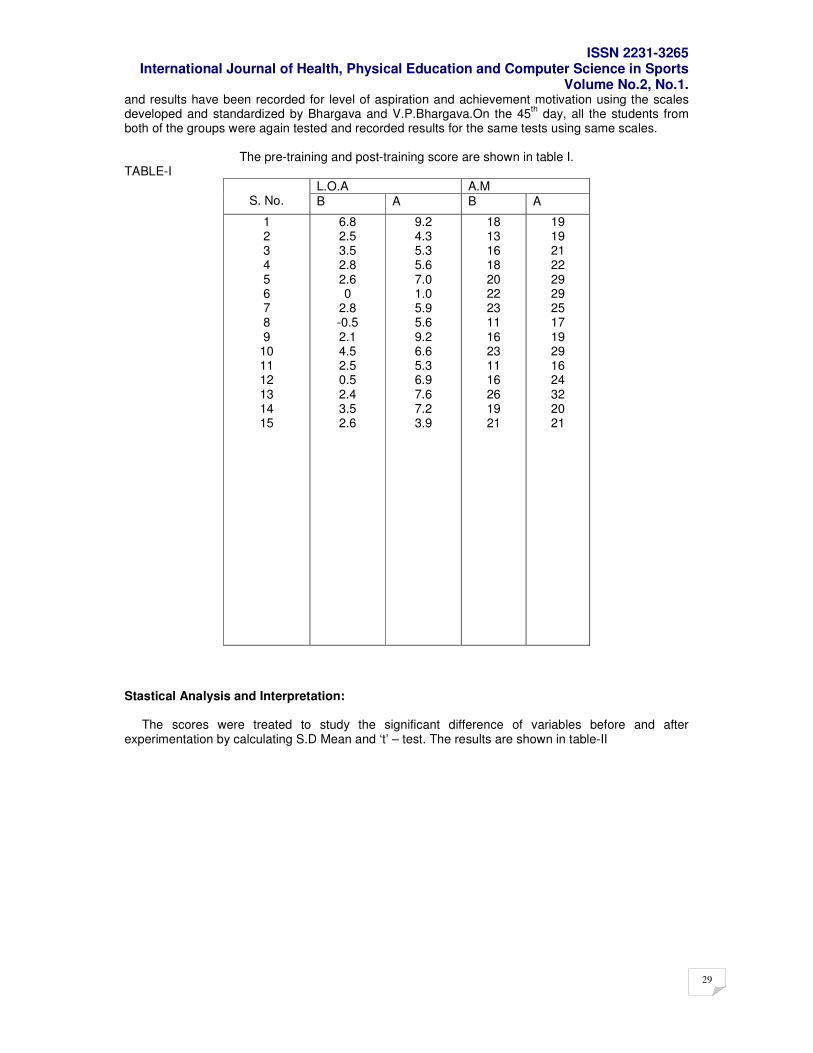
The pre-training and post-training score are shown in table I. TABLE-I
L.O.A A.M S. No. B A B A
1 2 3 4 5 6 7 8 9
10 11 12 13 14 15
6.8 2.5 3.5 2.8 2.6 0
2.8 -0.5 2.1 4.5 2.5 0.5 2.4 3.5 2.6
9.2 4.3 5.3 5.6 7.0 1.0 5.9 5.6 9.2 6.6 5.3 6.9 7.6 7.2 3.9
18 13 16 18 20 22 23 11 16 23 11 16 26 19 21
19 19 21 22 29 29 25 17 19 29 16 24 32 20 21
Stastical Analysis and Interpretation: The scores were treated to study the significant difference of variables before and after experimentation by calculating S.D Mean and ‘t’ – test. The results are shown in table-II

ISSN 2231-3265 International Journal of Health, Physical Education and Computer Science in Sports
Volume No.2, No.1.
30
TABLE-II
Table ‘t’ Value
N=15
Mean
S.D 0.05 0.01
Obtained ‘t’ Value
B 2.5 1.6
L.O
.A
A 6.0 28.6
2.2
B 18.2 4.2
A.M
A 22.8 4.8
2.05
2.76
0.61
Interpretation: As shown in the table-II the obtained ‘t’ at 0.05 level of significance level aspiration is 2.2.Thisis compared with table ‘t’ value which is2.05,which is less than obtained t value, hence the Hypothesis 1 is rejected. That means there is a significant difference between the means of level of aspiration of students before and after LTT. Similarly, obtained t value for Achievement Motivation is 0.61, which is less than Table t value, hence the second hypothesis is accepted. That means there is no significant difference in Achievement Motivation before and after training. Conclusion: LTT is shown to enhance the level of aspiration of physical education student, but the impact of LTT is shown to be not much on Achievement Motivation of students, the reason may be ‘internalization’ of lateral Thinking skills is expected after a period more than 45 days. References:
1) ‘Six thinking hats’- Penguin publication, Edward de Beno. 2) ‘Teach your child how to think’ - Penguin publication, Edward de Beno. 3) ‘Lateral Thinking’ - Penguin publication, Edward de Beno. 4) Creativity Instrumental Materials- S. Bhaskar. - Penguin publication, Edward de Beno.
ISSN 2231-3265 International Journal of Health, Physical Education and Computer Science in Sports
Volume No.2, No.1.
31
Pp31-34
Personality traits, emotional intelligence and value orientation of international cricketer Sanjay Bangar
Bhandare Prasad and **Prof. Tiwari Pratap Singh
ABSTRACT
A psychological analysis case study of the above mentioned subject is conducted through ex-post-facto research method. Based on the objectives of the present study, Sixteen primary personality factor questionnaire (R. B Cattel, 1969), Emotional intelligence scale (Anukool Hyde, Sanjyot Pethe and Upinder Dhar 2007) and Value orientation scale (Chauhan N.S. 1973) were administered on the subject.It is concluded that Sanjay Bangar is good natured, easy going, emotionally expressive, ready to co-operate, attentive to people, softhearted, kindly, adaptable, quick to grasp ideas, a fast learner, intelligent, emotionally mature, stable, realistic about life, unruffled, possessing ego strength, better able to maintain solid group morale, assertive, self assured, independent minded, cheerful, active, talkative, frank, expressive, effervescent and carefree. He is exacting in character, dominated by sense of duty, preserving, responsible, planful, “fill the unforgiving minute, sociable, bold, ready to try new things, spontaneous and abundant in emotional response. His “thick skinnedness” enables them to face wear and tear in dealing with people and grueling emotional situations, without fatigue. He is tough, realistic, “down to earth”, independent, responsible but skeptical of subjective, cultural elaborations, free of jealous tendencies, adaptable, cheerful, uncompetitive, concerned about others, a good team worker, anxious to do the right things, attentive to practical matters, polished, experimental and shrewd, unruffled and to have unshakable nerve. He has a mature, unanxious confidence in themselves and their capacity to deal with things. He is experimenting, interested in intellectual matters, he has doubts on fundamental issues, prefers to work and make decisions with other people and like and depend on social approval and admiration He has undisciplined self-conflict and have significant control of his emotions and general behavior. Inclination to be socially aware, careful and he has lot of self respect and high regard for social reputation. He is sedate, relaxed, composed and satisfied person.
Introduction:
To understand human nature and personality of persons psychologists are continuously striving. It is very important for any human enterprise, more so in case of sports and games, where there is not only kaleidoscopic play of emotions but also name, fame, money and much more at stake. A comprehensive understanding of human nature would contribute in great measure for the all round development of the person, sporting activity and also improving the quality of life.
Sunil Gavaskar; His Life, Career and Contributions to Cricket, a case study was done by S. Sivaramakrishnan (1989). He concluded that, Sunil Gavaskar is a bit reserved, deviates towards more intelligence, affected by feelings, submissive, serious, slightly conscientious, timid, sensitive, suspicious, practical, shrewd, apprehensive, and conservative and deviant to be self sufficient, controlled and tense person.
Sanjay Bapusaheb Bangar born october 11, 1972, Bid, Maharashtra is a feisty allrounder who opens both the batting and the bowling for railways in India's Ranji Trophy, Sanjay Bangar is an exciting prospect - and something of a lucky mascot for India, who won five and drew one of his first six Tests, including three rare overseas victories. Bangar bowls wicket-to-wicket at a lively pace, and can move the ball both ways. As a batsman, he has been a steady accumulator of runs at domestic level, but also has an impressive fourth gear: his lusty hitting at No. 6 helped the Board President's XI to a victory in the 1998 Wills Trophy. An untimely injury kept him out of cricket for a while, but he returned in style, with a fine hundred against Zimbabwe in only his second Test, batting at No. 7, before moving to the top of the order to play a crucial role in India's historic innings victory over England at Headingley in 2002.
Hence the present researcher has felt necessary to conduct a case study on former international cricketer Sanjay Bangar to assess his level of personality traits, emotional intelligence and value orientation.
ISSN 2231-3265 International Journal of Health, Physical Education and Computer Science in Sports
Volume No.2, No.1.
32
STATEMENT OF THE PROBLEM The problem formulated for the present study is to find out the level of personality traits,
emotional intelligence, value orientation and achievements of former international cricketer Sanjay Bangar. DELIMITATIONS
• The research is delimited to study personality traits, emotional intelligence and value orientation of former international cricketer Sanjay Bangar.
• The study methods are delimited to interview and psychological questionnaire testing. LIMITATIONS
• The study is limited to responses given by the subject to three psychological questionnaires and tests.
• The psychological conditions like anxiety, stress and strain of the subject are beyond the control of the investigator. Hence, they are the considered as limitations of the study.
METHODOLOGY Tools Following standardized tests and questionnaires were used in the present study,
1. Cattell’s 16 PF Form ‘C’Questionnaire (R.B. Cattell 1969) 2. Emotional Intelligence Scale (Anukool Hyde, Sanjyot Pethe and Upinder Dhar 2007). 3. Value Orientation Scale (Chauhan N.S. 1973).
Test Administration and Collection of Data To collect necessary data pertaining to the present case study through questionnaires and
interview method. The subject was administered to the Cattell’s Sixteen Personality Factors Questionnaire (Form ‘C’), Emotional Intelligence Scale and Value Orientation Scale. The data were in the form of answer given by the subject in response to the various questions of the questionnaire which are present in the questionnaires asked through interview method. The subject completed answering the questionnaire within the stipulated time after which the questionnaires were collected back and the standard scoring key was used to get the score. The scores were analyzed with the help of the standardized norms [key] provided in the tabular supplement of tests manual all questionnaires. ANALYSIS AND INTERPRETATION OF DATA
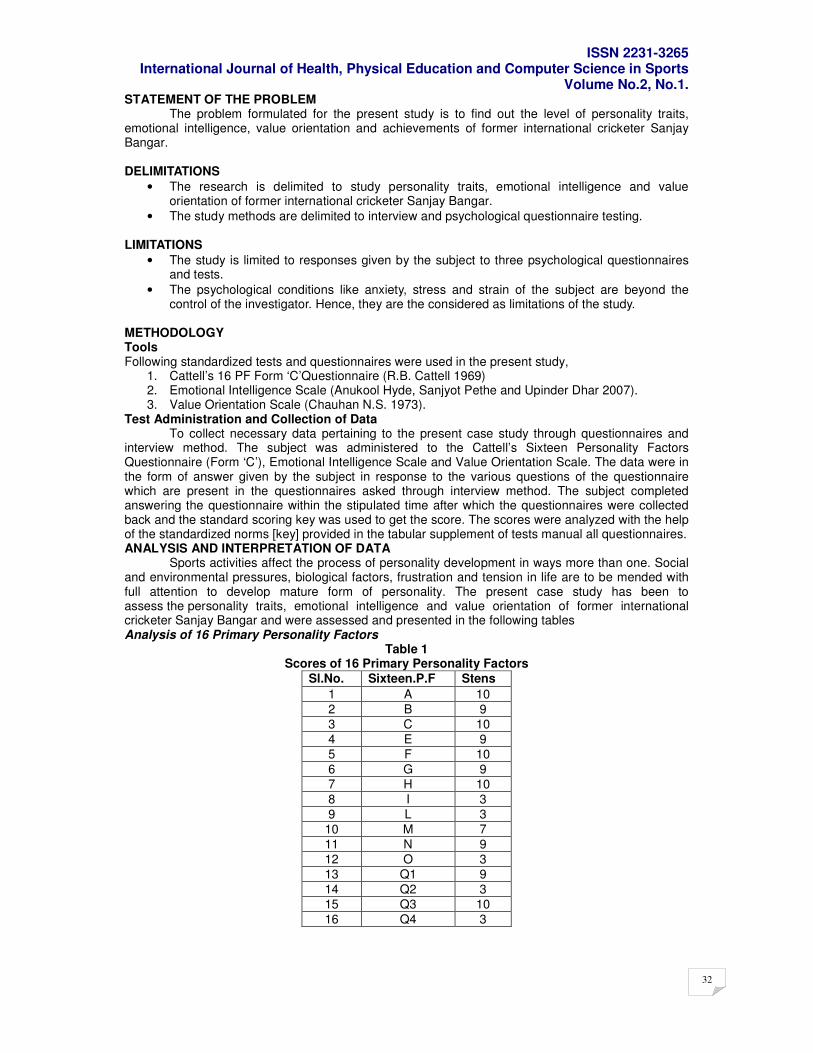
Sports activities affect the process of personality development in ways more than one. Social and environmental pressures, biological factors, frustration and tension in life are to be mended with full attention to develop mature form of personality. The present case study has been to assess the personality traits, emotional intelligence and value orientation of former international cricketer Sanjay Bangar and were assessed and presented in the following tables Analysis of 16 Primary Personality Factors
Table 1 Scores of 16 Primary Personality Factors
Sl.No. Sixteen.P.F Stens
1 A 10
2 B 9
3 C 10
4 E 9
5 F 10
6 G 9
7 H 10
8 I 3
9 L 3
10 M 7
11 N 9
12 O 3
13 Q1 9
14 Q2 3
15 Q3 10
16 Q4 3
ISSN 2231-3265 International Journal of Health, Physical Education and Computer Science in Sports
Volume No.2, No.1.
33
According to table 1 scores the subject have shown a tendency or inclination towards the higher direction or high sten score description in ten (A, B, C, E, F, G, H, N, Q1 and Q3) out of sixteen personality factors. The subject was average in one (M) out of the sixteen factors. Towards the lower direction or low sten score description in five (I, L,O,Q2 and Q4) out of the sixteen personality factors. Findings of the 16 primary personality factors Factor A: Reserved Vs Outgoing Sanjay Bangar tends to be good natured, easy going, emotionally expressive, ready to co-operate, attentive to people, softhearted, kindly and adaptable. He like occupations dealing with people and socially impressive situations and he rapidly from active groups. He is generous in personal relations, less afraid of criticism, and better able to remember names of people. Factor B: Less Intelligent Vs More Intelligent Sanjay Bangar tends to be quick to grasp ideas, a fast learner, intelligent. There is some correlation with level of culture, and some with alertness. Factor C: Affected by Feelings Vs Emotionally Stable Sanjay Bangar tends to be emotionally mature, stable, realistic about life, unruffled, possessing ego strength, better able to maintain solid group morale. Factor E: Submissive Vs Dominant Sanjay Bangar was assertive, self assured and independent minded. He tend to be authoritarian (managing others). Factor F: Sober Vs Enthusiastic Sanjay Bangar tends to be cheerful, active, talkative, frank, expressive, effervescent and carefree. He was frequently chosen as elected leader. He may be impulsive and mercurial. Factor G: Expedient Vs Conscientious Sanjay Bangar tends to be exacting in character, dominated by sense of duty, preserving, responsible, planful, “fill the unforgiving minute”. He was usually conscientious and moralistic and he prefers hard working people to witty companions. Factor H: Timid Vs Venturesome Sanjay Bangar was sociable, bold, ready to try new things, spontaneous and abundant in emotional response. His “thick skinned ness” enables them to face weal and tear in dealing with people and grueling emotional situations, without fatigue. Factor I: Tough-minded Vs Tender-minded Sanjay Bangar tends to be tough, realistic, “down to earth”, independent, responsible but skeptical of subjective, cultural elaborations. He tends to keep a group operating on a practical and realistic “no-nonsense” basis. Factor L: Trusting Vs Suspicious Sanjay Bangar tends to be free of jealous tendencies, adaptable, cheerful, uncompetitive, concerned about others and a good team worker. Factor M: Practical Vs Imaginative Sanjay Bangar tends to be anxious to do the right things, attentive to practical matters and subject to the dictation of what is obviously possible. Factor N: Forthright Vs Shrewd Sanjay Bangar, tends to be polished, experimental and shrewd. His approach to people and problems is usually perceptive, hard-headed and efficient. Factor O: Self-assured Vs Apprehensive Sanjay Bangar tends to be unruffled and to have unshakable nerve. He has a mature, unanxious confidence in themselves and their capacity to deal with things. Factor Q1: Conservative Vs Experimenting Sanjay Bangar tends to be interested in intellectual matters and have doubts on fundamental issues. He was skeptical and inquiring regarding ideas, either old or new. Usually he was more well informed, less inclined to moralize, more inclined to experiment in life generally and more tolerant of inconvenience and change. Factor Q2: Group-oriented Vs Self-sufficient Sanjay Bangar prefers to work and make decisions with other people and like and depend on social approval and admiration. Factor Q3: Undisciplined self-conflict Vs Following Self-image Sanjay Bangar tends to have strong control of their emotions and general behavior, are inclined to be socially aware and careful, and evidence what is commonly forced “self respect” and high regard for social reputation.
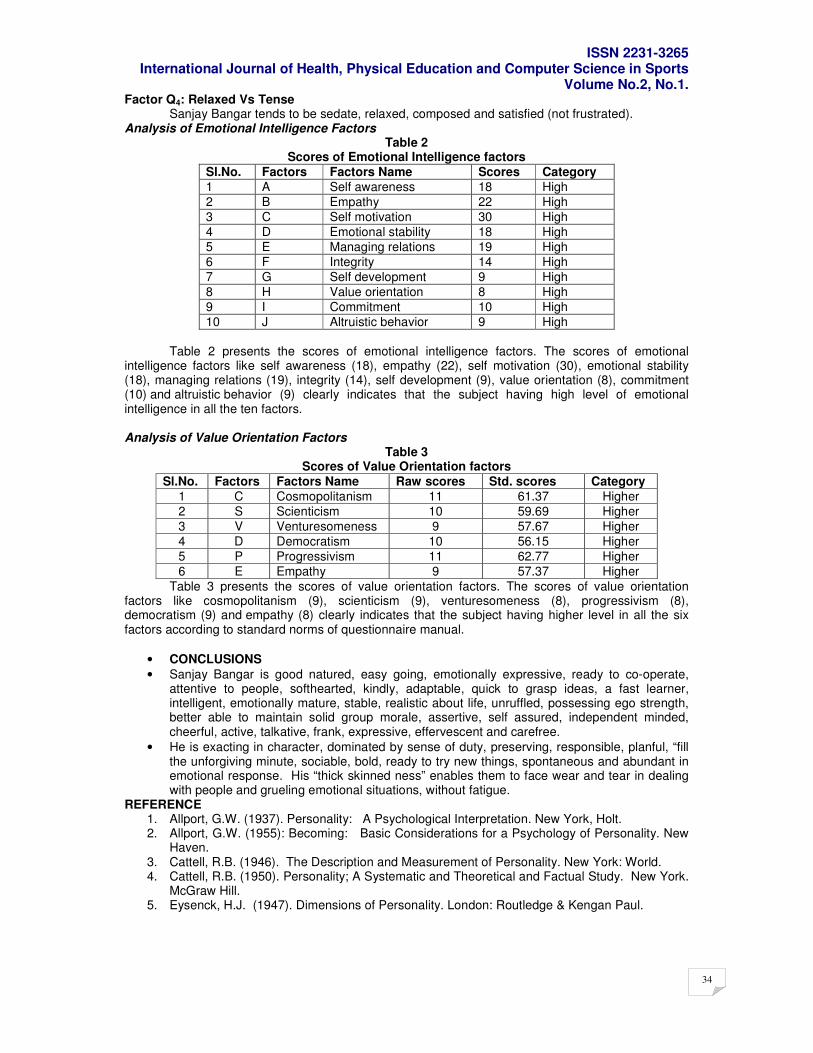
ISSN 2231-3265 International Journal of Health, Physical Education and Computer Science in Sports
Volume No.2, No.1.
34
Factor Q4: Relaxed Vs Tense Sanjay Bangar tends to be sedate, relaxed, composed and satisfied (not frustrated). Analysis of Emotional Intelligence Factors
Table 2 Scores of Emotional Intelligence factors
Sl.No. Factors Factors Name Scores Category
1 A Self awareness 18 High
2 B Empathy 22 High
3 C Self motivation 30 High
4 D Emotional stability 18 High
5 E Managing relations 19 High
6 F Integrity 14 High
7 G Self development 9 High
8 H Value orientation 8 High
9 I Commitment 10 High
10 J Altruistic behavior 9 High
Table 2 presents the scores of emotional intelligence factors. The scores of emotional
intelligence factors like self awareness (18), empathy (22), self motivation (30), emotional stability (18), managing relations (19), integrity (14), self development (9), value orientation (8), commitment (10) and altruistic behavior (9) clearly indicates that the subject having high level of emotional intelligence in all the ten factors. Analysis of Value Orientation Factors
Table 3 Scores of Value Orientation factors
Sl.No. Factors Factors Name Raw scores Std. scores Category
1 C Cosmopolitanism 11 61.37 Higher
2 S Scienticism 10 59.69 Higher
3 V Venturesomeness 9 57.67 Higher
4 D Democratism 10 56.15 Higher
5 P Progressivism 11 62.77 Higher
6 E Empathy 9 57.37 Higher
Table 3 presents the scores of value orientation factors. The scores of value orientation factors like cosmopolitanism (9), scienticism (9), venturesomeness (8), progressivism (8), democratism (9) and empathy (8) clearly indicates that the subject having higher level in all the six factors according to standard norms of questionnaire manual.
• CONCLUSIONS
• Sanjay Bangar is good natured, easy going, emotionally expressive, ready to co-operate, attentive to people, softhearted, kindly, adaptable, quick to grasp ideas, a fast learner, intelligent, emotionally mature, stable, realistic about life, unruffled, possessing ego strength, better able to maintain solid group morale, assertive, self assured, independent minded, cheerful, active, talkative, frank, expressive, effervescent and carefree.
• He is exacting in character, dominated by sense of duty, preserving, responsible, planful, “fill the unforgiving minute, sociable, bold, ready to try new things, spontaneous and abundant in emotional response. His “thick skinned ness” enables them to face wear and tear in dealing with people and grueling emotional situations, without fatigue.
REFERENCE 1. Allport, G.W. (1937). Personality: A Psychological Interpretation. New York, Holt. 2. Allport, G.W. (1955): Becoming: Basic Considerations for a Psychology of Personality. New
Haven. 3. Cattell, R.B. (1946). The Description and Measurement of Personality. New York: World. 4. Cattell, R.B. (1950). Personality; A Systematic and Theoretical and Factual Study. New York.
McGraw Hill. 5. Eysenck, H.J. (1947). Dimensions of Personality. London: Routledge & Kengan Paul.
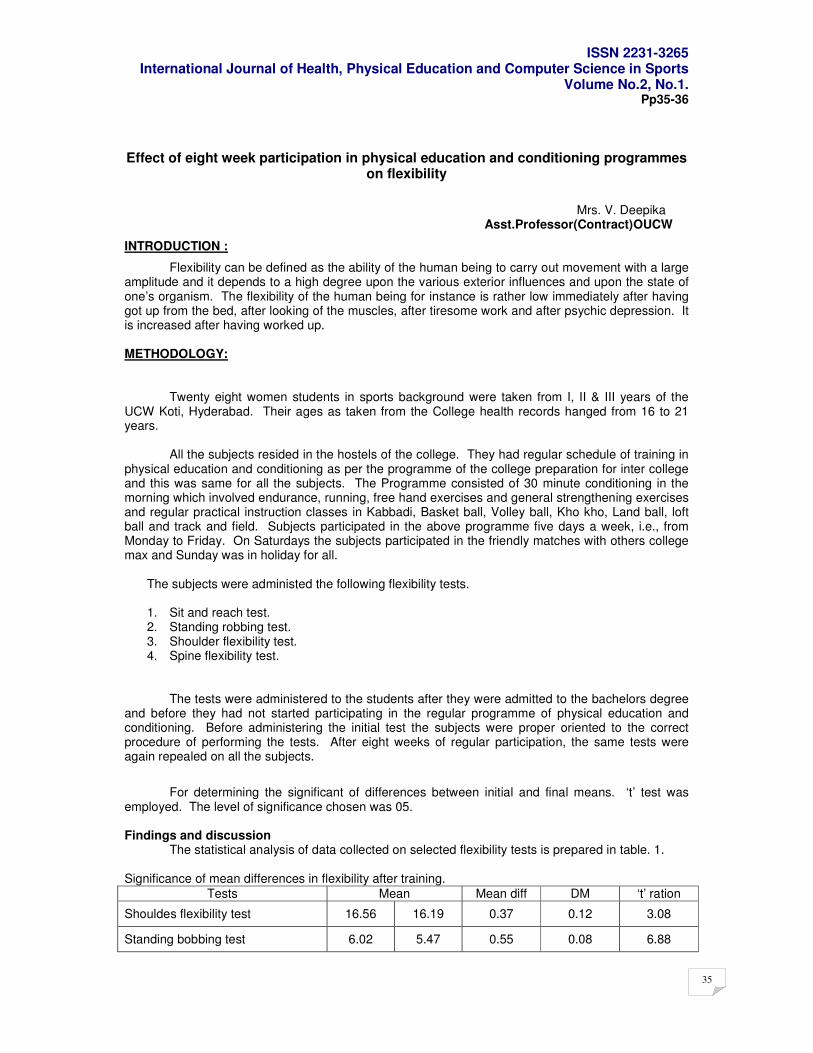
ISSN 2231-3265 International Journal of Health, Physical Education and Computer Science in Sports
Volume No.2, No.1.
35
Pp35-36
Effect of eight week participation in physical education and conditioning programmes on flexibility
Mrs. V. Deepika Asst.Professor(Contract)OUCW
INTRODUCTION :
Flexibility can be defined as the ability of the human being to carry out movement with a large amplitude and it depends to a high degree upon the various exterior influences and upon the state of one’s organism. The flexibility of the human being for instance is rather low immediately after having got up from the bed, after looking of the muscles, after tiresome work and after psychic depression. It is increased after having worked up. METHODOLOGY:
Twenty eight women students in sports background were taken from I, II & III years of the UCW Koti, Hyderabad. Their ages as taken from the College health records hanged from 16 to 21 years.
All the subjects resided in the hostels of the college. They had regular schedule of training in
physical education and conditioning as per the programme of the college preparation for inter college and this was same for all the subjects. The Programme consisted of 30 minute conditioning in the morning which involved endurance, running, free hand exercises and general strengthening exercises and regular practical instruction classes in Kabbadi, Basket ball, Volley ball, Kho kho, Land ball, loft ball and track and field. Subjects participated in the above programme five days a week, i.e., from Monday to Friday. On Saturdays the subjects participated in the friendly matches with others college max and Sunday was in holiday for all.
The subjects were administed the following flexibility tests. 1. Sit and reach test. 2. Standing robbing test. 3. Shoulder flexibility test. 4. Spine flexibility test.
The tests were administered to the students after they were admitted to the bachelors degree
and before they had not started participating in the regular programme of physical education and conditioning. Before administering the initial test the subjects were proper oriented to the correct procedure of performing the tests. After eight weeks of regular participation, the same tests were again repealed on all the subjects.
For determining the significant of differences between initial and final means. ‘t’ test was employed. The level of significance chosen was 05. Findings and discussion
The statistical analysis of data collected on selected flexibility tests is prepared in table. 1. Significance of mean differences in flexibility after training.
Tests Mean Mean diff DM ‘t’ ration
Shouldes flexibility test 16.56 16.19 0.37 0.12 3.08
Standing bobbing test 6.02 5.47 0.55 0.08 6.88

ISSN 2231-3265 International Journal of Health, Physical Education and Computer Science in Sports
Volume No.2, No.1.
36
Spine flexibility test 17.25 16.71 0.34 0.14 2.43
Sit and reach test 6.38 6.82 0.44 0.17 2.59
Significant at .05 level of Confidence ‘t’ valve needed at .0 level with 27 degrees of freedom is
2.05. The analysis of data in table 2 reveals that regular participation in physical education and conditioning programmes significantly tests, namely. Shoulder flexibility test, standing bobbing test, Spine flexibility test and sit and reach test. DISCUSSION : From the statistical analysis of data it B obvious that 8 weeks participation in a programme of physical education and conditioning involving free hand exercises, endurance running, general strengthening exercises and practical instructions in Kabaddi, Basket ball, Volley ball, Kho-Kho, hand ball, soft ball and track & field significantly improves performance in selected flexibility tests. The subjects in this study during their participation in free hand exercises general strengthening exercises, and also white receiving practical instruction in the activities overturned earlier performed a large number of flexibility movements during the warm sessions during the practical instructions of the activities which night have a handed the dasticity of the muscle fibre. Therefore, increased performance in flexibility tests may attributed to optimal stretching to which the muscles were subject while they participated in physical education and conditioning programmes. The results of the present study are in consonance with the findings of Brown (2) and Hansen (5). CONCLUSION : Regular participation in a programme of physical education and conditioning of eight weeks duration effectively improves flexibility of the hip, trunk, shoulder and spine as measured by sit and reach test standing bobbing test, shouldes flexibility test and spine flexibility test, respectively. REFERENCES : 1. Bridell, Gray E “A Comparison of selected static and dynamic stretching exercises on the flexibility
of the hip joint” Completed Research in health, physical education and Recreation 12 (1970) 201. 2. Brown halts and joseph F. “The effect of physical education roller class and a wresting class
upon static balance and flexibility completed research in health, physical education and recreation “(1968): 11
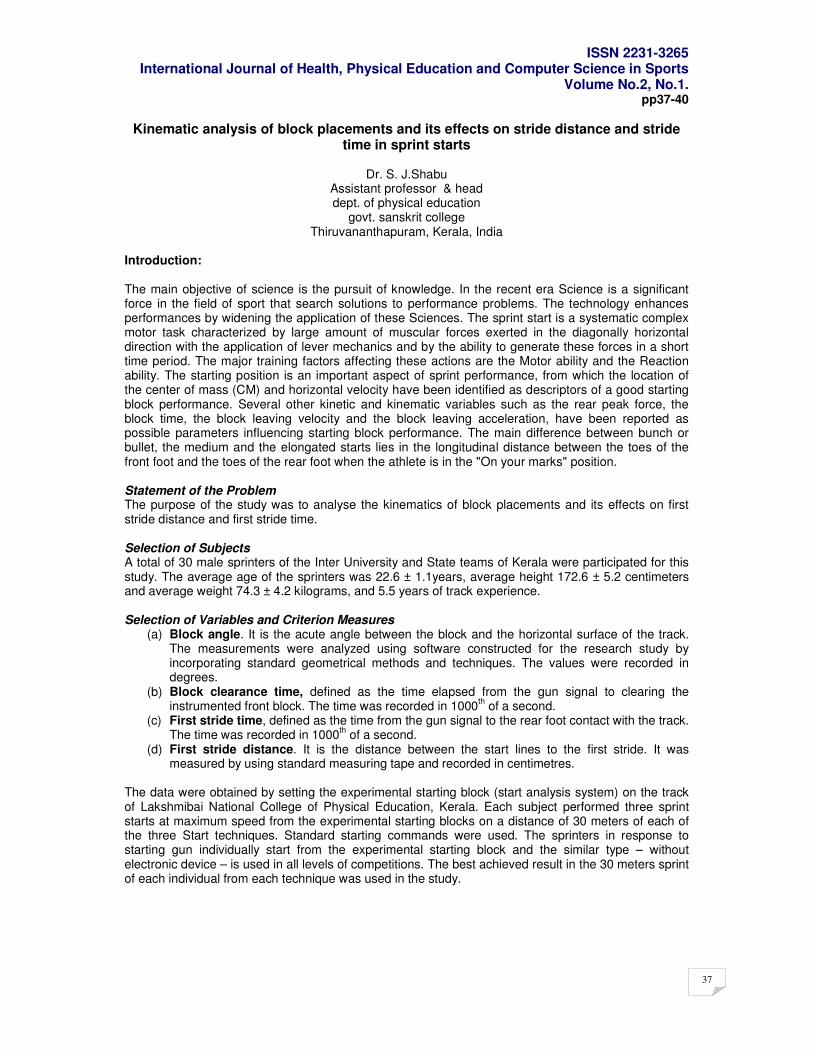
ISSN 2231-3265 International Journal of Health, Physical Education and Computer Science in Sports
Volume No.2, No.1.
37
pp37-40
Kinematic analysis of block placements and its effects on stride distance and stride time in sprint starts
Dr. S. J.Shabu
Assistant professor & head dept. of physical education
govt. sanskrit college Thiruvananthapuram, Kerala, India
Introduction: The main objective of science is the pursuit of knowledge. In the recent era Science is a significant force in the field of sport that search solutions to performance problems. The technology enhances performances by widening the application of these Sciences. The sprint start is a systematic complex motor task characterized by large amount of muscular forces exerted in the diagonally horizontal direction with the application of lever mechanics and by the ability to generate these forces in a short time period. The major training factors affecting these actions are the Motor ability and the Reaction ability. The starting position is an important aspect of sprint performance, from which the location of the center of mass (CM) and horizontal velocity have been identified as descriptors of a good starting block performance. Several other kinetic and kinematic variables such as the rear peak force, the block time, the block leaving velocity and the block leaving acceleration, have been reported as possible parameters influencing starting block performance. The main difference between bunch or bullet, the medium and the elongated starts lies in the longitudinal distance between the toes of the front foot and the toes of the rear foot when the athlete is in the "On your marks" position. Statement of the Problem The purpose of the study was to analyse the kinematics of block placements and its effects on first stride distance and first stride time. Selection of Subjects A total of 30 male sprinters of the Inter University and State teams of Kerala were participated for this study. The average age of the sprinters was 22.6 ± 1.1years, average height 172.6 ± 5.2 centimeters and average weight 74.3 ± 4.2 kilograms, and 5.5 years of track experience. Selection of Variables and Criterion Measures
(a) Block angle. It is the acute angle between the block and the horizontal surface of the track. The measurements were analyzed using software constructed for the research study by incorporating standard geometrical methods and techniques. The values were recorded in degrees.
(b) Block clearance time, defined as the time elapsed from the gun signal to clearing the instrumented front block. The time was recorded in 1000
th of a second.
(c) First stride time, defined as the time from the gun signal to the rear foot contact with the track. The time was recorded in 1000
th of a second.
(d) First stride distance. It is the distance between the start lines to the first stride. It was measured by using standard measuring tape and recorded in centimetres.
The data were obtained by setting the experimental starting block (start analysis system) on the track of Lakshmibai National College of Physical Education, Kerala. Each subject performed three sprint starts at maximum speed from the experimental starting blocks on a distance of 30 meters of each of the three Start techniques. Standard starting commands were used. The sprinters in response to starting gun individually start from the experimental starting block and the similar type – without electronic device – is used in all levels of competitions. The best achieved result in the 30 meters sprint of each individual from each technique was used in the study.
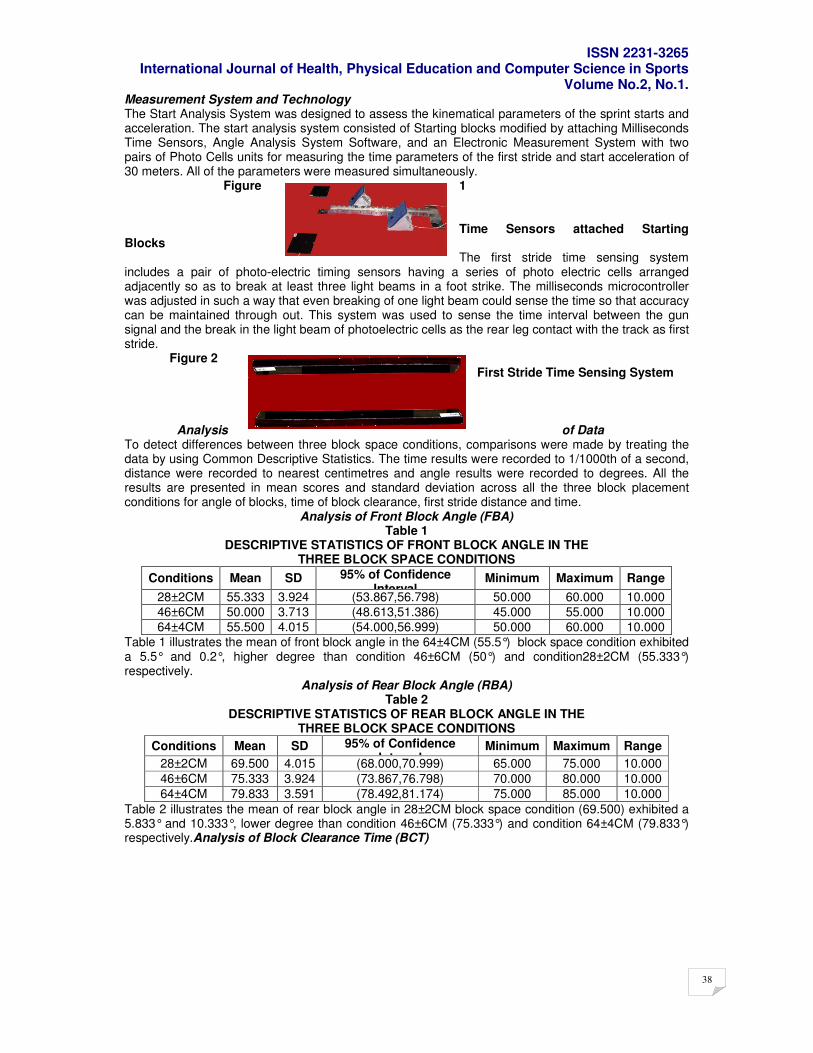
ISSN 2231-3265 International Journal of Health, Physical Education and Computer Science in Sports
Volume No.2, No.1.
38
Measurement System and Technology The Start Analysis System was designed to assess the kinematical parameters of the sprint starts and acceleration. The start analysis system consisted of Starting blocks modified by attaching Milliseconds Time Sensors, Angle Analysis System Software, and an Electronic Measurement System with two pairs of Photo Cells units for measuring the time parameters of the first stride and start acceleration of 30 meters. All of the parameters were measured simultaneously. Figure 1 Time Sensors attached Starting Blocks The first stride time sensing system includes a pair of photo-electric timing sensors having a series of photo electric cells arranged adjacently so as to break at least three light beams in a foot strike. The milliseconds microcontroller was adjusted in such a way that even breaking of one light beam could sense the time so that accuracy can be maintained through out. This system was used to sense the time interval between the gun signal and the break in the light beam of photoelectric cells as the rear leg contact with the track as first stride.
Figure 2 First Stride Time Sensing System
Analysis of Data To detect differences between three block space conditions, comparisons were made by treating the data by using Common Descriptive Statistics. The time results were recorded to 1/1000th of a second, distance were recorded to nearest centimetres and angle results were recorded to degrees. All the results are presented in mean scores and standard deviation across all the three block placement conditions for angle of blocks, time of block clearance, first stride distance and time.
Analysis of Front Block Angle (FBA) Table 1
DESCRIPTIVE STATISTICS OF FRONT BLOCK ANGLE IN THE THREE BLOCK SPACE CONDITIONS
Conditions Mean SD 95% of Confidence Interval
Minimum Maximum Range
28±2CM 55.333 3.924 (53.867,56.798) 50.000 60.000 10.000
46±6CM 50.000 3.713 (48.613,51.386) 45.000 55.000 10.000
64±4CM 55.500 4.015 (54.000,56.999) 50.000 60.000 10.000
Table 1 illustrates the mean of front block angle in the 64±4CM (55.5°) block space condition exhibited a 5.5° and 0.2°, higher degree than condition 46±6CM (50°) and condition28±2CM (55.333°) respectively.
Analysis of Rear Block Angle (RBA) Table 2
DESCRIPTIVE STATISTICS OF REAR BLOCK ANGLE IN THE THREE BLOCK SPACE CONDITIONS
Conditions Mean SD 95% of Confidence Interval
Minimum Maximum Range
28±2CM 69.500 4.015 (68.000,70.999) 65.000 75.000 10.000
46±6CM 75.333 3.924 (73.867,76.798) 70.000 80.000 10.000
64±4CM 79.833 3.591 (78.492,81.174) 75.000 85.000 10.000
Table 2 illustrates the mean of rear block angle in 28±2CM block space condition (69.500) exhibited a 5.833° and 10.333°, lower degree than condition 46±6CM (75.333°) and condition 64±4CM (79.833°) respectively.Analysis of Block Clearance Time (BCT)
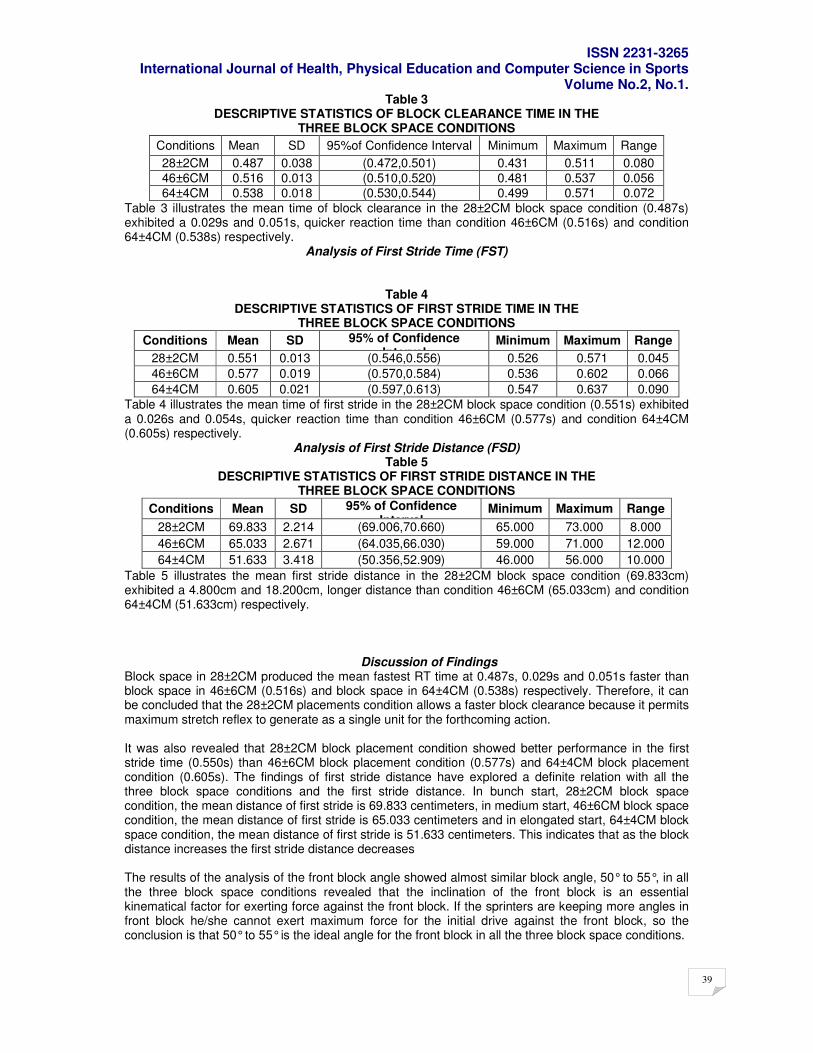
ISSN 2231-3265 International Journal of Health, Physical Education and Computer Science in Sports
Volume No.2, No.1.
39
Table 3 DESCRIPTIVE STATISTICS OF BLOCK CLEARANCE TIME IN THE
THREE BLOCK SPACE CONDITIONS
Conditions Mean SD 95%of Confidence Interval Minimum Maximum Range
28±2CM 0.487 0.038 (0.472,0.501) 0.431 0.511 0.080
46±6CM 0.516 0.013 (0.510,0.520) 0.481 0.537 0.056
64±4CM 0.538 0.018 (0.530,0.544) 0.499 0.571 0.072
Table 3 illustrates the mean time of block clearance in the 28±2CM block space condition (0.487s) exhibited a 0.029s and 0.051s, quicker reaction time than condition 46±6CM (0.516s) and condition 64±4CM (0.538s) respectively.
Analysis of First Stride Time (FST)
Table 4 DESCRIPTIVE STATISTICS OF FIRST STRIDE TIME IN THE
THREE BLOCK SPACE CONDITIONS
Conditions Mean SD 95% of Confidence Interval
Minimum Maximum Range
28±2CM 0.551 0.013 (0.546,0.556) 0.526 0.571 0.045
46±6CM 0.577 0.019 (0.570,0.584) 0.536 0.602 0.066
64±4CM 0.605 0.021 (0.597,0.613) 0.547 0.637 0.090
Table 4 illustrates the mean time of first stride in the 28±2CM block space condition (0.551s) exhibited a 0.026s and 0.054s, quicker reaction time than condition 46±6CM (0.577s) and condition 64±4CM (0.605s) respectively.
Analysis of First Stride Distance (FSD) Table 5
DESCRIPTIVE STATISTICS OF FIRST STRIDE DISTANCE IN THE THREE BLOCK SPACE CONDITIONS
Conditions Mean SD 95% of Confidence Interval
Minimum Maximum Range
28±2CM 69.833 2.214 (69.006,70.660) 65.000 73.000 8.000
46±6CM 65.033 2.671 (64.035,66.030) 59.000 71.000 12.000
64±4CM 51.633 3.418 (50.356,52.909) 46.000 56.000 10.000
Table 5 illustrates the mean first stride distance in the 28±2CM block space condition (69.833cm) exhibited a 4.800cm and 18.200cm, longer distance than condition 46±6CM (65.033cm) and condition 64±4CM (51.633cm) respectively.
Discussion of Findings Block space in 28±2CM produced the mean fastest RT time at 0.487s, 0.029s and 0.051s faster than block space in 46±6CM (0.516s) and block space in 64±4CM (0.538s) respectively. Therefore, it can be concluded that the 28±2CM placements condition allows a faster block clearance because it permits maximum stretch reflex to generate as a single unit for the forthcoming action.
It was also revealed that 28±2CM block placement condition showed better performance in the first stride time (0.550s) than 46±6CM block placement condition (0.577s) and 64±4CM block placement condition (0.605s). The findings of first stride distance have explored a definite relation with all the three block space conditions and the first stride distance. In bunch start, 28±2CM block space condition, the mean distance of first stride is 69.833 centimeters, in medium start, 46±6CM block space condition, the mean distance of first stride is 65.033 centimeters and in elongated start, 64±4CM block space condition, the mean distance of first stride is 51.633 centimeters. This indicates that as the block distance increases the first stride distance decreases The results of the analysis of the front block angle showed almost similar block angle, 50° to 55°, in all the three block space conditions revealed that the inclination of the front block is an essential kinematical factor for exerting force against the front block. If the sprinters are keeping more angles in front block he/she cannot exert maximum force for the initial drive against the front block, so the conclusion is that 50° to 55° is the ideal angle for the front block in all the three block space conditions.
ISSN 2231-3265 International Journal of Health, Physical Education and Computer Science in Sports
Volume No.2, No.1.
40
In the case of rear block angle the statistical result displayed the difference in all the three block space conditions in which the difference is due to the fact that block has to be kept in proper inclination so that the sprinter can occupy a comfort position when he/she reaches in “set”. The result shown that the block angle in the medium block space condition has got the intermediate value as 75.333° (bunch start 69.5° and elongated start 79.833°) thus accepted as an optimum value for the better angle of rear block. The higher angle in the rear block showed that the body weight has to be concentrated in front. Conclusions
1. Block space in 28±2CM produced the mean fastest RT time at 0.487s, 0.029s and 0.051s faster than block space in 46±6CM (0.516s) and block space in 64±4CM (0.538s) respectively.
2. 28±2CM block placement condition showed better performance in the first stride time (0.550s) than 46±6CM block placement condition (0.577s) and 64±4CM block placement condition (0.605s).
3. In bunch start the mean distance of first stride was 69.833 centimetres, in medium start the mean distance of first stride was 65.033 centimetres and in elongated start the mean distance of first stride was 51.633 centimetres. This indicates the first stride distance has got an inverse relation to the block distance.
4. 50° to 55° is the ideal angle for the front block in all the three block space conditions. 5. The block angle in the medium block space condition has got the intermediate value as
75.333° (bunch start 69.5° and elongated start 79.833°) thus accepted as an optimum value for the better angle for the rear block. The higher angle in the rear block showed that the body weight has to be concentrated in front.
ISSN 2231-3265 International Journal of Health, Physical Education and Computer Science in Sports
Volume No.2, No.1.
41
Pp41-42
Analysis of propulsive task related physical fitness in obese and non obese adolescent girls
Minaxi M. Patel
Lec.in physical education, Jasani college, Rajkot
Abstract The purpose of the study was to compare the propulsive task related physical fitness in obese and non obese adolescent girls. To achieve the purpose hundred adolescent girls from classes ninth and tenth were selected as subjects from Kadvibai Virani school Rajkot. The students were divided into ‘obese’ and ‘non obese’ group based on their skin fold measurments. Each group consists of so subjects. The abiility to propel and lift the body mass is called prpulsive task related physical fitness. The selected propulsive task related physcial fitness variable were assessed by standing broad jump, sit-ups, 50-yard dash, shuttle run and 600 yards run and walk test. Other subjects had inferior performances on all tests requiring propulsion or lifting of the body mass compared with their non obese counterparts. Results of this study showed the obese subjects had poorer performances on weight-bearing tasks scoring lower scores on all fitness components. To encourage adherence to physical activity in obese youth, it is important that activities are tailored to their capabilities. Results suggested that weight-bearing activities should be limited at the start of fitness program with obese participants and alternative activities that rely more on non weight bearing activities. Such as cycling, swimming or other aquatic activities may be incorporated. It was concluded that the non obese children were better than the obese children in selected propulsive task related physical fitness components. Introduction:- Obesity is a condition in which a person has an excess of adipose or ft tissue. Obesity. Obesity may be classified according to either percent body fat or by the relationship of height and weight (BMI). Obesity leads to numerous negative health consequences. Obese adolescents seem to be less physically active that their leaner peers, but the total energy expenditure of obese adolescents may be equal or higher. Based on weight relative scores, most studies have found that obese children and adolescents are less fit that their normal-weight counterparts. Physical fitness is generally considered to be “the ability to perform daily to tasks without fatigue.” Physcial fitness includes several components: cardio – respiratory fitness, muscular endurance, muscular strength, flexibility, coordination and speed. The ability to propel and lift the body mass is called prpulsive task related physical fitness. Increasin physical activity is one of the key elements in the treatment of childhood obesity. Motivating obese subjects to adhere to an activity program is a major challenge. To improve adherence, one must develop an exercise program that is manageable for obese children and adolescents. Interventions that are not tailored to the fitness levels of obese participants may contribute to discouragement of future participation in physical activity. Purpose of the study:- The purpose of the study was to analyze the propulsive task related physical fitness in obese and non obese adolescent girls. Hypothesis:- It was hypothesized that “non obese” adolescents would have better propulsive task related fitness than “obese” adolescents. Methodology:- To achieve the purpose hundred adolescent girls from classes ninth and tenth were selelcted as subjects from Kadvibai virani school Rajkot. The students were divided in to “obese” and “non obese” group based on their skin fold measurements. Each group consists of 50 subjects. The selected propulsive task related physical fitness variables were assessed by standing- broad jump (explosive strength), sit-ups (trunk strength and endurance), pull ups (upper body strength and endurance). 50-yard dash (speed), shuttle run (agility) and 600 yard run and walk (endurance).
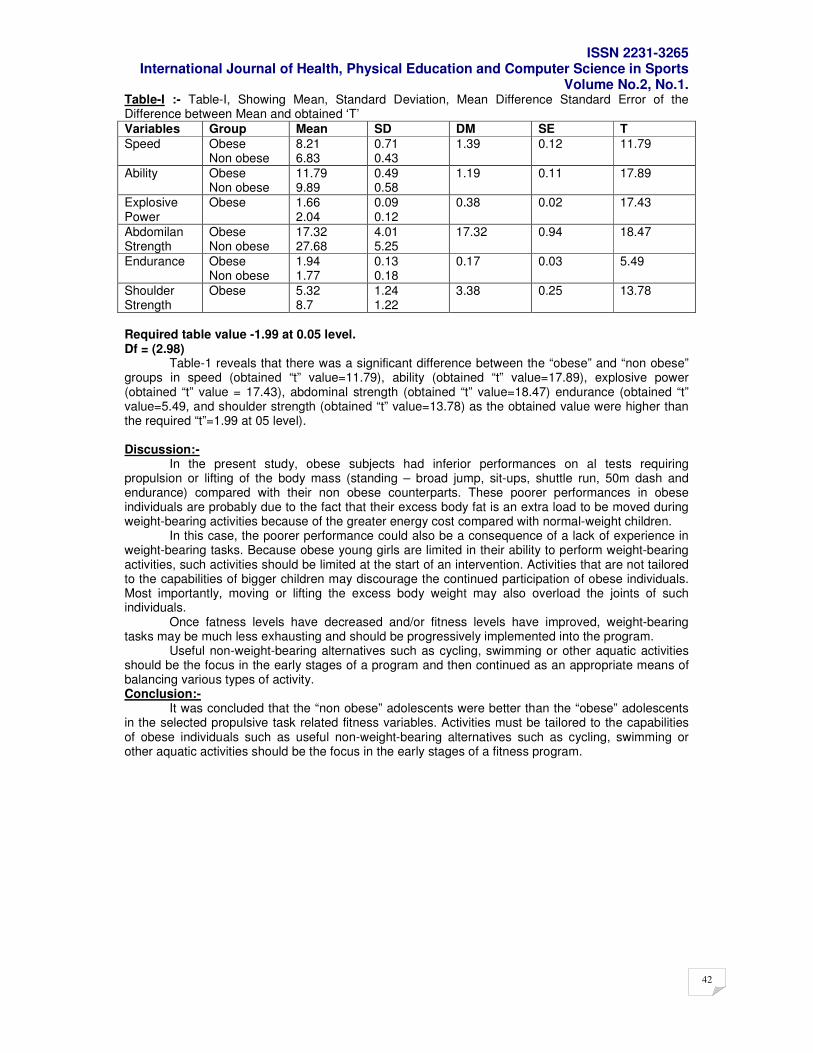
ISSN 2231-3265 International Journal of Health, Physical Education and Computer Science in Sports
Volume No.2, No.1.
42
Table-I :- Table-I, Showing Mean, Standard Deviation, Mean Difference Standard Error of the Difference between Mean and obtained ‘T’
Variables Group Mean SD DM SE T
Speed Obese Non obese
8.21 6.83
0.71 0.43
1.39 0.12 11.79
Ability Obese Non obese
11.79 9.89
0.49 0.58
1.19 0.11 17.89
Explosive Power
Obese 1.66 2.04
0.09 0.12
0.38 0.02 17.43
Abdomilan Strength
Obese Non obese
17.32 27.68
4.01 5.25
17.32 0.94 18.47
Endurance Obese Non obese
1.94 1.77
0.13 0.18
0.17 0.03 5.49
Shoulder Strength
Obese 5.32 8.7
1.24 1.22
3.38 0.25 13.78
Required table value -1.99 at 0.05 level. Df = (2.98) Table-1 reveals that there was a significant difference between the “obese” and “non obese” groups in speed (obtained “t” value=11.79), ability (obtained “t” value=17.89), explosive power (obtained “t” value = 17.43), abdominal strength (obtained “t” value=18.47) endurance (obtained “t” value=5.49, and shoulder strength (obtained “t” value=13.78) as the obtained value were higher than the required “t”=1.99 at 05 level). Discussion:- In the present study, obese subjects had inferior performances on al tests requiring propulsion or lifting of the body mass (standing – broad jump, sit-ups, shuttle run, 50m dash and endurance) compared with their non obese counterparts. These poorer performances in obese individuals are probably due to the fact that their excess body fat is an extra load to be moved during weight-bearing activities because of the greater energy cost compared with normal-weight children. In this case, the poorer performance could also be a consequence of a lack of experience in weight-bearing tasks. Because obese young girls are limited in their ability to perform weight-bearing activities, such activities should be limited at the start of an intervention. Activities that are not tailored to the capabilities of bigger children may discourage the continued participation of obese individuals. Most importantly, moving or lifting the excess body weight may also overload the joints of such individuals. Once fatness levels have decreased and/or fitness levels have improved, weight-bearing tasks may be much less exhausting and should be progressively implemented into the program. Useful non-weight-bearing alternatives such as cycling, swimming or other aquatic activities should be the focus in the early stages of a program and then continued as an appropriate means of balancing various types of activity. Conclusion:- It was concluded that the “non obese” adolescents were better than the “obese” adolescents in the selected propulsive task related fitness variables. Activities must be tailored to the capabilities of obese individuals such as useful non-weight-bearing alternatives such as cycling, swimming or other aquatic activities should be the focus in the early stages of a fitness program.
ISSN 2231-3265 International Journal of Health, Physical Education and Computer Science in Sports
Volume No.2, No.1.
43
Pp43-45
A Study of Nutritional status of National Level Wrestlers of Maharashtra
Dr. Jayant Chatur,
Principal, Nankibai Wadhawani Kala Mahavidyalaya,Yavatmal Mr. Prakash Dagwar
Yavatmal
INTRODUCTION: Nutrition is a science that deals with nutrients and other food substances and with how the body assimilates them. The extremely complex processes that nutrients undergo in the body-how they affect on another, how they are broken down and released as energy, and how they are transported and used to rebuild countless specialized tissues and sustain the overall health of the individual are understood only approximately. Nevertheless, important nutritional decisions need to be made for the health of the aged, and of entire populations suffering form malnutrition, the macronutrients, and carbohydrates play an important role as fuel to the body during any type work or sports activities. In India very few studies are conducted in the fields of sports nutrition and its impact on performance level. Information regarding nutrition, nutrient intake and impact of supplementation in relation to specific team games is not available, It reveals that ECK (1998) and Burke (2000) surveyed 43 university football players found that the distribution of dietary nutrients for carbohydrate protein and fats was not in accord with current recommendation.
STATEMENT OF THE PROBLEM: The researcher has selected “A Study of nutritional status of National Level Wrestlers of Maharashtra” as the topic for research.
METHODOLOGY: The samples were collected from; those who are participated in National Wrestling Championships in the year 2005-06 sample were selected by random method.
SELECTION OF SUBJECT: In the present study a sample of participation in National Wrestling Tournaments of Maharashtra 100 Wrestlers selected randomly 77 Men and 23 Women.
PROCEDURE: Present research related data was integrated from tournaments organized by Maharashtra National Wrestlers male and female players who had represented National levels. Researcher has prepared the questionnaire under the guidance questionnaire, those were distributed among the wrestlers and collected the entire questionnaire with all necessary dietary information about players, and the method of dietary survey has been selected from the book of mahtab Bamji, Specially Regiment method has been chosen for further study. On the basis of information about raw and cooking food taken by the players and as per the guidelines given in the book of C.Gopalan the diet has been converted into calories.
SCORING: The complete answer sheets were collected with the help of wrestlers those who participated in National Tournaments. The row score of each survey of wrestlers was recorded on each answer sheet. These row score along with converted standard score were present in tabulated from for statistical analysis, finding and conclusion
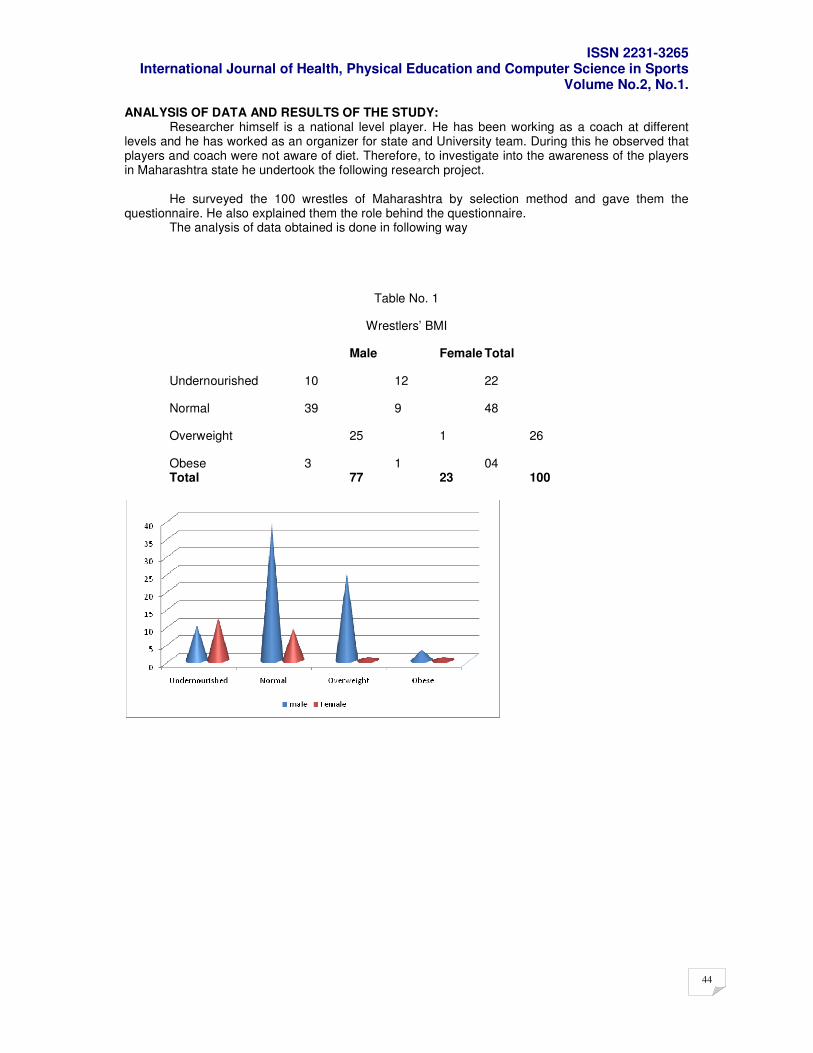
ISSN 2231-3265 International Journal of Health, Physical Education and Computer Science in Sports
Volume No.2, No.1.
44
ANALYSIS OF DATA AND RESULTS OF THE STUDY: Researcher himself is a national level player. He has been working as a coach at different levels and he has worked as an organizer for state and University team. During this he observed that players and coach were not aware of diet. Therefore, to investigate into the awareness of the players in Maharashtra state he undertook the following research project. He surveyed the 100 wrestles of Maharashtra by selection method and gave them the questionnaire. He also explained them the role behind the questionnaire. The analysis of data obtained is done in following way
Table No. 1
Wrestlers’ BMI
Male Female Total
Undernourished 10 12 22
Normal 39 9 48
Overweight 25 1 26
Obese 3 1 04 Total 77 23 100
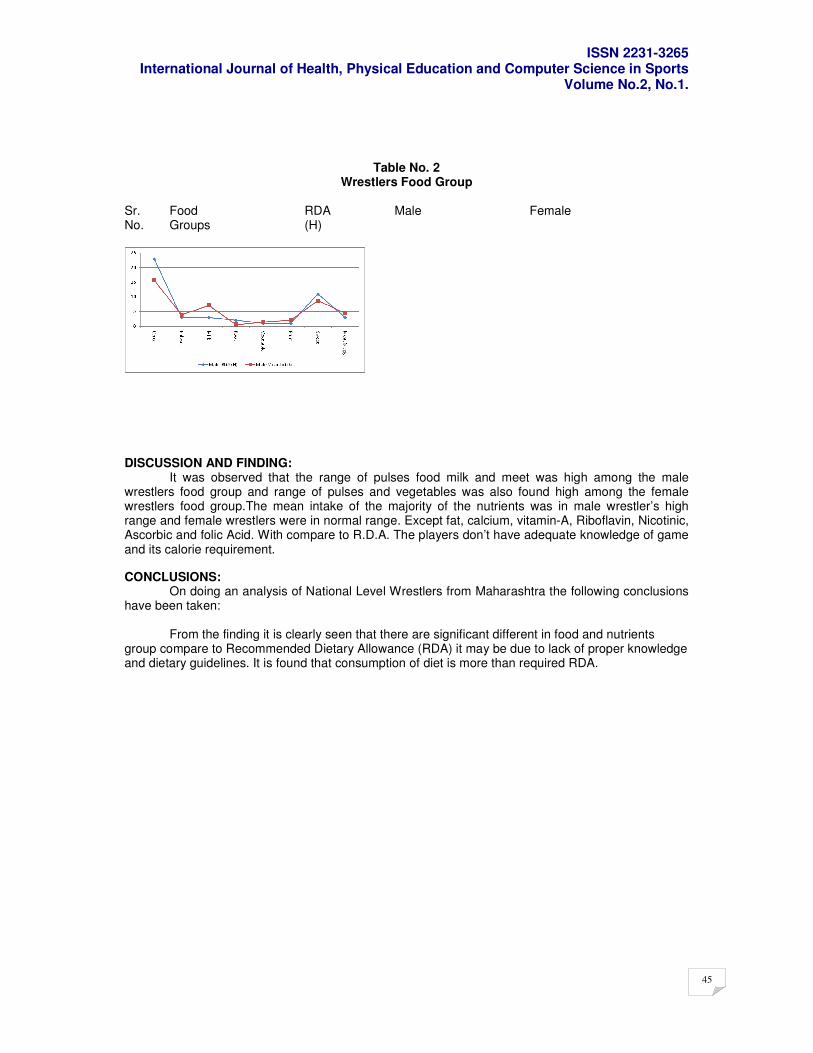
ISSN 2231-3265 International Journal of Health, Physical Education and Computer Science in Sports
Volume No.2, No.1.
45
Table No. 2 Wrestlers Food Group
Sr. Food RDA Male Female No. Groups (H)
DISCUSSION AND FINDING: It was observed that the range of pulses food milk and meet was high among the male wrestlers food group and range of pulses and vegetables was also found high among the female wrestlers food group.The mean intake of the majority of the nutrients was in male wrestler’s high range and female wrestlers were in normal range. Except fat, calcium, vitamin-A, Riboflavin, Nicotinic, Ascorbic and folic Acid. With compare to R.D.A. The players don’t have adequate knowledge of game and its calorie requirement.
CONCLUSIONS: On doing an analysis of National Level Wrestlers from Maharashtra the following conclusions have been taken: From the finding it is clearly seen that there are significant different in food and nutrients group compare to Recommended Dietary Allowance (RDA) it may be due to lack of proper knowledge and dietary guidelines. It is found that consumption of diet is more than required RDA.
ISSN 2231-3265 International Journal of Health, Physical Education and Computer Science in Sports
Volume No.2, No.1.
46
pp46-47
An analytical study on psychological factors of football players & hockey players in Telangana universities
By
Dr.B.Sunil Kumar, Chairman, Board of Studies of Physical Education, O.U. Hyd
Srinivas Nallela, Research Scholar, Dept. of Physical Education, O.U.Hyd
INTRODUCTION
The importance of sport psychology in football or soccer is becoming increasingly well recognized with many professional clubs employing psychologists. Sport psychology is sometimes called mental preparation or training, mind games, or mind over matter. The aim is for the team to play football at peak performance in every match. Sport psychology is no substitute for skills, and it is vital to emphasize the importance of skills, particularly when coaching youth football. Since the main aim of psychological training is to attain peak performance, it will not help much if your peak performance is poor! The first step is to decide what you want to achieve. Do you have a dream that you wish to make a reality? It's important to discover what motivates you, and to write down a mission statement or creed to provide motivation. Motivation: Motivation is an internal energy force that determines all aspects of our behavior, it also impacts on how we think, feel and interact with others. In sport, high motivation is widely accepted as an essential prerequisite in getting athletes to fulfill their potential. Anxiety: Anxiety has long been recognized as a prominent symptom of many psychiatric disorders. It was Freud (1859b) who first suggested that cases with mainly anxiety symptoms should be separated under the mane of anxiety neurosis. SIGINIFICANCE OF THE STUDY: The study is to determine the psychological factors of football and hockey players. Testing the personality of the player may prove beneficial; the coach can have an idea of the differences in personality between players and thus learn how to better handle the issue. Tests have shown that successful footballers possess superior mental and emotional health (less anger, tension and more vigor) than others who may need psychological support/counseling. DATA COLLECTION PROCEDURE The subjects of the study were in the age group between 20 to 28 years, 50 football players and 50 hockey players of Kakatiya University players were taken into consideration. The researcher has collected the data separately for foot ball players and hockey players. The subjects were tested two categories of psychological factors i.e motivation and anxiety. Sinha scale was adopted for opinionnaire which consists of 30 (thirty) statements used to measure motivation. Sport Competition Anxiety Test (SCAT) that was developed by Martens, Vealey, and Burton in 1990. which is consists of 15 questions.
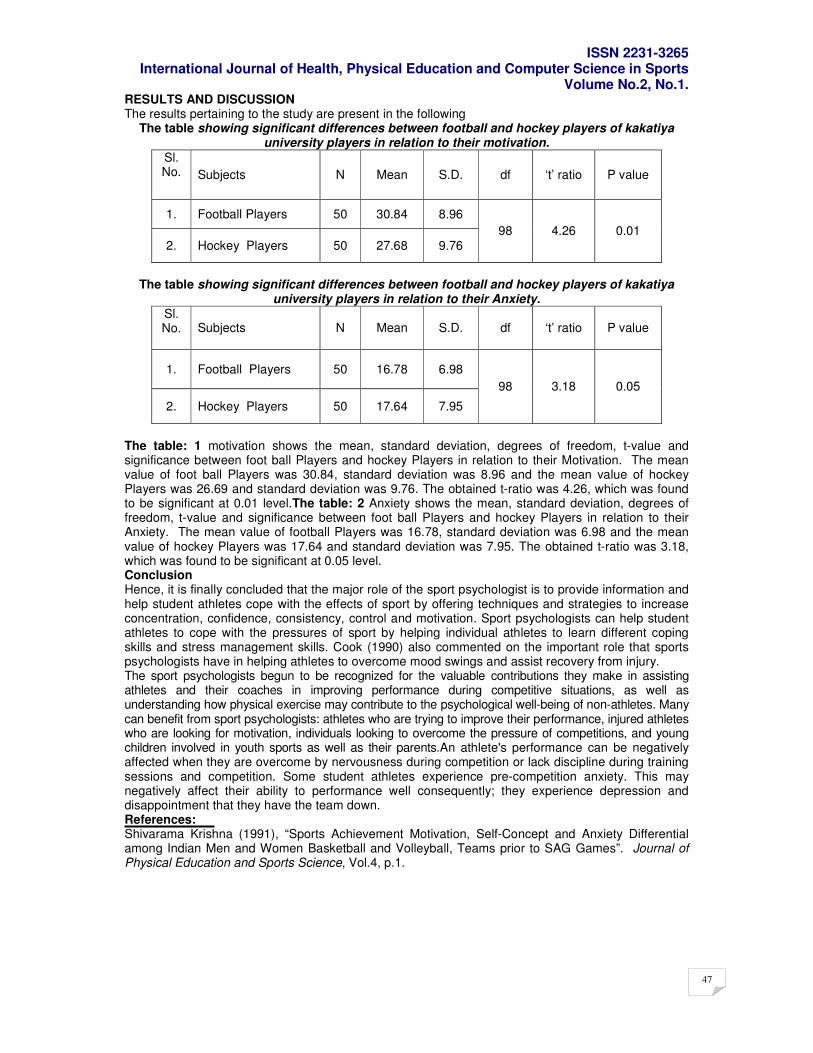
ISSN 2231-3265 International Journal of Health, Physical Education and Computer Science in Sports
Volume No.2, No.1.
47
RESULTS AND DISCUSSION The results pertaining to the study are present in the following
The table showing significant differences between football and hockey players of kakatiya university players in relation to their motivation.
Sl. No. Subjects N Mean S.D. df ‘t’ ratio P value
1. Football Players 50 30.84 8.96
2. Hockey Players 50 27.68 9.76 98 4.26 0.01
The table showing significant differences between football and hockey players of kakatiya
university players in relation to their Anxiety. Sl. No. Subjects N Mean S.D. df ‘t’ ratio P value
1. Football Players 50 16.78 6.98
2. Hockey Players 50 17.64 7.95
98 3.18 0.05
The table: 1 motivation shows the mean, standard deviation, degrees of freedom, t-value and significance between foot ball Players and hockey Players in relation to their Motivation. The mean value of foot ball Players was 30.84, standard deviation was 8.96 and the mean value of hockey Players was 26.69 and standard deviation was 9.76. The obtained t-ratio was 4.26, which was found to be significant at 0.01 level.The table: 2 Anxiety shows the mean, standard deviation, degrees of freedom, t-value and significance between foot ball Players and hockey Players in relation to their Anxiety. The mean value of football Players was 16.78, standard deviation was 6.98 and the mean value of hockey Players was 17.64 and standard deviation was 7.95. The obtained t-ratio was 3.18, which was found to be significant at 0.05 level. Conclusion Hence, it is finally concluded that the major role of the sport psychologist is to provide information and help student athletes cope with the effects of sport by offering techniques and strategies to increase concentration, confidence, consistency, control and motivation. Sport psychologists can help student athletes to cope with the pressures of sport by helping individual athletes to learn different coping skills and stress management skills. Cook (1990) also commented on the important role that sports psychologists have in helping athletes to overcome mood swings and assist recovery from injury. The sport psychologists begun to be recognized for the valuable contributions they make in assisting athletes and their coaches in improving performance during competitive situations, as well as understanding how physical exercise may contribute to the psychological well-being of non-athletes. Many can benefit from sport psychologists: athletes who are trying to improve their performance, injured athletes who are looking for motivation, individuals looking to overcome the pressure of competitions, and young children involved in youth sports as well as their parents.An athlete's performance can be negatively affected when they are overcome by nervousness during competition or lack discipline during training sessions and competition. Some student athletes experience pre-competition anxiety. This may negatively affect their ability to performance well consequently; they experience depression and disappointment that they have the team down. References: Shivarama Krishna (1991), “Sports Achievement Motivation, Self-Concept and Anxiety Differential among Indian Men and Women Basketball and Volleyball, Teams prior to SAG Games”. Journal of Physical Education and Sports Science, Vol.4, p.1.
ISSN 2231-3265 International Journal of Health, Physical Education and Computer Science in Sports
Volume No.2, No.1.
48
pp48-50
The comparison of body composition of Iranian soccer players in different playing positions during competitions season
Attarzadeh Hosseini SR
1, (Ph.D); Soltani H
2, (Ph.D.Research Scholar); Farahneia M
3, (MS); Hojati
Z4(Ph.D. Research Scholar).
1. Faculty of Physical Education and Sport Sciences Department, Ferdowsi University of Mashhad, Mashhad, IRAN. 2. Faculty of Physical Education and Sport Sciences Department, Torbat-e Heydariyeh Branch, Islamic Azad University, Torbat-e Heydariyeh, IRAN. 3. Faculty of Physical Education and Sport Sciences, Ferdowsi University of Mashhad, IRAN. 4. Department of Physical Education and Sport Sciences, Torbat-e Heydariyeh Branch, Islamic Azad University, Torbat-e Heydariyeh ,IRAN Abstract: Introduction: In many sports, the body composition of the individual athlete plays an important role. Changes in body composition have been used as information regarding the athlete's adaptation to different types of training .Aspect such as body composition is of primary importance in success of soccer team. Thus, the aim of this study was to compare body composition of Iranian soccer players in different playing positions during competitions season. Methodology: This was a quasi-experimental research with three experimental groups. In this research 24 players of Pasargad soccer team; defenders (N=8), middles (N=8) and attackers (N=8) were selected randomly as statistical sample. With using In-Body system body composition was measured in the beginning of competition season and after the 15
Th match during competition season.
Finally, using paired sample T Test (t-student) and ANOVA data was analyzed. Findings: Defender, middle and attacker players showed a significant reduction in BMI during competition season (p<0.05). Also, Middle and attacker players showed a significant reduction in body Fat percentage (p<0.05). Discussion and conclusion: Based on the results of performed research, body composition profiles in soccer players changed during competitions season.
key Words: Body composition, Iranian Soccer Players.
Introduction Body composition of the individual athlete plays an important role in many sports. Changes in body composition have been used as information regarding the athlete's adaptation to different types of training (1). Body composition is one of the success factors in soccer (7). In modern football that match season continues for seven or eight months, the main objective is to maintain fitness throughout the match season. A players’ ideal body composition depends on the requirements of their position on the field. For example, midfield players need to have good endurance as they run very long distances each match (often between 12-20km). Defenders need to be strong and powerful with their position generally requiring shorter bursts of sprinting. Methodology The method of this research was quasi-experimental with three experimental groups and pretest and post test. In this study 24 players (8 defenders with age mean of 25.25 years and playing past record of 9.5 years, 8 middle players with age mean of 26 years and playing post record of 9 years and 8 attackers with age mean of 25.38 years and playing post record of 8.6 years) from passargad soccer team attending in Iran football league were selected by use of accessible sampling. According to the health questionnaire all the subjects were healthy and did not have any cardiovascular, pulmonary and skeletal and physical deformities. At first standing height was measured in CMs by use of height meter (fault less then 0.5 CMs). By use of In- body set
1 (fault less then 0.1 kgs) weight and fat percentage were measured. Dividing body
weight by the height squared profile of body mass index(BMI) was measured in terms of KG/M2.
Finally data was analyzed using SPSS. After making sure about natural distribution of data by use of kolmogrov –Smirnov, for comparison of within and between groups changes, paired sample T-test and one way ANOVA and post hoc ISD test were applied respectively and hypotheses were tested at significant level P<0.05.
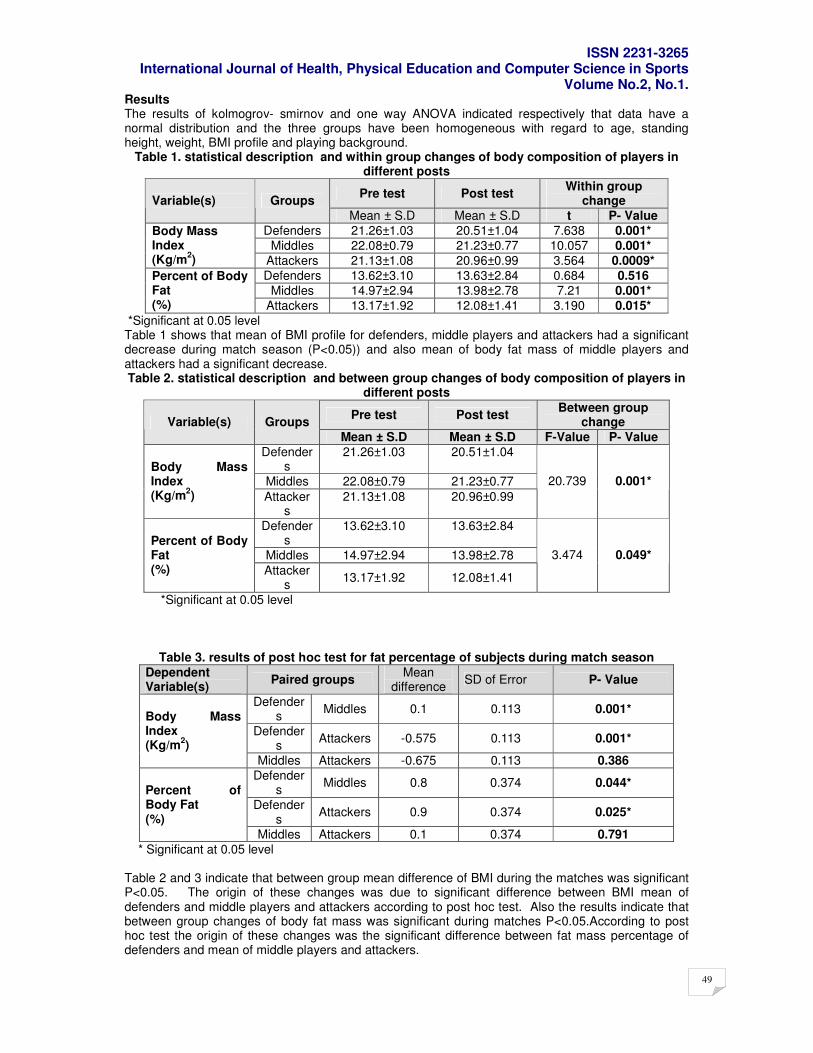
ISSN 2231-3265 International Journal of Health, Physical Education and Computer Science in Sports
Volume No.2, No.1.
49
Results The results of kolmogrov- smirnov and one way ANOVA indicated respectively that data have a normal distribution and the three groups have been homogeneous with regard to age, standing height, weight, BMI profile and playing background.
Table 1. statistical description and within group changes of body composition of players in different posts
Pre test Post test Within group
change Variable(s) Groups
Mean ± S.D Mean ± S.D t P- Value
Defenders 21.26±1.03 20.51±1.04 7.638 0.001*
Middles 22.08±0.79 21.23±0.77 10.057 0.001* Body Mass Index (Kg/m
2) Attackers 21.13±1.08 20.96±0.99 3.564 0.0009*
Defenders 13.62±3.10 13.63±2.84 0.684 0.516
Middles 14.97±2.94 13.98±2.78 7.21 0.001* Percent of Body Fat (%) Attackers 13.17±1.92 12.08±1.41 3.190 0.015*
*Significant at 0.05 level Table 1 shows that mean of BMI profile for defenders, middle players and attackers had a significant decrease during match season (P<0.05)) and also mean of body fat mass of middle players and attackers had a significant decrease. Table 2. statistical description and between group changes of body composition of players in
different posts
*Significant at 0.05 level
Table 3. results of post hoc test for fat percentage of subjects during match season
Dependent Variable(s)
Paired groups Mean
difference SD of Error P- Value
Defenders
Middles 0.1 0.113 0.001*
Defenders
Attackers -0.575 0.113 0.001*
Body Mass Index (Kg/m
2)
Middles Attackers -0.675 0.113 0.386
Defenders
Middles 0.8 0.374 0.044*
Defenders
Attackers 0.9 0.374 0.025*
Percent of Body Fat (%)
Middles Attackers 0.1 0.374 0.791
* Significant at 0.05 level
Table 2 and 3 indicate that between group mean difference of BMI during the matches was significant P<0.05. The origin of these changes was due to significant difference between BMI mean of defenders and middle players and attackers according to post hoc test. Also the results indicate that between group changes of body fat mass was significant during matches P<0.05.According to post hoc test the origin of these changes was the significant difference between fat mass percentage of defenders and mean of middle players and attackers.
Pre test Post test Between group
change Variable(s) Groups
Mean ± S.D Mean ± S.D F-Value P- Value
Defenders
21.26±1.03 20.51±1.04
Middles 22.08±0.79 21.23±0.77 Body Mass Index (Kg/m
2) Attacker
s 21.13±1.08 20.96±0.99
20.739 0.001*
Defenders
13.62±3.10 13.63±2.84
Middles 14.97±2.94 13.98±2.78 Percent of Body Fat (%) Attacker
s 13.17±1.92 12.08±1.41
3.474 0.049*
ISSN 2231-3265 International Journal of Health, Physical Education and Computer Science in Sports
Volume No.2, No.1.
50
Discussion and Conclusion Soccer players need a high level of fitness in order to use their own technical skills. Therefore observation of players’ fitness changes in different posts during match season is of high importance. In this research fat mass of middle players and attackers decreased during match season however only decrease of defenders fat mass wasn’t significant. Since extra fat tissue acts as dead weight in weight bearing activities, increment of fat during playing makes it difficult to move and jump for reaching the ball. The average amount of soccer players’ fat have been reported 8-28 percent in numerous researches. The measured percentage of fat in this research for defenders (13,63%) middle players (13.98%) and attackers (12.08%) in match season was similar to that of former researches (8). Ostwich (2003) found that players have the least amount of fat percentage. At the end of match season in the same research the most decrease in fat percentage was related to training period (5). While the same researcher (Ostwich)) in 2002 and also Zeovanich (2001) found that soccer players lose more fat percentage during the season in comparison to the training period. This may be concerned to heavy match program (9). Casajus (2001) reported a significant decrease in fat percentage of Spain league players during the beginning to middle of season. On the contrary Metex and et.al (2006) did not find significant change in fat percentage of defenders, middle players and attackers during match season. Briefly considering the fact that middle players cover a longer distance as compared with that of players in other posts during the match and also the pressure of work done by attackers increase in direct approach of playing (2) and as there is a direct relation between amount of work (covered distance), energy cost and Vo2max (2,6), so significant decrease of fat percentage of middle players and attackers in this research probably has been due to more work pressure during match. References 1. Andreoli A, Melchiorri G, Brozzi M, Di Marco A, Volpe SL, Garofano P, Di Daniele N, De Lorenzo A. Effect of different sports on body cell mass in highly trained athletes. Acta Diabetol. 2003;40:S122–125. doi: 10.1007/s00592-003-0043-9. [PubMed] [Cross Ref] 2. Bloomfield J, Polman R, Butterly R, O'Donoghue P. Analysis of age, stature, body mass, BMI and quality of elite soccer players from 4 European Leagues. J Sports Med Phys Fitness 2005; 45(1):58-67. 3. Ekblom B . Applied physiology of soccer. Sports Med 1986; 3:50-60. 4. Fiona Sutherland, Sports Dietitian(2008). Australian Rules Football:AFL 5. Heller J, Prochaskal L, Bunc V, dlouha R, Novothy J. Functional capacity in top league football players during competitive period. J Sports Sci 1992; 10, 150. 6. Johnson GO, Nebelsick-Gullett LJ, Thorland WG, Housh TJ .The effect of a competitive season on the body composition of university female athletes. J Sports Med Phys Fitness 1989; 29 (4):314-20. 7. Mehmet Kutlu, Nuri Sofi and Taner Bozkus (2007). Changes in body compositions of elite level amateur and professional soccer players during the competitive season. Journal of Sports Science and Medicine Suppl. 10. http://www.jssm.org 8. Miller TA and et al. Seasonal changes in V O2max among division I A collegiate women soccer players. J Strength Cond Res 2007; 21(1):48–51. 9. Ostojic SM. Changes in body fat content of top-level soccer players. Journal of Sports Science and Medicine 2002; 1: 54-55
ISSN 2231-3265 International Journal of Health, Physical Education and Computer Science in Sports
Volume No.2, No.1.
51
pp51-52
A Comparative Study-Competition in the institution of rural and urban area of Warangal district
Dr.Mohd.Moize Ahmed
Principal University College of Physical Education Kakatiya University,Warangal,A.P.India
A B S T R A C T
Competitions are important to develop to desirable self concept, courage, confidence, requires some daring, determination and some hard work The competitions are essential and most important part of physical education. The study is conducted is trace out the present status of competition in the institutions of rural and urban areas in Warangal District. The technique of survey by questionnaire, using stratified random sampling was adopted for collection of data from various institutions. The data reveals that participation in intra moral competition is higher in rural areas and more events are being conducted in urban areas. No TA / DA facility is available in rural area for extra moral competitions. The attention of the authority is drawn to have special provision in the budget for conducting coaching camp. Arrangements must be made for the payment of TA / DA and balanced diet for the participants.
INTRODUCTION: With the development of science and technology the strategies and techniques in the games and sports have undergone a lot of change, as each nation is competing with other to produce top class athletes to win laurels in international competitions. The competitions are essential and most important part of physical education for satisfying the inner urge of fight, which is present in every student. The competitions provide an opportunity to exhibit skill, abilities and talent of the students. They help in the development of qualities such as cooperation, leadership and true sportsmanship etc., they also help for assessment and evaluation, in term help for advanced coaching and to develop new techniques, and high-tech capabilities among the students. OBJECTIVES OF THE STUDY
1. To find out the details of competitions are being conducted. 2. To compare the program of competition in rural and urban areas. 3. To suggest the measures to be taken up by the Government for desirable standards for the
development of the children through better organization of competition. RESEARCH TOOLS: The technique of survey by questionnaire was adopted to gather relevant data. Stratified random sampling was considered to cover the Government institution, provide aided institutions and private institutions.
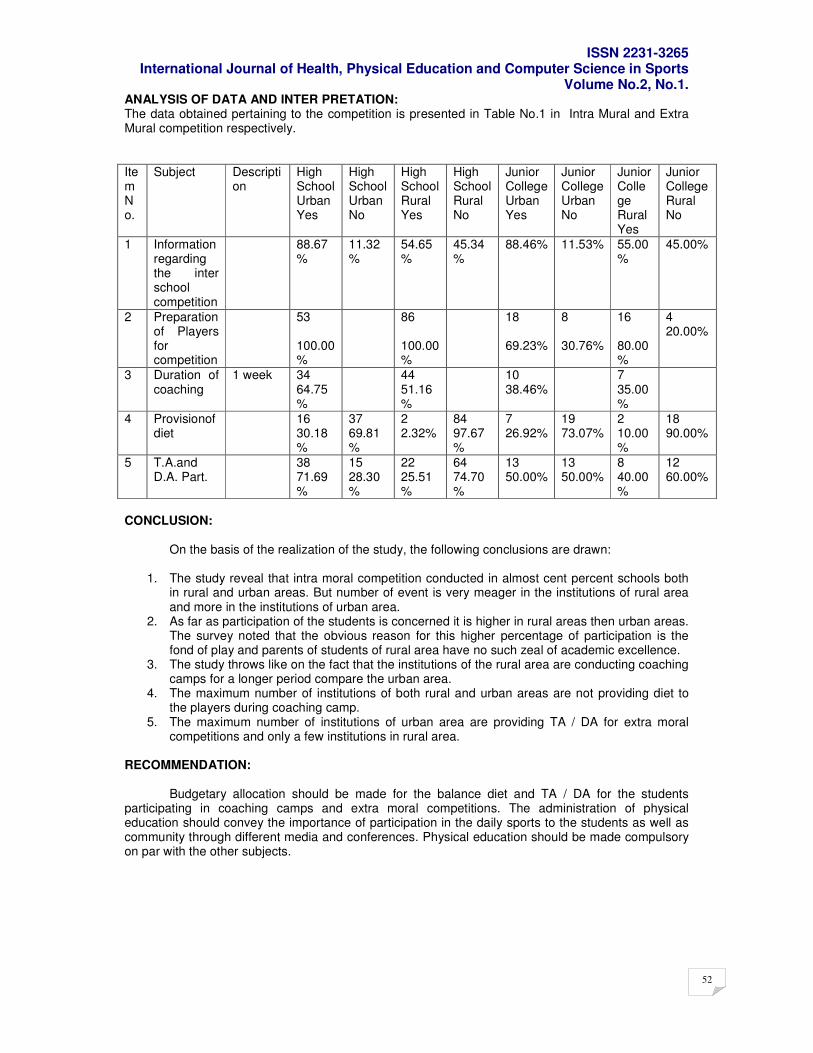
ISSN 2231-3265 International Journal of Health, Physical Education and Computer Science in Sports
Volume No.2, No.1.
52
ANALYSIS OF DATA AND INTER PRETATION: The data obtained pertaining to the competition is presented in Table No.1 in Intra Mural and Extra Mural competition respectively.
Item No.
Subject Description
High School Urban Yes
High School Urban No
High School Rural Yes
High School Rural No
Junior College Urban Yes
Junior College Urban No
Junior College Rural Yes
Junior College Rural No
1 Information regarding the inter school competition
88.67%
11.32%
54.65%
45.34%
88.46% 11.53% 55.00%
45.00%
2 Preparation of Players for competition
53 100.00%
86 100.00%
18 69.23%
8 30.76%
16 80.00%
4 20.00%
3 Duration of coaching
1 week
34 64.75%
44 51.16 %
10 38.46%
7 35.00%
4 Provisionof diet
16 30.18%
37 69.81 %
2 2.32%
84 97.67%
7 26.92%
19 73.07%
2 10.00%
18 90.00%
5 T.A.and D.A. Part.
38 71.69%
15 28.30%
22 25.51%
64 74.70%
13 50.00%
13 50.00%
8 40.00%
12 60.00%
CONCLUSION: On the basis of the realization of the study, the following conclusions are drawn:
1. The study reveal that intra moral competition conducted in almost cent percent schools both in rural and urban areas. But number of event is very meager in the institutions of rural area and more in the institutions of urban area.
2. As far as participation of the students is concerned it is higher in rural areas then urban areas. The survey noted that the obvious reason for this higher percentage of participation is the fond of play and parents of students of rural area have no such zeal of academic excellence.
3. The study throws like on the fact that the institutions of the rural area are conducting coaching camps for a longer period compare the urban area.
4. The maximum number of institutions of both rural and urban areas are not providing diet to the players during coaching camp.
5. The maximum number of institutions of urban area are providing TA / DA for extra moral competitions and only a few institutions in rural area.
RECOMMENDATION: Budgetary allocation should be made for the balance diet and TA / DA for the students participating in coaching camps and extra moral competitions. The administration of physical education should convey the importance of participation in the daily sports to the students as well as community through different media and conferences. Physical education should be made compulsory on par with the other subjects.
ISSN 2231-3265 International Journal of Health, Physical Education and Computer Science in Sports
Volume No.2, No.1.
53
Pp53-55
Effect of sand and land plyometric training on speed and explosive power among volleyball players
K.Kamalakkannan* Dr.Kaukab Azeem** Dr.C.Arumugam***
*Director of Physical Education, Arunai Engineering College, Tiruvannamalai, Tamil nadu, India.
**Lecturer, Physical Education Department, King Fahd University of Petroleum & Minerals, S.A.
***Asst Prof Dept of sports coaching, Tamilnadu Physical Education and Sports University, Chennai,
India.
ABSTRACT
The purpose of this study was to compare the effects of 2 different training protocols- Sand and Land Plyometric training on vertical jump and speed among volleyball players. Thirty- subjects were randomly assigned between 18 and 21 years of age volunteered as participants to 1 of 3 groups: Sand Plyometric training group (n = 10), Land Plyometric training group (n = 10), and control group (n = 10). 12 weeks of training, 3 days a week was employed on the subjects and Pre & post test on vertical jump and speed was administered. Data were analyzed by analysis of co-variance (ANCOVA). Schiff’s test was used as a post hoc test to determine which of the paired mean differ significantly. Results showed that all training treatments elicited significant (p < 0.05) improvement in all tested variables. However, the Sand Plyometric training group produced improvements in vertical jump performance and leg strength that were significantly greater performance in compare with the land and control group. This study provides support for the use of a traditional and plyometric drills to improve vertical jumping ability and explosive performance in general.
Key words: Plyometric training, Speed, and Explosive power.
Introduction
Plyometric exercise has been in practice for many years, (EDWIN RIMMER, 2000) to develop the explosive power of athletes. It is a type of training that develops the ability of muscles to produce force at high speeds (produce power) in dynamic movements; these movements involve a stretch of the muscle immediately followed by an explosive contraction of the muscle. This pattern of muscle contraction is known as the stretch-shorten cycle (SSC) (NORMAN 1979.). Plyometric exercises include vertical jumps, during which the athlete jumps as high as possible ‘‘on the spot,’’ and bounds, during which the athlete leaps as high and as far as possible, thus moving the body in the horizontal and vertical planes. It is generally accepted that the more specific training exercises to a competitive movement, the greater the transfer of the training effect to performance (DELECLUSE, 1995). Athletes such as sprinters, who require power for moving in the horizontal plane, engage in bounding plyometric exercises, whereas athletes such as high jumpers and volleyball players, who require power to be exerted in the vertical direction, train using vertical jumping exercises (CHU, 1992). Plyometric is a means of encouraging the muscle to achieve maximal force rapidly and therefore serving to increase explosive-reactive power through a range of motion and is a popular training approach (Lockwood, 2004).
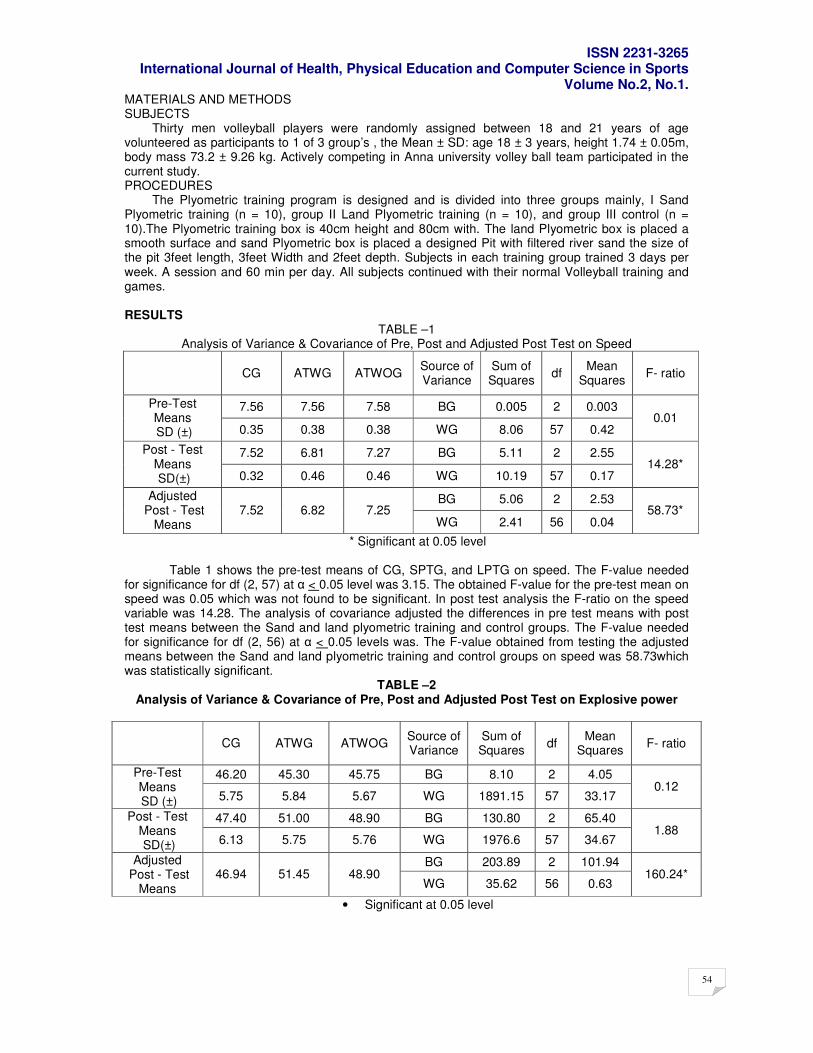
ISSN 2231-3265 International Journal of Health, Physical Education and Computer Science in Sports
Volume No.2, No.1.
54
MATERIALS AND METHODS SUBJECTS Thirty men volleyball players were randomly assigned between 18 and 21 years of age volunteered as participants to 1 of 3 group’s , the Mean ± SD: age 18 ± 3 years, height 1.74 ± 0.05m, body mass 73.2 ± 9.26 kg. Actively competing in Anna university volley ball team participated in the current study. PROCEDURES The Plyometric training program is designed and is divided into three groups mainly, I Sand Plyometric training (n = 10), group II Land Plyometric training (n = 10), and group III control (n = 10).The Plyometric training box is 40cm height and 80cm with. The land Plyometric box is placed a smooth surface and sand Plyometric box is placed a designed Pit with filtered river sand the size of the pit 3feet length, 3feet Width and 2feet depth. Subjects in each training group trained 3 days per week. A session and 60 min per day. All subjects continued with their normal Volleyball training and games. RESULTS
TABLE –1 Analysis of Variance & Covariance of Pre, Post and Adjusted Post Test on Speed
CG
ATWG ATWOG Source of Variance
Sum of Squares
df Mean
Squares F- ratio
7.56 7.56 7.58 BG 0.005 2 0.003 Pre-Test Means SD (±) 0.35 0.38 0.38 WG 8.06 57 0.42
0.01
7.52 6.81 7.27 BG 5.11 2 2.55 Post - Test Means SD(±) 0.32 0.46 0.46 WG 10.19 57 0.17
14.28*
BG 5.06 2 2.53 Adjusted Post - Test
Means 7.52 6.82 7.25
WG 2.41 56 0.04 58.73*
* Significant at 0.05 level
Table 1 shows the pre-test means of CG, SPTG, and LPTG on speed. The F-value needed for significance for df (2, 57) at α < 0.05 level was 3.15. The obtained F-value for the pre-test mean on speed was 0.05 which was not found to be significant. In post test analysis the F-ratio on the speed variable was 14.28. The analysis of covariance adjusted the differences in pre test means with post test means between the Sand and land plyometric training and control groups. The F-value needed for significance for df (2, 56) at α < 0.05 levels was. The F-value obtained from testing the adjusted means between the Sand and land plyometric training and control groups on speed was 58.73which was statistically significant.
TABLE –2 Analysis of Variance & Covariance of Pre, Post and Adjusted Post Test on Explosive power
CG
ATWG ATWOG Source of Variance
Sum of Squares
df Mean
Squares F- ratio
46.20 45.30 45.75 BG 8.10 2 4.05 Pre-Test Means SD (±) 5.75 5.84 5.67 WG 1891.15 57 33.17
0.12
47.40 51.00 48.90 BG 130.80 2 65.40 Post - Test Means SD(±) 6.13 5.75 5.76 WG 1976.6 57 34.67
1.88
BG 203.89 2 101.94 Adjusted Post - Test
Means 46.94 51.45 48.90
WG 35.62 56 0.63 160.24*
• Significant at 0.05 level
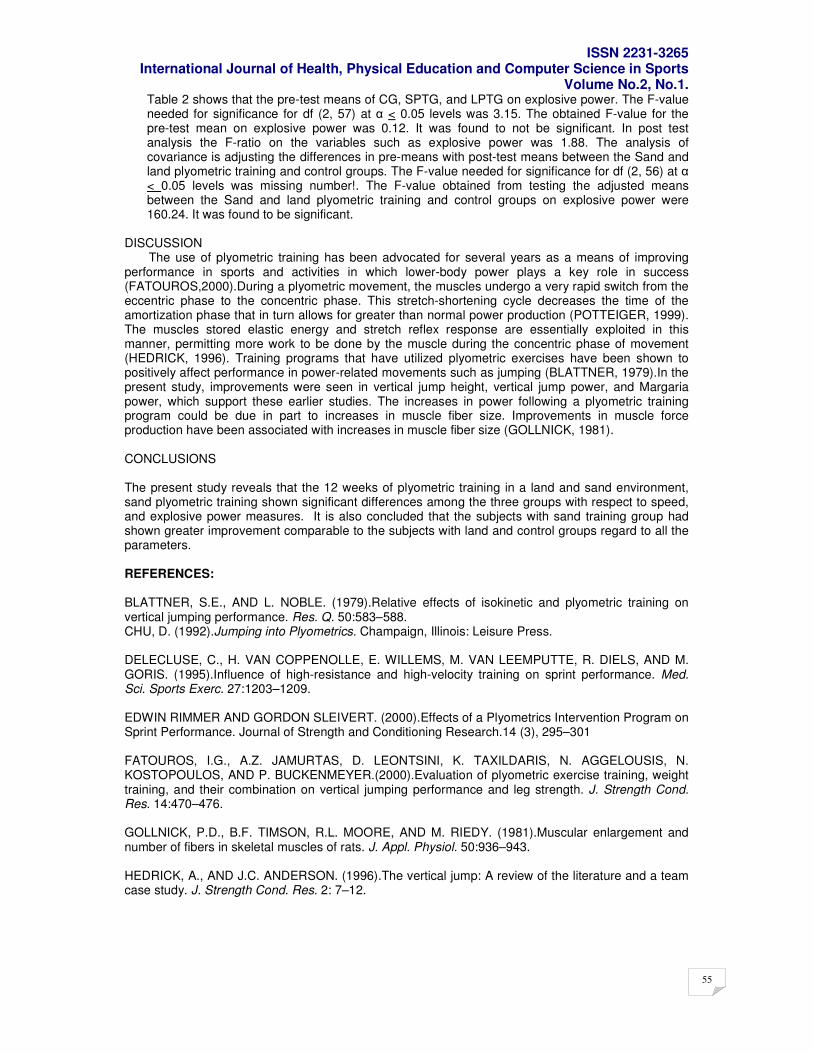
ISSN 2231-3265 International Journal of Health, Physical Education and Computer Science in Sports
Volume No.2, No.1.
55
Table 2 shows that the pre-test means of CG, SPTG, and LPTG on explosive power. The F-value needed for significance for df (2, 57) at α < 0.05 levels was 3.15. The obtained F-value for the pre-test mean on explosive power was 0.12. It was found to not be significant. In post test analysis the F-ratio on the variables such as explosive power was 1.88. The analysis of covariance is adjusting the differences in pre-means with post-test means between the Sand and land plyometric training and control groups. The F-value needed for significance for df (2, 56) at α < 0.05 levels was missing number!. The F-value obtained from testing the adjusted means between the Sand and land plyometric training and control groups on explosive power were 160.24. It was found to be significant.
DISCUSSION The use of plyometric training has been advocated for several years as a means of improving performance in sports and activities in which lower-body power plays a key role in success (FATOUROS,2000).During a plyometric movement, the muscles undergo a very rapid switch from the eccentric phase to the concentric phase. This stretch-shortening cycle decreases the time of the amortization phase that in turn allows for greater than normal power production (POTTEIGER, 1999). The muscles stored elastic energy and stretch reflex response are essentially exploited in this manner, permitting more work to be done by the muscle during the concentric phase of movement (HEDRICK, 1996). Training programs that have utilized plyometric exercises have been shown to positively affect performance in power-related movements such as jumping (BLATTNER, 1979).In the present study, improvements were seen in vertical jump height, vertical jump power, and Margaria power, which support these earlier studies. The increases in power following a plyometric training program could be due in part to increases in muscle fiber size. Improvements in muscle force production have been associated with increases in muscle fiber size (GOLLNICK, 1981). CONCLUSIONS
The present study reveals that the 12 weeks of plyometric training in a land and sand environment, sand plyometric training shown significant differences among the three groups with respect to speed, and explosive power measures. It is also concluded that the subjects with sand training group had shown greater improvement comparable to the subjects with land and control groups regard to all the parameters. REFERENCES: BLATTNER, S.E., AND L. NOBLE. (1979).Relative effects of isokinetic and plyometric training on vertical jumping performance. Res. Q. 50:583–588. CHU, D. (1992).Jumping into Plyometrics. Champaign, Illinois: Leisure Press. DELECLUSE, C., H. VAN COPPENOLLE, E. WILLEMS, M. VAN LEEMPUTTE, R. DIELS, AND M. GORIS. (1995).Influence of high-resistance and high-velocity training on sprint performance. Med. Sci. Sports Exerc. 27:1203–1209. EDWIN RIMMER AND GORDON SLEIVERT. (2000).Effects of a Plyometrics Intervention Program on Sprint Performance. Journal of Strength and Conditioning Research.14 (3), 295–301 FATOUROS, I.G., A.Z. JAMURTAS, D. LEONTSINI, K. TAXILDARIS, N. AGGELOUSIS, N. KOSTOPOULOS, AND P. BUCKENMEYER.(2000).Evaluation of plyometric exercise training, weight training, and their combination on vertical jumping performance and leg strength. J. Strength Cond. Res. 14:470–476. GOLLNICK, P.D., B.F. TIMSON, R.L. MOORE, AND M. RIEDY. (1981).Muscular enlargement and number of fibers in skeletal muscles of rats. J. Appl. Physiol. 50:936–943. HEDRICK, A., AND J.C. ANDERSON. (1996).The vertical jump: A review of the literature and a team case study. J. Strength Cond. Res. 2: 7–12.
ISSN 2231-3265 International Journal of Health, Physical Education and Computer Science in Sports
Volume No.2, No.1.
56
pp56-58
Indian society and sports culture: study of current trends in sports management in sociological perspective
Dr. Shafioddin S.Shaikh,
Vice Principal & HOD of Physical Education, NKSPT’s Arts, Science and Commerce College,
Badnapur (Dist: Jalna) (Maharashtra India)
I. Introduction Physical education and sports are related to Indian society since bye gone ages. References of sports of physical education and health care appear in Vedas as well as in epics like Ramayana and Mahabharata. Epics contained interesting information about wrestling and other physical activities (1) Further it has been observed that even in the period of Puranas, interesting information is available on the development of sports and physical education. It has been pointed that “Lord Krishna had given lessons to Somnath regarding the art of boxing and it was further developed in the text Malla Puran.” (2) Even in the medieval period, sports activities were correlated with festivals such as Sankranti, Holi and Deepwali. (3) Thus it seems sports and physical education was related to Indian society from ancient to medieval as swell as modern period. In the British period YMCA Physical Education college was established and there was beginning of systematic physical education on the western lines. (4) Further Deepak Jain has observed that “in India Nalanda and Taxila were important seats of learning where physical education in Yoga and Martial arts was imparted.” (5) On this background it would be interesting to study how Indian society has developed its own sports management perspective in the historical course of time. The sports management in India has a legacy of rich tradition having deeply rooted in the ancient past. There is need to link this glorious past and challenging future in the process of development of sports culture in India. The present paper is an exploration in sociological perspective. In the next few pages an attempt has been made to present current trends in Indian sports world in nutshell. II. Sports Management in India: The present paper has tried to correlate the sports management approach towards Indian sports activities. Sports management has been defined as a system of managing resources, manpower and activities for smooth conducting of sports events. Dharam Singh has rightly observed that “Management is essential in physical education because physical education like -2- any other essentially activity curriculum, needs a carefully drawn set of principles as guides to its development. “(6) These principles help to manage activities and resources based on systematic lines. Deepak Jain has observed that “Any department that is to functioning adequately must have sound, well established administrative policies, or guiding rules, as a basis on which to operate.” (7) Sports management is not exception to this. Sports management must be based on sound policies and procedure. It is true that “Policies, unlike objectives, usually indicate the method of approach or means of procedure rather than the point to be gained.” (8) It is interesting to note that sports management requires policy, procedure as well as clear objectives. The planning requires short term, mid term and long term goals. It has been observed that “It is not enough to struggle along solving problems as they arise. Conditions may make it possible to go through the motions of conducting a department by this resort to lame expedients, but sound administration demands a positive, planned procedure rather than a floundering makeshift.” (10)
III. Sociology of sports: India has to develop its own sports culture based on its tradition and social settings. About sociology of sports it has been observed that “Sociology is like the other social sciences in its application of the scientific method to the study of human behavior.” (11) In order to understand collective social behavior of Indian people towards sports we have to adopt sociological perspective. It has been
ISSN 2231-3265 International Journal of Health, Physical Education and Computer Science in Sports
Volume No.2, No.1.
57
observed that “Socialization means the process by which individuals learn the culture and expectations of society so that they may function in it.” (12) It would be interesting how the process of sports socialization has been accelerated in India. Further it is interesting that today there is large response to western games in India, such as Cricket and Hockey. But Indian games have been neglected on large scale. How this approach has been developed in post independence period can be examined here. The sports objectives show that physical education must help to correct the system. It has been observed that “Physical education can help for the rectification of defects and deformities, if there are any.” (13) This study can help to overcome draw backs in Indian sports culture and will aim to rectify it. Changing attitudes and new interest have brought to light new facts base don sociology of sports. (14) On this background it would be interesting to study barriers and remedies in developing sports culture in India. -3- IV. Barriers in sports culture Sports culture is a way of life or outlook of the society in a nation, which evolves in due course of time. About culture it has been stated that “Culture is the system of values and meanings shared by a group or society.” (15) There are following barriers in the development of sports culture in India.
(1) Lack of constant policy: Sports policy in India is often changing due to changes in this policy
there is no continuity in action. The sports policies are often in darkness and they are
uncertain. To bring a change in the system
(2) Lack of discipline: In India sports events are not successful due to lack of proper discipline. It
has been observed that “such scientific discipline can provide distinctive perspective on
sports.” (16) Indian efforts have failed to bring discipline in sports authorities.
(3) Lack of planning: Management of big sports events require proper planning, but Indian efforts
failed in organizing Commonwealth Games in 2011. About planning Deepak Jain has
observed that “It may be necessary from time to time to modify or even replace established
policies, but there will be little need of this if the supporting facts for each policy are at hand
before it is adopted.” (17) India should develop advanced policies for planning its sports
resources.
(4) Lack of institutional support: In India sports institutions have not been developed as social
institutions. They are functioning merely on the basis of material objectives. It has been
observed that social institutions mean “an interrelated system of social rules and norms
organized about the satisfaction of an important social need or function.” (18) In India there
are many organizations of each game, but except Cricket no other organizations have been
properly institutionalized.
(5) Lack of resources: For sports management financial as well as manpower resources are
required. About Human resources in sports Hannah Arendt has observed that “sports
philosophy must explain broad characters of play, work and leisure and suggest that the most
active life of all might not ;involve the motion of ;the body but the play of ;the ;mind.” (19) In
India we have failed to involve minds of people in different games except Cricket
-4-
V. Remedies: The following remedies can be suggested for improving sports culture in India.
(A) India requires a sound sports policy to improve middle tally on international level. If India has
to become super power in 20-20, India should not neglect sports achievements. Jain Deepak
has observed that all the components in sports authority should know the policies which can
serve as guide.(20)
(B) India requires stern discipline in its sports administration. Every effort should be made to
streamline sports agencies and sports authorities must be sensitize about their
responsibilities. Our system should just to people and just to educational institutions and just
to youth sportsmen (21) and it should refrain from making differences in sportsmen and must
focus on excellence.
ISSN 2231-3265 International Journal of Health, Physical Education and Computer Science in Sports
Volume No.2, No.1.
58
(C) India should prepare program of action and road map for future development in 20-20 to
cross gold medal tally beyond 100. This can be possible if proper steps are undertaken in
planned manner. It has been observed that “There should no confusion about the relation of
principle to practice.” (22)
(D) Sports authority of India must develop strong infrastructures and must launched new
campaigns in sports talent search.
(E) India should develop corpus fund to support sports activities and should not depend on MNCs
for organization of sports events like IPL. Over dependence on private business can bring
difficulties in launching the sports mission.
VI. Current trends: In India sports is marching towards developing Billion aspirations. One Dhoni, one Tendulkar cannot bring change in sports culture. We require many Limbarams, and many Usha to change profile of our athletes. At present there are three major trends prevailing in Indian sports culture.
(i) We have become more stereotyped and we lack identity in different games. We have to
create new faces for changing our attitude. There should not be any confusion in our
sports policies.
(ii) Our efforts are only related to limited span of activities and we do not have a continuous
sports resource planning.
-5-
(iii) Technology packages for bringing change in our traditional system. It is true that “The system
should provide positive and creative environment.” (23) By doing so we can involve both
male and female equally in our sports culture. Woman in sports is neglected in India and
requires special treatment. Female involvement in sports can bring a new change in the
sports culture. (24)
VII: Summary: Thus, in this paper the relationship between Indian society and sports culture has been examined in sociological perspective. Sports Management in India can be improved if proper planning is made in a systematic manner. A totally new outlook is required for bringing a new outlook in the field of sports. It would be interesting to study all these aspects in a new angle. Sports culture should be our mission and we can soften our efforts if we are able to achieve excellence both in Indian as well as foreign games. The study of current trends has brought forth new issues and new problems. Our entire efforts should be to develop proper manpower, proper policies and proper infrastructures to bring change in our present stereotyped system. Our sports environment can bring excellence if we follow findings based on this paper sincerely. Thus a new white paper new policy document is required to bring a total change in our sports culture, which can bring a new dawn of awakening in the future. ************************ References:
1. Jade S.A. “History of Physical Education”, Malti Publications, Kolhapur, 1993, p-90
2. Ibid.,p-96
3. Ibid., p-99
4. Ibid., p-101
ISSN 2231-3265 International Journal of Health, Physical Education and Computer Science in Sports
Volume No.2, No.1.
59
pp59-61
A study on the effect of eleven week conditioning and four week deconditioning program on body composition and cardiorespiratory responses of female students
Dr. Y. Kishore,
Principal, Dept. of Physical Education Nagarjuna University, Guntur. Prof.Syed Ibrahim,
Dept. of Physical Education, King Fahd University,Saudi Arabia
INTRODUCTION Body composition is one of the important physical fitness components which affect the performance of the athletes in competitions. Hence, modern research in the field of physical education and sports has shown interest to find out the body composition of the athletes .It is a fact that the body composition changes as the physical activity changes and it is essential for a coach or a physical educator to pay attention to body composition in order to schedule a training program for improving one’s performance. This apart, it also helps to assess the intensity of training program. Body composition as it is known constitutes the body parts and is concerned with the obesity of an individual as it divides the total body weight into two components: lean body weight which is the muscle, bone and vital organs and the fat body weight. The lean body weight serves as an active energy resource, whereas the fats cells do not manufacture ATP, but their primary purpose is to store lipids. The relative degree of fat- free body weight is not only valuable from the health point of view but also an important factor contributing to higher levels of performance in physical activities where the total body weight must be moved. The study (Wilson, 2011) confirms the above statement. In addition, studies have shown that high percentage of body fat not only serves as a dead weight, but also it lessens the relative ability to supply oxygen to the working muscles, thus reducing one’s cardio vascular endurance (Wong, 2004). It is a common observation that regular physical activity or the lack of activity can alter body composition. There are various studies (Katch, 2003: Blake et al., 2000; Slobodan, 2002) which have demonstrated that fat free body weight to fat weight ratio increases during periods of physical training. Also, results of several researchers (Liszka, 2005;Wisloff, et al., 2005,; Pascal, et al., 2005; Thompson, et al., 2006) on the body composition changes during various types of physical training programs, have shown the shift in the fat free weight and fat weight ratio that tends to increase as the activity level increases. The main purpose of the study was to find out the effect of eleven weeks’ conditioning program on body composition and cardio respiratory response and also to find out the effect of four weeks’ deconditioning on body composition and cardio respiratory response.
METHODOLOGY The subjects for the study were twenty female students undergoing the Bachelors’ degree in Physical Education at Hyderabad and were residing in the Hostel. The selected subjects mean age ranged between 23.45 and 20.31 years. Skin fold caliper was used to measure the assessment of the body fat on two sites i.e. triceps and iliac crest to the nearest millimeter. Body weight was recorded in kilograms. Cooper’s 12 minute run and walk test was administered to assess the cardio respiratory response. Data for this test was recorded by the total distance covered in meters by the subjects. A pre test was conducted for all the subjects for the above test items and the test commenced just the beginning of the course. Conditioning program was administered to the subjects for a period of 45 minutes per day, six days a week for 11 weeks. A post test was conducted after the completion of the training program on all the measurements. After the post test, four weeks of de-training was scheduled and at the end all the measurements were recorded for the subjects again. The variables which were selected for body composition were Body Density (BD), Percent body fat (% fat), Total body weight of fat (T.W.F.) and Lean body weight (L.B.M.). Body density was calculated by using Sloan & Wier nomogram and percent fat was calculated by the nomagram of Keys & Brozek, 1963. Mean, Standard deviation and‘t’ test were the statistical tools which were used for the analysis of the data.
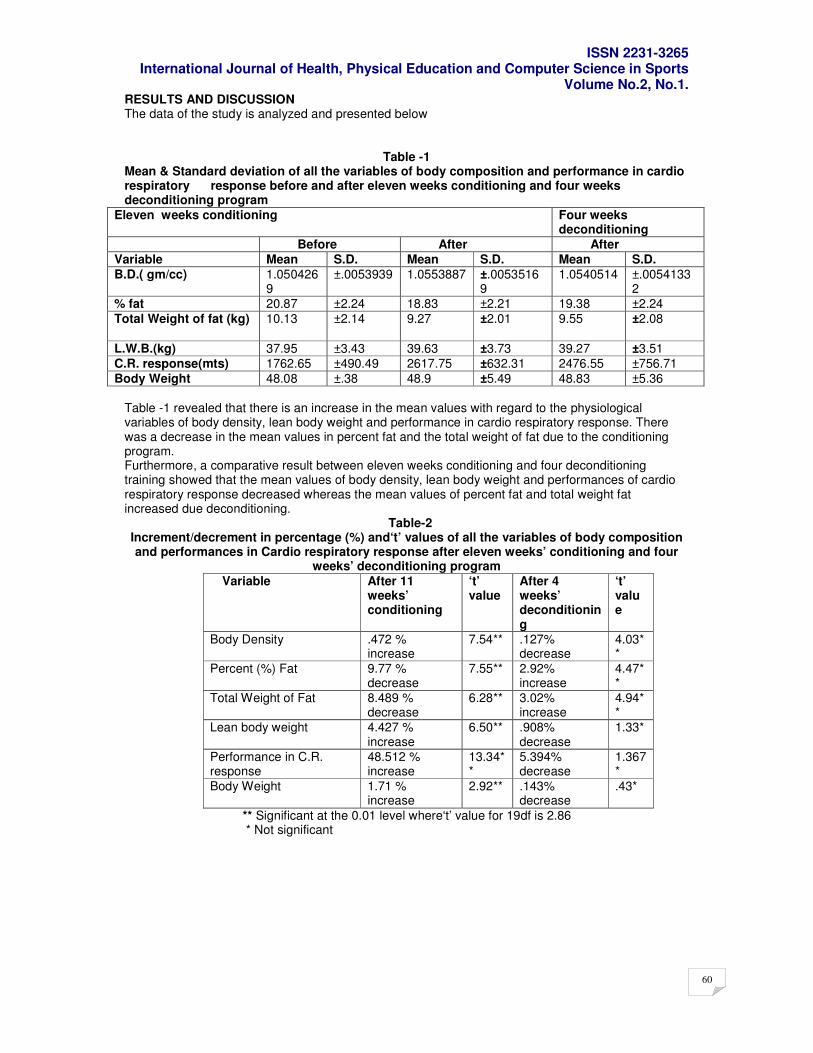
ISSN 2231-3265 International Journal of Health, Physical Education and Computer Science in Sports
Volume No.2, No.1.
60
RESULTS AND DISCUSSION The data of the study is analyzed and presented below
Table -1 Mean & Standard deviation of all the variables of body composition and performance in cardio respiratory response before and after eleven weeks conditioning and four weeks deconditioning program
Eleven weeks conditioning Four weeks deconditioning
Before After After
Variable Mean S.D. Mean S.D. Mean S.D.
B.D.( gm/cc) 1.0504269
±.0053939 1.0553887 ±.00535169
1.0540514 ±.00541332
% fat 20.87 ±2.24 18.83 ±2.21 19.38 ±2.24
Total Weight of fat (kg)
10.13 ±2.14 9.27 ±2.01 9.55 ±2.08
L.W.B.(kg) 37.95 ±3.43 39.63 ±3.73 39.27 ±3.51
C.R. response(mts) 1762.65 ±490.49 2617.75 ±632.31 2476.55 ±756.71
Body Weight 48.08 ±.38 48.9 ±5.49 48.83 ±5.36
Table -1 revealed that there is an increase in the mean values with regard to the physiological variables of body density, lean body weight and performance in cardio respiratory response. There was a decrease in the mean values in percent fat and the total weight of fat due to the conditioning program. Furthermore, a comparative result between eleven weeks conditioning and four deconditioning training showed that the mean values of body density, lean body weight and performances of cardio respiratory response decreased whereas the mean values of percent fat and total weight fat increased due deconditioning. Table-2 Increment/decrement in percentage (%) and‘t’ values of all the variables of body composition and performances in Cardio respiratory response after eleven weeks’ conditioning and four
weeks’ deconditioning program
Variable After 11 weeks’ conditioning
‘t’ value
After 4 weeks’ deconditioning
‘t’ value
Body Density .472 % increase
7.54** .127% decrease
4.03**
Percent (%) Fat 9.77 % decrease
7.55** 2.92% increase
4.47**
Total Weight of Fat 8.489 % decrease
6.28** 3.02% increase
4.94**
Lean body weight 4.427 % increase
6.50** .908% decrease
1.33*
Performance in C.R. response
48.512 % increase
13.34**
5.394% decrease
1.367*
Body Weight 1.71 % increase
2.92** .143% decrease
.43*
** Significant at the 0.01 level where‘t’ value for 19df is 2.86 * Not significant
ISSN 2231-3265 International Journal of Health, Physical Education and Computer Science in Sports
Volume No.2, No.1.
61
In Table -2 it is found that after eleven weeks’ of conditioning there is an increase in the percentage
of body density, lean body weight, performance in cardio respiratory response and body weight and
all these variables are having a significant increase at the 0.01 level. Also there is a decrement in the
percentage fat and total weight of fat but the increment of body weight may be due to increment in
muscle girth and uncontrolled diet.
Subsequently, after 4 weeks’ of deconditioning the data analyzed showed that body density, lean
body weight, performance in cardio respiratory response and body weight decreased. The decrement
in body weight may be due to the non availability of sufficient diet for subjects in their homes. On the
other hand there was increment in percent of fat and total weight of fat which was insignifant at 0.01
level. An interesting feature of the findings of the study was an insignificant negative correlation (-.39)
between the percent fat and performance in cardio respiratory response. The above finding was to
some extent related to the study of (Christopher et al., 2007; Poirier et al., 2006; ACSM, 2009).
CONCLUSIONS Within the limitations of the present study the following conclusions are drawn:
1) Physical Activity if undertaken regularly will have a positive effect and may change radically
one’s body composition and improve performance.
2) The body composition which had changed after indulging in conditioning may be reverted
back due to inactivity.
3) The training intensity within this conditioning period proved justified.
References American College of Sports Medicine. American College of Sports Medicine Position Stand on the appropriate physical activity intervention strategies for weight loss and prevention of weight regain for adults. (2009). Med Sci Sports Exerc. 41:459-71
Blake A, Miller WC, Brown DA. (2000). Adiposity does not hinder the fitness response to exercise training in obese women. J Sports Med Phys Fitness. 40:170-7.
Christopher L. Gentile, Jeb S. Orr, Brenda M. Davy, and Kevin P. Davy (2007). Cardio respiratory Fitness Influences the Blood Pressure Response to Experimental Weight Gain. Obesity. 15, 3005–3012.
Katch, Frank. I (2003).Pre and Post test changes in the factors that influence computed body density changes, Research Quarterly, 42: 280.
Liszka, H. A., Mainous, A. G., 3rd, King, D. E., Everett, C. J., Egan, B. M. (2005). Pre hypertension and cardiovascular morbidity. Ann Fam Med. 3: 294–249.
Pascal, L.R. (2005). Changes in body composition of soldiers during paratrooper training. United States Army Medical research Nutrition Laboratory Report, Report No. 450. Poirier, P., Giles, T. D., Bray, G. A., et al (2006) Obesity and cardiovascular disease: pathophysiology, evaluation, and effect of weight loss: an update of the 1997 American Heart Association Scientific Statement on Obesity and Heart Disease from the Obesity Committee of the Council on Nutrition, Physical Activity, and Metabolism. Circulation. 113: 898–918.
Slobodan J. (2002).Muscle strength testing: Use of normalization for body size. Sports Med. 32:615-3
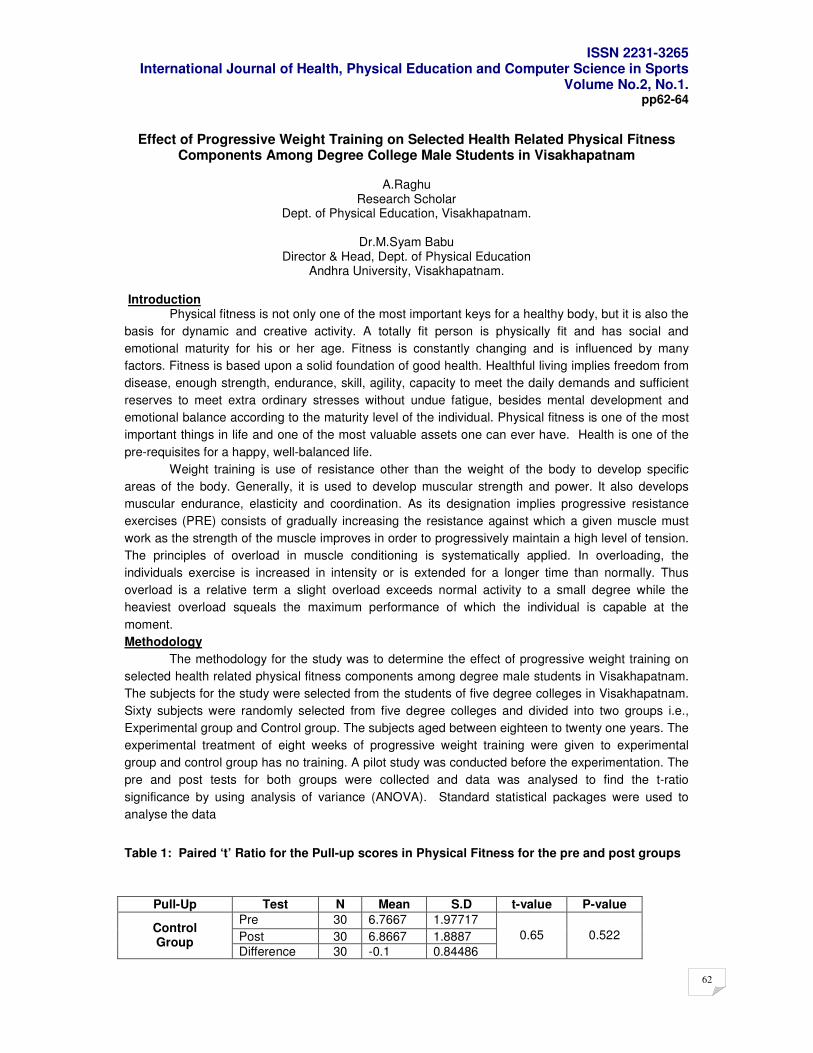
ISSN 2231-3265 International Journal of Health, Physical Education and Computer Science in Sports
Volume No.2, No.1.
62
pp62-64
Effect of Progressive Weight Training on Selected Health Related Physical Fitness Components Among Degree College Male Students in Visakhapatnam
A.Raghu
Research Scholar Dept. of Physical Education, Visakhapatnam.
Dr.M.Syam Babu
Director & Head, Dept. of Physical Education Andhra University, Visakhapatnam.
Introduction Physical fitness is not only one of the most important keys for a healthy body, but it is also the
basis for dynamic and creative activity. A totally fit person is physically fit and has social and
emotional maturity for his or her age. Fitness is constantly changing and is influenced by many
factors. Fitness is based upon a solid foundation of good health. Healthful living implies freedom from
disease, enough strength, endurance, skill, agility, capacity to meet the daily demands and sufficient
reserves to meet extra ordinary stresses without undue fatigue, besides mental development and
emotional balance according to the maturity level of the individual. Physical fitness is one of the most
important things in life and one of the most valuable assets one can ever have. Health is one of the
pre-requisites for a happy, well-balanced life.
Weight training is use of resistance other than the weight of the body to develop specific
areas of the body. Generally, it is used to develop muscular strength and power. It also develops
muscular endurance, elasticity and coordination. As its designation implies progressive resistance
exercises (PRE) consists of gradually increasing the resistance against which a given muscle must
work as the strength of the muscle improves in order to progressively maintain a high level of tension.
The principles of overload in muscle conditioning is systematically applied. In overloading, the
individuals exercise is increased in intensity or is extended for a longer time than normally. Thus
overload is a relative term a slight overload exceeds normal activity to a small degree while the
heaviest overload squeals the maximum performance of which the individual is capable at the
moment.
Methodology
The methodology for the study was to determine the effect of progressive weight training on
selected health related physical fitness components among degree male students in Visakhapatnam.
The subjects for the study were selected from the students of five degree colleges in Visakhapatnam.
Sixty subjects were randomly selected from five degree colleges and divided into two groups i.e.,
Experimental group and Control group. The subjects aged between eighteen to twenty one years. The
experimental treatment of eight weeks of progressive weight training were given to experimental
group and control group has no training. A pilot study was conducted before the experimentation. The
pre and post tests for both groups were collected and data was analysed to find the t-ratio
significance by using analysis of variance (ANOVA). Standard statistical packages were used to
analyse the data
Table 1: Paired ‘t’ Ratio for the Pull-up scores in Physical Fitness for the pre and post groups
Pull-Up Test N Mean S.D t-value P-value
Pre 30 6.7667 1.97717
Post 30 6.8667 1.8887 Control Group
Difference 30 -0.1 0.84486
0.65 0.522
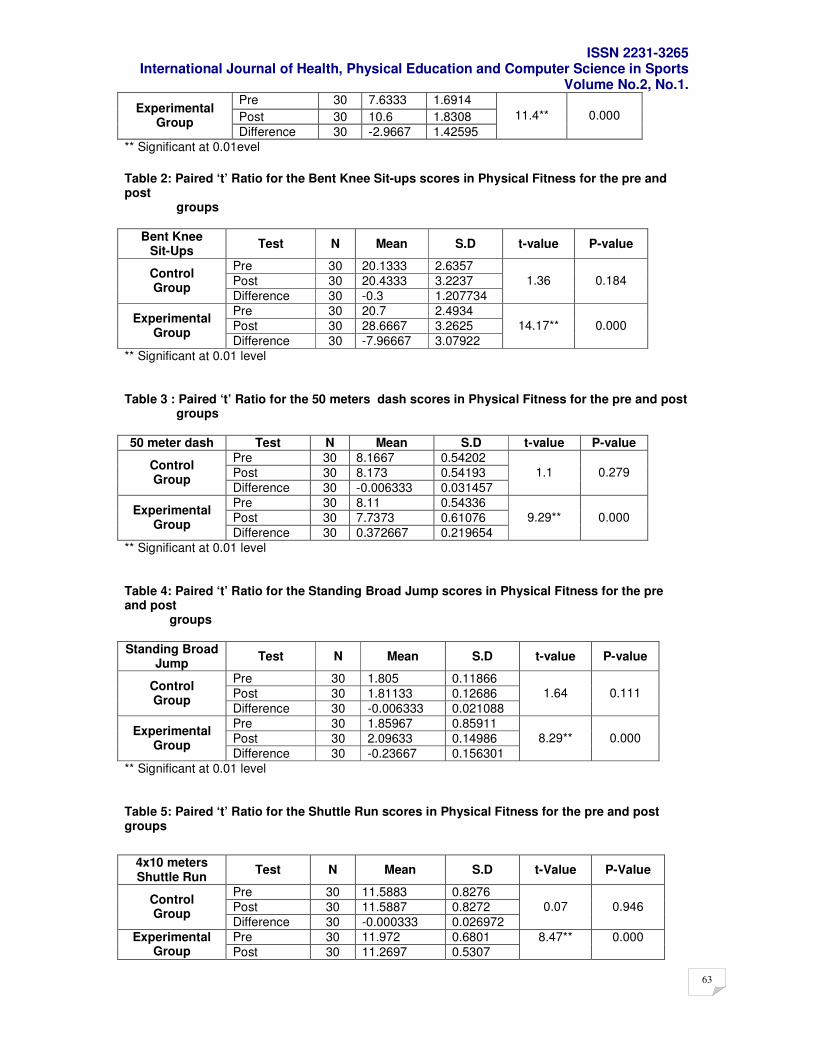
ISSN 2231-3265 International Journal of Health, Physical Education and Computer Science in Sports
Volume No.2, No.1.
63
Pre 30 7.6333 1.6914
Post 30 10.6 1.8308 Experimental
Group Difference 30 -2.9667 1.42595
11.4** 0.000
** Significant at 0.01evel
Table 2: Paired ‘t’ Ratio for the Bent Knee Sit-ups scores in Physical Fitness for the pre and post groups
Bent Knee Sit-Ups
Test N Mean S.D t-value P-value
Pre 30 20.1333 2.6357
Post 30 20.4333 3.2237 Control Group
Difference 30 -0.3 1.207734
1.36 0.184
Pre 30 20.7 2.4934
Post 30 28.6667 3.2625 Experimental
Group Difference 30 -7.96667 3.07922
14.17** 0.000
** Significant at 0.01 level Table 3 : Paired ‘t’ Ratio for the 50 meters dash scores in Physical Fitness for the pre and post groups
50 meter dash Test N Mean S.D t-value P-value
Pre 30 8.1667 0.54202
Post 30 8.173 0.54193 Control Group
Difference 30 -0.006333 0.031457
1.1 0.279
Pre 30 8.11 0.54336
Post 30 7.7373 0.61076 Experimental
Group Difference 30 0.372667 0.219654
9.29** 0.000
** Significant at 0.01 level Table 4: Paired ‘t’ Ratio for the Standing Broad Jump scores in Physical Fitness for the pre and post groups
Standing Broad Jump
Test N Mean S.D t-value P-value
Pre 30 1.805 0.11866
Post 30 1.81133 0.12686 Control Group
Difference 30 -0.006333 0.021088
1.64 0.111
Pre 30 1.85967 0.85911
Post 30 2.09633 0.14986 Experimental
Group Difference 30 -0.23667 0.156301
8.29** 0.000
** Significant at 0.01 level
Table 5: Paired ‘t’ Ratio for the Shuttle Run scores in Physical Fitness for the pre and post groups
4x10 meters Shuttle Run
Test N Mean S.D t-Value P-Value
Pre 30 11.5883 0.8276
Post 30 11.5887 0.8272 Control Group
Difference 30 -0.000333 0.026972
0.07 0.946
Pre 30 11.972 0.6801 Experimental Group Post 30 11.2697 0.5307
8.47** 0.000
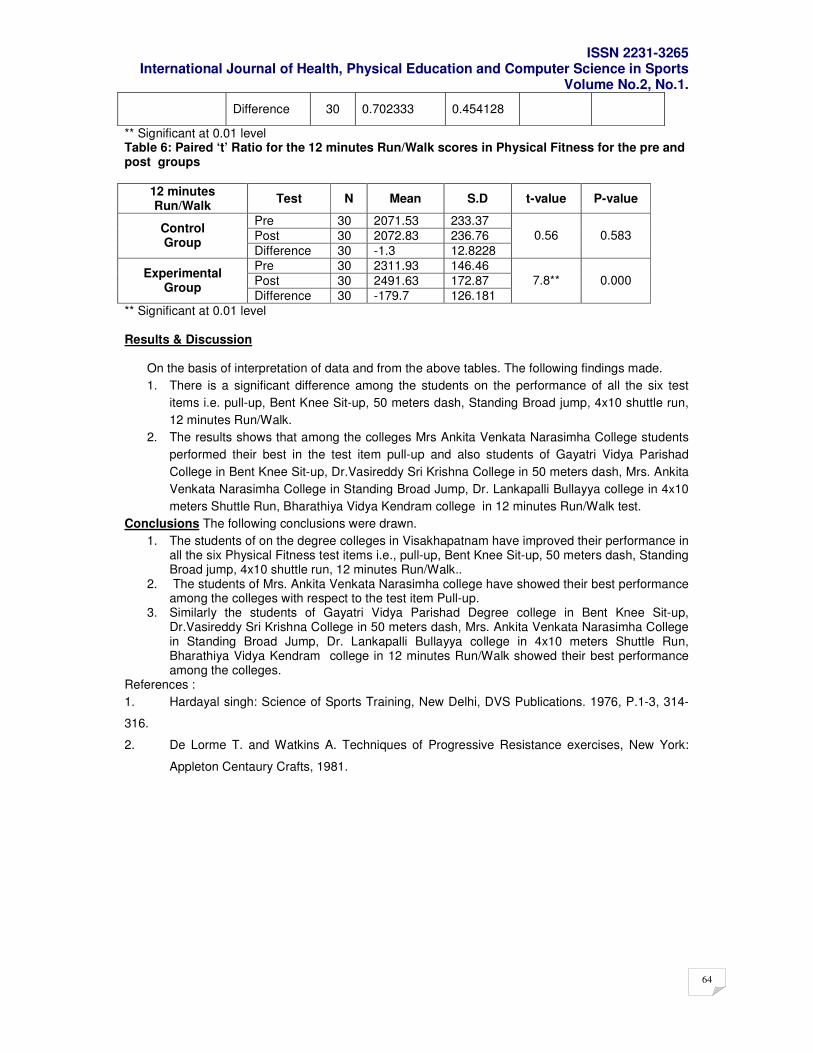
ISSN 2231-3265 International Journal of Health, Physical Education and Computer Science in Sports
Volume No.2, No.1.
64
Difference 30 0.702333 0.454128
** Significant at 0.01 level Table 6: Paired ‘t’ Ratio for the 12 minutes Run/Walk scores in Physical Fitness for the pre and post groups
12 minutes Run/Walk
Test N Mean S.D t-value P-value
Pre 30 2071.53 233.37
Post 30 2072.83 236.76 Control Group
Difference 30 -1.3 12.8228
0.56 0.583
Pre 30 2311.93 146.46
Post 30 2491.63 172.87 Experimental
Group Difference 30 -179.7 126.181
7.8** 0.000
** Significant at 0.01 level
Results & Discussion
On the basis of interpretation of data and from the above tables. The following findings made.
1. There is a significant difference among the students on the performance of all the six test
items i.e. pull-up, Bent Knee Sit-up, 50 meters dash, Standing Broad jump, 4x10 shuttle run,
12 minutes Run/Walk.
2. The results shows that among the colleges Mrs Ankita Venkata Narasimha College students
performed their best in the test item pull-up and also students of Gayatri Vidya Parishad
College in Bent Knee Sit-up, Dr.Vasireddy Sri Krishna College in 50 meters dash, Mrs. Ankita
Venkata Narasimha College in Standing Broad Jump, Dr. Lankapalli Bullayya college in 4x10
meters Shuttle Run, Bharathiya Vidya Kendram college in 12 minutes Run/Walk test.
Conclusions The following conclusions were drawn.
1. The students of on the degree colleges in Visakhapatnam have improved their performance in all the six Physical Fitness test items i.e., pull-up, Bent Knee Sit-up, 50 meters dash, Standing Broad jump, 4x10 shuttle run, 12 minutes Run/Walk..
2. The students of Mrs. Ankita Venkata Narasimha college have showed their best performance among the colleges with respect to the test item Pull-up.
3. Similarly the students of Gayatri Vidya Parishad Degree college in Bent Knee Sit-up, Dr.Vasireddy Sri Krishna College in 50 meters dash, Mrs. Ankita Venkata Narasimha College in Standing Broad Jump, Dr. Lankapalli Bullayya college in 4x10 meters Shuttle Run, Bharathiya Vidya Kendram college in 12 minutes Run/Walk showed their best performance among the colleges.
References :
1. Hardayal singh: Science of Sports Training, New Delhi, DVS Publications. 1976, P.1-3, 314-
316.
2. De Lorme T. and Watkins A. Techniques of Progressive Resistance exercises, New York:
Appleton Centaury Crafts, 1981.
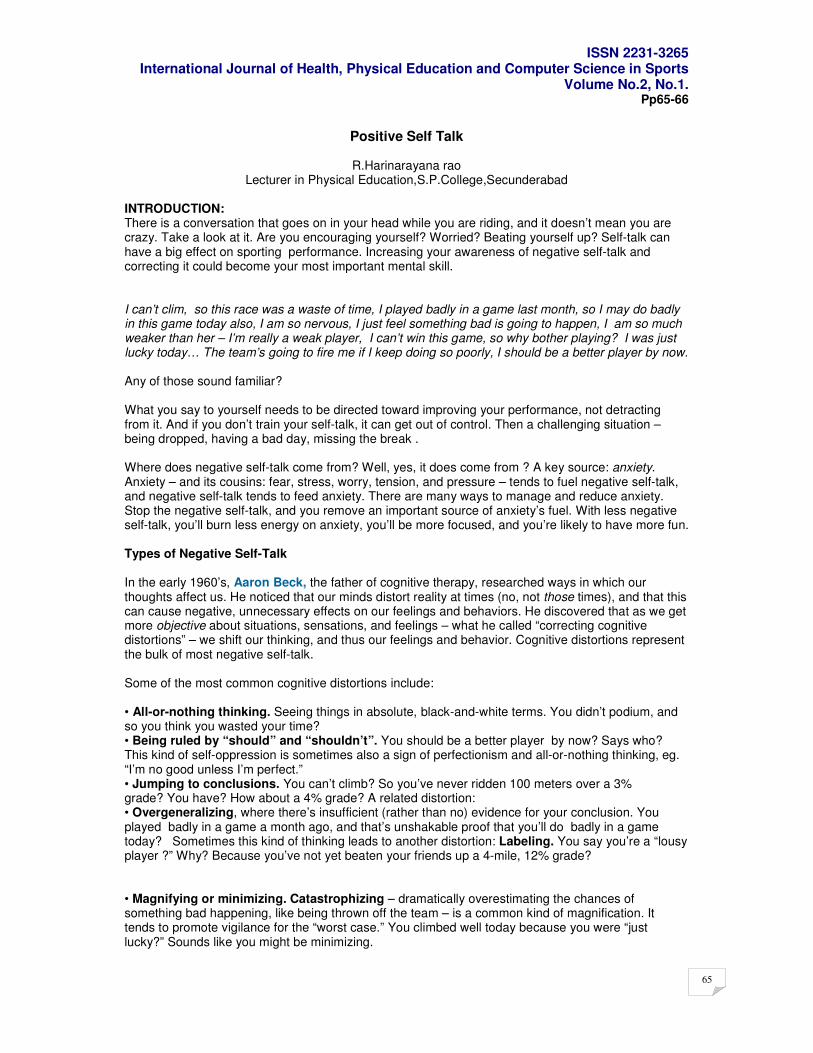
ISSN 2231-3265 International Journal of Health, Physical Education and Computer Science in Sports
Volume No.2, No.1.
65
Pp65-66
Positive Self Talk
R.Harinarayana rao Lecturer in Physical Education,S.P.College,Secunderabad
INTRODUCTION: There is a conversation that goes on in your head while you are riding, and it doesn’t mean you are crazy. Take a look at it. Are you encouraging yourself? Worried? Beating yourself up? Self-talk can have a big effect on sporting performance. Increasing your awareness of negative self-talk and correcting it could become your most important mental skill. I can’t clim, so this race was a waste of time, I played badly in a game last month, so I may do badly in this game today also, I am so nervous, I just feel something bad is going to happen, I am so much weaker than her – I’m really a weak player, I can’t win this game, so why bother playing? I was just lucky today… The team’s going to fire me if I keep doing so poorly, I should be a better player by now. Any of those sound familiar? What you say to yourself needs to be directed toward improving your performance, not detracting from it. And if you don’t train your self-talk, it can get out of control. Then a challenging situation – being dropped, having a bad day, missing the break . Where does negative self-talk come from? Well, yes, it does come from ? A key source: anxiety. Anxiety – and its cousins: fear, stress, worry, tension, and pressure – tends to fuel negative self-talk, and negative self-talk tends to feed anxiety. There are many ways to manage and reduce anxiety. Stop the negative self-talk, and you remove an important source of anxiety’s fuel. With less negative self-talk, you’ll burn less energy on anxiety, you’ll be more focused, and you’re likely to have more fun. Types of Negative Self-Talk In the early 1960’s, Aaron Beck, the father of cognitive therapy, researched ways in which our thoughts affect us. He noticed that our minds distort reality at times (no, not those times), and that this can cause negative, unnecessary effects on our feelings and behaviors. He discovered that as we get more objective about situations, sensations, and feelings – what he called “correcting cognitive distortions” – we shift our thinking, and thus our feelings and behavior. Cognitive distortions represent the bulk of most negative self-talk. Some of the most common cognitive distortions include: • All-or-nothing thinking. Seeing things in absolute, black-and-white terms. You didn’t podium, and so you think you wasted your time? • Being ruled by “should” and “shouldn’t”. You should be a better player by now? Says who? This kind of self-oppression is sometimes also a sign of perfectionism and all-or-nothing thinking, eg. “I’m no good unless I’m perfect.” • Jumping to conclusions. You can’t climb? So you’ve never ridden 100 meters over a 3% grade? You have? How about a 4% grade? A related distortion: • Overgeneralizing, where there’s insufficient (rather than no) evidence for your conclusion. You played badly in a game a month ago, and that’s unshakable proof that you’ll do badly in a game today? Sometimes this kind of thinking leads to another distortion: Labeling. You say you’re a “lousy player ?” Why? Because you’ve not yet beaten your friends up a 4-mile, 12% grade?
• Magnifying or minimizing. Catastrophizing – dramatically overestimating the chances of something bad happening, like being thrown off the team – is a common kind of magnification. It tends to promote vigilance for the “worst case.” You climbed well today because you were “just lucky?” Sounds like you might be minimizing.
ISSN 2231-3265 International Journal of Health, Physical Education and Computer Science in Sports
Volume No.2, No.1.
66
• Focusing completely on the negative. Just because she’s stronger than you (today), you’re “really a weak player?” Are you seeing the whole picture? • “I feel, therefore it is.” “Going with your gut” is a good principle, but taking it too far –“emotional reasoning” – can get you in trouble. Yes, you’re nervous, but that doesn’t mean something bad is going to happen. You may just be nervous. These patterns of thinking often become habitual. Fortunately, they can be unlearned. CONCLUSIONS: As with most everything within ourselves that we want to have a chance to improve, selfawareness is the key. On your next several rides, tune in to your self-talk. Without removing too much of your attention from the road, other riders, and road kill, pay attention to any bits of conversation you have with yourself. For some persons, this may come easy. For others, self-talk may be difficult to notice at first. Try this: pay attention to your breathing. For thousands of years, meditators from a variety of traditions have found that paying close attention to the breath cultivates increased selfawareness, particularly of thoughts and feelings. Or, try this: notice any feelings that come up while riding, and see if you can remember any thoughts that came up before the feelings. You may find it helpful to keep a log of your positive and negative self-talk. And, you may find it helpful to tell someone about it – your coach, a friend, your spouse – not necessarily to get their advice, but just as a way of “giving voice” to your self-talk. Sometimes when you hear it aloud, it can help you to be more sensitive to it next time. You may also find it helpful to investigate what seemed to influence the self-talk. Were you happy, sad, scared, angry, tired, embarrassed, nervous, hungry, confident? When you become aware of negative self-talk, you can use these techniques: • Thought-stopping. Some people use sheer force of will, some visualize a red light or stop sign. Whatever you use, shut that thought down. • Questioning. When you hear negative self-talk, wait. Ask yourself: What’s the evidence for what your mind is saying to you? What’s the proof? • Reducing your anxiety. Depending on whether you’re on or off the bike, use whatever you find soothing (and legal): breathing, meditation, imagery, music, being in nature, talking with a friend. You may not become relaxed, but you’re likely to become more relaxed, perhaps just enough to allow another technique to work. • Thought-replacement. Here’s your counter attack. What could you say (instead) to yourself that would be encouraging, supportive or motivating, while still believable? - Positive, reality-based counterstatements: (“Given my stage of training, I am climbing well.”) - Affirmations. (“I am strong and have a good team in this race.”) - Frequently-used cue words with positive associations. (“Calm and focused”) - Behaviors. (“I’m going to focus on having good form on this climb.”) Sometimes, rather than being able to say something positive to yourself, the best you can do is to say something non-negative. For example, “I’m never going to win” could be replaced with “I’ll suspend judgment for the moment on how the game will be played.” That could be progress for you. In your training, notice frequent words and phrases of negative self-talk and develop a plan for responding to them. If you are competing, review your plan as part of your pre-gamee routine. The mind can be a dangerous thing. But you can use your mind to battle your mind –successfully.
ISSN 2231-3265 International Journal of Health, Physical Education and Computer Science in Sports
Volume No.2, No.1.
67
pp67-68
Personality traits of athletes and non athletes
Dr. Shekhar N. Shirsath
Director of Physical Education & Sports Deogiri College, Aurangabad (MS)
Abstract:The purpose of this study was to compare the personality traits between athletes and non athletes of Dr. Babasaheb Ambedkar Marathwada University. The study was conducted on hundred samples, consisting of fifty athletes and fifty non athletes of different colleges affiliated to Dr. Babasaheb Ambedkar Marathwada University. Personality traits were obtained by administrating Sports Specific Personality Test. The data collected through aforesaid tests were analyzed with respect to personality traits. T test was applied to compute the significances among two groups. The significance of data was judged at .05 levels. The result of the study indicates that the differences of means were significant for all personality traits at .05 levels. INTRODUCTION:According to Phares and Chaplin, “Personality has been defined as a unique pattern of characteristic, thoughts, feelings and behaviors that distinguish one person from another and that persist over time and situations.” Personality traits are organized in a structural hierarchSports personality is a product of biological and cultural heritage. It reveals the psychological makeup of an individual through his behavior. In fact, it is the quality of a person’s total behaviorIn a review of numerous studies Ogilvie (1968) conducted that eight personality traits were closely linked to athletic performance-emotional stability, tough–mindedness conscientiousness, self-discipline, self-assurance, trust, extraversion and low tension. This was supported in research by Morgan (1974) who found that athletes were more likely to have stable and extravert personalities than non-athletes. Franken, Hill and Kierstead (1994), the literature shows that athletes in one sport often differ in personality type and profile from Athletes in other sports.Gat & MC Whirter (1998), Athletes differ from non athletes on many personality traits. It is often a matter of conjecture whether these differences favour the Athletes and Non-Athletes.Personality research in sports has considered whether particular personality traits are related to the sports which people take up, the positions they take on a team and their success in sports. Overall personality is seen as only one of several factors which are related to sports performance. OBJECTIVES OF THE STUDY: The objectives of the study are stated as follows:
1) To study the personality traits of athletes and non athletes of Dr. Babasahab Ambedkar Marathwada University.
2) To compare the personality dimensions of athletes and non athletes.
METHODOLOGY: Selection of Sample : The sample consists of hundred athletes and non athletes of Dr. Babasahab Ambedkar Marathwada University. The subjects were drawn from the colleges affiliated to Dr. Babasahab Ambedkar Marathwada University. Random Sampling Technique was employed to select the subjects. The data was collected from Wrestling, Judo, Weight lifting, Boxing and Taekwondo inter collegiate winner and runner male athletes during inter collegiate tournaments and non athletes in their colleges. The researcher will use survey research methodology for the study. Tools used :Agya Jit Singh’s Sports Specific Personality Test has been taken to assess the personality traits. This questionnaire consisted of hundred statements. Method for Analysis: Student’s t test has been applied to find out the significant differences among two groups at 0.05 levels of significance. The collected data were tabulated to find out the difference of sports personality dimensions among two groups.
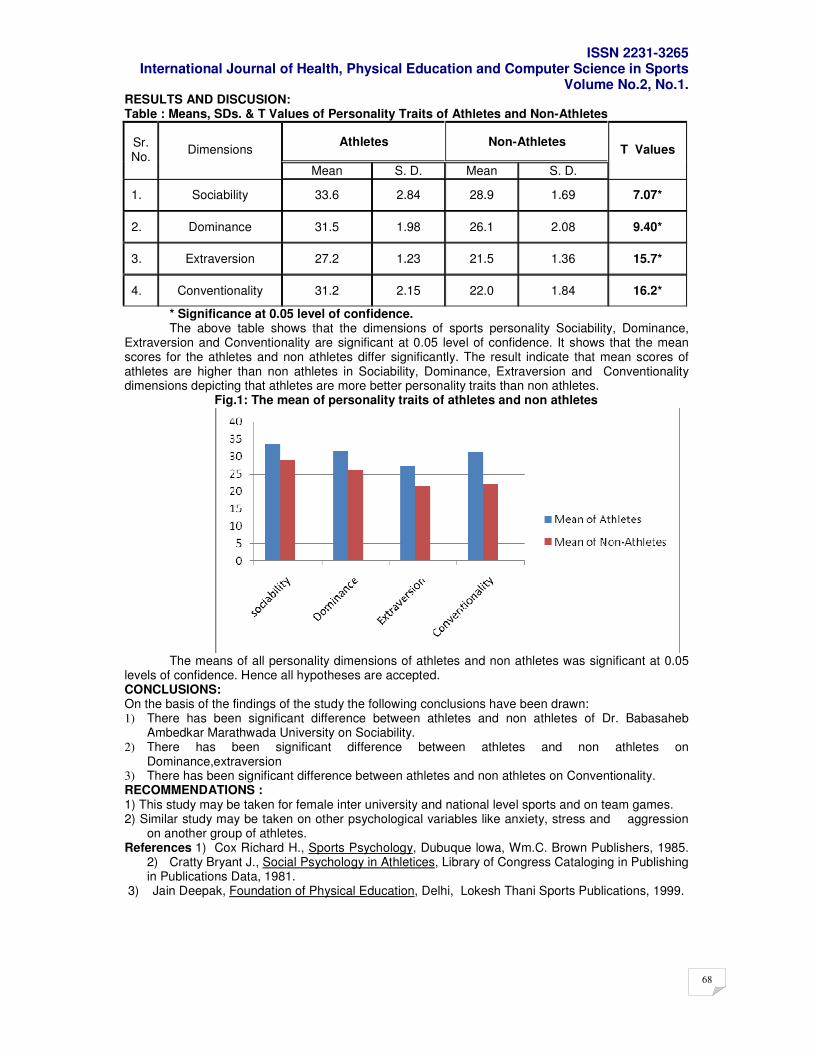
ISSN 2231-3265 International Journal of Health, Physical Education and Computer Science in Sports
Volume No.2, No.1.
68
RESULTS AND DISCUSION: Table : Means, SDs. & T Values of Personality Traits of Athletes and Non-Athletes
Athletes Non-Athletes Sr. No.
Dimensions
Mean S. D. Mean S. D.
T Values
1. Sociability 33.6 2.84 28.9 1.69 7.07*
2. Dominance 31.5 1.98 26.1 2.08 9.40*
3. Extraversion 27.2 1.23 21.5 1.36 15.7*
4. Conventionality 31.2 2.15 22.0 1.84 16.2*
* Significance at 0.05 level of confidence. The above table shows that the dimensions of sports personality Sociability, Dominance,
Extraversion and Conventionality are significant at 0.05 level of confidence. It shows that the mean scores for the athletes and non athletes differ significantly. The result indicate that mean scores of athletes are higher than non athletes in Sociability, Dominance, Extraversion and Conventionality dimensions depicting that athletes are more better personality traits than non athletes.
Fig.1: The mean of personality traits of athletes and non athletes
The means of all personality dimensions of athletes and non athletes was significant at 0.05
levels of confidence. Hence all hypotheses are accepted. CONCLUSIONS: On the basis of the findings of the study the following conclusions have been drawn: 1) There has been significant difference between athletes and non athletes of Dr. Babasaheb
Ambedkar Marathwada University on Sociability. 2) There has been significant difference between athletes and non athletes on
Dominance,extraversion 3) There has been significant difference between athletes and non athletes on Conventionality. RECOMMENDATIONS : 1) This study may be taken for female inter university and national level sports and on team games. 2) Similar study may be taken on other psychological variables like anxiety, stress and aggression
on another group of athletes. References 1) Cox Richard H., Sports Psychology, Dubuque lowa, Wm.C. Brown Publishers, 1985.
2) Cratty Bryant J., Social Psychology in Athletices, Library of Congress Cataloging in Publishing in Publications Data, 1981.
3) Jain Deepak, Foundation of Physical Education, Delhi, Lokesh Thani Sports Publications, 1999.
ISSN 2231-3265 International Journal of Health, Physical Education and Computer Science in Sports
Volume No.2, No.1.
69
pp69-71
A Study of Introvert-Extrovert, and Self-Concept of Interuniversity Badminton Players Dr. Quadri Syed Javeed
Associate Professor in Psychology M.S.S. Art’s Commerce & Science College,
Jalna – 431203 (M.S.) India. Introduction: Badminton is a racquet sport played by either two opposing players (singles) or two opposing pairs (doubles), who take positions on opposite halves of a rectangular court that is divided by a net. Players score points by striking a shuttlecock (also known as a shuttle, bird, or birdy) with their racquet so that it passes over the net and lands in their opponents' half of the court. Each side may only strike the shuttlecock once before it passes over the net. A rally ends once the shuttlecock has struck the floor. The shuttlecock (or shuttle) is a feathered projectile whose unique aerodynamic properties cause it to fly differently from the balls used in most racquet sports; in particular, the feathers create much higher drag, causing the shuttlecock to decelerate more rapidly than a ball. Shuttlecocks have a much higher top speed, when compared to other racquet sports. Because shuttlecock flight is affected by wind, competitive badminton is played indoors. Badminton is also played outdoors as a casual recreational activity, often as a garden or beach game. Extraversion Extraversion is "the act, state, or habit of being predominantly concerned with and obtaining gratification from what is outside the self".Extraverts tend to enjoy human interactions and to be enthusiastic, talkative,assertive, and gregarious. They take pleasure in activities that involve large social gatherings, such as parties, community activities, public demonstrations, and business or political groups. Politics, teaching, sales, managing and brokering are fields that favor extraversion. An extraverted person is likely to enjoy time spent with people and find less reward in time spent alone. They tend to be energized when around other people, and they are more prone to boredom when they are by themselves.
Introversion Introversion is "the state of or tendency toward being wholly or predominantly concerned with and interested in one's own mental life". Introverts are people whose energy tends to expand through reflection and dwindle during interaction. Introverts tend to be more reserved and less outspoken in large groups. They often take pleasure in solitary activities such as reading, writing, music, drawing, tinkering, playing video games, watching movies and plays, and using computers, along with some more reserved outdoor activities such as fishing. In fact, social networking sites have been a thriving home for introverts in the 21st century, where introverts are free from the formalities of social conduct and may become more comfortable blogging about personal feelings they would not otherwise disclose. The archetypalartist, writer, sculptor, engineer, composer, and inventor are all highly introverted. An introvert is likely to enjoy time spent alone and find less reward in time spent with large groups of people, though he or she may enjoy interactions with close friends. Trust is usually an issue of significance: a virtue of utmost importance to an introvert choosing a worthy companion.
Self-concept is a multi-dimensional construct that refers to an individual's perception of "self" in relation to any number of characteristics, such as academics (and nonacademics), gender roles and sexuality, racial identity, and many others. While closely related with self-concept clarity it presupposes but is distinguishable from self-awareness, which is simply an individual's awareness of their self. It is also more generalthanself-esteem, which is the purely
is an internal model which comprises self-assessments. Features assessed include but are not limited to: personality, skills and abilities, occupation(s) and hobbies, physical characteristics, etc. For example, the statement "I am lazy" is a self-assessment that contributes to the self-concept. However, the statement "I am tired" would not be part of someone's self-concept, since being tired is a temporary state and a more objective
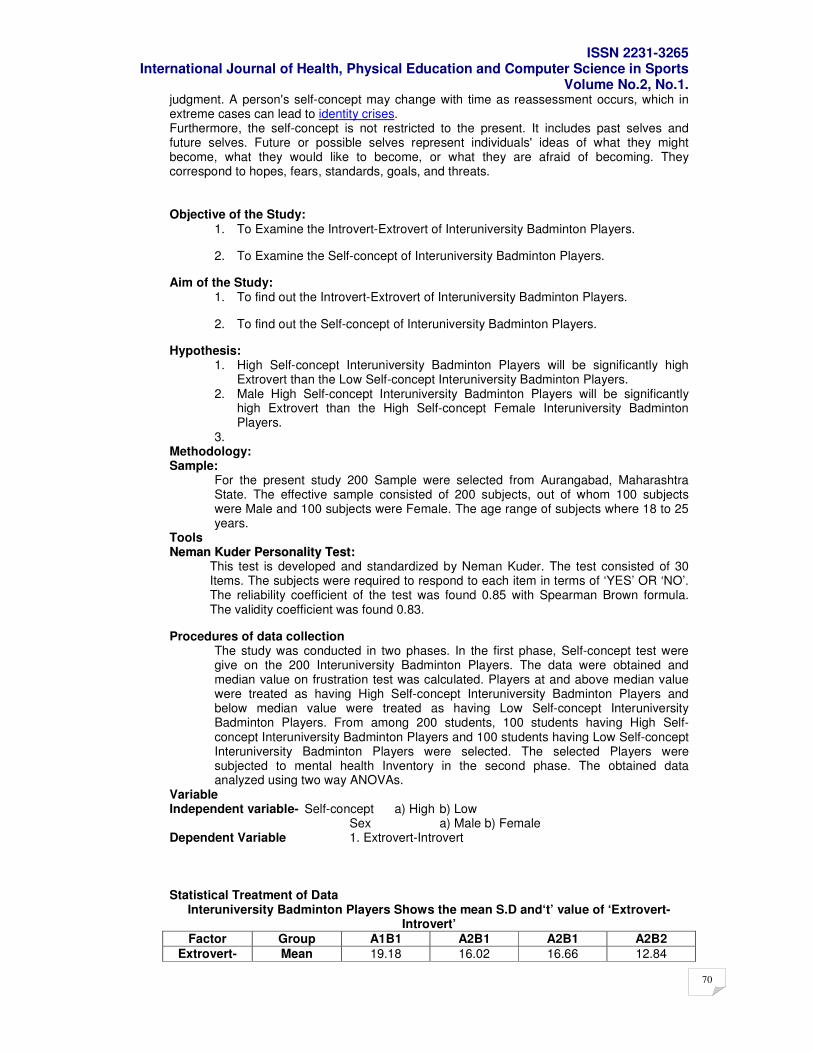
ISSN 2231-3265 International Journal of Health, Physical Education and Computer Science in Sports
Volume No.2, No.1.
70
judgment. A person's self-concept may change with time as reassessment occurs, which in extreme cases can lead to identity crises. Furthermore, the self-concept is not restricted to the present. It includes past selves and future selves. Future or possible selves represent individuals' ideas of what they might become, what they would like to become, or what they are afraid of becoming. They correspond to hopes, fears, standards, goals, and threats. Objective of the Study:
1. To Examine the Introvert-Extrovert of Interuniversity Badminton Players.
2. To Examine the Self-concept of Interuniversity Badminton Players.
Aim of the Study: 1. To find out the Introvert-Extrovert of Interuniversity Badminton Players.
2. To find out the Self-concept of Interuniversity Badminton Players.
Hypothesis: 1. High Self-concept Interuniversity Badminton Players will be significantly high
Extrovert than the Low Self-concept Interuniversity Badminton Players. 2. Male High Self-concept Interuniversity Badminton Players will be significantly
high Extrovert than the High Self-concept Female Interuniversity Badminton Players.
3. Methodology: Sample:
For the present study 200 Sample were selected from Aurangabad, Maharashtra State. The effective sample consisted of 200 subjects, out of whom 100 subjects were Male and 100 subjects were Female. The age range of subjects where 18 to 25 years.
Tools NNeemmaann KKuuddeerr PPeerrssoonnaalliittyy TTeesstt::
This test is developed and standardized by Neman Kuder. The test consisted of 30 Items. The subjects were required to respond to each item in terms of ‘YES’ OR ‘NO’. The reliability coefficient of the test was found 0.85 with Spearman Brown formula. The validity coefficient was found 0.83.
Procedures of data collection The study was conducted in two phases. In the first phase, Self-concept test were give on the 200 Interuniversity Badminton Players. The data were obtained and median value on frustration test was calculated. Players at and above median value were treated as having High Self-concept Interuniversity Badminton Players and below median value were treated as having Low Self-concept Interuniversity Badminton Players. From among 200 students, 100 students having High Self-concept Interuniversity Badminton Players and 100 students having Low Self-concept Interuniversity Badminton Players were selected. The selected Players were subjected to mental health Inventory in the second phase. The obtained data analyzed using two way ANOVAs.
Variable Independent variable- Self-concept a) High b) Low
Sex a) Male b) Female Dependent Variable 1. Extrovert-Introvert
Statistical Treatment of Data
Interuniversity Badminton Players Shows the mean S.D and‘t’ value of ‘Extrovert-Introvert’
Factor Group A1B1 A2B1 A2B1 A2B2
Extrovert- Mean 19.18 16.02 16.66 12.84
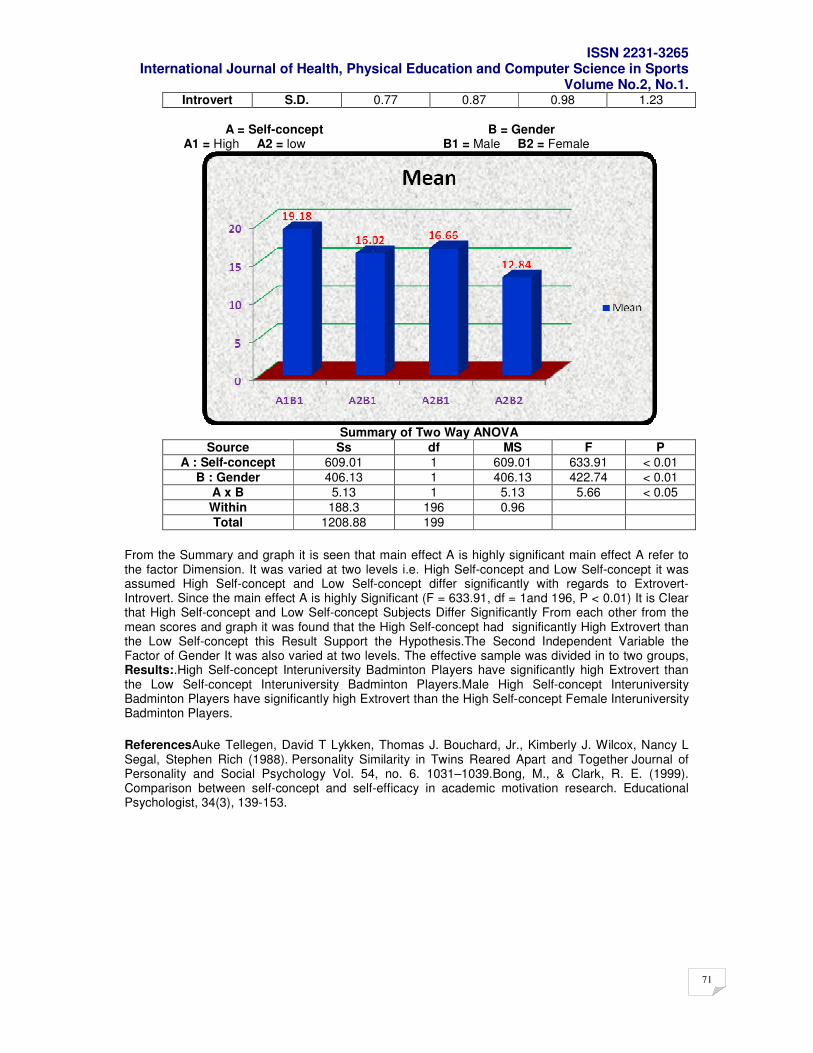
ISSN 2231-3265 International Journal of Health, Physical Education and Computer Science in Sports
Volume No.2, No.1.
71
Introvert S.D. 0.77 0.87 0.98 1.23
A = Self-concept B = Gender A1 = High A2 = low B1 = Male B2 = Female
Summary of Two Way ANOVA
Source Ss df MS F P
A : Self-concept 609.01 1 609.01 633.91 < 0.01
B : Gender 406.13 1 406.13 422.74 < 0.01
A x B 5.13 1 5.13 5.66 < 0.05
Within 188.3 196 0.96
Total 1208.88 199
From the Summary and graph it is seen that main effect A is highly significant main effect A refer to the factor Dimension. It was varied at two levels i.e. High Self-concept and Low Self-concept it was assumed High Self-concept and Low Self-concept differ significantly with regards to Extrovert-Introvert. Since the main effect A is highly Significant (F = 633.91, df = 1and 196, P < 0.01) It is Clear that High Self-concept and Low Self-concept Subjects Differ Significantly From each other from the mean scores and graph it was found that the High Self-concept had significantly High Extrovert than the Low Self-concept this Result Support the Hypothesis.The Second Independent Variable the Factor of Gender It was also varied at two levels. The effective sample was divided in to two groups, Results:.High Self-concept Interuniversity Badminton Players have significantly high Extrovert than the Low Self-concept Interuniversity Badminton Players.Male High Self-concept Interuniversity Badminton Players have significantly high Extrovert than the High Self-concept Female Interuniversity Badminton Players.
ReferencesAuke Tellegen, David T Lykken, Thomas J. Bouchard, Jr., Kimberly J. Wilcox, Nancy L Segal, Stephen Rich (1988). Personality Similarity in Twins Reared Apart and Together Journal of Personality and Social Psychology Vol. 54, no. 6. 1031–1039.Bong, M., & Clark, R. E. (1999). Comparison between self-concept and self-efficacy in academic motivation research. Educational Psychologist, 34(3), 139-153.

ISSN 2231-3265 International Journal of Health, Physical Education and Computer Science in Sports
Volume No.2, No.1.
72
Pp72-74
The effect of yoga on quality of life of for chronic lower back pain patients: a study
Dr.L.B.Laxmikanth Rathod
Associate Professor, Dept. of Physical Education,OU
INTRODUCTION In recent years, quality of life has become a key concept in the medical community where health care places dual emphasis on treatment and quality of care. The World Health Organization defines quality of life as an 'individual's perception of his/her position in life in the context of culture and value system in which they live and in relation to their goals, expectations, standards and concerns'. It depends on a patient's physical, psychological and social responses to a disease and its treatment.
Objective of the study:This study was planned to compare the effect of yoga with physical therapy exercises on quality of life in patients undergoing a short term intensive residential program for chronic lower back pain (CLBP).
Hypothesis ;Quality Of Life in yoga group would be better than control (physical exercise) as yoga is a multi-dimensional treatment modality that caters to all the levels of existence.
METHODS Subjects:A total of 20 patients with CLBP admitted to a holistic health home in Hyederabad for 12 weeks 20 who satisfied the inclusion criteria were recruited. The inclusion criteria were (a) history of CLBP of more than three months (b) pain in lumbar spine with or without radiation to legs and (c) age between 35 to 45 years. Exclusion criteria were, (a) CLBP due to organic pathology in the spine such as malignancy (primary or secondary), or chronic infections checked by X ray of lumbar spine. A signed informed consent was obtained from all patients.
Study design:In this randomized control study, 20 subjects who satisfied the inclusion criteria were allotted to two groups. Magnetic resonance Imaging (MRI) scans of all patients were reviewed and X-ray pictures of lumbar spine (antero posterior and lateral view) were obtained. Demographic details vital clinical data, personal, family history were documented before starting the intervention. Outcome variables were recorded on the first and seventh day. The experimental group trained under the yoga-based program whereas the control group received physical therapy exercise based program.
TABLE-I Study Profiles Design-and Demographic data
EXPIRIMENTAL GROUP CONTROL GROUP
MALES WORKING SEDENTARY
05
10
MALES WORKING SEDENTARY
05
10
FEMALE WORKING SEDENTARY
05
FEMALE WORKING SEDENTARY
05
AGE 35 - 45 35 - 45
Patients suffering with CLBP since
1 Year with Muscles spasm
1 Year with Muscles spasm
Yoga intervention
The specific 'integrated yoga therapy module for low back pain' was developed by a team of two yoga experts and a physiatrist. The concepts of the modules were taken from traditional yoga scriptures. The practices consisted of asanas for back pain (yoga postures), techniques, and lectures on yogic lifestyle, devotional sessions and stress management through yogic counseling. The physical practices (back pain special techniques included simple yogic movements and maintenance in the
ISSN 2231-3265 International Journal of Health, Physical Education and Computer Science in Sports
Volume No.2, No.1.
73
final posture of asanas that provide stretch and relaxation. The safety of the practices was ensured by avoiding acute forward or backward movements of the spine and jerky movements while designing the module.
Control intervention
The practices consisted of a set of physical movements certified by the senior physiatrist non-yogic safe general exercises, lectures on scientific information including (a) causes of back pain, (b) stress, QOL and CLBP and (c) benefits of physical exercises for the experimental group.
Table II :Table for two groups for 12 week-long program daily schedule of practices for yoga and control group
EXPERIMENTAL GROUP CONTROL GROUP
1) Supine posture
1. Pavanamukthasana 2.Ardha Navkasana
2) Prone Posture
1.Bhujangasana 2.Shalabhasana
3. Sitting posture
1.Vyagrasavasana 2.shashankasana
4. Standing posture
1.Ardhachakrasana 2.Ardhakatichakrasana
GENRAL EXERCISES
1. Standing hamstring stretch 2.Pelvic tilt 3. Extension exercises.4. Trunk rotation 5.Lumbar rotation 6. partial Curl.7. single knee to chest stretch 8. Quadriceps leg raising.
Straight leg raising test
A Goniometer (Anand Agencies, Pune) that has two scales fixed at one end to a compass (calibrated in degrees), was used to measure straight leg raising (SLR). It was placed with the stationary arm parallel to the edge of the table, the moving arm along the lateral midline of the thigh and the axis over the superior half of the greater trochanter. Then the leg was raised passively until the patient reported pain. The angle between the two scales is read on the compass. The procedure is repeated on both sides
Data analysis Data was analyzed by Statistical tests used included, independent samples 't' for baseline matching of the two groups, repeated measures ANOVA for group time interaction followed by post hoc analysis for within and between group differences and Pearson's correlation test for correlations. Results Table I shows the study profile. There were no drop outs as this was a residential short term program. The two groups, yoga and control (10 each), were similar with respect to socio-demographic and medical characteristics. Table III shows the results of Straight Leg Raise- Right & Straight Leg Raise -Left. Table: III Results of variables post intervention.
YOGA GROUP CONTROL GROUP VARIABLE Mean SD P.Value Mean SD P.Value
Pre-Test
57.95
20.3
0.001
Pre-Test
57.68
24.65
0.04
Straight Leg Raise- Right Post-
Test 76.00
16.38
Post-Test
68.45
20.48
Pre-Test
59.00 18.54 0.001
Pre-Test
56.30
23.71
0.16
Straight Leg Raise -Left Post-
Test 75.75 15.04
Post-Test
68.38
19.03
ISSN 2231-3265 International Journal of Health, Physical Education and Computer Science in Sports
Volume No.2, No.1.
74
The above Table shows the results after the intervention in the two groups. There was significant group time interaction and difference between groups on straight leg raise Right and Left at P<0.01. Within group analysis showed significant improvement in yoga group and non-significant change in control group. Straight leg raising There was significant increase in SLR in both groups at P<0.001 with significant group time interaction for SLR right side at P=0.04. Discussion This randomized control study on 20 patients with CLBP, who underwent a residential intensive training program for 12 week, showed that there was significantly better (P<0.01) improvement in quality of life on all domains of Quality Of Life and SLR (right) & (Left) in yoga than control group. Conclusion
This randomized control study has shown that patients with CLBP had high stress levels with a negative correlation with QOL. A week long residential intensive yoga program increased the Quality Of Life and spinal flexibility better than physical therapy exercises for CLBP.
REFERENCES 1. Andersson GB. The adult spine: Principles and practice. 2nd ed. Philadelphia: Lippincot-
Raven; 1997. 2. Peters ML, Vlaeyen JW, Kleef M, Patijn J. Quality of life in chronic pain is more associated
with beliefs about pain, than with pain intensity. Eur J Pain 2005. 3. Lang E, Liebig K, Kastner S, Neundφrfer B, Heuschmann P. Multidisciplinary rehabilitation
versus usual care for chronic low back pain in the community: Effects on quality of life. Spine J 2003;
4. Tekur P, Singhpow C, Nagendra HR, Raghuram N. Effect of short-term intensive yoga program on pain, functional disability and spinal flexibility in chronic low back pain: A randomized control study. J Altern Complement Med 2008.
5. Nagarathna R, Nagendra HR. Yoga for back pain. Bengaluru: Swami Vivekananda Yoga Prakashana; 2001
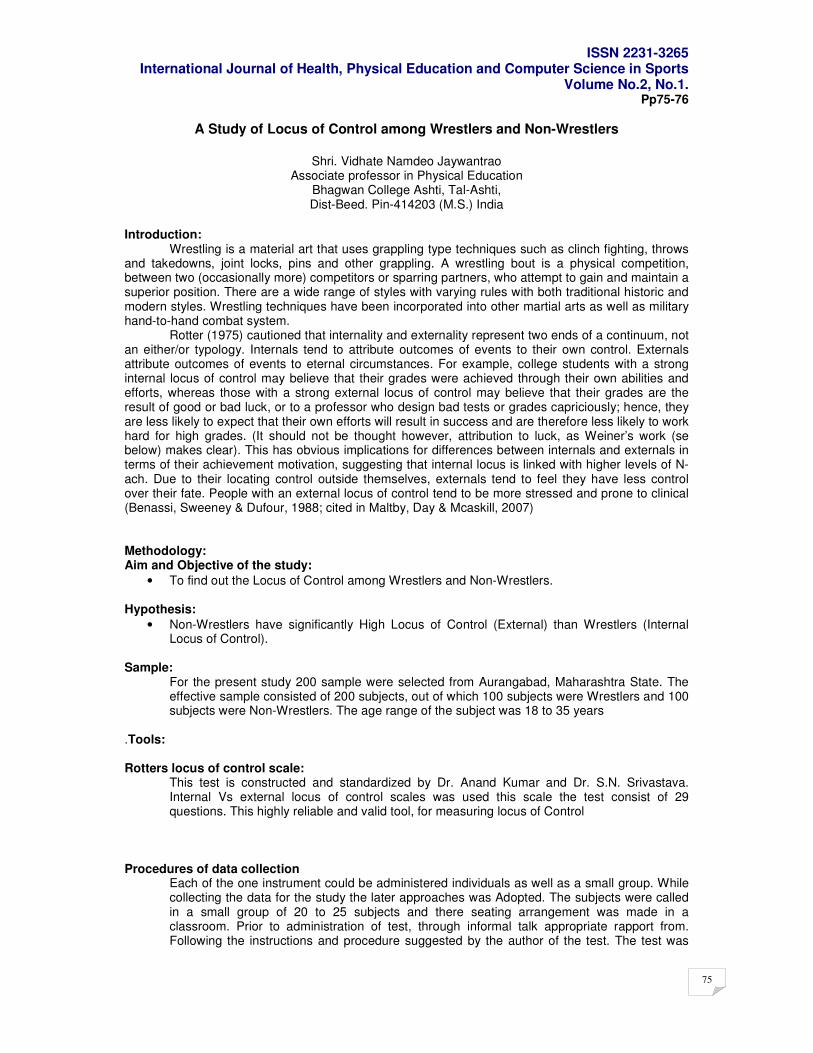
ISSN 2231-3265 International Journal of Health, Physical Education and Computer Science in Sports
Volume No.2, No.1.
75
Pp75-76
A Study of Locus of Control among Wrestlers and Non-Wrestlers
Shri. Vidhate Namdeo Jaywantrao
Associate professor in Physical Education Bhagwan College Ashti, Tal-Ashti, Dist-Beed. Pin-414203 (M.S.) India
Introduction: Wrestling is a material art that uses grappling type techniques such as clinch fighting, throws and takedowns, joint locks, pins and other grappling. A wrestling bout is a physical competition, between two (occasionally more) competitors or sparring partners, who attempt to gain and maintain a superior position. There are a wide range of styles with varying rules with both traditional historic and modern styles. Wrestling techniques have been incorporated into other martial arts as well as military hand-to-hand combat system. Rotter (1975) cautioned that internality and externality represent two ends of a continuum, not an either/or typology. Internals tend to attribute outcomes of events to their own control. Externals attribute outcomes of events to eternal circumstances. For example, college students with a strong internal locus of control may believe that their grades were achieved through their own abilities and efforts, whereas those with a strong external locus of control may believe that their grades are the result of good or bad luck, or to a professor who design bad tests or grades capriciously; hence, they are less likely to expect that their own efforts will result in success and are therefore less likely to work hard for high grades. (It should not be thought however, attribution to luck, as Weiner’s work (se below) makes clear). This has obvious implications for differences between internals and externals in terms of their achievement motivation, suggesting that internal locus is linked with higher levels of N-ach. Due to their locating control outside themselves, externals tend to feel they have less control over their fate. People with an external locus of control tend to be more stressed and prone to clinical (Benassi, Sweeney & Dufour, 1988; cited in Maltby, Day & Mcaskill, 2007) Methodology: Aim and Objective of the study:
• To find out the Locus of Control among Wrestlers and Non-Wrestlers.
Hypothesis:
• Non-Wrestlers have significantly High Locus of Control (External) than Wrestlers (Internal Locus of Control).
Sample: For the present study 200 sample were selected from Aurangabad, Maharashtra State. The effective sample consisted of 200 subjects, out of which 100 subjects were Wrestlers and 100 subjects were Non-Wrestlers. The age range of the subject was 18 to 35 years
.Tools: Rotters locus of control scale:
This test is constructed and standardized by Dr. Anand Kumar and Dr. S.N. Srivastava. Internal Vs external locus of control scales was used this scale the test consist of 29 questions. This highly reliable and valid tool, for measuring locus of Control
Procedures of data collection
Each of the one instrument could be administered individuals as well as a small group. While collecting the data for the study the later approaches was Adopted. The subjects were called in a small group of 20 to 25 subjects and there seating arrangement was made in a classroom. Prior to administration of test, through informal talk appropriate rapport from. Following the instructions and procedure suggested by the author of the test. The test was
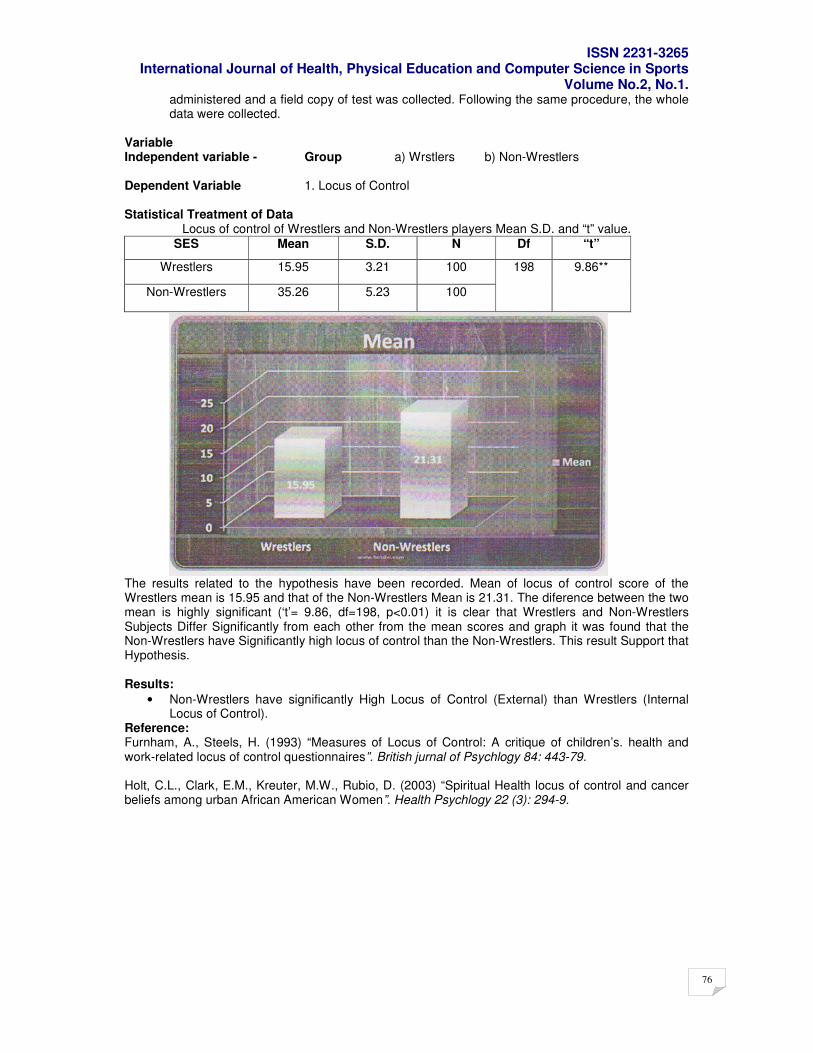
ISSN 2231-3265 International Journal of Health, Physical Education and Computer Science in Sports
Volume No.2, No.1.
76
administered and a field copy of test was collected. Following the same procedure, the whole data were collected.
Variable Independent variable - Group a) Wrstlers b) Non-Wrestlers Dependent Variable 1. Locus of Control Statistical Treatment of Data
Locus of control of Wrestlers and Non-Wrestlers players Mean S.D. and “t” value. SES Mean S.D. N Df “t”
Wrestlers 15.95 3.21 100
Non-Wrestlers 35.26 5.23 100
198 9.86**
The results related to the hypothesis have been recorded. Mean of locus of control score of the Wrestlers mean is 15.95 and that of the Non-Wrestlers Mean is 21.31. The diference between the two mean is highly significant (‘t’= 9.86, df=198, p<0.01) it is clear that Wrestlers and Non-Wrestlers Subjects Differ Significantly from each other from the mean scores and graph it was found that the Non-Wrestlers have Significantly high locus of control than the Non-Wrestlers. This result Support that Hypothesis. Results:
• Non-Wrestlers have significantly High Locus of Control (External) than Wrestlers (Internal Locus of Control).
Reference: Furnham, A., Steels, H. (1993) “Measures of Locus of Control: A critique of children’s. health and work-related locus of control questionnaires”. British jurnal of Psychlogy 84: 443-79. Holt, C.L., Clark, E.M., Kreuter, M.W., Rubio, D. (2003) “Spiritual Health locus of control and cancer beliefs among urban African American Women”. Health Psychlogy 22 (3): 294-9.
ISSN 2231-3265 International Journal of Health, Physical Education and Computer Science in Sports
Volume No.2, No.1.
77
pp77-78
A Comparative Study of Physical Fitness of Indoor and Outdoor Players
Shri. Dhonde S.P.
Assistant professor in Physical Education Bhagwan College Ashti, Tal-Ashti,Beed, Maharashtra, India
Introduction: In previous years, fitness was commonly defined as the capacity to carry out the day’s activities without undue fatigue. However, as automation increased leisure time, changes in lifestyles following the industrial revolution rendered this definition insufficient. These days, physical fitness is considered a measure of the bbody’s ability to function efficiently and effectively in work and leisure activities, to be healthy, to resist hypo kinetic diseases, and to meet emergency situation. Components of physical fitness The president’s Council on physical Fitness and Sports- a study group sponsored by the Government of the United States – decline s to offer a simple definition of physical fitness. Accordingly, a general-purpose physical fitness program must address the following essentials: Cardiovascular Fitness,Flexibility Training, Strength Training, Muscular Endurance, Body Composition etc Specific fitness Specific or task-oriented fitness is a person’s ability to perform in a specific activity with a reasonable efficiency: for example: for example, sports or military service. Specific training prepares athletes to perform well in their sports. Examples are:
• 400m sprint – in a sprint the athlete must be trained to work anaerobically throughout the race.
• Marathon – in this case the athlete must be trained to work aerobically and their endurance must be built-up to maximum.
• Many fire fighers and police officers undergo regular Fitness testing to determine if they are capable of the physically demanding task required of the job.
• Members of the United State Army and Army National Guard must be able to pass the Army physical fitness Test (APFT).
Methodology: Aim and Objective of the study:
• To find out the Physical Fitness of Indoor and Outdoor Players. Hypothesis:
• Outdoor players have significantly better physical fitness than the indoor players. Sample
For the present study 220 sample were selected from Dr. Babasaheb Ambedkar Marathwad University, Aurangabad, and Maharashtra Sate. The effective sample consisted of 220 subjects, out of which 110 subjects were male and 110 subjects were female. The age range of the subjects were 18 to 25 years.
Tools Physical Fitness:
Pune University Physical Fitness test was used for measuring physical Fitness Procedure of data collection Each of the one instruments could be administered individuals as well as a small group. While collecting the data for the study the letter approaches was adopted. The subjects were called in a small group of 20 to 25 subjects and there seating arrangements was made in a classroom. Prior to administration of test, through informal talk appropriate rapport form. Following the instructions and
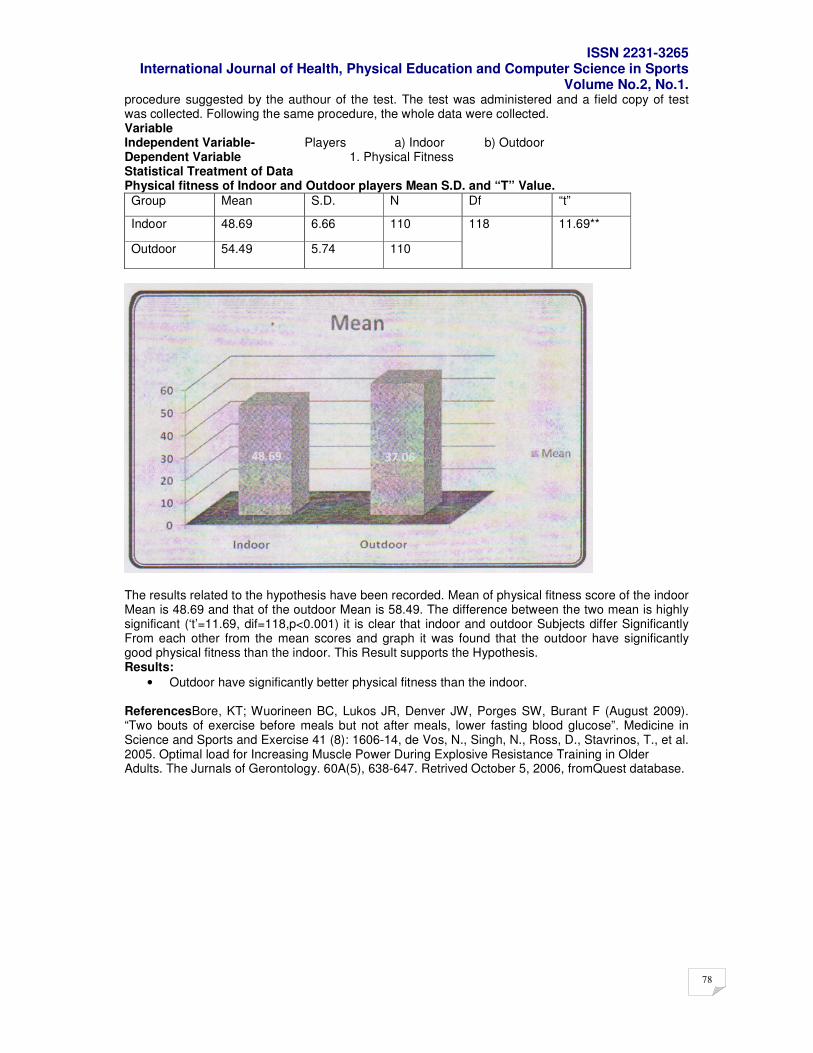
ISSN 2231-3265 International Journal of Health, Physical Education and Computer Science in Sports
Volume No.2, No.1.
78
procedure suggested by the authour of the test. The test was administered and a field copy of test was collected. Following the same procedure, the whole data were collected. Variable Independent Variable- Players a) Indoor b) Outdoor Dependent Variable 1. Physical Fitness Statistical Treatment of Data Physical fitness of Indoor and Outdoor players Mean S.D. and “T” Value.
Group Mean S.D. N Df “t”
Indoor 48.69 6.66 110
Outdoor 54.49 5.74 110
118 11.69**
The results related to the hypothesis have been recorded. Mean of physical fitness score of the indoor Mean is 48.69 and that of the outdoor Mean is 58.49. The difference between the two mean is highly significant (‘t’=11.69, dif=118,p<0.001) it is clear that indoor and outdoor Subjects differ Significantly From each other from the mean scores and graph it was found that the outdoor have significantly good physical fitness than the indoor. This Result supports the Hypothesis. Results:
• Outdoor have significantly better physical fitness than the indoor. ReferencesBore, KT; Wuorineen BC, Lukos JR, Denver JW, Porges SW, Burant F (August 2009). “Two bouts of exercise before meals but not after meals, lower fasting blood glucose”. Medicine in Science and Sports and Exercise 41 (8): 1606-14, de Vos, N., Singh, N., Ross, D., Stavrinos, T., et al. 2005. Optimal load for Increasing Muscle Power During Explosive Resistance Training in Older Adults. The Jurnals of Gerontology. 60A(5), 638-647. Retrived October 5, 2006, fromQuest database.
ISSN 2231-3265 International Journal of Health, Physical Education and Computer Science in Sports
Volume No.2, No.1.
79
pp79-84
Effect of Plyometric and Cycle Ergometer Training on Anaerobic ability of Basketballers
*Arvind S Sajwan,
Professor, LNUPE, Gwalior, Madhya Pradesh
**Satpal Yadav, Lecturer, LPU, Phagwara, Punjab
***Vinay Sharma, Scholar, LPU, Phagwara, Punjab
Abstract
The purpose of the present study was to determine effect of plyometric and cycle ergometer training on anaerobic ability of Basketballers. The subjects were 30 male shot putters of 14 to 18 years of age group from Montfort Senior Secondary School Roorkee (Uttrakhand). The subjects were randomly selected and were assigned to the two experimental groups (Plyometric, Cycle Ergometer) and one control group with 10 subjects in each group. The training was given for a period of 6 weeks. The two experimental groups were trained thrice a week, while the control group continued with their daily routine work. The anaerobic ability were selected for collecting data. The Pre and Post test were conducted to collect the data. After the collection of data, the t- test was used to identify any significant differences between the groups. An analysis of co-variance was also used to determine significant differences for the anaerobic ability. The LSD Post hoc test was used to identify significant differences between the training programs. The level of significance was 0.05. The finding have shown the significant value of F- ratio's for anaerobic ability of all the experimental groups i.e. plyometric and cycle ergometer training programs as compared with the control group. The plyometric training program proved better than the cycle ergometer training.
Key words: Plyometric, Cycle ergometer, Anaerobic Ability INTRODUCTION
The performance in most of the sports is determined by three factors namely physical fitness, technique and tactics. Strength is one such component which influences the performance and special attention has to be paid to it. There are three main form of Strength viz. Maximal strength, explosive strength and strength endurance. Strength may be developed in many ways such as weight lifting, bounding with or without resistance, various drills and of course depth jumping or plyometric. The word plyometric originally appeared in Russian sports literature in 1996 in work completed by V.M. Zaciorskij. A few other terms have been associated with plyometric as well including shock training, speed strength, bounce training and elastic reactivity. Plyometric training is a type of exercise designed to increase muscle power. It is best for sports persons such as, athletes, basketball players, footballers and sometimes boxers incorporate plyometric training into their training schedule, with the aim of adding additional explosive power to their game. Polymeric training can be so beneficial to basketball players are that, unlike standard weightlifting, they improve the explosion of the leg muscles rather than simply building strength and muscle mass. Players should incorporate basketball plyometrics into their workouts gradually and should be sure to include plenty of rest intervals in the workout so that the body can recover sufficiently between sets and between exercises. A stationary one-wheeled cycle used as an ergometer to measure a person's work output under controlled conditions. Cycle ergometer are not very good at measuring peak performances in people not used to cycling because the leg muscles usually fatigue before the rest of the body. An exercise device that enables the amount and rate of a person's physical work to be measured under controlled conditions. There are several different types of ergometer, each with its own particular advantages and disadvantages. The best ergometer for athletes is one which closely matches their training or
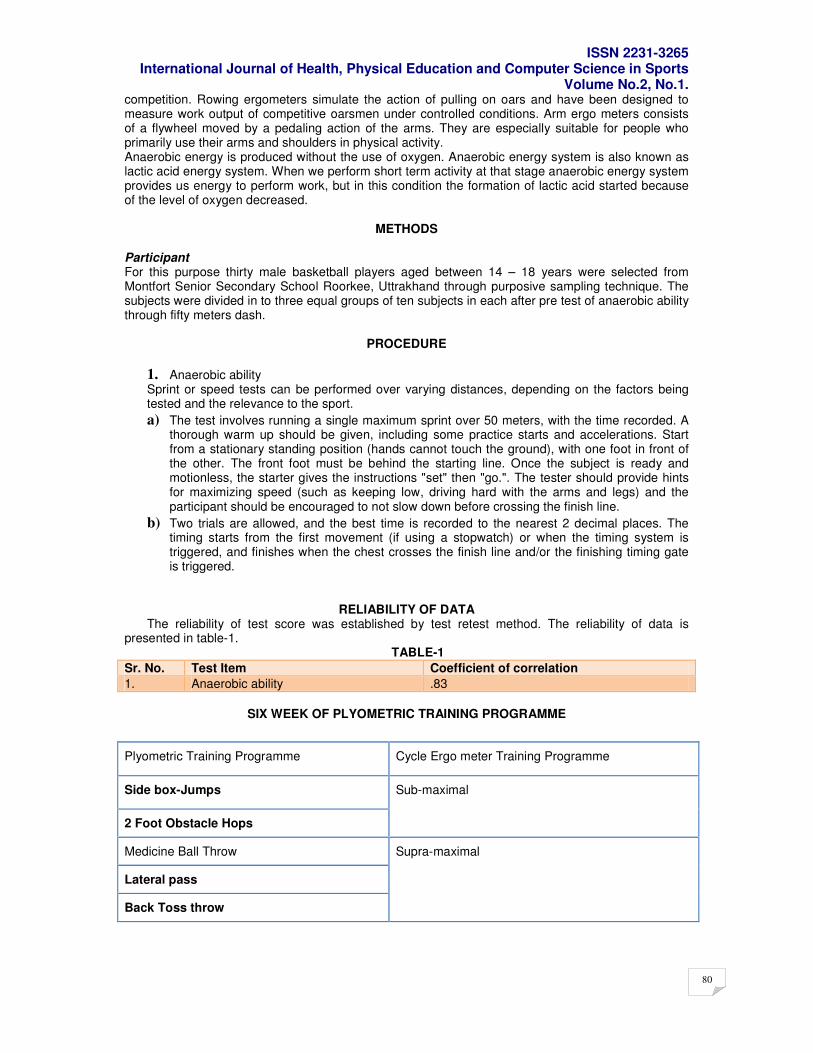
ISSN 2231-3265 International Journal of Health, Physical Education and Computer Science in Sports
Volume No.2, No.1.
80
competition. Rowing ergometers simulate the action of pulling on oars and have been designed to measure work output of competitive oarsmen under controlled conditions. Arm ergo meters consists of a flywheel moved by a pedaling action of the arms. They are especially suitable for people who primarily use their arms and shoulders in physical activity. Anaerobic energy is produced without the use of oxygen. Anaerobic energy system is also known as lactic acid energy system. When we perform short term activity at that stage anaerobic energy system provides us energy to perform work, but in this condition the formation of lactic acid started because of the level of oxygen decreased.
METHODS
Participant For this purpose thirty male basketball players aged between 14 – 18 years were selected from Montfort Senior Secondary School Roorkee, Uttrakhand through purposive sampling technique. The subjects were divided in to three equal groups of ten subjects in each after pre test of anaerobic ability through fifty meters dash.
PROCEDURE
1. Anaerobic ability Sprint or speed tests can be performed over varying distances, depending on the factors being tested and the relevance to the sport.
a) The test involves running a single maximum sprint over 50 meters, with the time recorded. A thorough warm up should be given, including some practice starts and accelerations. Start from a stationary standing position (hands cannot touch the ground), with one foot in front of the other. The front foot must be behind the starting line. Once the subject is ready and motionless, the starter gives the instructions "set" then "go.". The tester should provide hints for maximizing speed (such as keeping low, driving hard with the arms and legs) and the participant should be encouraged to not slow down before crossing the finish line.
b) Two trials are allowed, and the best time is recorded to the nearest 2 decimal places. The timing starts from the first movement (if using a stopwatch) or when the timing system is triggered, and finishes when the chest crosses the finish line and/or the finishing timing gate is triggered.
RELIABILITY OF DATA
The reliability of test score was established by test retest method. The reliability of data is presented in table-1.
TABLE-1
Sr. No. Test Item Coefficient of correlation
1. Anaerobic ability .83
SIX WEEK OF PLYOMETRIC TRAINING PROGRAMME
Plyometric Training Programme Cycle Ergo meter Training Programme
Side box-Jumps
2 Foot Obstacle Hops
Sub-maximal
Medicine Ball Throw
Lateral pass
Back Toss throw
Supra-maximal
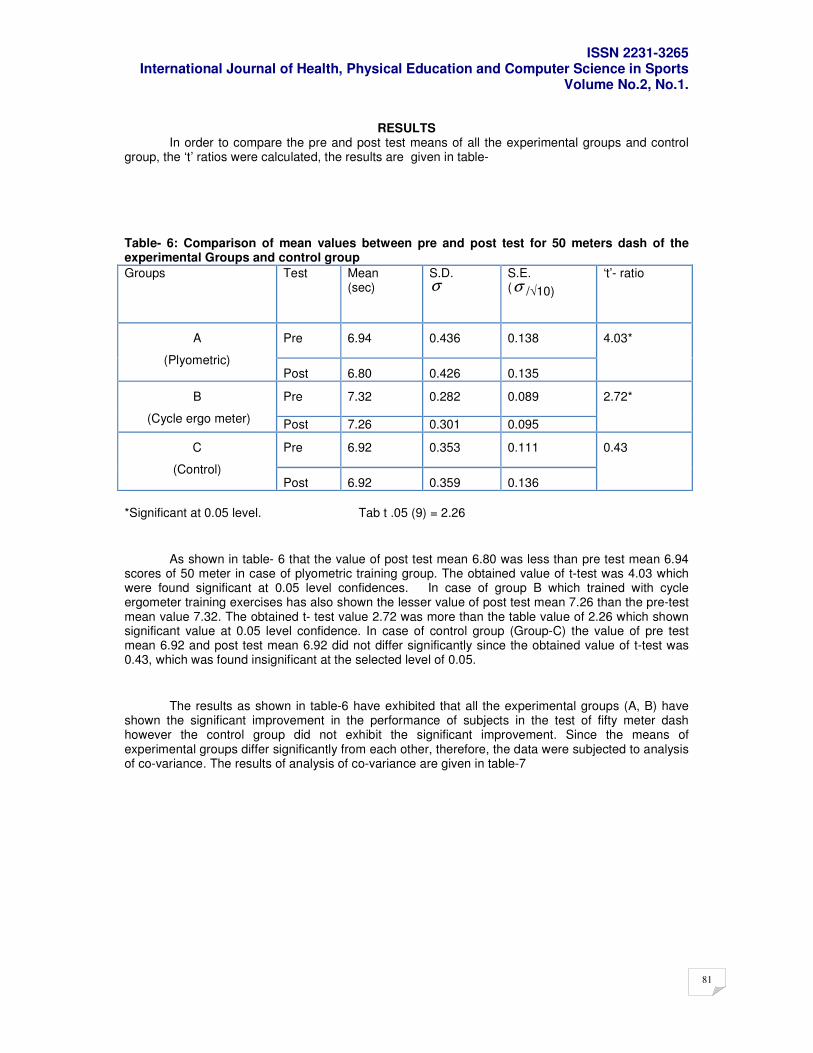
ISSN 2231-3265 International Journal of Health, Physical Education and Computer Science in Sports
Volume No.2, No.1.
81
RESULTS In order to compare the pre and post test means of all the experimental groups and control
group, the ‘t’ ratios were calculated, the results are given in table- Table- 6: Comparison of mean values between pre and post test for 50 meters dash of the experimental Groups and control group
Groups Test Mean (sec)
S.D. σ
S.E. (σ /√10)
‘t’- ratio
Pre 6.94 0.436 0.138 A
(Plyometric) Post 6.80 0.426 0.135
4.03*
Pre 7.32 0.282 0.089 B
(Cycle ergo meter) Post 7.26 0.301 0.095
2.72*
Pre 6.92 0.353 0.111 C
(Control) Post 6.92 0.359 0.136
0.43
*Significant at 0.05 level. Tab t .05 (9) = 2.26
As shown in table- 6 that the value of post test mean 6.80 was less than pre test mean 6.94 scores of 50 meter in case of plyometric training group. The obtained value of t-test was 4.03 which were found significant at 0.05 level confidences. In case of group B which trained with cycle ergometer training exercises has also shown the lesser value of post test mean 7.26 than the pre-test mean value 7.32. The obtained t- test value 2.72 was more than the table value of 2.26 which shown significant value at 0.05 level confidence. In case of control group (Group-C) the value of pre test mean 6.92 and post test mean 6.92 did not differ significantly since the obtained value of t-test was 0.43, which was found insignificant at the selected level of 0.05.
The results as shown in table-6 have exhibited that all the experimental groups (A, B) have
shown the significant improvement in the performance of subjects in the test of fifty meter dash however the control group did not exhibit the significant improvement. Since the means of experimental groups differ significantly from each other, therefore, the data were subjected to analysis of co-variance. The results of analysis of co-variance are given in table-7
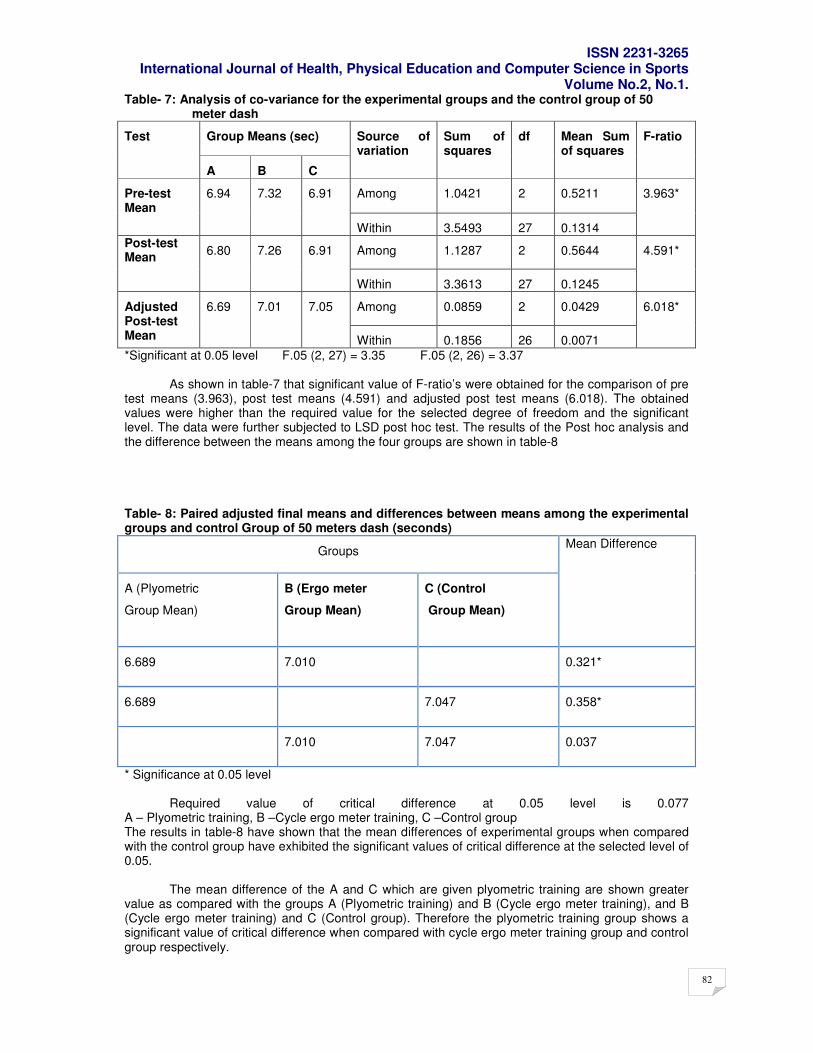
ISSN 2231-3265 International Journal of Health, Physical Education and Computer Science in Sports
Volume No.2, No.1.
82
Table- 7: Analysis of co-variance for the experimental groups and the control group of 50 meter dash
Group Means (sec) Test
A B C
Source of variation
Sum of squares
df Mean Sum of squares
F-ratio
Among 1.0421 2 0.5211 Pre-test Mean
6.94 7.32
6.91
Within 3.5493 27 0.1314
3.963*
Among 1.1287 2 0.5644 Post-test Mean
6.80 7.26 6.91
Within 3.3613 27 0.1245
4.591*
Among 0.0859 2 0.0429 Adjusted Post-test Mean
6.69 7.01 7.05
Within 0.1856 26 0.0071
6.018*
*Significant at 0.05 level F.05 (2, 27) = 3.35 F.05 (2, 26) = 3.37 As shown in table-7 that significant value of F-ratio’s were obtained for the comparison of pre
test means (3.963), post test means (4.591) and adjusted post test means (6.018). The obtained values were higher than the required value for the selected degree of freedom and the significant level. The data were further subjected to LSD post hoc test. The results of the Post hoc analysis and the difference between the means among the four groups are shown in table-8
Table- 8: Paired adjusted final means and differences between means among the experimental groups and control Group of 50 meters dash (seconds)
Groups
A (Plyometric
Group Mean)
B (Ergo meter
Group Mean)
C (Control
Group Mean)
Mean Difference
6.689 7.010 0.321*
6.689 7.047 0.358*
7.010 7.047 0.037
* Significance at 0.05 level
Required value of critical difference at 0.05 level is 0.077 A – Plyometric training, B –Cycle ergo meter training, C –Control group The results in table-8 have shown that the mean differences of experimental groups when compared with the control group have exhibited the significant values of critical difference at the selected level of 0.05.
The mean difference of the A and C which are given plyometric training are shown greater
value as compared with the groups A (Plyometric training) and B (Cycle ergo meter training), and B (Cycle ergo meter training) and C (Control group). Therefore the plyometric training group shows a significant value of critical difference when compared with cycle ergo meter training group and control group respectively.
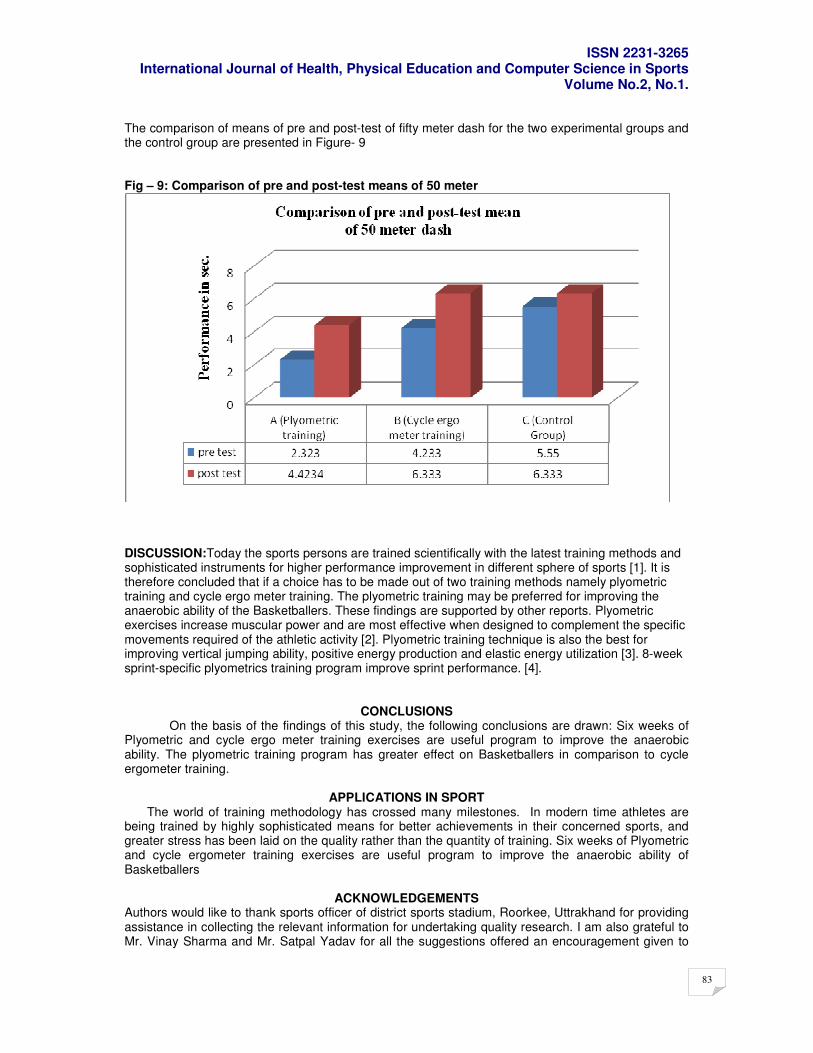
ISSN 2231-3265 International Journal of Health, Physical Education and Computer Science in Sports
Volume No.2, No.1.
83
The comparison of means of pre and post-test of fifty meter dash for the two experimental groups and the control group are presented in Figure- 9 Fig – 9: Comparison of pre and post-test means of 50 meter
DISCUSSION:Today the sports persons are trained scientifically with the latest training methods and sophisticated instruments for higher performance improvement in different sphere of sports [1]. It is therefore concluded that if a choice has to be made out of two training methods namely plyometric training and cycle ergo meter training. The plyometric training may be preferred for improving the anaerobic ability of the Basketballers. These findings are supported by other reports. Plyometric exercises increase muscular power and are most effective when designed to complement the specific movements required of the athletic activity [2]. Plyometric training technique is also the best for improving vertical jumping ability, positive energy production and elastic energy utilization [3]. 8-week sprint-specific plyometrics training program improve sprint performance. [4].
CONCLUSIONS On the basis of the findings of this study, the following conclusions are drawn: Six weeks of
Plyometric and cycle ergo meter training exercises are useful program to improve the anaerobic ability. The plyometric training program has greater effect on Basketballers in comparison to cycle ergometer training.
APPLICATIONS IN SPORT
The world of training methodology has crossed many milestones. In modern time athletes are being trained by highly sophisticated means for better achievements in their concerned sports, and greater stress has been laid on the quality rather than the quantity of training. Six weeks of Plyometric and cycle ergometer training exercises are useful program to improve the anaerobic ability of Basketballers
ACKNOWLEDGEMENTS
Authors would like to thank sports officer of district sports stadium, Roorkee, Uttrakhand for providing assistance in collecting the relevant information for undertaking quality research. I am also grateful to Mr. Vinay Sharma and Mr. Satpal Yadav for all the suggestions offered an encouragement given to
ISSN 2231-3265 International Journal of Health, Physical Education and Computer Science in Sports
Volume No.2, No.1.
84
me. My thanks are due to all the students who acted as a subject for the study. With their voluntary and wholehearted support could not have been completed.
REFERENCES
[1] Peter Arnold, (1972) Education, Physical Education and Personality Development, (London: Heinemann, Educational Books Ltd,), p.114. [2] Damon P.S. Andrew et. al., (2010) “Effects of Three modified plyometric depth jumps and per iodized weight training on lower extremity power” The Sport Journal, Vol. 13, No. 4, p.5 [3] D. JGehriet. al.,(1998) “A Comparison of Plyometric Training Techniques for Improving Vertical Jump Ability and Energy Production”, Journal of Strength and Conditioning Research, Vol.XII, No.02, pp.85-89. [4] Edwin R. et. al., (2000) “Effects of a Plyometrics Intervention Programme on Sprint Performance”, Journal of Strength and Conditioning Research, Vol.XIV, No.03, pp.295-301.
[5] Chu, D.A. (1991) “Jumping into Plyometric” Human Kinetics. European Journal of Scientific Research, 11(3):69-71.
ISSN 2231-3265 International Journal of Health, Physical Education and Computer Science in Sports
Volume No.2, No.1.
85
Pp85-86
Education & Knowledge creates an aura of creative in a teacher
Syed Farooq Kamal
L.P.E., St. Francis degree college for women.
Introduction: Education is the process of learning appropriate behavior by an individual for his effective functioning in his society and at the same time enhance his self fulfillment, that is to develop his potential and express to his utmost satisfaction. Such learning involve acquisition of knowledge (Concept) skill, and attitude. Thus Education has objectives to be achieved by mastering subjects selected for their potential outcomes matching the objectives. At the elementary School level the students do not have the capacity for theoretical study of cultural, motor movements (Physical Sports), though an organised programme of such practical has profound effect in their realisation of educational potential. Even at the higher level of education, the practical programme is of more importance though some basic theoretical studies has become essential for motivation and cultivation of desired attitude towards sports behaviour in human living. However, for teacher of physical education a good theoretical foundation of activity programme in physical education is essential. Thus teacher preparation in physical education include the knowledge content of the subject. Physical Education if we presume the skill content is mastered to some extent in General Education. Besides the methodology of teaching the subject, where as teacher preparation in other traditional academic subjects restrict to methodology of teaching specific subject besides general common concept of education, its organisation and history. THE LIFE IN EDUCATION : Productivity of any system is essentially the efficiency with which the system achieves the aims and objectives for which it is established. Consequently, every country need to pattern its educational system to promote, its unique socio-economic identity and also to meet the challenges of time.The dynamism of an educational institution can be measured from not only how fast is responds to the changes in the socio-economic environment but also by the effectiveness in creating conditions and atmosphere which would lead to changes in the right direction.Although the liberal education we offer at undergraduate level is not vocational training, it is claimed to be an excellent preparation for all careers but does it enable our graduates to analyse and solve practical problems of life?Colleges are expected to produce leadership in politics, administrations, the professional industry and commerce. They have to meet the increasing demand for every type of higher education, literary, scientific technical and professional. The National policy on Education has highlighted the role of Higher Education. "Higher education provides people with an opportunity to reflect on the critical, social, economic cultural, moral and spiritual issues facing humanity. It contributes to national development through dissemination of specialized knowledge and skills. It is therefore a crucial factor for survival. These onerous responsibilities are to be discharged by the universities through (1) undertaking research with a view to broaden the horizons of Human knowledge, develop technologies for speedier agricultural and industrial development. (2) Initiating and pursuing educational as well as training with a view to impart knowledge and information, imbibe the right kind of attitudes and outlook, inculcate proper values and develop skills and techniques. (3) Introducing extension programme to overcome the problems faced by the society such as population explosion,
ISSN 2231-3265 International Journal of Health, Physical Education and Computer Science in Sports
Volume No.2, No.1.
86
1) NEED FOR SPONTANEOUS EDUCATION: Explosion of knowledge due to rapid growth of science and technology had made man to search for an alternate system of education, to keep abreast of the latest developments to update his knowledge and skills to adjust to new environment and situations. Hence, the need for continuing education. Our need today is not so much for learned professors as for learning' professors. Most teachers stop learning after becoming teachers Rabindranath Tagore once remarked that "One cannot teach unless learning". Student want to drink from the clear water of a running stream and not from stagnant pools". Teachers become rapidly obsolete unless they constantly keep themselves abreast of the latest developments in their filed because knowledge is increasing in geometric progression. Therefore it is important that the teacher keeps himself informed of the latest development in his own field of study. 2) THE NEED FOR SUPPORT & CREATIVE EFFORTS: Another ingredient for the proper development of professional competence and academic excellence of a teacher is the intellectual climate in which he works, the atmosphere in the campus and his own department. In a college where the faculty have built up a tradition of intellectual inquiry, sustained hard-work frank and free discussion and dialogue, the junior staff member would naturally develop academic abilities and teaching skills under the guidance of their senior colleagues frequent /periodic departmental meeting will be useful, where academic matters pertaining to the particular discipline as well as these of a general nature could be discussed and ideas exchanged improved methods of teaching and evaluation, use of teaching aids, innovative project independent study or research project carried out by individual teacher as well as groups could be - discussed. If freedom of expression is ensured, these faculty meeting could prove to be to become real academic training field. 3) THE NEED FOR ENCOURAGING & IMPROVISING THE PERFORMANCES OF THE
RESEARCH STUDENT : The kothari commission reports that in most of the colleges today "There is little enthusiasm for learning or discovery of new truths because research is not considered an integral part of their duties and whatever research is done is usually of an in convincing quality. In the absence of a research oriented atmosphere, even the intellectually ambitious younger members are soon caught up in the general atmosphere of indifference and cynicism". The college must train the students to think rationally, which is basic for research so that the future citizen of India would be physically intellectually and mentally sound individuals able to contribute to productivity to the building of a democratic and self sufficient India.
4) THE NEED FOR INNOVATIVE COLLECTIVELY SUSTAINING HIGH PERFORMANCES IN
TEACHING & LEARNING ORGANIZATIONS
It is a common knowledge that innovation and experimentation are the foundation stones of progress. However, innovation and experimentation will be no avail if it is not supported and nutured by skilled personnel who are forward looking. Teachers can help in updating knowledge developed globally, acting as channels of communication for the interflow of innovation, adopting knowledge and / or modifying them to suit one's own needs.Knowledge perse loses it relevance, unless, it is approximately disseminated for application to the benefit of the society. Teachers therefore, must help to bridge the gap between theoretical and practical approaches and generate close inter action between the academic and the society. All kinds extension programme are example of successful application of knowledge where there is great scope of innovation and experimentation.Since a teacher's responsibility involves not merely training his students intellectually by also helping them grow morally, physically and spiritually as well, a good teacher should possess besides professional competence, intellectual integrity\, a spontaneity of concern that inspires confidence and an easy informality that promotes companionship. In the present situation, the teaching learning process has to undergo a change. _As there are identifiable characteristics of a learner, there are also certain abilities required on the part of the teacher. 1.In the light of new experiences learners are exposed to, the teacher needs to acquire new skills, abilities continuously. 2.In view of the varied kinds of student characteristics, teachers need to experiment with and use different techniques, approaches and types of lessons.
ISSN 2231-3265 International Journal of Health, Physical Education and Computer Science in Sports
Volume No.2, No.1.
87
pp87-89
Efficacy of intensive and extensive interval training and its cessation on selected speed parameters
*Mr. K. Rajasekhar and **Dr.P.Johnson * Research Scholar & **Assistant Professor,
University College of Physical Education & Sports Sciences, Acharya Nagarjuna University, Guntur, Andhra Pradesh, India.
Abstract
The objective of this study was to determine the efficiency of intensive and extensive interval training and detraining on selected speed parameters. To achieve the purpose of the study 45 male students were randomly selected and segregated them into three groups of 15 each. Speed, speed endurance and anaerobic power were considered as criterion variables, and these variables were assessed prior to and immediately after 12 weeks of training and also during the period of cessation of experimental treatment for 40 days at an interval of every 10 days, from intensive and extensive interval training groups and control group. The data collected was analyzed statistically using analysis of covariance and 3 x 5 factorial ANOVA with last factor repeated measures. The results of the study revealed that there was significant improvement on selected speed parameters, and the findings also showed that there was a significant decrease during the detraining period.
Introduction :Scientific training methods and application of basic principles of body mechanics in sports skill have been attributed to the higher level of performance in sports skills. Performance is the combined result of coordinated exertion and integration of a variety of functions. Although genetic factors environment and geographic location have an important role in performance, to certain extent performance depends upon the physical and motor fitness qualities in which definite improvement can be achieved through appropriate training (Boucher and Malina, 1999).Sports’ training is a programme of exercise designed to improve the skills and increase the energy capacities of an athlete for a particular event. These basic training procedures will serve better when utilized with modifications suited to individuals or a group dealt with. Sports activities consist of motor movement and action and their success depends to a great extent on how correctly they are performed. Techniques of training and improvement of tactical efficiency play a vital role in a training process (Fox, 1984).One method of training that allows appropriate metabolic systems to be stressed is interval training. Interval training is based on the concept that more work can be performed at higher exercise intensities with the same or less fatigue compared to continuous running. The theoretical metabolic profile for exercise and rest intervals stressing anaerobic metabolism, fast glycolysis and phosphogen system is based on the knowledge of which energy systems predominate during exercise and time of substrate recovery. By choosing appropriate exercise intensities, exercise duration and rest interval, the appropriate energy systems can be trained (Baechle, 1994)..
Method Participants
Forty-five male students (age 17 ± 0.6 years, height 1.63 ± 4 cm and weight 59 ± 2 kg) were recruited for this study. After being fully informed of the risk associated with the study, the subjects gave their written informed consent to participate. The qualified medical officer examined the subjects and certified that they were fit enough to undergo the experimental protocol.
Training Regimen
The selected subjects were randomly segregated into three groups of 15 each. The group I underwent intensive interval training, group II underwent extensive interval training and group III acted as control. The duration of the training programme was 12 weeks with three sessions per week on alternative days. The training load for intensive and extensive interval training groups was 80-95% and 65-80% respectively. After 10 to 15 minutes of warm up at self selected workload, the subjects
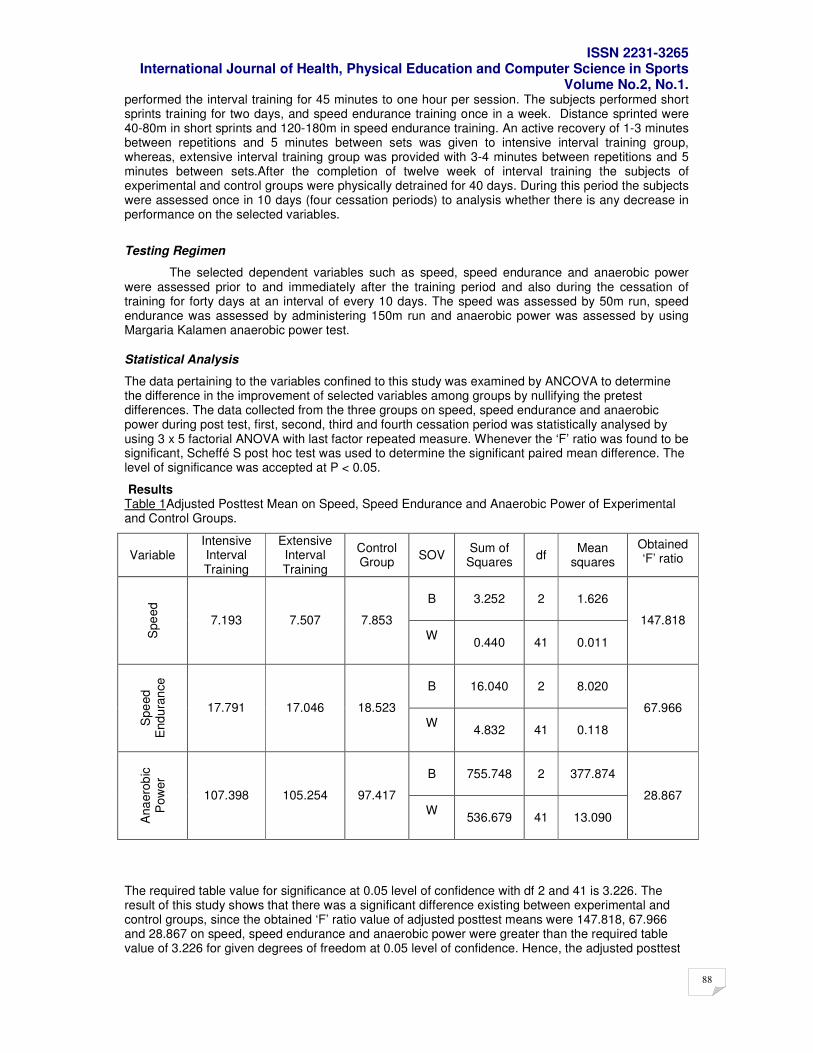
ISSN 2231-3265 International Journal of Health, Physical Education and Computer Science in Sports
Volume No.2, No.1.
88
performed the interval training for 45 minutes to one hour per session. The subjects performed short sprints training for two days, and speed endurance training once in a week. Distance sprinted were 40-80m in short sprints and 120-180m in speed endurance training. An active recovery of 1-3 minutes between repetitions and 5 minutes between sets was given to intensive interval training group, whereas, extensive interval training group was provided with 3-4 minutes between repetitions and 5 minutes between sets.After the completion of twelve week of interval training the subjects of experimental and control groups were physically detrained for 40 days. During this period the subjects were assessed once in 10 days (four cessation periods) to analysis whether there is any decrease in performance on the selected variables.
Testing Regimen
The selected dependent variables such as speed, speed endurance and anaerobic power were assessed prior to and immediately after the training period and also during the cessation of training for forty days at an interval of every 10 days. The speed was assessed by 50m run, speed endurance was assessed by administering 150m run and anaerobic power was assessed by using Margaria Kalamen anaerobic power test.
Statistical Analysis
The data pertaining to the variables confined to this study was examined by ANCOVA to determine the difference in the improvement of selected variables among groups by nullifying the pretest differences. The data collected from the three groups on speed, speed endurance and anaerobic power during post test, first, second, third and fourth cessation period was statistically analysed by using 3 x 5 factorial ANOVA with last factor repeated measure. Whenever the ‘F’ ratio was found to be significant, Scheffé S post hoc test was used to determine the significant paired mean difference. The level of significance was accepted at P < 0.05.
Results Table 1Adjusted Posttest Mean on Speed, Speed Endurance and Anaerobic Power of Experimental and Control Groups.
Variable Intensive Interval Training
Extensive Interval Training
Control Group
SOV Sum of
Squares df
Mean squares
Obtained ‘F’ ratio
B
3.252
2
1.626
Spe
ed
7.193 7.507 7.853
W
0.440
41
0.011
147.818
B
16.040
2
8.020
Spe
ed
End
ura
nce
17.791 17.046 18.523
W
4.832
41
0.118
67.966
B
755.748
2
377.874
Ana
ero
bic
P
ow
er
107.398 105.254 97.417
W
536.679
41
13.090
28.867
The required table value for significance at 0.05 level of confidence with df 2 and 41 is 3.226. The result of this study shows that there was a significant difference existing between experimental and control groups, since the obtained ‘F’ ratio value of adjusted posttest means were 147.818, 67.966 and 28.867 on speed, speed endurance and anaerobic power were greater than the required table value of 3.226 for given degrees of freedom at 0.05 level of confidence. Hence, the adjusted posttest
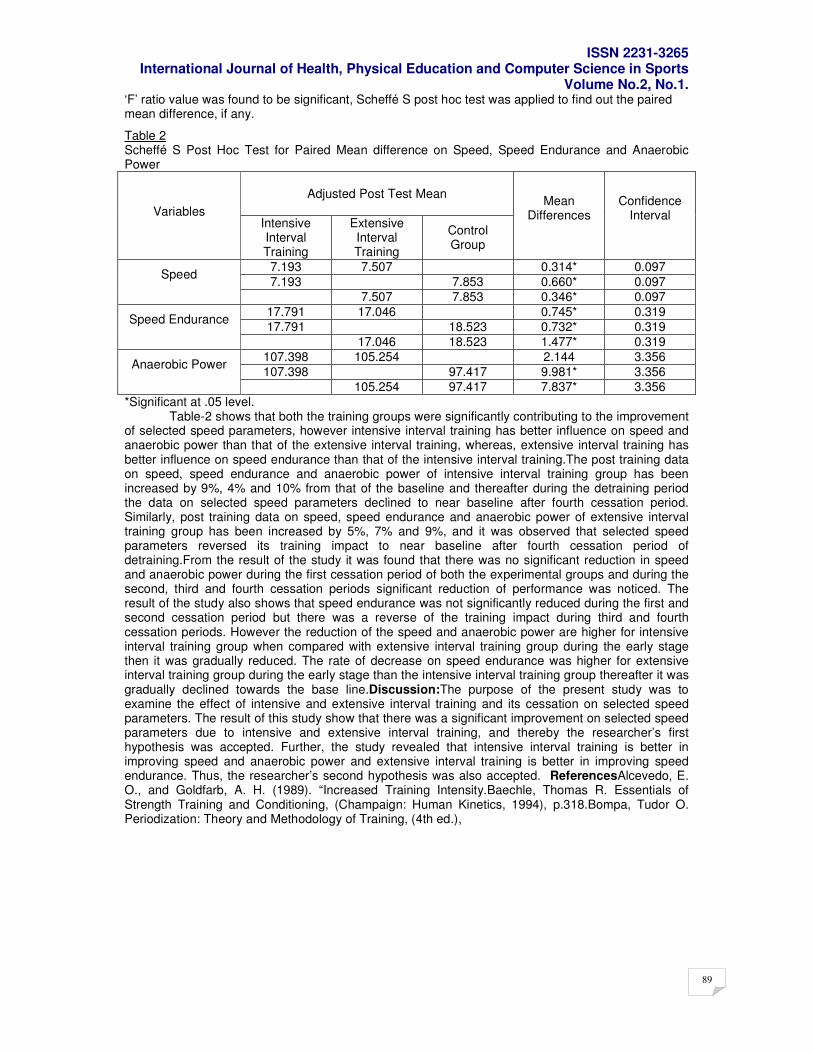
ISSN 2231-3265 International Journal of Health, Physical Education and Computer Science in Sports
Volume No.2, No.1.
89
‘F’ ratio value was found to be significant, Scheffé S post hoc test was applied to find out the paired mean difference, if any.
Table 2 Scheffé S Post Hoc Test for Paired Mean difference on Speed, Speed Endurance and Anaerobic Power
Adjusted Post Test Mean
Variables Intensive Interval Training
Extensive Interval Training
Control Group
Mean Differences
Confidence Interval
7.193 7.507 0.314* 0.097
7.193 7.853 0.660* 0.097 Speed
7.507 7.853 0.346* 0.097
17.791 17.046 0.745* 0.319
17.791 18.523 0.732* 0.319 Speed Endurance
17.046 18.523 1.477* 0.319
107.398 105.254 2.144 3.356
107.398 97.417 9.981* 3.356 Anaerobic Power
105.254 97.417 7.837* 3.356
*Significant at .05 level. Table-2 shows that both the training groups were significantly contributing to the improvement
of selected speed parameters, however intensive interval training has better influence on speed and anaerobic power than that of the extensive interval training, whereas, extensive interval training has better influence on speed endurance than that of the intensive interval training.The post training data on speed, speed endurance and anaerobic power of intensive interval training group has been increased by 9%, 4% and 10% from that of the baseline and thereafter during the detraining period the data on selected speed parameters declined to near baseline after fourth cessation period. Similarly, post training data on speed, speed endurance and anaerobic power of extensive interval training group has been increased by 5%, 7% and 9%, and it was observed that selected speed parameters reversed its training impact to near baseline after fourth cessation period of detraining.From the result of the study it was found that there was no significant reduction in speed and anaerobic power during the first cessation period of both the experimental groups and during the second, third and fourth cessation periods significant reduction of performance was noticed. The result of the study also shows that speed endurance was not significantly reduced during the first and second cessation period but there was a reverse of the training impact during third and fourth cessation periods. However the reduction of the speed and anaerobic power are higher for intensive interval training group when compared with extensive interval training group during the early stage then it was gradually reduced. The rate of decrease on speed endurance was higher for extensive interval training group during the early stage than the intensive interval training group thereafter it was gradually declined towards the base line.Discussion:The purpose of the present study was to examine the effect of intensive and extensive interval training and its cessation on selected speed parameters. The result of this study show that there was a significant improvement on selected speed parameters due to intensive and extensive interval training, and thereby the researcher’s first hypothesis was accepted. Further, the study revealed that intensive interval training is better in improving speed and anaerobic power and extensive interval training is better in improving speed endurance. Thus, the researcher’s second hypothesis was also accepted. ReferencesAlcevedo, E. O., and Goldfarb, A. H. (1989). “Increased Training Intensity.Baechle, Thomas R. Essentials of Strength Training and Conditioning, (Champaign: Human Kinetics, 1994), p.318.Bompa, Tudor O. Periodization: Theory and Methodology of Training, (4th ed.),

ISSN 2231-3265 International Journal of Health, Physical Education and Computer Science in Sports
Volume No.2, No.1.
90
Pp90-94
Periodical assessment for two-year of systematic hockey academy training program on aerobic capacity
* Mrs. V. Hymavathi and **Dr. P. Johnson * Research Scholar & **Assistant Professor,
University College of Physical Education & Sports Sciences, Acharya Nagarjuna University, Guntur, Andhra Pradesh, India.
Abstract The purpose of this study was to examine the effect of an entire season of systematic hockey
academy training program for two years on aerobic capacity. For this purpose, a total of twenty three boys from RDT Hockey Academy, Anantapur, Andhra Pradesh, were considered. The age of the selected subjects were ranged between 15 to 18 years. The training regimen lasted for one year was assessed on four times (T1, T2, T3 and T4) for every three months. Two-way repeated ANOVA was computed to establish degree of significant difference between data collected during the academic year 2007-08 and 2008-09. In aerobic capacity periodical evaluation year (F = 20.75, p < 0.001), testing session (F = 5.026, p < 0.003) and interaction (F = 24.53, p < 0.001) found significant. The post hoc test revealed that when testing sessions are compared between two years showed significant differences on T1, T3 and T4. The aerobic capacity showed significant improvement from first year to second year about 4.07%, 5.68% and 3.42% ml/kg/min. Post hoc test also show that during the year (2007 – 08) changes in aerobic capacity noticed between T1-T4, this shows that aerobic capacity increases toward the end of the season by 5.13% ml/kg/min. It also showed that during the year (2008 – 09) changes in aerobic capacity noticed between T1-T3, T1-T4, T2-T3 and T2-T4 were 4.78%, 4.50%, 6.27%, and 6.06% respectively, this also shows that aerobic capacity increases toward the end of the season. The findings of the study reveals that two years of systematic hockey academy training program had a considerable amplification on aerobic capacity. Key Words: VO2 max, aerobic capacity, 1.5mile run, two-way repeated measure ANOVA.
Introduction Field hockey is a sport with a long history that has undergone quite rapid and radical changes. The advent of the synthetic playing surface has changed the technical, tactical and physiological requirements of the game at all levels, but in particular at the elite level. To achieve the best possible performance, the training has to be formulated according to the principles of periodization (Bompa, 1999). The training induced changes observed in various parameters can be attributed to appropriate load dynamics. This study was focused on the field hockey players as the game is popular and played through out the world. The anthropometric, physiological and biochemical variables have important role for the evaluation of training of the athletes. Studies on these parameters of field hockey players particularly in the RDT Hockey Academy, Anantapur, Andhra Pradesh age group are lacking in India. In view of the above, a study was undertaken to investigate the effect of two entire season of systematic hockey academy training program on aerobic capacity of boys.
Methods Subjects and training The subjects employed in the present study were twenty three male Hockey players from the RDT Hockey Academy, Anantapur, Andhra Pradesh (Mean ± SD: Age 16.5 ± 1.5 years, Height 168.7 ± 7.9 cm, Body Mass 65.9 ± 6.1 kg) preparing for the 2008 - 09 district and state Championship. All the players had been part of the team for a minimum of 2 years. In this study players provided written, informed consent to participate. After taking the base line data (BD, zero level) the players went through a training programme. The training sessions were divided into two phases Preparatory Phase and Competitive Phase. In Preparatory general and specific phases of training was carried out with duration of 6 months and competitive phase for 3 months. The volume and intensities of the training components also varies in each phase of training. In the preparatory phase, the volume and intensity of training increased gradually. On the other hand, in the competitive phase the training volume and intensity was changed according to the competition schedule. At the same time highly specified training related to field hockey and practice match play was followed in the competitive phase. The players generally completed an average of 2 hours of training in morning sessions, which was mostly performed to
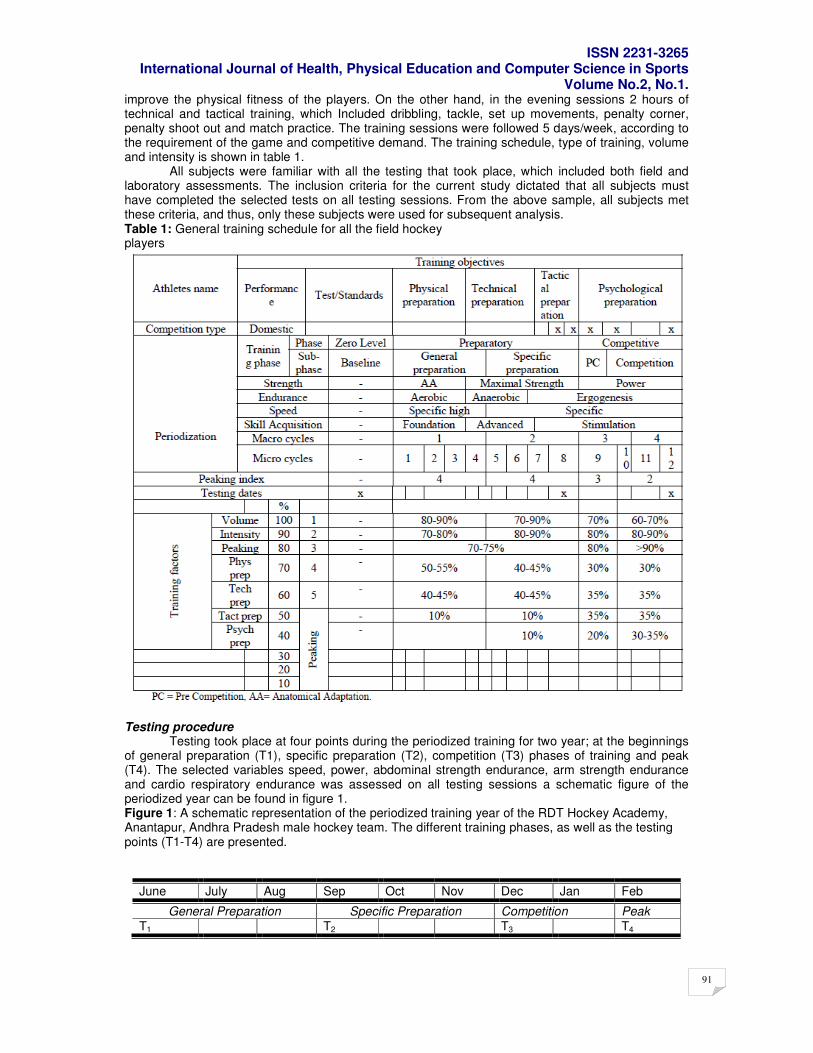
ISSN 2231-3265 International Journal of Health, Physical Education and Computer Science in Sports
Volume No.2, No.1.
91
improve the physical fitness of the players. On the other hand, in the evening sessions 2 hours of technical and tactical training, which Included dribbling, tackle, set up movements, penalty corner, penalty shoot out and match practice. The training sessions were followed 5 days/week, according to the requirement of the game and competitive demand. The training schedule, type of training, volume and intensity is shown in table 1. All subjects were familiar with all the testing that took place, which included both field and laboratory assessments. The inclusion criteria for the current study dictated that all subjects must have completed the selected tests on all testing sessions. From the above sample, all subjects met these criteria, and thus, only these subjects were used for subsequent analysis. Table 1: General training schedule for all the field hockey players
Testing procedure Testing took place at four points during the periodized training for two year; at the beginnings of general preparation (T1), specific preparation (T2), competition (T3) phases of training and peak (T4). The selected variables speed, power, abdominal strength endurance, arm strength endurance and cardio respiratory endurance was assessed on all testing sessions a schematic figure of the periodized year can be found in figure 1. Figure 1: A schematic representation of the periodized training year of the RDT Hockey Academy, Anantapur, Andhra Pradesh male hockey team. The different training phases, as well as the testing points (T1-T4) are presented.
June July Aug Sep Oct Nov Dec Jan Feb
General Preparation Specific Preparation Competition Peak T1 T2 T3 T4
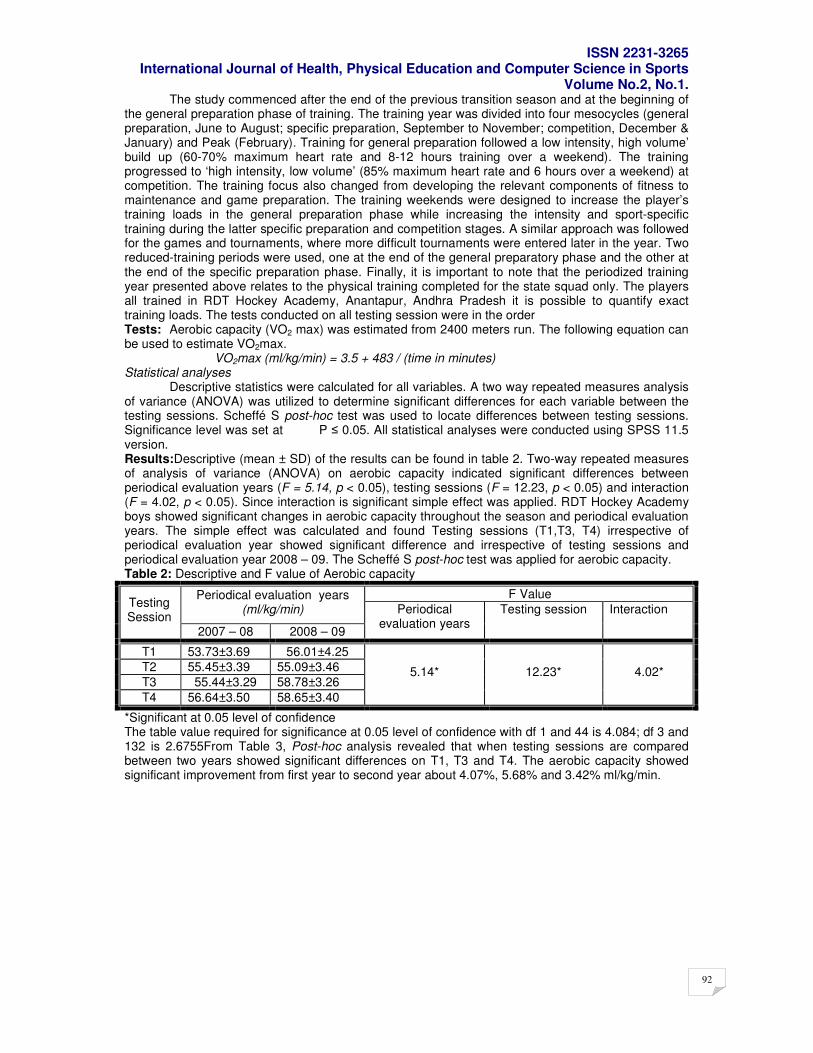
ISSN 2231-3265 International Journal of Health, Physical Education and Computer Science in Sports
Volume No.2, No.1.
92
The study commenced after the end of the previous transition season and at the beginning of the general preparation phase of training. The training year was divided into four mesocycles (general preparation, June to August; specific preparation, September to November; competition, December & January) and Peak (February). Training for general preparation followed a low intensity, high volume’ build up (60-70% maximum heart rate and 8-12 hours training over a weekend). The training progressed to ‘high intensity, low volume’ (85% maximum heart rate and 6 hours over a weekend) at competition. The training focus also changed from developing the relevant components of fitness to maintenance and game preparation. The training weekends were designed to increase the player’s training loads in the general preparation phase while increasing the intensity and sport-specific training during the latter specific preparation and competition stages. A similar approach was followed for the games and tournaments, where more difficult tournaments were entered later in the year. Two reduced-training periods were used, one at the end of the general preparatory phase and the other at the end of the specific preparation phase. Finally, it is important to note that the periodized training year presented above relates to the physical training completed for the state squad only. The players all trained in RDT Hockey Academy, Anantapur, Andhra Pradesh it is possible to quantify exact training loads. The tests conducted on all testing session were in the order Tests: Aerobic capacity (VO2 max) was estimated from 2400 meters run. The following equation can be used to estimate VO2max. VO2max (ml/kg/min) = 3.5 + 483 / (time in minutes) Statistical analyses Descriptive statistics were calculated for all variables. A two way repeated measures analysis of variance (ANOVA) was utilized to determine significant differences for each variable between the testing sessions. Scheffé S post-hoc test was used to locate differences between testing sessions. Significance level was set at P ≤ 0.05. All statistical analyses were conducted using SPSS 11.5 version. Results:Descriptive (mean ± SD) of the results can be found in table 2. Two-way repeated measures of analysis of variance (ANOVA) on aerobic capacity indicated significant differences between periodical evaluation years (F = 5.14, p < 0.05), testing sessions (F = 12.23, p < 0.05) and interaction (F = 4.02, p < 0.05). Since interaction is significant simple effect was applied. RDT Hockey Academy boys showed significant changes in aerobic capacity throughout the season and periodical evaluation years. The simple effect was calculated and found Testing sessions (T1,T3, T4) irrespective of periodical evaluation year showed significant difference and irrespective of testing sessions and periodical evaluation year 2008 – 09. The Scheffé S post-hoc test was applied for aerobic capacity. Table 2: Descriptive and F value of Aerobic capacity
*Significant at 0.05 level of confidence The table value required for significance at 0.05 level of confidence with df 1 and 44 is 4.084; df 3 and 132 is 2.6755From Table 3, Post-hoc analysis revealed that when testing sessions are compared between two years showed significant differences on T1, T3 and T4. The aerobic capacity showed significant improvement from first year to second year about 4.07%, 5.68% and 3.42% ml/kg/min.
F Value Periodical evaluation years (ml/kg/min)
Testing Session
2007 – 08 2008 – 09
Periodical evaluation years
Testing session
Interaction
T1 53.73±3.69 56.01±4.25
T2 55.45±3.39 55.09±3.46
T3 55.44±3.29 58.78±3.26
T4 56.64±3.50 58.65±3.40
5.14* 12.23* 4.02*
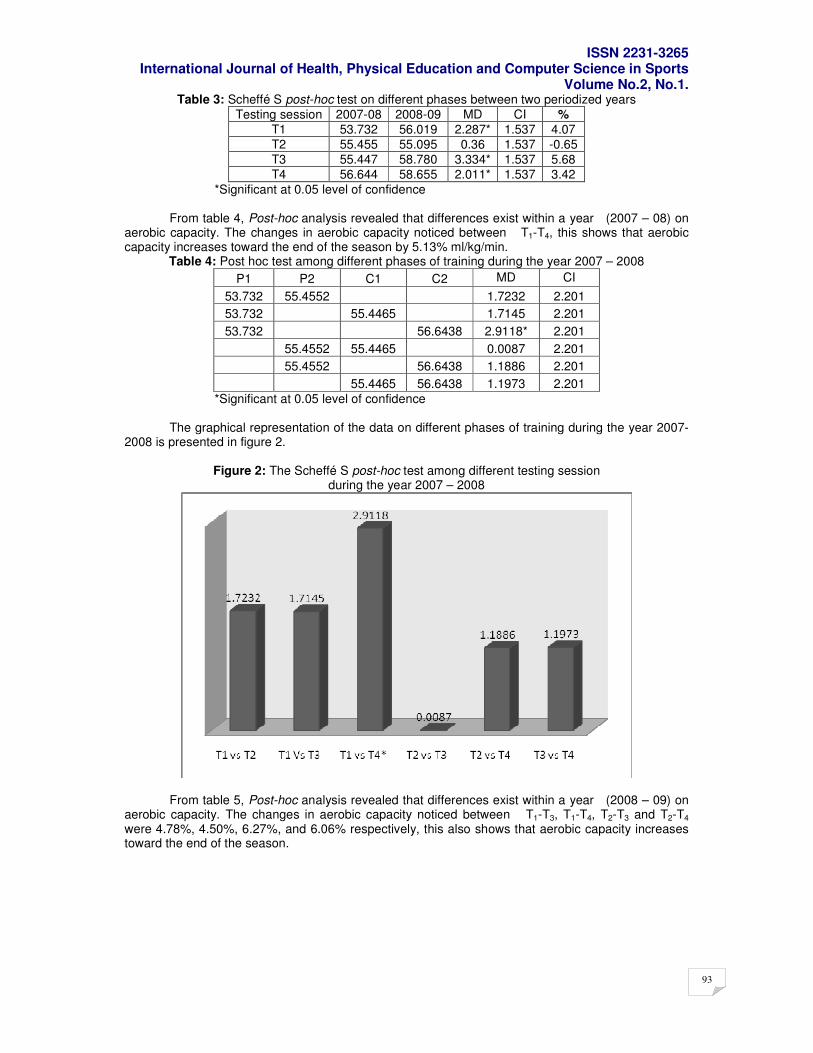
ISSN 2231-3265 International Journal of Health, Physical Education and Computer Science in Sports
Volume No.2, No.1.
93
Table 3: Scheffé S post-hoc test on different phases between two periodized years
Testing session 2007-08 2008-09 MD CI %
T1 53.732 56.019 2.287* 1.537 4.07
T2 55.455 55.095 0.36 1.537 -0.65
T3 55.447 58.780 3.334* 1.537 5.68
T4 56.644 58.655 2.011* 1.537 3.42
*Significant at 0.05 level of confidence From table 4, Post-hoc analysis revealed that differences exist within a year (2007 – 08) on aerobic capacity. The changes in aerobic capacity noticed between T1-T4, this shows that aerobic capacity increases toward the end of the season by 5.13% ml/kg/min.
Table 4: Post hoc test among different phases of training during the year 2007 – 2008
P1 P2 C1 C2 MD CI
53.732 55.4552 1.7232 2.201
53.732 55.4465 1.7145 2.201
53.732 56.6438 2.9118* 2.201
55.4552 55.4465 0.0087 2.201
55.4552 56.6438 1.1886 2.201
55.4465 56.6438 1.1973 2.201
*Significant at 0.05 level of confidence
The graphical representation of the data on different phases of training during the year 2007-2008 is presented in figure 2.
Figure 2: The Scheffé S post-hoc test among different testing session
during the year 2007 – 2008
From table 5, Post-hoc analysis revealed that differences exist within a year (2008 – 09) on aerobic capacity. The changes in aerobic capacity noticed between T1-T3, T1-T4, T2-T3 and T2-T4 were 4.78%, 4.50%, 6.27%, and 6.06% respectively, this also shows that aerobic capacity increases toward the end of the season.
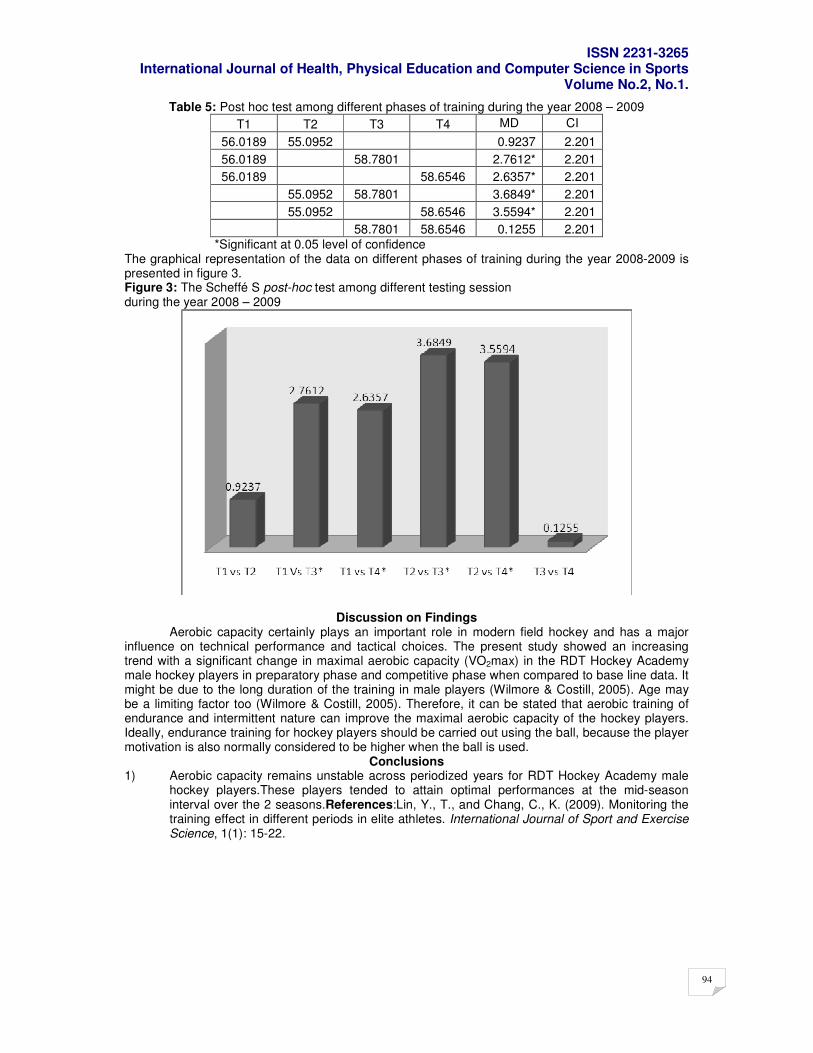
ISSN 2231-3265 International Journal of Health, Physical Education and Computer Science in Sports
Volume No.2, No.1.
94
Table 5: Post hoc test among different phases of training during the year 2008 – 2009
T1 T2 T3 T4 MD CI
56.0189 55.0952 0.9237 2.201
56.0189 58.7801 2.7612* 2.201
56.0189 58.6546 2.6357* 2.201
55.0952 58.7801 3.6849* 2.201
55.0952 58.6546 3.5594* 2.201
58.7801 58.6546 0.1255 2.201
*Significant at 0.05 level of confidence The graphical representation of the data on different phases of training during the year 2008-2009 is presented in figure 3. Figure 3: The Scheffé S post-hoc test among different testing session during the year 2008 – 2009
Discussion on Findings Aerobic capacity certainly plays an important role in modern field hockey and has a major influence on technical performance and tactical choices. The present study showed an increasing trend with a significant change in maximal aerobic capacity (VO2max) in the RDT Hockey Academy male hockey players in preparatory phase and competitive phase when compared to base line data. It might be due to the long duration of the training in male players (Wilmore & Costill, 2005). Age may be a limiting factor too (Wilmore & Costill, 2005). Therefore, it can be stated that aerobic training of endurance and intermittent nature can improve the maximal aerobic capacity of the hockey players. Ideally, endurance training for hockey players should be carried out using the ball, because the player motivation is also normally considered to be higher when the ball is used.
Conclusions 1) Aerobic capacity remains unstable across periodized years for RDT Hockey Academy male
hockey players.These players tended to attain optimal performances at the mid-season interval over the 2 seasons.References:Lin, Y., T., and Chang, C., K. (2009). Monitoring the training effect in different periods in elite athletes. International Journal of Sport and Exercise Science, 1(1): 15-22.
ISSN 2231-3265 International Journal of Health, Physical Education and Computer Science in Sports
Volume No.2, No.1.
95
pp95-97
An academic approach to Physical Education
Sundar Raj Urs,
Associate Professor, Dept. of Phy.Edn. Bangalore University
Introduction
For more than a century, Physical Education has been a fundamental part of the Indian Society. Education contributes to the development, advancement and perpetuation of the nation’s culture. Education must meet the challenges present in the society. Our nation’s schools and colleges should be concerned with the well- being of the individual student in his preparation for a productive, long and happy life in which his potentialities as an individual are enlarged and fulfilled and where his freedom will be assured. Physical Education, as a phase of the total educational process, helps in realizing these purposes. The effective physical education programme helps the students to understand and appreciate the value of good as a means of achieving their greatest productivity, effectiveness and happiness as individuals. In the past physical education has achieved only low educational status and a low degree of academic responsibility because it has emphasized the physical rather than the academic aspects and that physical education has been ‘too far removed from the main educational stream’ Physical Education must be identified as an important part of the education of each student. A new approach to physical education has been introduced and this new approach has been classified as an ‘Academic approach to physical education. This new approach of physical education relates to such concepts as academic achievement, learning and knowledge, as well as to skill and physical well-being.
ACADEMICS Origin: Academia is a collective term for the scientific and cultural community engaged in higher education and research taken as a whole. The word comes from the ‘akademeia’ just outside ancient Athens, where the gymnasium was made famous by Plato as a center of learning. Definition: An ‘academic term’ is a division of an academic year, the time during which a school, college or university holds classes. These divisions may be called terms. Meaning: An academic discipline is a branch of knowledge, which is taught and researched at the college or university level. The academic discipline of physical education (often styled variously as kinesiology, human performance etc.) is taught as a field of study at the undergraduate and graduate levels in colleges and universities around the world. Both teaching and non-teaching degree programmes are offered through the doctoral level. Physical Education as an Academic Programme In the United States, teacher preparation in physical education originally had close links to medicine. A programme of study would commonly include anatomy, physiology, health, first-aid, history and philosophy, educational, psychology and various physical skills-from gymnastics through dance, games and sport. A sports engineering is one of the most attractive professional preparation programme in the United Kingdom. The programme consists of Bio-Mechanics, Laws & principles of Physics, Kin anthropometry & Kinesiology apart from structural engineering and other aspects. Physical activity, sport and recreation programmes are delivered in many locations including home from infancy, schools through university; the work place; and communities. The adult population engages in physical activity through the time immemorial for health, cultural and social purposes
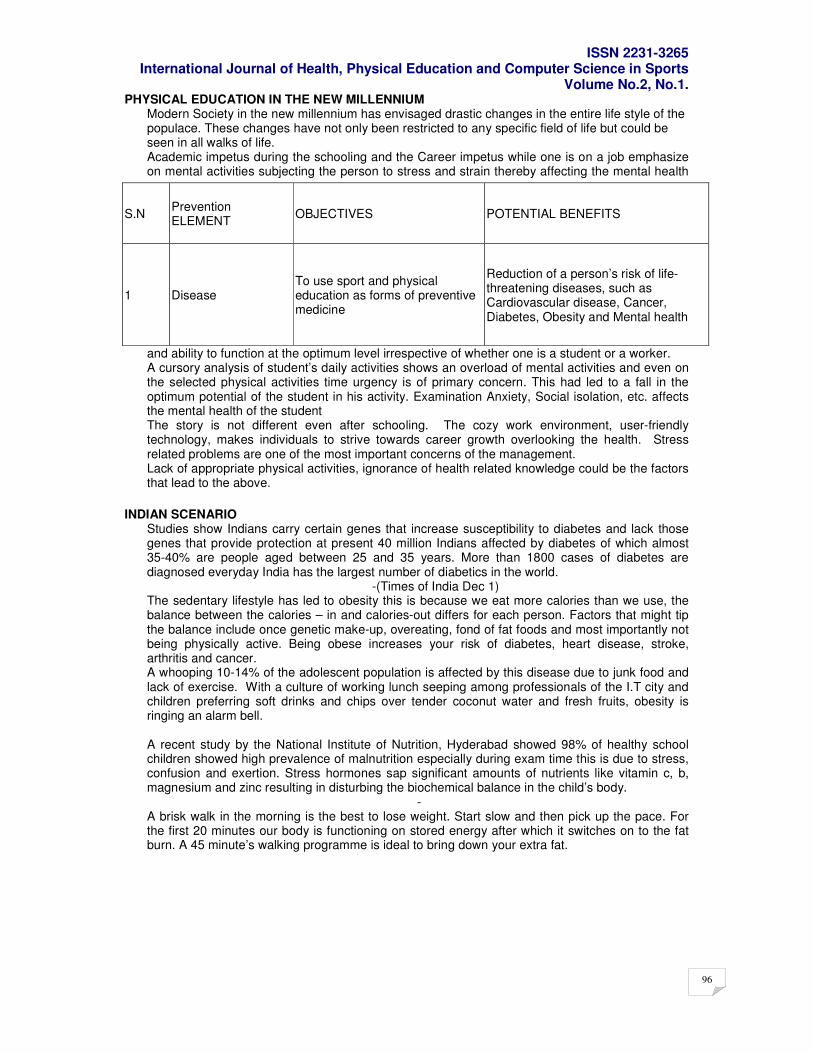
ISSN 2231-3265 International Journal of Health, Physical Education and Computer Science in Sports
Volume No.2, No.1.
96
PHYSICAL EDUCATION IN THE NEW MILLENNIUM Modern Society in the new millennium has envisaged drastic changes in the entire life style of the populace. These changes have not only been restricted to any specific field of life but could be seen in all walks of life. Academic impetus during the schooling and the Career impetus while one is on a job emphasize on mental activities subjecting the person to stress and strain thereby affecting the mental health
and ability to function at the optimum level irrespective of whether one is a student or a worker. A cursory analysis of student’s daily activities shows an overload of mental activities and even on the selected physical activities time urgency is of primary concern. This had led to a fall in the optimum potential of the student in his activity. Examination Anxiety, Social isolation, etc. affects the mental health of the student The story is not different even after schooling. The cozy work environment, user-friendly technology, makes individuals to strive towards career growth overlooking the health. Stress related problems are one of the most important concerns of the management. Lack of appropriate physical activities, ignorance of health related knowledge could be the factors that lead to the above.
INDIAN SCENARIO
Studies show Indians carry certain genes that increase susceptibility to diabetes and lack those genes that provide protection at present 40 million Indians affected by diabetes of which almost 35-40% are people aged between 25 and 35 years. More than 1800 cases of diabetes are diagnosed everyday India has the largest number of diabetics in the world.
-(Times of India Dec 1) The sedentary lifestyle has led to obesity this is because we eat more calories than we use, the balance between the calories – in and calories-out differs for each person. Factors that might tip the balance include once genetic make-up, overeating, fond of fat foods and most importantly not being physically active. Being obese increases your risk of diabetes, heart disease, stroke, arthritis and cancer. A whooping 10-14% of the adolescent population is affected by this disease due to junk food and lack of exercise. With a culture of working lunch seeping among professionals of the I.T city and children preferring soft drinks and chips over tender coconut water and fresh fruits, obesity is ringing an alarm bell. A recent study by the National Institute of Nutrition, Hyderabad showed 98% of healthy school children showed high prevalence of malnutrition especially during exam time this is due to stress, confusion and exertion. Stress hormones sap significant amounts of nutrients like vitamin c, b, magnesium and zinc resulting in disturbing the biochemical balance in the child’s body.
- A brisk walk in the morning is the best to lose weight. Start slow and then pick up the pace. For the first 20 minutes our body is functioning on stored energy after which it switches on to the fat burn. A 45 minute’s walking programme is ideal to bring down your extra fat.
S.N Prevention ELEMENT
OBJECTIVES POTENTIAL BENEFITS
1 Disease To use sport and physical education as forms of preventive medicine
Reduction of a person’s risk of life-threatening diseases, such as Cardiovascular disease, Cancer, Diabetes, Obesity and Mental health
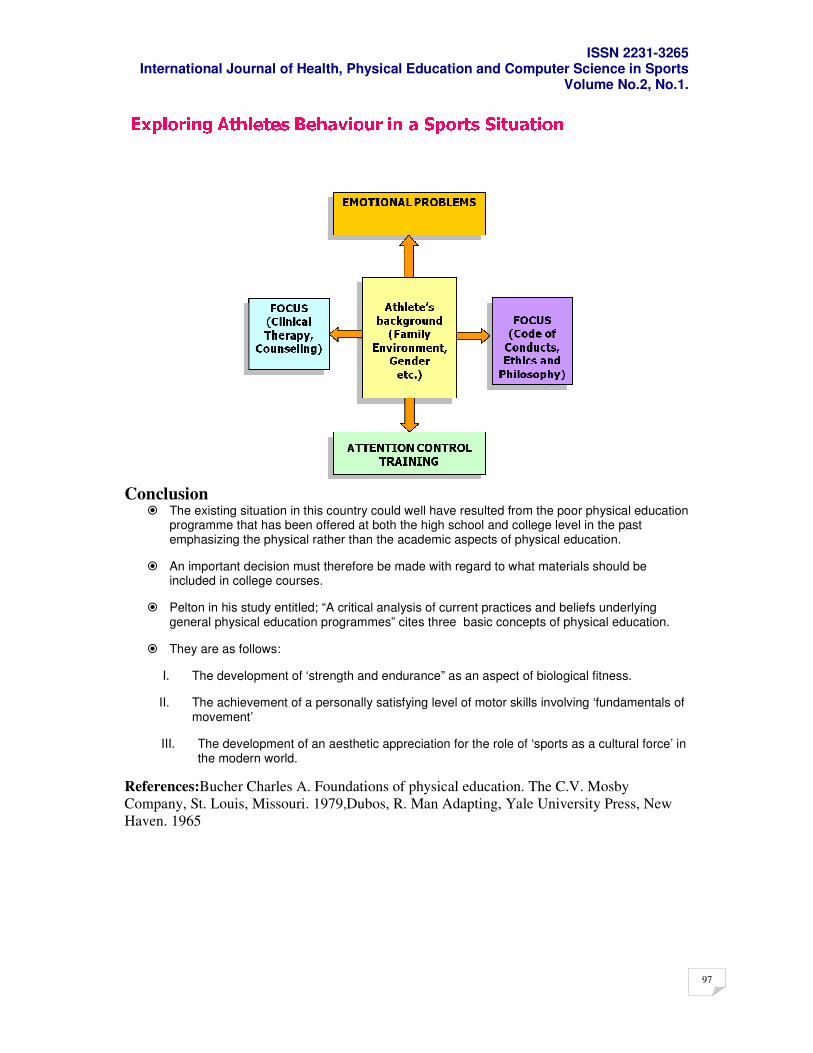
ISSN 2231-3265 International Journal of Health, Physical Education and Computer Science in Sports
Volume No.2, No.1.
97
Conclusion � The existing situation in this country could well have resulted from the poor physical education
programme that has been offered at both the high school and college level in the past emphasizing the physical rather than the academic aspects of physical education.
� An important decision must therefore be made with regard to what materials should be included in college courses.
� Pelton in his study entitled; “A critical analysis of current practices and beliefs underlying general physical education programmes” cites three basic concepts of physical education.
� They are as follows:
I. The development of ‘strength and endurance” as an aspect of biological fitness.
II. The achievement of a personally satisfying level of motor skills involving ‘fundamentals of movement’
III. The development of an aesthetic appreciation for the role of ‘sports as a cultural force’ in the modern world.
References:Bucher Charles A. Foundations of physical education. The C.V. Mosby
Company, St. Louis, Missouri. 1979,Dubos, R. Man Adapting, Yale University Press, New
Haven. 1965
ISSN 2231-3265 International Journal of Health, Physical Education and Computer Science in Sports
Volume No.2, No.1.
98
pp98-99
A comparative study - Anxiety among junior and senior players
Dr. Kalpana B. Zarikar
Assistant Professor in Phy. Edu. & Sports,Dr.B.A.M.Univ.Aurangabad, M.S.
Abstract: The purpose of this study was to compare the anxiety between junior and senior players. The study was conducted on hundred samples, consisting of fifty junior school state level players and fifty senior inter university players. Only Basketball, Cricket, Handball, Hockey, Kabaddi, Kho-Kho and Volleyball women players were selected. The sample consists of fifty junior state players of Aurangabad, Jalna, Beed, Osamanabad districts & fifty senior inter university players of Aurangabad, Jalna, Beed, Osamanabad districts. Random Sampling Technique was employed to select the subjects. Anxiety was obtained by administrating Sinha’s Comprehensive Anxiety Test. The data collected through aforesaid tests were analyzed with respect to anxiety. T test was applied to compute the significances among two groups. The significance of data was judged at 0.05 levels. The result of the study indicates that anxiety of junior and senior players were different. INTRODUCTION: Anxiety is a complex emotional phenomenon. It is reflected in the negative state of disturbed feeling which warns the athlete to find some ways to meet a situation. It is found in his unusual responses to situations. In an anxiety ridden state of mind, he is now incapable of doing things which earlier were fully under his control. It has startlingly been found influencing future events. An overanxious person is not restless over the things in hand (here and how), but he is more concerned about the future happenings which bother him. This condition then becomes operative in him. It changes his state of mind. Anxiety describes the individual’s level of emotionality. Anxiety and arousal are relates because at the higher levels of arousal we considerably have more emotionality than at the lower levels. Since anxiety is an inferred emotional state of the organism and cannot be directly observed, investigations of anxiety rely heavily on having the individual report her own emotional states under various stress conditions. It has been observed that anxiety is a physiological response to a real imagined threat. It is a complex emotional state characterized by a general fear. Feelings of rejection and insecurity are usually a part of anxiety. A certain amount of anxiety is needed for peak performance.
METHODOLOGY: Objectives of the study: The objectives of the study are stated as follows:
3) To study the anxiety among junior and senior women players. 4) To compare the anxiety among junior and senior women players.
Hypothesis : There would be no significant difference between junior and senior players on anxiety.
Selection of Sample: The sample consists of fifty junior state players of Aurangabad, Jalna, Beed, Osamanabad districts & fifty senior inter university players of Aurangabad, Jalna, Beed, Osamanabad districts. The subjects were drawn from the colleges affiliated to Dr. Babasahab Ambedkar Marathwada University. Random Sampling Technique was employed to select the subjects. The data was collected from senior players during inter university coaching camp and junior players during school state level sports tournaments. The present study is based on survey method. Tools used : Sinha’s Comprehensive Anxiety Test has been taken to assess the anxiety. This questionnaire consisted of ninety statements. STATISTICS USED:
Student’s t test has been applied to find out the significant differences among two groups at 0.05 levels of significance. The collected data were tabulated to find out the difference of anxiety among two groups. RESULTS AND DISCUSION:
Table - 1Means, SDs and T-ratio of anxiety between Junior and Senior women players
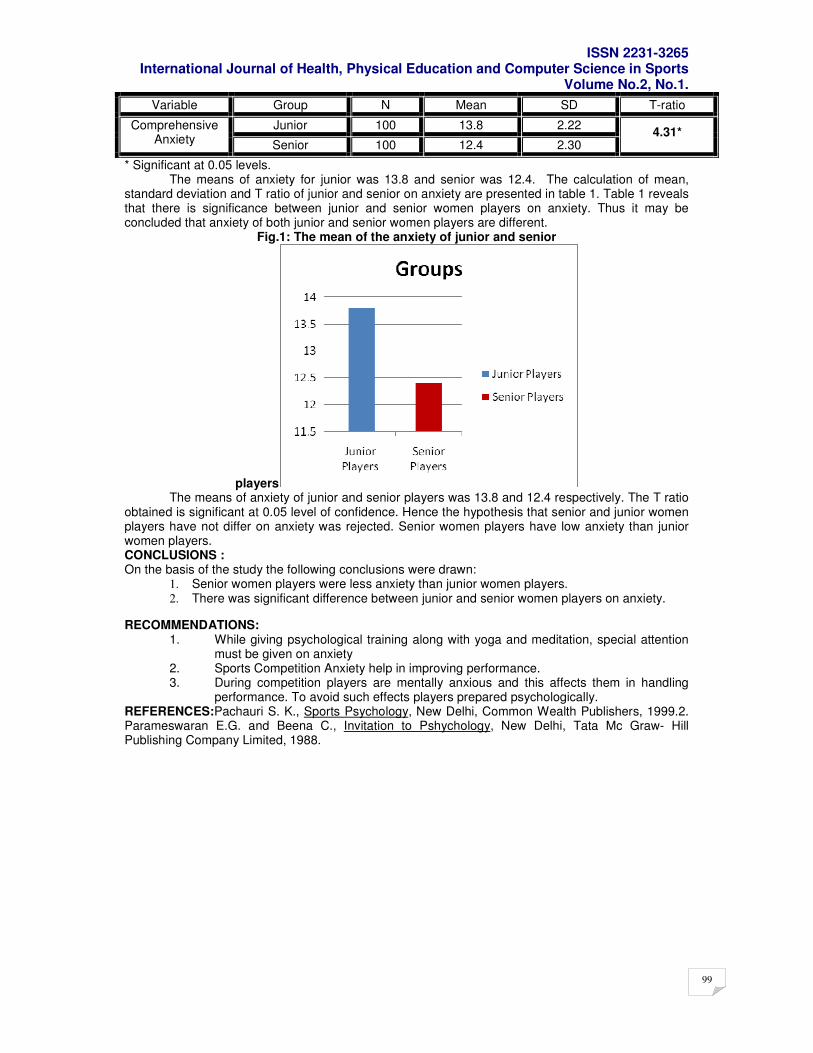
ISSN 2231-3265 International Journal of Health, Physical Education and Computer Science in Sports
Volume No.2, No.1.
99
Variable Group N Mean SD T-ratio
Junior 100 13.8 2.22 Comprehensive Anxiety Senior 100 12.4 2.30
4.31*
* Significant at 0.05 levels. The means of anxiety for junior was 13.8 and senior was 12.4. The calculation of mean, standard deviation and T ratio of junior and senior on anxiety are presented in table 1. Table 1 reveals that there is significance between junior and senior women players on anxiety. Thus it may be concluded that anxiety of both junior and senior women players are different.
Fig.1: The mean of the anxiety of junior and senior
players The means of anxiety of junior and senior players was 13.8 and 12.4 respectively. The T ratio
obtained is significant at 0.05 level of confidence. Hence the hypothesis that senior and junior women players have not differ on anxiety was rejected. Senior women players have low anxiety than junior women players. CONCLUSIONS : On the basis of the study the following conclusions were drawn:
1. Senior women players were less anxiety than junior women players. 2. There was significant difference between junior and senior women players on anxiety.
RECOMMENDATIONS: 1. While giving psychological training along with yoga and meditation, special attention
must be given on anxiety 2. Sports Competition Anxiety help in improving performance. 3. During competition players are mentally anxious and this affects them in handling
performance. To avoid such effects players prepared psychologically. REFERENCES:Pachauri S. K., Sports Psychology, New Delhi, Common Wealth Publishers, 1999.2. Parameswaran E.G. and Beena C., Invitation to Pshychology, New Delhi, Tata Mc Graw- Hill Publishing Company Limited, 1988.
ISSN 2231-3265 International Journal of Health, Physical Education and Computer Science in Sports
Volume No.2, No.1.
100
Pp100-102
A study of the job satisfaction and job stress on secondary school physical education teachers
Dr. Bharat Z. Patel
Lecturer in Physical Education K. K. Arts & Commerce College, Dhandhuka. Ahmedabad. (Gujarat)
Abstract: In the present study, efforts have been made to make a comparative study of job satisfaction and job stress between male and female secondary schools physical education teachers of Gujarat State. To make a gender wise (based on the sex of subjects), 83 female and 517 male physical education teachers was selected randomly from the Gujarat State. The job satisfaction questionnaire by B. C. Muthaya and job stress questionnaire by T. R. Palival were found to be most suitable and reliable for the purpose, so we utilized both of them. The analysis was done by adopting statistical mean, “t” ratio. We find that there is no difference between the job satisfaction and job stress of male and female physical education teachers. This study will play an important role in providing motivation and inspiration to physical education teachers and increasing their social status. Key Words:- Job satisfaction, Job stress, Physical education teacher, Introduction:-Physical education teacher and school environment have a pivotal role in comprehensive development of students. Comprehensive development of students and the job satisfaction of a physical education teacher have a crucial role for national development. The youths wishing to be physical education teachers can make a good career in this field, if they have interest, attitude, perception, study and vocational skill. According to Charlse Boosar, an ideal physical education teacher is supposed to have a chain of multiple social, spiritual, ethical and emotional values and qualities such as moral character, leadership, honesty, ingenuity, attractiveness, personality, absence of physical ugliness, best dynamic power, dynamic skill, high intelligence, erudition, best social rational competence, interest in learning, co-operative attitude, oral and written expression ability, co-ordination of activities etc. The physical education teacher having the above virtues should get job satisfaction. Job satisfaction is a complex mental state arising from the collection of innumerable mental attitudes. Job satisfaction is a comprehensive phenomenon. It indicates the degree of joy and happiness that an individual derives from his job. How a person feels for his job depends upon multiple components and factors. Physical education teachers receives job satisfaction from various sources such as economic status, service security, work load, chances of achievements, vocational and academic qualifications, years of experience, co-operation of officers and fellow workers, social status and so on. Where there is vocational satisfaction, the response of work is higher, where there is no vocational satisfaction, some type of vocational stress appears, which directly or indirectly affects their practice, behavior and conduct and affects adversely his work and at last it results in the obstruction of development. Under dissatisfaction or stress, a physical education teacher can not work well. He can not show perfect enthusiasm and interest to teach the students new things and to give them practice. He will be indifferent towards the development of students or school. He will not utilize spare time positively; neither will he try to utilize his maximum potential. This will adversely affect physical education and sports activity.
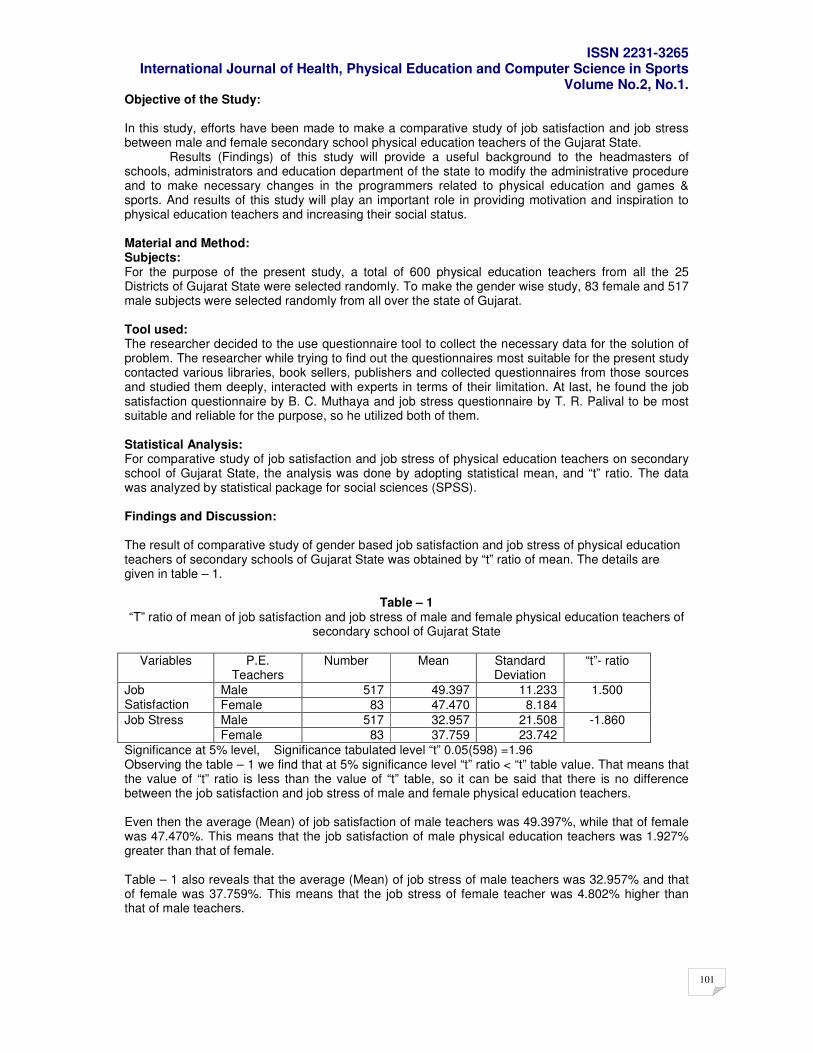
ISSN 2231-3265 International Journal of Health, Physical Education and Computer Science in Sports
Volume No.2, No.1.
101
Objective of the Study: In this study, efforts have been made to make a comparative study of job satisfaction and job stress between male and female secondary school physical education teachers of the Gujarat State. Results (Findings) of this study will provide a useful background to the headmasters of schools, administrators and education department of the state to modify the administrative procedure and to make necessary changes in the programmers related to physical education and games & sports. And results of this study will play an important role in providing motivation and inspiration to physical education teachers and increasing their social status. Material and Method: Subjects: For the purpose of the present study, a total of 600 physical education teachers from all the 25 Districts of Gujarat State were selected randomly. To make the gender wise study, 83 female and 517 male subjects were selected randomly from all over the state of Gujarat. Tool used: The researcher decided to the use questionnaire tool to collect the necessary data for the solution of problem. The researcher while trying to find out the questionnaires most suitable for the present study contacted various libraries, book sellers, publishers and collected questionnaires from those sources and studied them deeply, interacted with experts in terms of their limitation. At last, he found the job satisfaction questionnaire by B. C. Muthaya and job stress questionnaire by T. R. Palival to be most suitable and reliable for the purpose, so he utilized both of them. Statistical Analysis: For comparative study of job satisfaction and job stress of physical education teachers on secondary school of Gujarat State, the analysis was done by adopting statistical mean, and “t” ratio. The data was analyzed by statistical package for social sciences (SPSS). Findings and Discussion: The result of comparative study of gender based job satisfaction and job stress of physical education teachers of secondary schools of Gujarat State was obtained by “t” ratio of mean. The details are given in table – 1.
Table – 1 “T” ratio of mean of job satisfaction and job stress of male and female physical education teachers of
secondary school of Gujarat State
Variables P.E. Teachers
Number Mean Standard Deviation
“t”- ratio
Male 517 49.397 11.233 Job Satisfaction Female 83 47.470 8.184
1.500
Male 517 32.957 21.508 Job Stress
Female 83 37.759 23.742
-1.860
Significance at 5% level, Significance tabulated level “t” 0.05(598) =1.96 Observing the table – 1 we find that at 5% significance level “t” ratio < “t” table value. That means that the value of “t” ratio is less than the value of “t” table, so it can be said that there is no difference between the job satisfaction and job stress of male and female physical education teachers. Even then the average (Mean) of job satisfaction of male teachers was 49.397%, while that of female was 47.470%. This means that the job satisfaction of male physical education teachers was 1.927% greater than that of female. Table – 1 also reveals that the average (Mean) of job stress of male teachers was 32.957% and that of female was 37.759%. This means that the job stress of female teacher was 4.802% higher than that of male teachers.
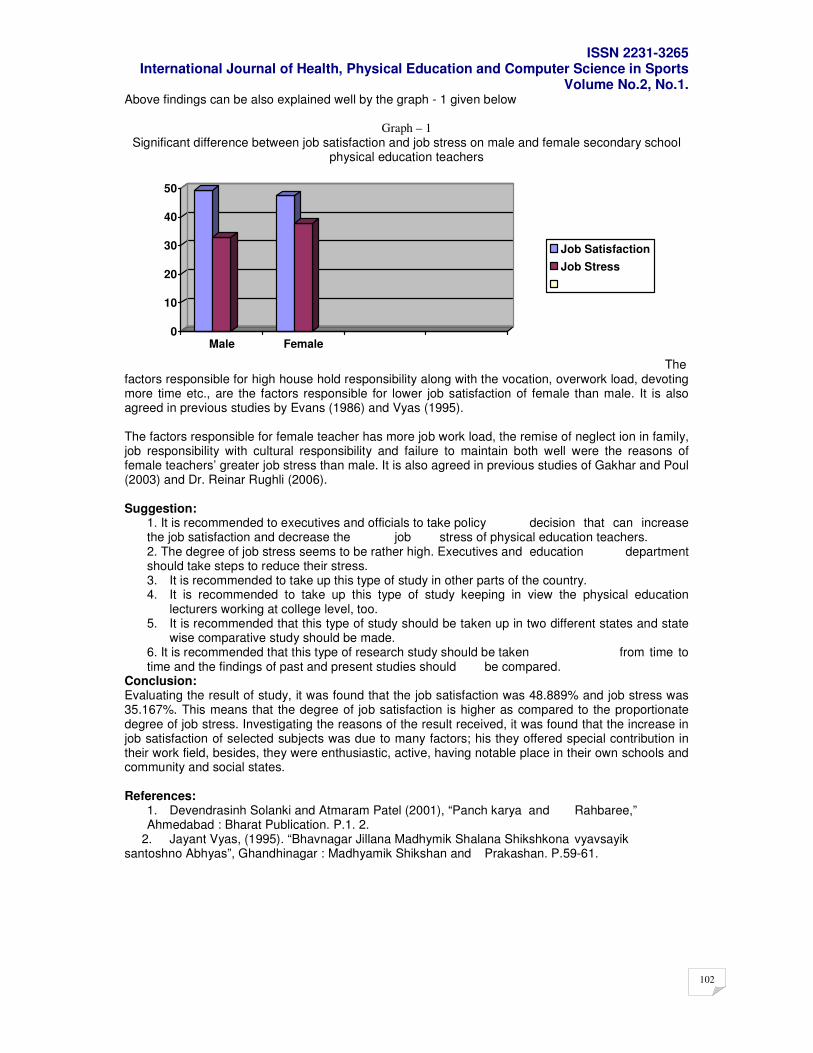
ISSN 2231-3265 International Journal of Health, Physical Education and Computer Science in Sports
Volume No.2, No.1.
102
Above findings can be also explained well by the graph - 1 given below
Graph – 1
Significant difference between job satisfaction and job stress on male and female secondary school physical education teachers
0
10
20
30
40
50
Male Female
Job Satisfaction
Job Stress
The factors responsible for high house hold responsibility along with the vocation, overwork load, devoting more time etc., are the factors responsible for lower job satisfaction of female than male. It is also agreed in previous studies by Evans (1986) and Vyas (1995). The factors responsible for female teacher has more job work load, the remise of neglect ion in family, job responsibility with cultural responsibility and failure to maintain both well were the reasons of female teachers’ greater job stress than male. It is also agreed in previous studies of Gakhar and Poul (2003) and Dr. Reinar Rughli (2006). Suggestion:
1. It is recommended to executives and officials to take policy decision that can increase the job satisfaction and decrease the job stress of physical education teachers. 2. The degree of job stress seems to be rather high. Executives and education department should take steps to reduce their stress. 3. It is recommended to take up this type of study in other parts of the country. 4. It is recommended to take up this type of study keeping in view the physical education
lecturers working at college level, too. 5. It is recommended that this type of study should be taken up in two different states and state
wise comparative study should be made. 6. It is recommended that this type of research study should be taken from time to time and the findings of past and present studies should be compared.
Conclusion: Evaluating the result of study, it was found that the job satisfaction was 48.889% and job stress was 35.167%. This means that the degree of job satisfaction is higher as compared to the proportionate degree of job stress. Investigating the reasons of the result received, it was found that the increase in job satisfaction of selected subjects was due to many factors; his they offered special contribution in their work field, besides, they were enthusiastic, active, having notable place in their own schools and community and social states. References:
1. Devendrasinh Solanki and Atmaram Patel (2001), “Panch karya and Rahbaree,” Ahmedabad : Bharat Publication. P.1. 2.
2. Jayant Vyas, (1995). “Bhavnagar Jillana Madhymik Shalana Shikshkona vyavsayik santoshno Abhyas”, Ghandhinagar : Madhyamik Shikshan and Prakashan. P.59-61.
ISSN 2231-3265 International Journal of Health, Physical Education and Computer Science in Sports
Volume No.2, No.1.
103
Pp103-105
A Systematic Review on Life-Change Events and Participation in Physical Activity
G.P.Param Jyothi ,S.R.Prem Raj, P.Ravi Shankar
Research Scholars of Osmania University
INTRODUCTION The importance of physical activity to a healthy, balanced lifestyle is generally well accepted. These benefits include improved psychosocial health, functional ability and general quality of life, reduction in risk of coronary artery disease and some cancers. Conditions which are known to be associated with decreased physical activity include obesity, hypertension, diabetes, back pain, poor joint mobility and psychosocial problems.For developed countries, physical inactivity is a major public health challenge. Within the USA, the rate of childhood obesity is expected to reach 40% in the next two decades and type 2 diabetes is expected to affect 300 million people worldwide within the same time. The Chief Medical Officer for the UK described physical inactivity within developed countries as both a major public health challenge and as an epidemic.In the UK, the government has set a target for ‘70% of the population to be reasonably active (for example, 30 min of moderate exercise five times a week) In developed countries such as the UK or Australia, levels of PA have been low and it is important to understand how life events may impact on participation in PA. The first step is to identify previous studies which have examined this relationship. This paper reports on a review of the published literature reporting studies on the effects of life events on participation in PA. In this paper, we summarized the findings of previous studies which have a life event as the exposure and physical activity as an outcome to develop a list of the life events covered in the peer-reviewed literature. METHODS The QUORUM statement in Table-I summarizes the review process. The literature search was conducted in two phases. In the first phase, a full web made search (1977 to 2007) search was conducted and papers were excluded from the review if the reported study: (i) Did not report the effect of a ‘life-change event’ or change in life circumstance. (ii) Did not include participation in PA as one of the measured outcomes. (iii) Did not report results in English (for pragmatic reasons). (iv) Did not report results from observational or descriptive studies. In the second phase, the references of studies included in the first phase were searched for potentially relevant papers. Potentially relevant papers were sourced and subject to the same inclusion criteria as those detailed above. The final data corpus for review thus comprised all papers meeting the inclusion criteria either from the initial full web made search or referenced in this initial batch. A data extraction tool was adapted from previous systematic reviews (Foster and Hillsdon, 2004). This tool collected information from each study included in the review on; study aim; research question; participants; target group; methods; main findings; references to check; notes; quality; and life events covered. Phase-I. The initial full web made search identified 14 potentially relevant papers, of which 05 were retained (Table-III). The majority of those rejected at this step either did not include Physical Activity as a measure or did not report on a life- change event Table 1: Terms for review
Terms for revew Description Year introduced
Life-change event Those occurrences, including social, psychological and environmental, which require an adjustment or effect a change in an individual’s
1977
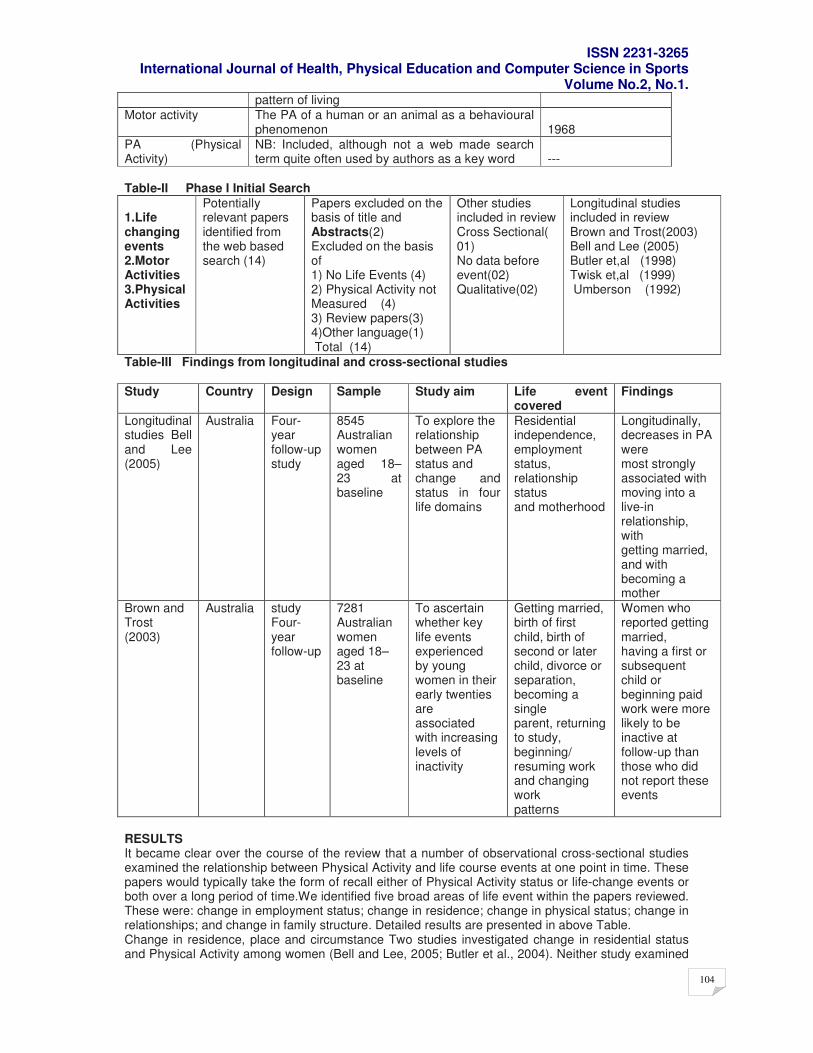
ISSN 2231-3265 International Journal of Health, Physical Education and Computer Science in Sports
Volume No.2, No.1.
104
pattern of living
Motor activity The PA of a human or an animal as a behavioural phenomenon
1968
PA (Physical Activity)
NB: Included, although not a web made search term quite often used by authors as a key word
---
Table-II Phase I Initial Search
1.Life changing events 2.Motor Activities 3.Physical Activities
Potentially relevant papers identified from the web based search (14)
Papers excluded on the basis of title and Abstracts(2) Excluded on the basis of 1) No Life Events (4) 2) Physical Activity not Measured (4) 3) Review papers(3) 4)Other language(1) Total (14)
Other studies included in review Cross Sectional( 01) No data before event(02) Qualitative(02)
Longitudinal studies included in review Brown and Trost(2003) Bell and Lee (2005) Butler et,al (1998) Twisk et,al (1999) Umberson (1992)
Table-III Findings from longitudinal and cross-sectional studies
Study Country Design Sample Study aim Life event covered
Findings
Longitudinal studies Bell and Lee (2005)
Australia Four-year follow-up study
8545 Australian women aged 18–23 at baseline
To explore the relationship between PA status and change and status in four life domains
Residential independence, employment status, relationship status and motherhood
Longitudinally, decreases in PA were most strongly associated with moving into a live-in relationship, with getting married, and with becoming a mother
Brown and Trost (2003)
Australia study Four-year follow-up
7281 Australian women aged 18–23 at baseline
To ascertain whether key life events experienced by young women in their early twenties are associated with increasing levels of inactivity
Getting married, birth of first child, birth of second or later child, divorce or separation, becoming a single parent, returning to study, beginning/ resuming work and changing work patterns
Women who reported getting married, having a first or subsequent child or beginning paid work were more likely to be inactive at follow-up than those who did not report these events
RESULTS It became clear over the course of the review that a number of observational cross-sectional studies examined the relationship between Physical Activity and life course events at one point in time. These papers would typically take the form of recall either of Physical Activity status or life-change events or both over a long period of time.We identified five broad areas of life event within the papers reviewed. These were: change in employment status; change in residence; change in physical status; change in relationships; and change in family structure. Detailed results are presented in above Table. Change in residence, place and circumstance Two studies investigated change in residential status and Physical Activity among women (Bell and Lee, 2005; Butler et al., 2004). Neither study examined
ISSN 2231-3265 International Journal of Health, Physical Education and Computer Science in Sports
Volume No.2, No.1.
105
residential change alone; Bell investigated residential change to cohabiting live-in relationships whereas Butler studied diet, Physical Activity and prevalence of obesity associated with residential change during the transition from secondary school to university. Both studies found that a change in residential status was associated with a decrease in Physical Activity. Although the decrease in Physical Activity observed by Butler et al. did not reach statistical significance, the authors argue that an observed significant increase in weight was likely to be related to a decrease in Physical Activity. Both studies suggest that change in residence may lead to a decrease in PA among young women. DISCUSSION We set out to identify which life events had been studied in relation to participation in Physical Activity in the peer-review literature. We found 14 papers in the literature that covered a range of life events which we categorized under five broad categories; change in employment status; change in residence; change in physical status; change in relationships; and change in family structure.Our study is the first of its kind to try and bring together the disparate literature on life change events and Physical Activity status. Most studies reviewed examined one or two life-change events with relation to Physical Activity. Typically these are done as a secondary analysis with data that were collected as part of a larger study. This review was limited to literature first identified in web search. Our intention was to provide a scoping review to get a feel for the state of the literature. We feel that we have achieved this and while a more extensive search may identify more studies it is unlikely, and changes in mental status, that further life-change events have been studied than those reported here. A second weakness of the studies reviewed was that only 1 of the 05 reported data from longitudinal studies, and three of those from the same dataset. Many governments in developed countries have set ambitious targets for population Physical Activity. These targets reflect the increasing social, political and health policy importance of Physical Activity. Previous work with cross-sectional data has identified that there are differences in Physical Activity between differing age groups. (Allender et al., in press). Any attempt to increase or even reverse trends in population Physical Activity must address the impact of changes in life events or life circumstance on Physical Activity participation. CONCLUSIONS Recent increased attention and importance attributed to PA by governments at local and national level is welcome. Recent trend data from the UK suggests that current interventions to promote sport and PA are inadequate (Allender et al., 2006a, b, c). This review suggests that life change events do affect participation in PA and, in light of changing participation rates, forms an important and neglected area of study. REFERENCES
1. Bell, S. and Lee, C. (2006) Does timing and sequencing of transitions to adulthood make a difference? Stress, smoking, and physical activity among young Australian women. International Journal of Behavioural Medicine, 13, 265–274.
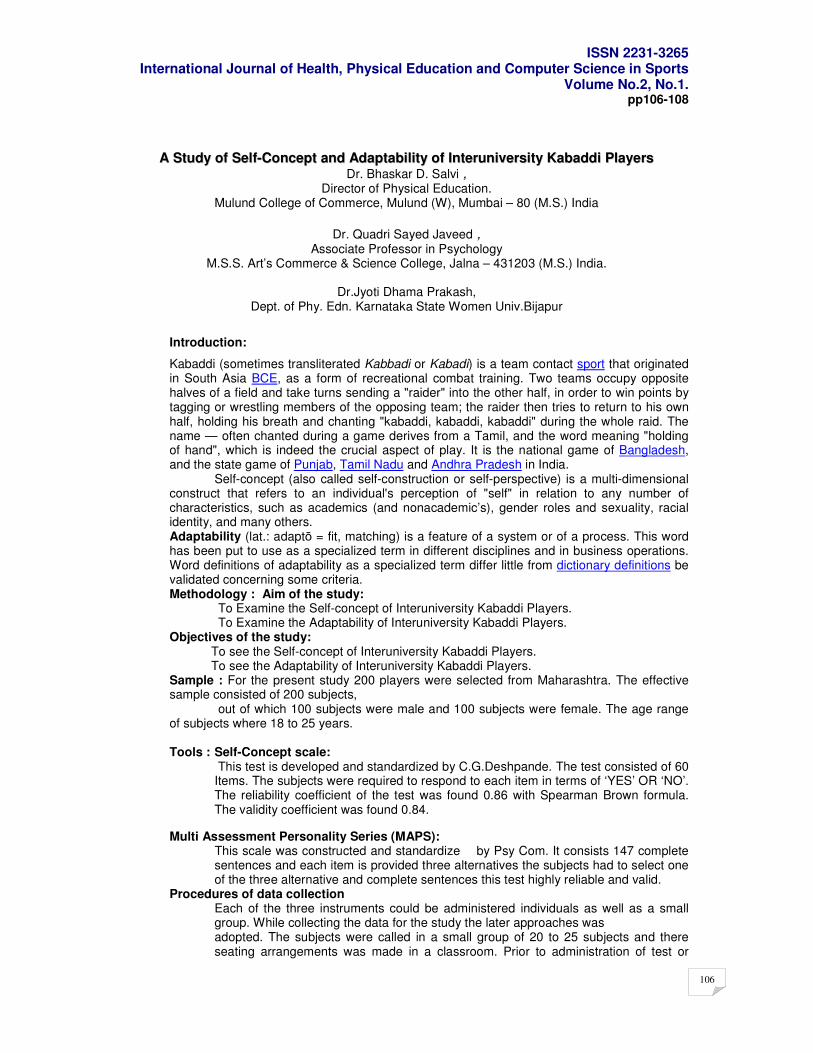
ISSN 2231-3265 International Journal of Health, Physical Education and Computer Science in Sports
Volume No.2, No.1.
106
pp106-108
AA SSttuuddyy ooff SSeellff--CCoonncceepptt aanndd AAddaappttaabbiilliittyy ooff IInntteerruunniivveerrssiittyy KKaabbaaddddii PPllaayyeerrss Dr. Bhaskar D. Salvi ,
Director of Physical Education. Mulund College of Commerce, Mulund (W), Mumbai – 80 (M.S.) India
Dr. Quadri Sayed Javeed ,
Associate Professor in Psychology M.S.S. Art’s Commerce & Science College, Jalna – 431203 (M.S.) India.
Dr.Jyoti Dhama Prakash,
Dept. of Phy. Edn. Karnataka State Women Univ.Bijapur
Introduction:
Kabaddi (sometimes transliterated Kabbadi or Kabadi) is a team contact sport that originated in South Asia BCE, as a form of recreational combat training. Two teams occupy opposite halves of a field and take turns sending a "raider" into the other half, in order to win points by tagging or wrestling members of the opposing team; the raider then tries to return to his own half, holding his breath and chanting "kabaddi, kabaddi, kabaddi" during the whole raid. The name — often chanted during a game derives from a Tamil, and the word meaning "holding of hand", which is indeed the crucial aspect of play. It is the national game of Bangladesh, and the state game of Punjab, Tamil Nadu and Andhra Pradesh in India.
Self-concept (also called self-construction or self-perspective) is a multi-dimensional construct that refers to an individual's perception of "self" in relation to any number of characteristics, such as academics (and nonacademic’s), gender roles and sexuality, racial identity, and many others. Adaptability (lat.: adaptō = fit, matching) is a feature of a system or of a process. This word has been put to use as a specialized term in different disciplines and in business operations. Word definitions of adaptability as a specialized term differ little from dictionary definitions be validated concerning some criteria. Methodology : Aim of the study: To Examine the Self-concept of Interuniversity Kabaddi Players. To Examine the Adaptability of Interuniversity Kabaddi Players. Objectives of the study: To see the Self-concept of Interuniversity Kabaddi Players. To see the Adaptability of Interuniversity Kabaddi Players. Sample : For the present study 200 players were selected from Maharashtra. The effective sample consisted of 200 subjects, out of which 100 subjects were male and 100 subjects were female. The age range of subjects where 18 to 25 years. Tools : Self-Concept scale:
This test is developed and standardized by C.G.Deshpande. The test consisted of 60 Items. The subjects were required to respond to each item in terms of ‘YES’ OR ‘NO’. The reliability coefficient of the test was found 0.86 with Spearman Brown formula. The validity coefficient was found 0.84.
Multi Assessment Personality Series (MAPS): This scale was constructed and standardize by Psy Com. It consists 147 complete
sentences and each item is provided three alternatives the subjects had to select one of the three alternative and complete sentences this test highly reliable and valid.
Procedures of data collection Each of the three instruments could be administered individuals as well as a small group. While collecting the data for the study the later approaches was adopted. The subjects were called in a small group of 20 to 25 subjects and there seating arrangements was made in a classroom. Prior to administration of test or
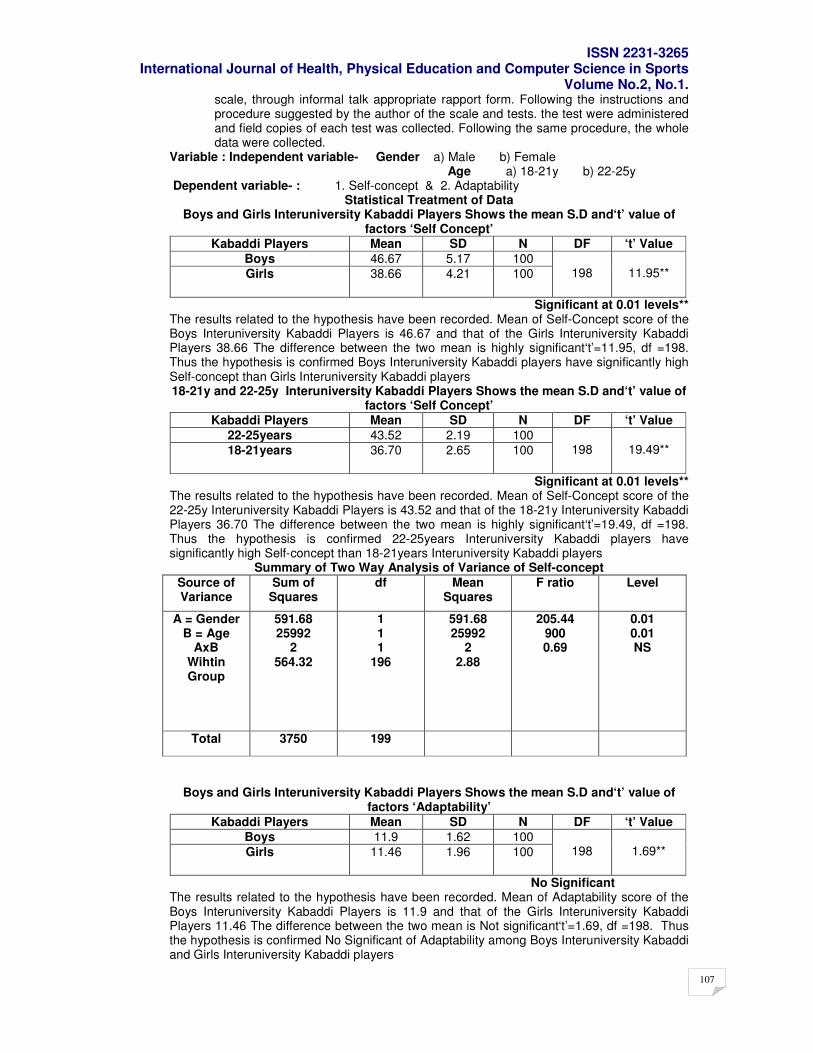
ISSN 2231-3265 International Journal of Health, Physical Education and Computer Science in Sports
Volume No.2, No.1.
107
scale, through informal talk appropriate rapport form. Following the instructions and procedure suggested by the author of the scale and tests. the test were administered and field copies of each test was collected. Following the same procedure, the whole data were collected.
Variable : Independent variable- Gender a) Male b) Female Age a) 18-21y b) 22-25y Dependent variable- : 1. Self-concept & 2. Adaptability
Statistical Treatment of Data Boys and Girls Interuniversity Kabaddi Players Shows the mean S.D and‘t’ value of
factors ‘Self Concept’ Kabaddi Players Mean SD N DF ‘t’ Value
Boys 46.67 5.17 100
Girls 38.66 4.21 100
198
11.95**
Significant at 0.01 levels** The results related to the hypothesis have been recorded. Mean of Self-Concept score of the Boys Interuniversity Kabaddi Players is 46.67 and that of the Girls Interuniversity Kabaddi Players 38.66 The difference between the two mean is highly significant‘t’=11.95, df =198. Thus the hypothesis is confirmed Boys Interuniversity Kabaddi players have significantly high Self-concept than Girls Interuniversity Kabaddi players 18-21y and 22-25y Interuniversity Kabaddi Players Shows the mean S.D and‘t’ value of
factors ‘Self Concept’ Kabaddi Players Mean SD N DF ‘t’ Value
22-25years 43.52 2.19 100
18-21years 36.70 2.65 100
198
19.49**
Significant at 0.01 levels** The results related to the hypothesis have been recorded. Mean of Self-Concept score of the 22-25y Interuniversity Kabaddi Players is 43.52 and that of the 18-21y Interuniversity Kabaddi Players 36.70 The difference between the two mean is highly significant‘t’=19.49, df =198. Thus the hypothesis is confirmed 22-25years Interuniversity Kabaddi players have significantly high Self-concept than 18-21years Interuniversity Kabaddi players
Summary of Two Way Analysis of Variance of Self-concept
Source of Variance
Sum of Squares
df Mean Squares
F ratio Level
A = Gender B = Age
AxB Wihtin Group
591.68 25992
2 564.32
1 1 1
196
591.68 25992
2 2.88
205.44 900 0.69
0.01 0.01 NS
Total 3750 199
Boys and Girls Interuniversity Kabaddi Players Shows the mean S.D and‘t’ value of factors ‘Adaptability’
Kabaddi Players Mean SD N DF ‘t’ Value
Boys 11.9 1.62 100
Girls 11.46 1.96 100
198
1.69**
No Significant The results related to the hypothesis have been recorded. Mean of Adaptability score of the Boys Interuniversity Kabaddi Players is 11.9 and that of the Girls Interuniversity Kabaddi Players 11.46 The difference between the two mean is Not significant‘t’=1.69, df =198. Thus the hypothesis is confirmed No Significant of Adaptability among Boys Interuniversity Kabaddi and Girls Interuniversity Kabaddi players
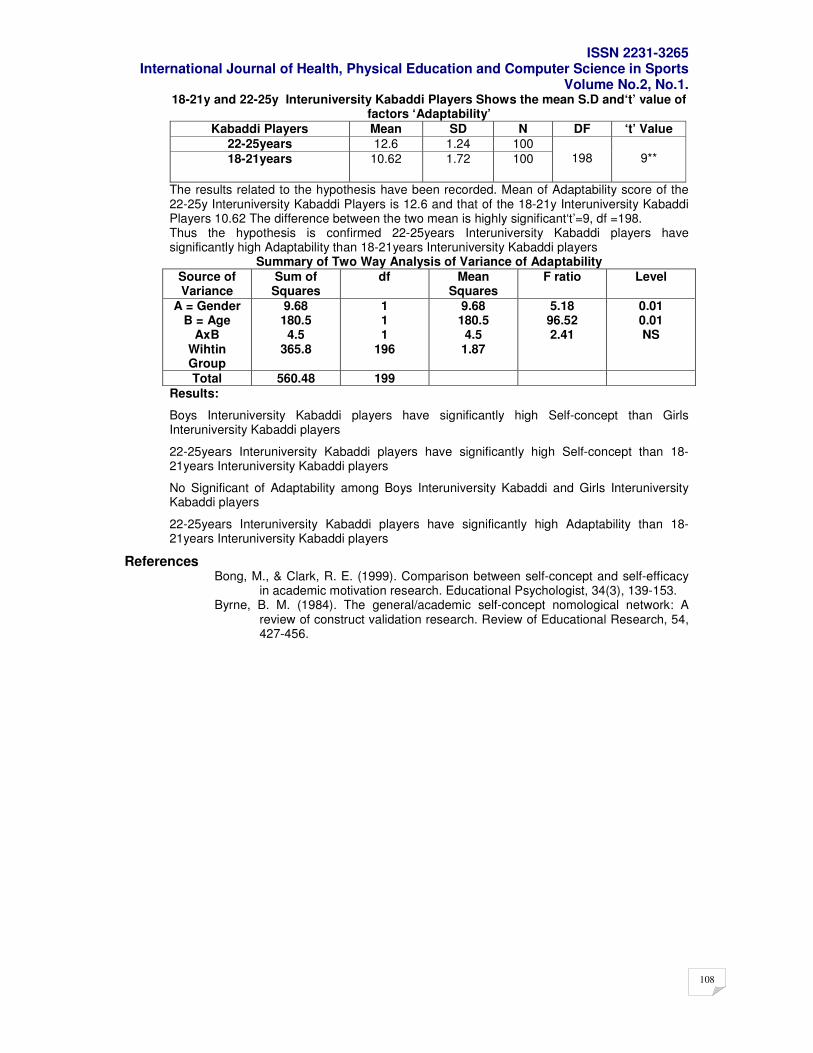
ISSN 2231-3265 International Journal of Health, Physical Education and Computer Science in Sports
Volume No.2, No.1.
108
18-21y and 22-25y Interuniversity Kabaddi Players Shows the mean S.D and‘t’ value of factors ‘Adaptability’
Kabaddi Players Mean SD N DF ‘t’ Value
22-25years 12.6 1.24 100
18-21years 10.62 1.72 100
198
9**
The results related to the hypothesis have been recorded. Mean of Adaptability score of the 22-25y Interuniversity Kabaddi Players is 12.6 and that of the 18-21y Interuniversity Kabaddi Players 10.62 The difference between the two mean is highly significant‘t’=9, df =198. Thus the hypothesis is confirmed 22-25years Interuniversity Kabaddi players have significantly high Adaptability than 18-21years Interuniversity Kabaddi players
Summary of Two Way Analysis of Variance of Adaptability
Source of Variance
Sum of Squares
df Mean Squares
F ratio Level
A = Gender B = Age
AxB Wihtin Group
9.68 180.5 4.5
365.8
1 1 1
196
9.68 180.5 4.5
1.87
5.18 96.52 2.41
0.01 0.01 NS
Total 560.48 199
Results:
Boys Interuniversity Kabaddi players have significantly high Self-concept than Girls Interuniversity Kabaddi players
22-25years Interuniversity Kabaddi players have significantly high Self-concept than 18-21years Interuniversity Kabaddi players
No Significant of Adaptability among Boys Interuniversity Kabaddi and Girls Interuniversity Kabaddi players
22-25years Interuniversity Kabaddi players have significantly high Adaptability than 18-21years Interuniversity Kabaddi players
References Bong, M., & Clark, R. E. (1999). Comparison between self-concept and self-efficacy
in academic motivation research. Educational Psychologist, 34(3), 139-153. Byrne, B. M. (1984). The general/academic self-concept nomological network: A
review of construct validation research. Review of Educational Research, 54, 427-456.
ISSN 2231-3265 International Journal of Health, Physical Education and Computer Science in Sports
Volume No.2, No.1.
109
pp109-110
Influence of cardiac fitness for healthy life Mr. Jayaraman.S,
Lecturer, Sports Authority of India, Trivandrum, Kerala, India.
INTRODUCTION: Cardiovascular fitness improvement is dependent upon the exercise program as well as the
individual participant. Exercise places an increased demand on the cardiovascular system. Oxygen demand by the muscles increases sharply. Metabolic processes speed up and more waste is created. More nutrients are used and body temperature rises. To perform as efficiently as possible. The long-term adaptations that take place in the cardiovascular system with repeated exercise. The most important aspects of the cardiovascular system to examine includes Heart rate, Stroke volume, Cardiac output, Blood flow, Blood pressure, Blood. Types of Cardiovascular Training
1. Low Intensity, Long Duration. 2. Medium Intensity, Medium Duration 3. High Intensity, Short Duration. 4. Aerobic Interval Training. 5. Anaerobic Interval Training. 6. Fartlek Training. 7. Circuit Training 8. Aerobic composite training
Means and methods to develop Cardiac fitness 1. Walking: It could be done on the basis of age, sex, level of fitness, training age and capacity of
an individual. Walking classifies according to the intensity. Such as 1. Strolling : 18-30 min/mile 2. Brisk walking : 14-17 min/mile
3. Aerobic walking : 10- 13.5 min/mile 4. Race walking : less than 10 min/mile
2. Running/Jogging: Think of getting in shape. Running can be done on the road with adequate jogging shoes and consultation of physician. Overweight categories are not recommended for this activity. Because ¾ of body weight passes through meniscus while running/jogging. So chances of affecting knee ligaments are more. 3. Aerobic/ Dance Classes Low-impact, High-impact, Step aerobics, Water aerobics 4. Sprinting :Run as fast as you can. This type of cardio is suited to interval training and is generally not appropriate for beginners. 5. Swimming: Swimming is usually done in a pool (it can also be done in a lake or ocean as well. 6. Road Biking and Mountain Biking : Cycling is becoming more and more popular due to its convenience, enjoy ability and value as an exercise. 7. Rollerblading :Roller Blading is exactly like skating on ice without the ice. 8. Cross-Country Skiing: This is one of the best all-around aerobic exercises there is.To achieve a full functional range of motion in all major muscle groups. Impact of cardio exercises on the body: A) Physical effects 1. Heart: Increased the efficiency of heart, larger volume of oxygen and rich blood pumped through the body's circulation system which improves fat burn which leads to reduce fat levels in the body. 2. Lungs: Inhalation - increased air intake in the lungs when breathing in Result = Reduction in rate of inhalation = Increased energy levels. Exhalation - decreased air volume in the lungs after breathing out Result = Increased air intake when breathing in = Increased lung capacity. 3. Blood Circulation: Improved blood circulation from the processing organs (heart and lungs) to and from the muscles being exercised. 4. Body Composition: Reduction of body fat levels in which more lean mass (muscles, bones) and improved physical condition. 5. Muscles: Fat burn improved in both during and after training and exercise activity. 6. Bones, Tendons and Ligaments: Improved function and flexibility of wider range of motion. 7. Nervous system: Increased activity efficiency of an individual.
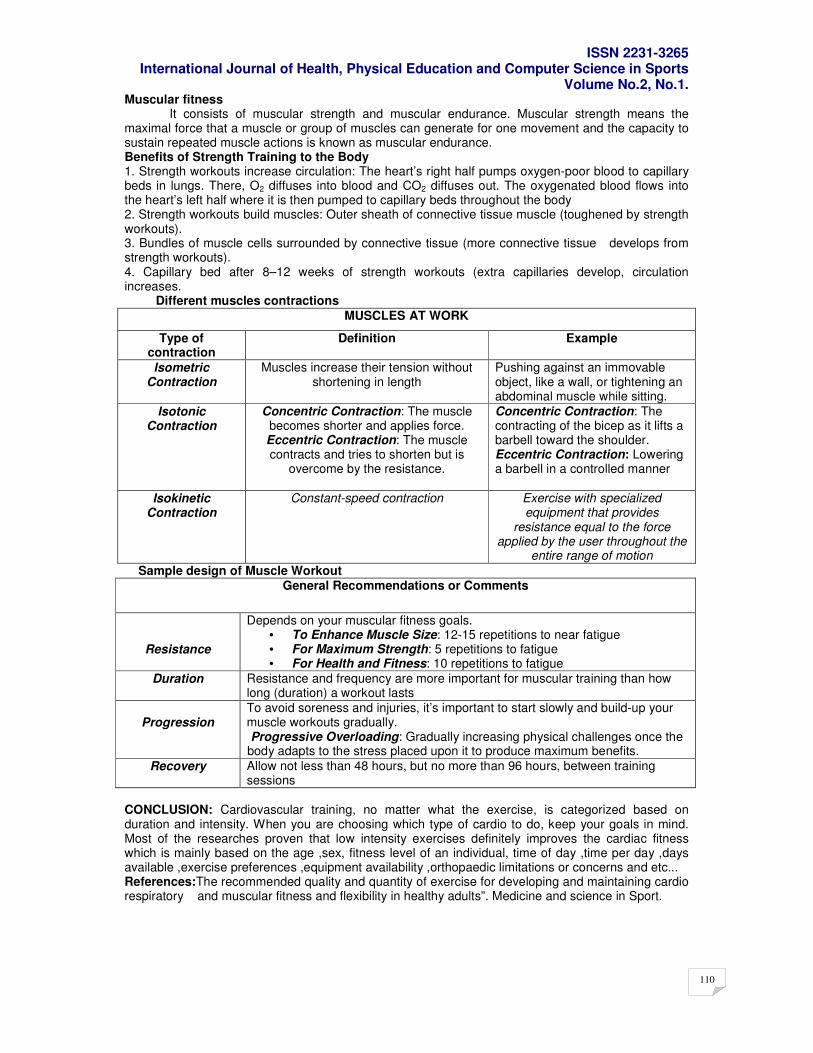
ISSN 2231-3265 International Journal of Health, Physical Education and Computer Science in Sports
Volume No.2, No.1.
110
Muscular fitness It consists of muscular strength and muscular endurance. Muscular strength means the
maximal force that a muscle or group of muscles can generate for one movement and the capacity to sustain repeated muscle actions is known as muscular endurance. Benefits of Strength Training to the Body 1. Strength workouts increase circulation: The heart’s right half pumps oxygen-poor blood to capillary beds in lungs. There, O2 diffuses into blood and CO2 diffuses out. The oxygenated blood flows into the heart’s left half where it is then pumped to capillary beds throughout the body 2. Strength workouts build muscles: Outer sheath of connective tissue muscle (toughened by strength workouts). 3. Bundles of muscle cells surrounded by connective tissue (more connective tissue develops from strength workouts). 4. Capillary bed after 8–12 weeks of strength workouts (extra capillaries develop, circulation increases. Different muscles contractions
MUSCLES AT WORK
Type of contraction
Definition Example
Isometric Contraction
Muscles increase their tension without shortening in length
Pushing against an immovable object, like a wall, or tightening an abdominal muscle while sitting.
Isotonic Contraction
Concentric Contraction: The muscle becomes shorter and applies force. Eccentric Contraction: The muscle contracts and tries to shorten but is
overcome by the resistance.
Concentric Contraction: The contracting of the bicep as it lifts a barbell toward the shoulder. Eccentric Contraction: Lowering a barbell in a controlled manner
Isokinetic Contraction
Constant-speed contraction Exercise with specialized equipment that provides
resistance equal to the force applied by the user throughout the
entire range of motion
Sample design of Muscle Workout General Recommendations or Comments
Resistance
Depends on your muscular fitness goals. • To Enhance Muscle Size: 12-15 repetitions to near fatigue • For Maximum Strength: 5 repetitions to fatigue • For Health and Fitness: 10 repetitions to fatigue
Duration
Resistance and frequency are more important for muscular training than how long (duration) a workout lasts
Progression
To avoid soreness and injuries, it’s important to start slowly and build-up your muscle workouts gradually. Progressive Overloading: Gradually increasing physical challenges once the body adapts to the stress placed upon it to produce maximum benefits.
Recovery
Allow not less than 48 hours, but no more than 96 hours, between training sessions
CONCLUSION: Cardiovascular training, no matter what the exercise, is categorized based on duration and intensity. When you are choosing which type of cardio to do, keep your goals in mind. Most of the researches proven that low intensity exercises definitely improves the cardiac fitness which is mainly based on the age ,sex, fitness level of an individual, time of day ,time per day ,days available ,exercise preferences ,equipment availability ,orthopaedic limitations or concerns and etc... References:The recommended quality and quantity of exercise for developing and maintaining cardio respiratory and muscular fitness and flexibility in healthy adults”. Medicine and science in Sport.
ISSN 2231-3265 International Journal of Health, Physical Education and Computer Science in Sports
Volume No.2, No.1.
111
pp111-113
Status and recognition of sportswomen in Indian society
Vasanthi Kadhiravan
Department of Physical Education, University of Mumbai, Mumbai, India,
ABSTRACT
In the early 1900s when Club life was introduced in India, sporting activities also found a serious place in female lives due to the facilities provided. Women pioneers had started blazing the trail. Rajkumari Amrit Kaur, health minister in India first set an example for North Indian women by taking to competitive Tennis. The efforts of such sporting personalities have yielded fruits. The female sensation in badminton today is world no. 2 Saina Newhal. Similar legendary sportswomen are Karnam Malleshwari, Anju Bobby George, P.T. Usha, and Sania Mirza. Even if they are a step ahead, a number of factors ensure that sportswomen stay two steps behind. Though the Indian culture looks up to a woman as a mother of a race, the Indian society is firm with the belief that women are naturally inferior to men because of the faith that a woman’s duty is bound only to birthing and taking care of her family. The level of physical education and sports for females has been hampered because of the endless limitations. Their road to glory is a fight against prejudice, inferiority and discrimination. Customs and traditions seep their way into discouraging woman achievers. We need sportswomen of yesteryear to handle the reigns and encourage the upcoming generations. Our society has to work towards a massive cultural reform where we have a healthy work ethic. Until that is done Indian women will be only chasing a mirage, not medals, in international sporting events.
HISTORY OF WOMEN PARTICIPATING IN SPORTS
Gong back in history, historical sources enable us o have only a glimpse of the recreations of girls during the Vedic and Epic periods. Music and dancing formed the principle indoor games. Public and dramatic concerts were often organized and girls used to go out to see them along with their elders or lovers. In fashionable circles game with the ball seems to have been the chief outdoor of physical exercise. Shakuntala and Kunti are, for instance, represented as spending their leisure hours in this game is the Mahabharata. The Ramayana represents girls as going in the evening to gardens for playing and talking with their friends, but this was probably possible only in towns and cities.
We have some reference to girls going out to swim as well girls playing a number of courtyard games like “hide and seek” and “run and catch”. These gave very good exercise to the players and were well calculated to help their general development and gave suppleness to their limbs. They were, however played usually before the marriage. Today in India, women and girls have long been deprived of participation in games and sports by direct or indirect social inhibition.
For a long time women played no more than a very limited role in the Olympic movement. Even 1992 women represented less than 305 of the competitors at the Summer Olympic Games. On their way to Olympia women were faced with a great number of obstacles. The opposition which they met was directed at not only women’s participation in sport but also the maculinization that this was alleged to produce as well as the emancipation of women and the perceived threat of change in the gender order itself. In an age in everyday life were being radically transformed by processes of modernization, some hoped that sport and the Olympic Games might contribute towards upholing the myth of the male as the stronger sex.
WOMEN’S SPORTING ACHIEVEMENTS DOWN THE YEARS
Taking lead from the pioneers many women took the sports field seriously and achieved name and fame for themselves and the country. Some of them are:
ISSN 2231-3265 International Journal of Health, Physical Education and Computer Science in Sports
Volume No.2, No.1.
112
• Aarti Saha became the first Indian woman to cross the English Channel. (1959). Later, Anita Sood became the fastest Asian swimmer to cross the channel.
• Table tennis star Indu Puri won World Railways title in 1978. She also defeated the then world champion Park Yung Sun of North Korea in 1978 Asian Championships at Kuala Lumpur.
• Indian women's hockey team headed by Rajbir Kaur won Asian Games gold medal (1982).
• Golden Girl PT Usha missed Los Angeles (1984) Olympics bronze by one-hundredth of a second but the very next year she bagged all the Asian Athletic Track and Field at Jakarta (1985) gold in her events: Had the maximum number of gold medals in Seoul Asiad (1986).
• Shiny Wilson dominated the 800m vent in Asia; has seven consecutive gold medals in 800m in SAFF Games.
• Asha Aggarwal is the first Indian woman to win marathon title in Asian Championships (1985).
• Shooter Soma Dutta claimed Asian Games silver and bronze (1986)
• Anupama Gokhale (1985) and Bhagyashree Thipsay (1991) won Asian Chess titles.
• Kunjarani Devi has the rare distinction of being one of the top 100 women lifters of the century. She brought maximum medals for India from World Championships 17 silvers, 1 bronze.
• K. Malleswari won World Championships gold and equalled world record during World Championships in China (1995).
• Aparna Popat finished runners-up in World junior badminton championship in Denmark (1996).
• Anju Bobby George made history when she won the bronze medal in Long Jump at the 2003 World Championships in Athletics in Paris. With this achievement, she became the first Indian athlete ever to win a medal in a World Championships in Athletics clearing 6.70 m. She went on to win the silver medal at the IAAF World Athletics Final in 2005, a performance she considers her best.
• Anjali Bhagwat in the 2002 Commonwealth Games in Manchester, she won four golds in the individual and pairs events of Air rifle. She was awarded the Arjuna award in 2000 and the Rajiv Gandhi Khel Ratna jointly with Beenamol for 2002–2003. She represented India at the 2000 Sydney Olympics, 2004 Athens Olympics, and the 2008 Beijing Olympics,
• Sania Mirza is the highest ranked female tennis player ever from India, with a career high ranking of 27 in singles and 18 in doubles. She is the first Indian woman to be seeded in a Grand Slam tennis tournament
• Saina Nehwal an Indian Khel Ratna winning badminton player currently ranked number 2 in the world by Badminton World Federation, Saina is the first Indian woman to reach the singles quarterfinals at the Olympics and the first Indian to win the World Junior Badminton Championships-
• Tejaswini Sawant won the gold medal in 50 metre rifle event at the World Shooting Championship in Munich, 2010, the first Indian woman to do so.
SOCIAL HANDICAPS THEN:
Dronacharya, Indian mythology's greatest coach, banished an aspiring and brilliant low-caste archer from his camp lest his favourite student, Arjuna, be upstaged. Eklavya paid with his thumb for his audacity. Today, Indian sportswomen are akin to the lowest caste in the games arena. They are shunned, objectified and treated as loose change by the men who dominate the field and the bureaucracy that controls it.
STATUS OF WOMEN IN SOCIETY
Today India remains male dominated and the sporting world is still a men’s world. Indian culture and society looks op to a woman as a mother of a race and therefore India has been symbolized as Mother India, keeping in view the exemplary of a woman i.e. patience, endurance, love, affection, sympathy and generosity. She is looked only as a member of the group, as daughter, wife or a mother and not as an individual with an identity or rights of her own. The society is firm with the belief that women are naturally inferior to men in terms of strength and speed.
ISSN 2231-3265 International Journal of Health, Physical Education and Computer Science in Sports
Volume No.2, No.1.
113
SOCIAL PRESSURES
Customs and traditions seep their way into de motivating every woman achiever. The mind frame of the society; that ‘the woman is made to take care of children and family’ reigns supreme and every achiever has to make a fight back through this mind frame to reach and remain on the top.
Captain of Indian National Women Basketball Team Prashanti Singh points to more deep-rooted social perceptions towards women in general. It shows up when marriage happens. "Most of the time it is hard to find a partner of the same mindset and lifestyle. These are outgoing girls who can take their own decisions... and there are very few matches that woman athletes find," says the basketball captain. "When I started playing in school, many of the girls left the sport because their fathers and brothers didn't like them playing. My father, who was a sportsman, also insisted that we complete our studies first as he had never seen a woman sportsperson make more money than a man. The day I became India captain, that mindset changed," she says.
RECOGNITION
Our society has time and again failed to give our women athletes the recognition they deserve. We would rather spend our spare time watching Ashwairya Rai dancing around trees than Karnam Malleshwari hefting a ton. Also Indian parents don’t want their girl child to take up sports. Our male dominated society expects women to play only inside the kitchen.
CONCLUSIONWith all these points in mind, we need to create a climate in which sports and fitness are for everyone to enjoy and where everyone's abilities are tested and respected. As women develop greater interest in sport, their own attitude to their bodies has changed and women's sporting performances have improved as a result of more competition. With the support from the media and respect from the public, female athletes will finally get the same recognition as their male counterparts.Over a long period of time women have demanded changes in society to give them equal status with men. Social change has gradually given women greater opportunities. But the battle for equal opportunities with man is still being fought. The socialist governments that have ruled this country since independence have failed to reform our culture. But no excellence in sports is possible until we have a culture that extols physical work. Our society has to work towards a massive cultural reform such as:
• Increase the numbers of IOC members who are women, doubling the number by the year 2000.
• More women must be appointed to commissions and working groups as well as to the international federations and national Olympic committees, recommending the appointment of women
• Seminars for women in administration and leadership, coaching and sports journalism should be organized every year.
• The Olympic Study Centre is encouraged to make studies on the role of women and sport.
• The Government should allot a specific budget for women's sport.
• The SAI should start specific schemes for women only.
REFERENCES;
Barbaral L. Drinkwater, “Women in Sports”, Encyclopedia of Sports Medicine, VIIIth Volume, 3 -7
ISSN 2231-3265 International Journal of Health, Physical Education and Computer Science in Sports
Volume No.2, No.1.
114
pp114-115
A comparative study of physical fitness among students of a.p. tribla welfare and
social welfare residential schools in warangal district.
J.Somanna,
Lecturer in Physical Education, Kakatiya Govt. College Hanamkonda
ABSTRACT
Introduction:
Education contributes to the development, advancement and perpetuation of Nation’s culture. Physical Education has a major contribution to make body growth and development of all youth. The aim of Physical Education is the optimum development of the physically, socially and mentally integrated and adjusted individual through.
Physical fitness is one aspect of total fitness. Scientific evidence has been produced to show that the general health and physical performance, ability of the people depends mainly on their physical fitness. Physical Fitness is a capacity for sustained physical activities. It is the key to success in every walk of life. This is one phase of total fitness and may be used inter-changeably with motor fitness.
1) Resistance of Disease 2. Muscular strength and Muscular Endurance 3. Cardio-Respiratory Endurance 4. Muscular Power 5. Flexibility 6. Speed
7. Agility 8. Co-ordination 9. Balance 10. Accuracy
Significance of Study:
This study will help to estimate the physical fitness of the AP Tribal Welfare Residential School students and Social Welfare Residential School Students in Warangal, AP.
Methodology:
An Experimental design is adapted for collection of data.
A random selection of 400 subjects was made, 200 from each Tribal Welfare and Social Welfare Residential School, Ashoknagar, Eturnagaram and A.P Social Welfare residential schools Jangoan and Jakaram in Warangal District. Interpretation of Data:
The performance in the selected variables for scored and recorded . The probability level
below which we reject the hypotheses is termed as the level of significance. The ‘t’ ratio obtained were examined to see the significance at 0.05 level of significance. Thus ‘t’ ratio of 2.00 were needed for significance at 0.05 levels respectively.
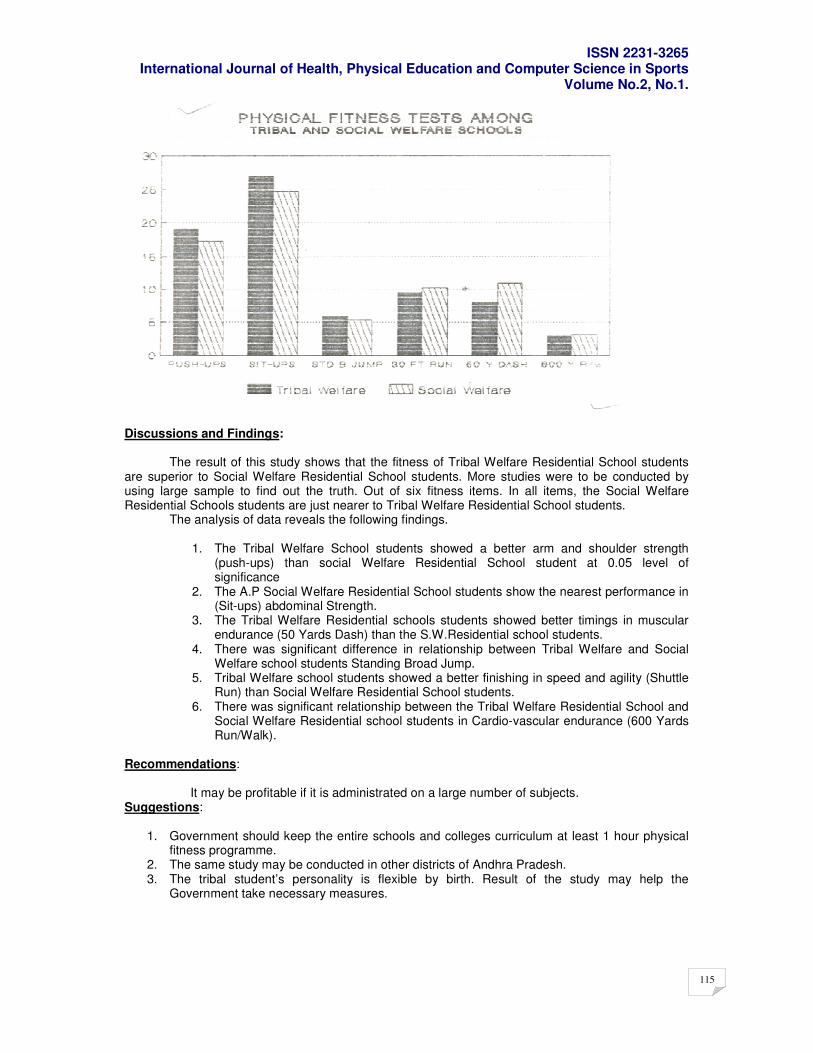
ISSN 2231-3265 International Journal of Health, Physical Education and Computer Science in Sports
Volume No.2, No.1.
115
Discussions and Findings: The result of this study shows that the fitness of Tribal Welfare Residential School students are superior to Social Welfare Residential School students. More studies were to be conducted by using large sample to find out the truth. Out of six fitness items. In all items, the Social Welfare Residential Schools students are just nearer to Tribal Welfare Residential School students. The analysis of data reveals the following findings.
1. The Tribal Welfare School students showed a better arm and shoulder strength
(push-ups) than social Welfare Residential School student at 0.05 level of significance
2. The A.P Social Welfare Residential School students show the nearest performance in (Sit-ups) abdominal Strength.
3. The Tribal Welfare Residential schools students showed better timings in muscular endurance (50 Yards Dash) than the S.W.Residential school students.
4. There was significant difference in relationship between Tribal Welfare and Social Welfare school students Standing Broad Jump.
5. Tribal Welfare school students showed a better finishing in speed and agility (Shuttle Run) than Social Welfare Residential School students.
6. There was significant relationship between the Tribal Welfare Residential School and Social Welfare Residential school students in Cardio-vascular endurance (600 Yards Run/Walk).
Recommendations: It may be profitable if it is administrated on a large number of subjects. Suggestions:
1. Government should keep the entire schools and colleges curriculum at least 1 hour physical fitness programme.
2. The same study may be conducted in other districts of Andhra Pradesh. 3. The tribal student’s personality is flexible by birth. Result of the study may help the
Government take necessary measures.
ISSN 2231-3265 International Journal of Health, Physical Education and Computer Science in Sports
Volume No.2, No.1.
116
pp116-118
Physical Education and 21st Century Learners: A Consensus Statement
Christopher R. Edginton, Ph.D.Professor
School of Health, Physical Education and Leisure Services University of Northern Iowa,Cedar Falls, Iowa USA
Ming-kai Chin,
Ph.D.Vice President of Global Affairs and Research HOPSports, Inc.Valencia, California USA
Gulshan Khanna,
Ph.D.Professor & Dean Faridabad Institute of Technology & Science Manav Rachna International University, India
Introduction: Exercise and physical activity produces a wide variety of benefits for individuals. From a traditional viewpoint, physical education programs have often been narrowly focused on acquisition of sport, skills and knowledge. Further, as physical education teachers have been prepared, they, likewise, have gained knowledge often limited to the teaching of sport skills as well as teaching methods, styles and procedures. However, does this model effectively meet the needs of 21
st Century learners? For
example, how does technology and the need for effective assessment and accountability in the classroom and beyond manifest itself in terms of the design of a contemporary physical education curriculum? How is the role of physical education integrated in terms of one’s daily living beyond the classroom setting? What skills and knowledge will be required to adequately advance one’s physical literacy as well as one’s knowledge and skills required to live a health active lifestyle? The Global Forum for Physical Education Pedagogy 2010 (GoFPEP 2010) was convened in a two-day intensive format to address many of the aforementioned issues and concerns. The event was attended by 70 invited educators, professionals, administrators, business leaders and policymakers from 25 countries. The event was the first ever international summit held in the United States following previous concaves resulting in similar documents documents such as UNESCO’s International Charter for Physical Education and Sport adopted at its General Conference in Paris, 1978; The Berlin Agenda for Action for Government Ministers, accepted at the 1
st World Summit of
Physical Education, 1999; and the Magglingen Commitment for Physical Education approved in 2005 in Switzerland. Delegates focused their dialog and discussion on several major themes including: 1) reframing health and physical education pedagogy internationally by promoting dialogue and discussion on critical themes and issues; 2) exploring a new model of pedagogy for preparing health and physical education teachers which promotes accountability, builds community life, employs a greater use of reflection to improve practice and embeds learning in practice; 3) examining the extension of health and physical education based school programs into community life; 4) reviewing the application of technology as related to the teaching of health and physical education; 5) promoting the establishment of partnerships between the school, community, university, nongovernmental organizations and commercial enterprises; 6) rethinking the relationship between health and physical education as a strategy for promoting lifelong active living; and 7) stimulating forward thinking.
ISSN 2231-3265 International Journal of Health, Physical Education and Computer Science in Sports
Volume No.2, No.1.
117
A primary outcome of GoFPEP 2010 was the crafting of a global Consensus Statement entitled Health and Physical Education Pedagogy in the 21st Century. To generate the Consensus Statement, invited delegates were asked to provide information in advance of the event, offering recommendations regarding innovative teaching strategies and methods, ideas for reforming physical education teacher preparation and suggestions to be included in the consensus document. These statements were crafted into posters and presented in the forum program. Delegates participated in a series of keynote and invited presentations and workshops and discussion groups. Discussion groups were organized to include different geographical regions of the world and areas of professional interests. All of the information was analyzed using the Qualrus data analysis software package to identify and refine consistent themes. Following, a writing team drafted the statement and it was then vetted by several key individuals and, ultimately, by all delegates. Table 1 presents the Consensus Statement.
Table 1 Global Forum for Physical Education Pedagogy 2010
Health and Physical Education Pedagogy in the 21st Century A STATEMENT OF CONSENSUS
Physical education programs in the 21st Century can inspire, motivate and prepare learners to live in an ever-changing world, increasingly marked by the epidemic of obesity and overweight individuals. Increasingly, globalization, explosion of knowledge and changing demographics have a significant impact on the knowledge, skills and dispositions required to live, work and play in the 21st Century. Children and youth will be required to gain critical thinking and problem solving skills, operate with agility and adaptability, effectively analyze information, communicate in various oral and written forms, reflect greater curiosity, imagination and innovation in their thinking and develop healthy active lifestyles. Worldwide, physical education programs, as well as physical education teacher preparation programs, need to be rethought and reformed. Hosted by the University of Northern Iowa (USA) and the Grundy Center, Iowa (USA) Community Schools, the Global Forum for Physical Education Pedagogy 2010 (GoFPEP 2010) was organized to examine 1) a new pedagogy for preparing physical education teachers; 2) utilization of technology to help teach physical education; and 3) the building of school, university, community and corporate partnerships. GoFPEP 2010 drew 70 invited delegates from 25 countries representing 64 universities, schools, businesses, community organizations and professional organizations and societies. The Health and Physical Education Pedagogy in the 21st Century Statement of Consensus calls for action by students, physical educators, health and leisure professionals, policy makers and legislators, citizens and leaders from business and industry to encourage programs that promote a committed effort to enhancing and maintaining the health and wellbeing of individuals Physical Education Pedagogy
• Focusing on content and methodologies to develop healthy active lifestyles for children and youth. This requires the integration of skill development, physical fitness, health, nutrition and planning for leisure
� Redesigning the physical education curriculum to promote active student-centered learning and
empowering individuals to develop life skills that lead to lifelong, self-directed engagement in physical activity
� Accentuating the importance of co-operation of stakeholders in the community (teachers, administrators, parents, community members, business leaders and others) to advocate, promote, educate and develop individuals to incorporate physical activities into their daily life through formal and informal education
• Establishing physical education and health programs as models of social justice which foster a safe learning environment, promote the joyful participation of physical activity with appreciation of

ISSN 2231-3265 International Journal of Health, Physical Education and Computer Science in Sports
Volume No.2, No.1.
118
cultural, racial, ethnic and social and economic differences
� Linking knowledge, skills and dispositions required by 21st Century learners with program
outcomes such physical competency (skills and fitness), health literacy and leisure planning throughout all subject matter and disciplines in the school
• Using technology to support individualized learning processes and assessment � Re-conceptualizing the strategies of assessment with appropriate measurable and performance
based goals and objectives tied to standards which promote greater accountability
• Insuring that qualified professionals teach physical education and health, physical activities and sport and leisure
Physical Education Teacher Preparation � Emphasizing the acquisition of teaching techniques and strategies for assisting individuals in
developing a healthy active lifestyle; one which recognizes the importance of the integration of health and physical education.
• Advocating for policies and a broad continuum of programs including healthy nutrition, weight management, physical activity and leisure planning
• Creating a positive learner-centered environment reflecting best practice to encourage students to become active participants in the learning process
• Promoting the development of partnerships with parents, schools and community organizations to embed and provide contextually based program elements which enhance physical education teacher preparation
• Developing sensitivity for one’s role in addressing racial, ethnic, cultural differences, socio-economic levels, funding levels, access to equipment and facilities, as well as approaches to mitigate these issues
� Including assessment and educational strategies which provide program accountability, as well as
a focus on educational processes and individual developmental outcomes
• Linking practice to theory, promoting the use of reflection and the use of effective technology to accentuate learning opportunities
• Linking the evaluation of students in physical education teacher preparation programs to relevant knowledge, skills and dispositions directly tied to best practice
ISSN 2231-3265 International Journal of Health, Physical Education and Computer Science in Sports
Volume No.2, No.1.
119
pp119-121
A study on physical efficiency, mental health and intelligence of rural and urban school children of Krishna district in Andhra Pradesh
Dr. Nalluri Srinivasa Rao, Lecturer in Physical Education,
V.K.R. College, Buddhavaram,Krishna Dist.A.P.
Introduction: Nowadays Sports Psychology is becoming very prominent and interesting in Indian Sports. Many Scientists have concerned the dimensions of sports psychology such as motivation, anxiety, intelligence, level of aspiration, self-concept pertaining to sound mental health condition etc., to be useful for sports talents for achieving the success. Thus the present study was envisaged to find out the difference and relation of physical efficiency, mental health and intelligence of rural and urban school children. STATEMENT OF THE PROBLEM:The purpose of investigation was to find 0ut differences and also relation of Physical efficiency, Mental health and intelligence between Rural and Urban school children of Krishna District of Andhra Pradesh. DELIMITATIONS The study was delimited to the students of selected rural and urban schools of Krishna District of the State of Andhra Pradesh. LIMITATIONS Students who had completed 14 years of age and were studying in rural and urban government schools were recognized as subjects for this study. SIGNIFICANCE OF THE STUDY The findings of the present study may help and encourage the physical educators, coaches government machineries and education departments. PROCEDURE OR METHODOLOGY This is an explanatory study and a combination of experimental and descriptive research. The variable physical efficiency was treated for experimental research, the other two variables i.e., mental health and intelligence were treated for descriptive research. SELECTION OF SUBJECTS For this study the investigator follows the cluster sampling method. Two hundred students studying particularly in different schools of urban and rural religions of Krishna District of Andhra Pradesh State. Selection of schools were made on random basis whereas the subjects were taken from among the age group of completed 14 years and below 14.5 years in all cases. STATISTICAL TECHNIQUES The statistical techniques adopted to find out the differences were one way Analysis of Variance (ANOVA). Scheffe posthoc test and to find out the relation, the correlation of coefficient using product moment method of correlation was worked out. In all cases the level of significance at 0.01 level was tested.
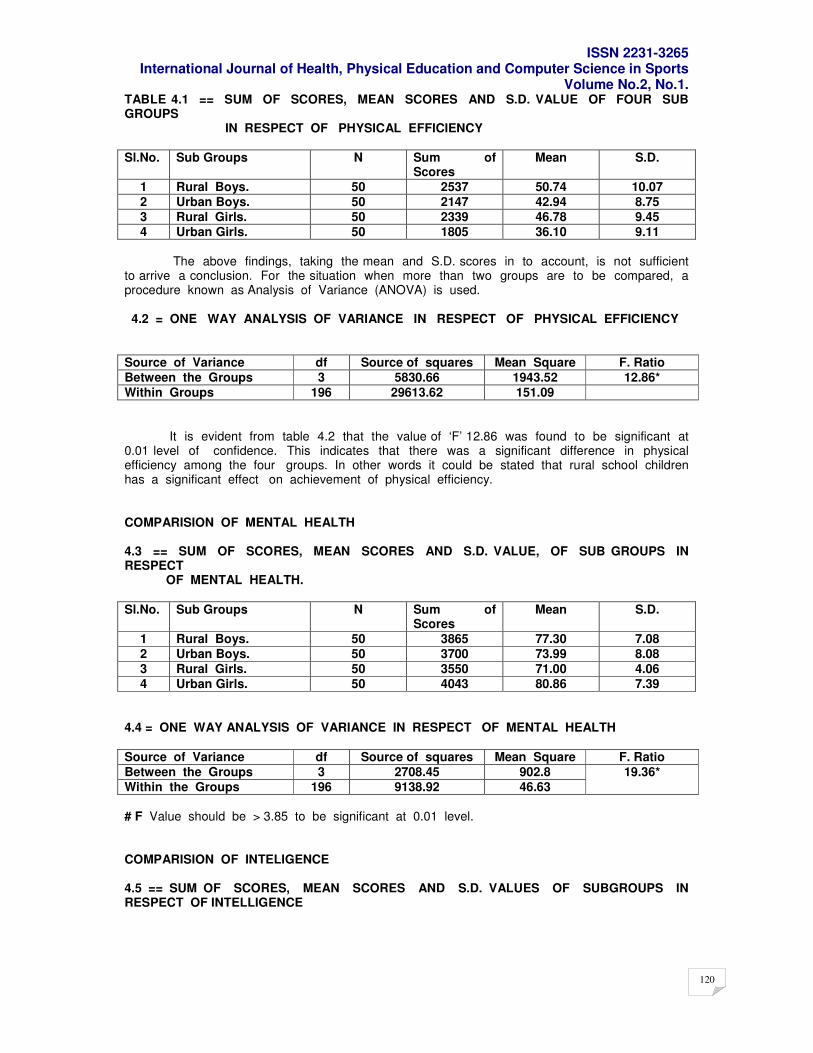
ISSN 2231-3265 International Journal of Health, Physical Education and Computer Science in Sports
Volume No.2, No.1.
120
TABLE 4.1 == SUM OF SCORES, MEAN SCORES AND S.D. VALUE OF FOUR SUB GROUPS IN RESPECT OF PHYSICAL EFFICIENCY
Sl.No. Sub Groups N Sum of Scores
Mean S.D.
1 Rural Boys. 50 2537 50.74 10.07
2 Urban Boys. 50 2147 42.94 8.75
3 Rural Girls. 50 2339 46.78 9.45
4 Urban Girls. 50 1805 36.10 9.11
The above findings, taking the mean and S.D. scores in to account, is not sufficient to arrive a conclusion. For the situation when more than two groups are to be compared, a procedure known as Analysis of Variance (ANOVA) is used. 4.2 = ONE WAY ANALYSIS OF VARIANCE IN RESPECT OF PHYSICAL EFFICIENCY
Source of Variance df Source of squares Mean Square F. Ratio
Between the Groups 3 5830.66 1943.52 12.86*
Within Groups 196 29613.62 151.09
It is evident from table 4.2 that the value of ‘F’ 12.86 was found to be significant at 0.01 level of confidence. This indicates that there was a significant difference in physical efficiency among the four groups. In other words it could be stated that rural school children has a significant effect on achievement of physical efficiency. COMPARISION OF MENTAL HEALTH 4.3 == SUM OF SCORES, MEAN SCORES AND S.D. VALUE, OF SUB GROUPS IN RESPECT OF MENTAL HEALTH.
Sl.No. Sub Groups N Sum of Scores
Mean S.D.
1 Rural Boys. 50 3865 77.30 7.08
2 Urban Boys. 50 3700 73.99 8.08
3 Rural Girls. 50 3550 71.00 4.06
4 Urban Girls. 50 4043 80.86 7.39
4.4 = ONE WAY ANALYSIS OF VARIANCE IN RESPECT OF MENTAL HEALTH
Source of Variance df Source of squares Mean Square F. Ratio
Between the Groups 3 2708.45 902.8
Within the Groups 196 9138.92 46.63
19.36*
# F Value should be > 3.85 to be significant at 0.01 level.
COMPARISION OF INTELIGENCE 4.5 == SUM OF SCORES, MEAN SCORES AND S.D. VALUES OF SUBGROUPS IN RESPECT OF INTELLIGENCE
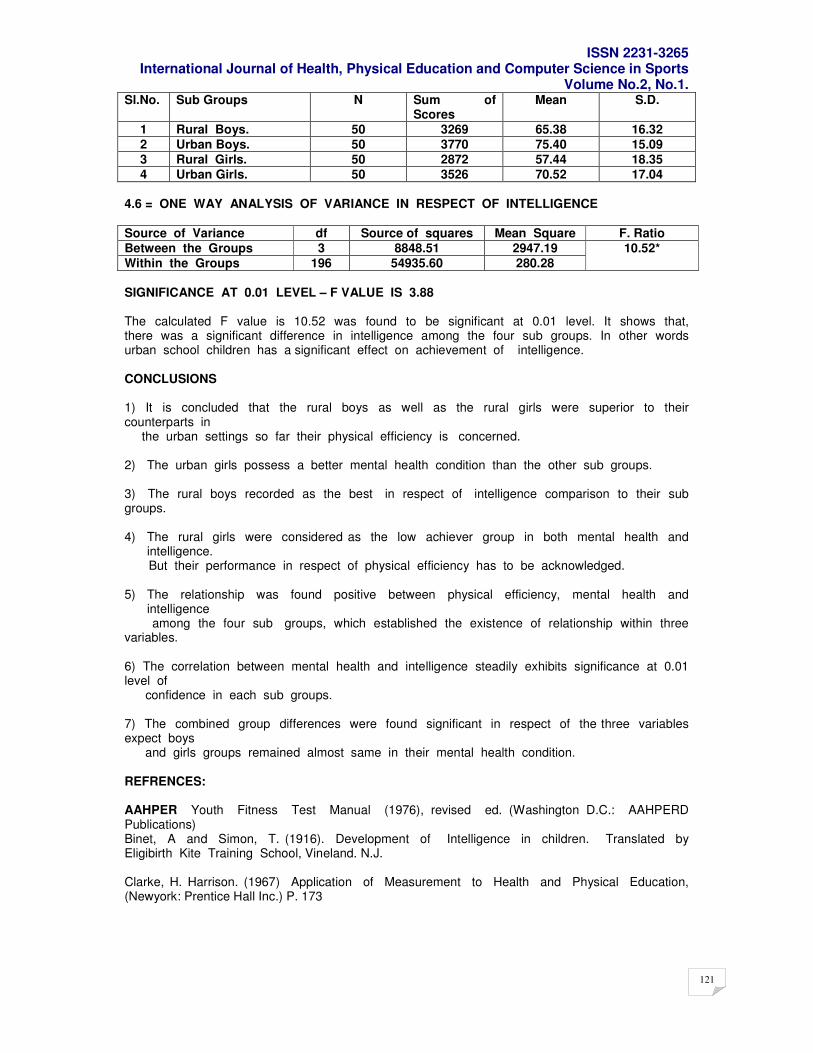
ISSN 2231-3265 International Journal of Health, Physical Education and Computer Science in Sports
Volume No.2, No.1.
121
Sl.No. Sub Groups N Sum of Scores
Mean S.D.
1 Rural Boys. 50 3269 65.38 16.32
2 Urban Boys. 50 3770 75.40 15.09
3 Rural Girls. 50 2872 57.44 18.35
4 Urban Girls. 50 3526 70.52 17.04
4.6 = ONE WAY ANALYSIS OF VARIANCE IN RESPECT OF INTELLIGENCE
Source of Variance df Source of squares Mean Square F. Ratio
Between the Groups 3 8848.51 2947.19
Within the Groups 196 54935.60 280.28
10.52*
SIGNIFICANCE AT 0.01 LEVEL – F VALUE IS 3.88 The calculated F value is 10.52 was found to be significant at 0.01 level. It shows that, there was a significant difference in intelligence among the four sub groups. In other words urban school children has a significant effect on achievement of intelligence. CONCLUSIONS 1) It is concluded that the rural boys as well as the rural girls were superior to their counterparts in the urban settings so far their physical efficiency is concerned. 2) The urban girls possess a better mental health condition than the other sub groups. 3) The rural boys recorded as the best in respect of intelligence comparison to their sub groups. 4) The rural girls were considered as the low achiever group in both mental health and
intelligence. But their performance in respect of physical efficiency has to be acknowledged. 5) The relationship was found positive between physical efficiency, mental health and
intelligence among the four sub groups, which established the existence of relationship within three variables. 6) The correlation between mental health and intelligence steadily exhibits significance at 0.01 level of confidence in each sub groups. 7) The combined group differences were found significant in respect of the three variables expect boys and girls groups remained almost same in their mental health condition. REFRENCES: AAHPER Youth Fitness Test Manual (1976), revised ed. (Washington D.C.: AAHPERD Publications) Binet, A and Simon, T. (1916). Development of Intelligence in children. Translated by Eligibirth Kite Training School, Vineland. N.J. Clarke, H. Harrison. (1967) Application of Measurement to Health and Physical Education, (Newyork: Prentice Hall Inc.) P. 173
ISSN 2231-3265 International Journal of Health, Physical Education and Computer Science in Sports
Volume No.2, No.1.
122
pp122-126
Readiness of Instructors Involved in theFields of Physical Education and Sports
ScienceTo Welcome Total Quality Management
1Lila Sabbaghian Rad,
2Haniyeh Yari
Physical Education and Sport Science Department, Science and Research Branch,
Islamic Azad University, Iran
ABSTRACT The purpose of this study was investigation of readiness of PE and sport science instructors to accept Total Quality Management (TQM) that, using questionnaire, evaluates viewpoint and approach of Physical Education instructors on total quality management. A questionnaire has been provided for collecting information and individual characters such as sex, scientific echelon, length of service, educational degree, employment status and university of teaching. Moreover, the total quality management questionnaire, which is a researcher-made one, was construed by Siavashi in 2007. Nevertheless, its justifiability has been confirmed by Physical Education and Sports Science Faculties. In the meantime, the reliability for such a society gained 0.87 through Chronbach Test. The research statistical society consists of all instructors who are 132 people and work in Physical Education and Sports Science Departments of the Islamic Azad University in district 5 within academic year 2010-2011. The statistical sample has been considered as big as society which were 92 people. Results showed that there was a significant difference between employment status and credentials and non significant difference between gender, scientific echelon, length of service and different universities to accept TQM. The majority of PE instructors(91.3 percent) were totally ready to accept TQM and they have the highest readiness for accepting leadership commitment (on an average of 13.79) and the lowest readiness for accepting teamwork (on an average of 12.72). Keywords: Total Quality Management, Physical Education Instructors
Introduction
Higher education is one of the most important entities in parallel with education, development and
supply of human resources and is the main basis for all-aspect development and expansion in every
country (4). In fact, higher education is one of the greatest, enriched and still unknown resources
which has not been completely utilized so far. Such a resource plays a remarkable role in socio-
economic policies and other affairs of a society. A total quality management is a systematic approach
for management of organizations which either cares needs of customers/clients or designs systems of
an organization for quality improvement (3). TQM provides the best correspondence with higher
education’s objectives. Furthermore, quality principles shall basically correspond with higher
education’s values. Nevertheless, it has more effect than in industry (16). Recent decades evolutions
of higher education system in Iran i.e. appearance of various higher education institutions poses a
question that if quantitative increase means quality existence. The answer is absolutely negative. We
need to think about quality improvement in university systems. One of the distresses of university
managers and leaders is the following question. Is there any better way for higher education
management ? The answer is positive. The university leaders, who have clear viewpoints on quality,
know their university responsibility and design the goals very well. That university, always evaluates
its own performance, may correspond itself with current progressions, innovates and paves much
better the road of higher education management. The next point in quality management is that who is
the quality consumer. Paying attention to the role of a consumer is a focus point on quality nature.
ISSN 2231-3265 International Journal of Health, Physical Education and Computer Science in Sports
Volume No.2, No.1.
123
Consumers are the final judges on quality. Therefore, it is very essential for university to distinct
consumers (1). Nowadays, it seems that instructors are not generators and they do not care about
students well enough. In the meantime, the university instructors believe that they are working hard
because they are teaching bigger classes. Consequently, they have less time for students. Moreover,
using traditional ways for teaching and valuating in big groups creates anger and limitation (2). In
competitive circumstances of today world, competition is very important for attraction of capital,
efficiency rise, effectiveness of academic semesters, encouragement for teamwork and … in all fields
of study, specifically in the field of physical education, time consuming and spending expenses are
needed by university, therefore, it is vital to use a way through which all these goals are approached.
With taking into consideration the aforementioned, we need to know about the way of thinking and
ideas of those instructors who work in the fields of physical education and sports science at Islamic
Azad University, district 5. In fact, it must be specified that how much the instructors of these
universities are ready to welcome total quality management thought. Which one of these existing
elements is more important from the viewpoint of these people ? Finally, it specifies the differences
between instructors of such a field of study for welcoming TQM thought with some of their features
such as sex, employment status, educational level, scientific echelon, job history and different
universities. In a review article entitled “TQM in Higher Education”, Ollie and Spinwal (et al 1984)
declared that the role which quality plays in higher education becomes more significant day after day
and there is no alternative for quality. Moreover, quality increase may lead to productivity rise.
Meanwhile, there are some philosophies such as total quality management as a way for higher
education (15). “Quality is determined upon customer satisfaction. Quality results decrease in variety.
And quality should be measurable (9).” Bensimon (et al 1995) declares in an article entitled “Quality
Management in University”. Hebert and Dekkaba (et al 1995) conducted a study on “Comprehensive
Quality Management in School Business: Viewpoint of Faculty Members”. It is said that TQM, as a
managerial method may cause organizational productivity improvement and a well-known
performance, is currently considered as a solution for problems occurred for the U.S. higher education
institutions (11). In an article entitled “Need to Execution of Comprehensive Quality Management in
Educational System”, Motwani and Kumar (1997) declare that there are some worries about the use
of comprehensive quality management in academic system and the literature utilized for (14).
Elmuti (1999) conducted a research called “Is the execution of TQM plans useful and worthy for
higher education ?” All results showed that TQM philosophy in higher education assists to improve
individual and group enthusiasm, costs decline, betterment of activities and customers requirements
reply. Furthermore, a false use of TQM techniques and existing no systematic approach may have an
unsuccessful outcome (10). In a research which Gopal and Kanji (2000) conducted under title “TQM
in Malaysian Higher Education Institutions”, they came to this conclusion that the role of leadership is
the most important factor in execution of TQM in higher education institutions (12). Kruger (2001), in
a research entitled “TQM Main Schools: 5 Nobles” declares that the initial development of quality
movement was accomplished only by some pioneers named “DEMING, JORAN, FIGNBAM, KRASBI
and ISHIKAWA (13). Moreover, in a research entitled “Study on Readiness of Faculty Members of
Physical Education and Sports Science Faculties to Welcome Total Quality Management”, conducted
on all faculty members of Faculties of Physical Education and Sports Science, Siavashi (2007) came
to this conclusion that: In those alternatives such as position, credentials, faculties, scientific
echelons, there are meaningful differences between TQM indexes and TQM itself. On the contrary, no
meaningful difference found between sex, teaching history and TQM (2). .
Research Methodology
This is a descriptive, applied, field and forward-looking research. The present research is considered as a type of field-oriented research that, using questionnaire, evaluates viewpoint and approach of Physical Education instructors on total quality management. A questionnaire has been provided for collecting information and individual characters such as sec, scientific echelon, length of service, educational degree, employment status and university of teaching. Moreover, the total quality
ISSN 2231-3265 International Journal of Health, Physical Education and Computer Science in Sports
Volume No.2, No.1.
124
management questionnaire, which is a researcher-made one, was construed by Siavashi in 2007. Nevertheless, its justifiability has been confirmed by Physical Education and Sports Science Faculties. In the meantime, the reliability for such a society gained 0.87 through Chronbach Test. Such a questionnaire includes ten indexes i.e. teamwork, education, evaluation and feedback departments, the modality of how to use information, qualitative objectives, customer-orientation, proposals systems, nonstop betterment and leadership commitment. Every index consists of four questions. Researcher assesses viewpoints of instructors in accordance with analogous questions together with ten TQM features in higher education and as per LIKERT 4-distractor answer (I totally agree = 4 ; I agree 3 ; I disagree 2 ; I totally disagree 1). Whereas, some of the questions in questionnaire are negative, therefore, the relevant answers are on the contrary of (I totally agree = 4 ; I agree 3 ; I disagree 2 ; I totally disagree 1). The research statistical society consists of all instructors who are 132 people and work in Physical Education and Sports Science Departments of the Islamic Azad University in district 5 within academic year 2010-2011. In fact, district 5 of Islamic Azad University covers Central, Lorestan and Hamedan provinces. Ashtian, Arak and Saveh from Central province; Boroujerd and Doroud from Lorestan province and Toyserkan, Malayer and Hamedan from Hamedan province, all have Physical Education and Sports Science Department. Because of low volume of society, the statistical sample has been considered as big as society which were 92 people due to returning not all of questionnaires. Sorting out gender, there were 35 female instructors and 57 male ones out of whom 27 were faculty members and 65 were remuneration instructor. 88 instructors had instruction scientific echelon, 2 were assistant professors and 2 were associate professors. None of them had professor scientific echelon. Frequency of instructors having length of services in 0-3, 3-6, 6-9, 9-12, 12-15, 15-18 and 18-21 years was 15, 15, 21, 18, 9, 7 and 7 people respectively. Frequency of instructors having bachelor’s degree was 13; having master’s degree it was 66 people and having Ph.D. or M.D. it was 13 people. Meanwhile, frequency of instructors based on different universities of Arak, Saveh, Ashtian, Hamedan, Malayer, Toyserkan, Boroujerd and Doroud, was 32, 21, 3, 12, 10, 1, 10 and 3 respectively. The descriptive statistics was used for classifying data. As to drawing tables and charts, Excel program was also used. All statistical operation was carried out through SPSS 16 software. Moreover, P≤0/05 was considered as significant level. In order to analyze data, independent t test, one-way Anova test as well as lowest significant difference test were used. Research Findings Table 1 Description of Instructors Readiness Rate to Accepting TQM
Alternative
Frequency of Readiness Lower Levels
Frequency Rate of Readiness Lower Levels
Frequency of Readiness Medium Levels
Frequency Rate of Readiness Medium Levels
Frequency of Readiness Upper Levels
Frequency Rate of Readiness Upper Levels
TQM Acceptance Readiness
0 0% 8 8.7% 84 91.3%
For specifying readiness rate of instructors to accept TQM, their overall mark, which has been gained from total marks of 40 questions in the questionnaire, is used. The lowest mark for readiness rate is 40 and the highest mark is 160. According to marks distribution, the readiness rate is divided into three levels of low, medium and high. In this case, those who gain mark between 40 to 80 are evaluated in low level; those who gain mark between 80 to 120 are evaluated in medium level; and those who gain mark between 120 to 160 are evaluated in high level of readiness rate. As you can see in Table 1, 91.3 of instructors are placed in high level of readiness rate. Moreover, instructors have the least readiness to accept teamwork on an average of 12.72 and have the most readiness to accept leadership commitment on an average of 13.79. Table 2 Comparison of TAM Admission Mark In Terms of Gender and Employment Status
Statistics
Theorem t Rate
Freedom Degree
Significant Level
Comparison of Male and Female Instructors -0/615 90 0/54
Comparison of Faculty Members and Remuneration Instructors
3/73 90 0/0001
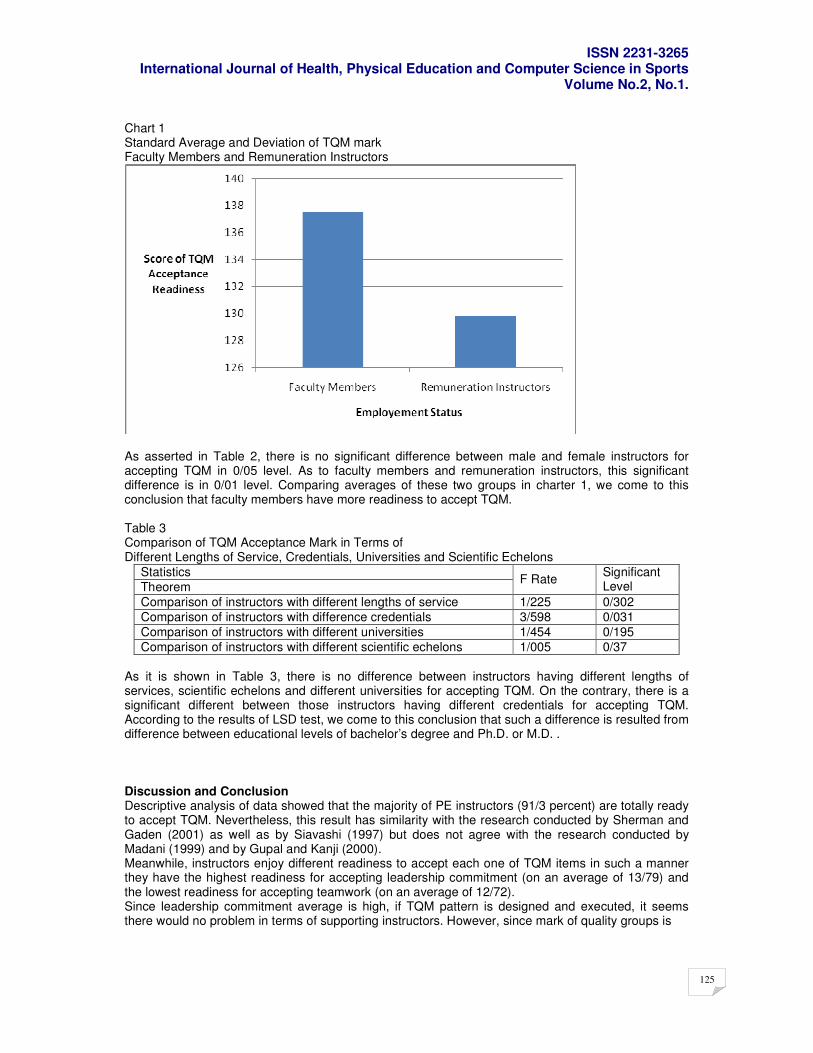
ISSN 2231-3265 International Journal of Health, Physical Education and Computer Science in Sports
Volume No.2, No.1.
125
Chart 1 Standard Average and Deviation of TQM mark Faculty Members and Remuneration Instructors
As asserted in Table 2, there is no significant difference between male and female instructors for accepting TQM in 0/05 level. As to faculty members and remuneration instructors, this significant difference is in 0/01 level. Comparing averages of these two groups in charter 1, we come to this conclusion that faculty members have more readiness to accept TQM. Table 3 Comparison of TQM Acceptance Mark in Terms of Different Lengths of Service, Credentials, Universities and Scientific Echelons
Statistics
Theorem F Rate
Significant Level
Comparison of instructors with different lengths of service 1/225 0/302
Comparison of instructors with difference credentials 3/598 0/031
Comparison of instructors with different universities 1/454 0/195
Comparison of instructors with different scientific echelons 1/005 0/37
As it is shown in Table 3, there is no difference between instructors having different lengths of services, scientific echelons and different universities for accepting TQM. On the contrary, there is a significant different between those instructors having different credentials for accepting TQM. According to the results of LSD test, we come to this conclusion that such a difference is resulted from difference between educational levels of bachelor’s degree and Ph.D. or M.D. . Discussion and Conclusion Descriptive analysis of data showed that the majority of PE instructors (91/3 percent) are totally ready to accept TQM. Nevertheless, this result has similarity with the research conducted by Sherman and Gaden (2001) as well as by Siavashi (1997) but does not agree with the research conducted by Madani (1999) and by Gupal and Kanji (2000). Meanwhile, instructors enjoy different readiness to accept each one of TQM items in such a manner they have the highest readiness for accepting leadership commitment (on an average of 13/79) and the lowest readiness for accepting teamwork (on an average of 12/72). Since leadership commitment average is high, if TQM pattern is designed and executed, it seems there would no problem in terms of supporting instructors. However, since mark of quality groups is
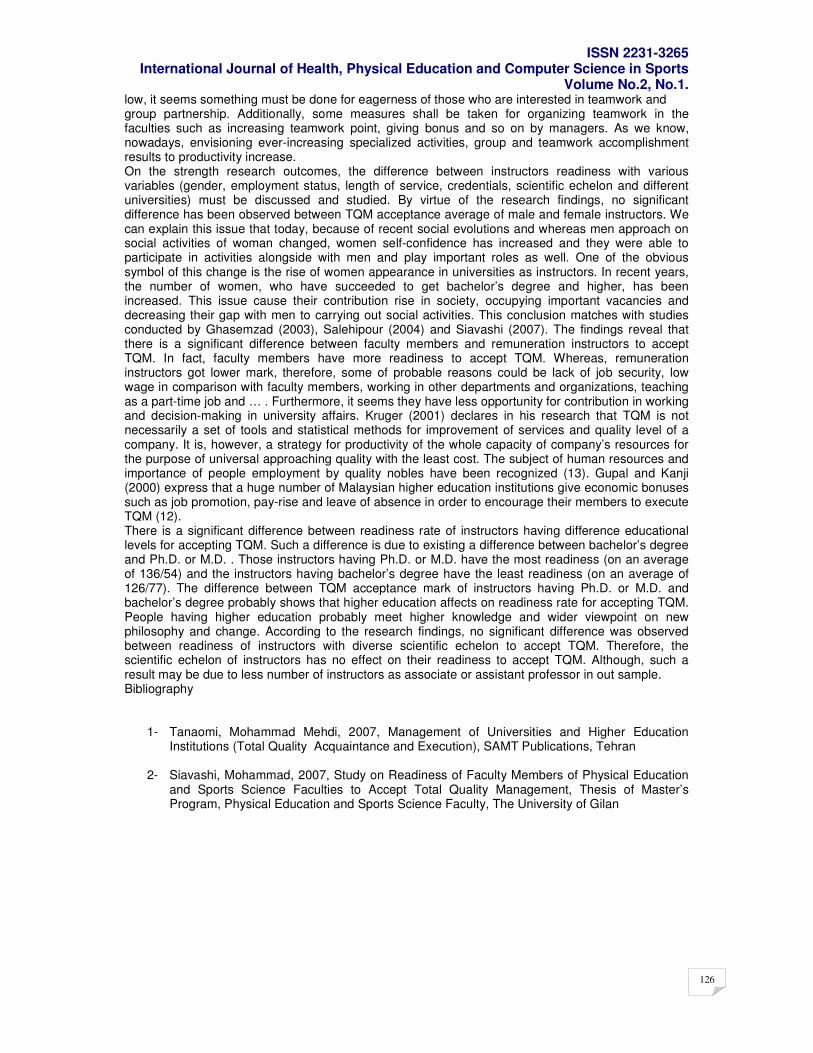
ISSN 2231-3265 International Journal of Health, Physical Education and Computer Science in Sports
Volume No.2, No.1.
126
low, it seems something must be done for eagerness of those who are interested in teamwork and group partnership. Additionally, some measures shall be taken for organizing teamwork in the faculties such as increasing teamwork point, giving bonus and so on by managers. As we know, nowadays, envisioning ever-increasing specialized activities, group and teamwork accomplishment results to productivity increase. On the strength research outcomes, the difference between instructors readiness with various variables (gender, employment status, length of service, credentials, scientific echelon and different universities) must be discussed and studied. By virtue of the research findings, no significant difference has been observed between TQM acceptance average of male and female instructors. We can explain this issue that today, because of recent social evolutions and whereas men approach on social activities of woman changed, women self-confidence has increased and they were able to participate in activities alongside with men and play important roles as well. One of the obvious symbol of this change is the rise of women appearance in universities as instructors. In recent years, the number of women, who have succeeded to get bachelor’s degree and higher, has been increased. This issue cause their contribution rise in society, occupying important vacancies and decreasing their gap with men to carrying out social activities. This conclusion matches with studies conducted by Ghasemzad (2003), Salehipour (2004) and Siavashi (2007). The findings reveal that there is a significant difference between faculty members and remuneration instructors to accept TQM. In fact, faculty members have more readiness to accept TQM. Whereas, remuneration instructors got lower mark, therefore, some of probable reasons could be lack of job security, low wage in comparison with faculty members, working in other departments and organizations, teaching as a part-time job and … . Furthermore, it seems they have less opportunity for contribution in working and decision-making in university affairs. Kruger (2001) declares in his research that TQM is not necessarily a set of tools and statistical methods for improvement of services and quality level of a company. It is, however, a strategy for productivity of the whole capacity of company’s resources for the purpose of universal approaching quality with the least cost. The subject of human resources and importance of people employment by quality nobles have been recognized (13). Gupal and Kanji (2000) express that a huge number of Malaysian higher education institutions give economic bonuses such as job promotion, pay-rise and leave of absence in order to encourage their members to execute TQM (12). There is a significant difference between readiness rate of instructors having difference educational levels for accepting TQM. Such a difference is due to existing a difference between bachelor’s degree and Ph.D. or M.D. . Those instructors having Ph.D. or M.D. have the most readiness (on an average of 136/54) and the instructors having bachelor’s degree have the least readiness (on an average of 126/77). The difference between TQM acceptance mark of instructors having Ph.D. or M.D. and bachelor’s degree probably shows that higher education affects on readiness rate for accepting TQM. People having higher education probably meet higher knowledge and wider viewpoint on new philosophy and change. According to the research findings, no significant difference was observed between readiness of instructors with diverse scientific echelon to accept TQM. Therefore, the scientific echelon of instructors has no effect on their readiness to accept TQM. Although, such a result may be due to less number of instructors as associate or assistant professor in out sample. Bibliography
1- Tanaomi, Mohammad Mehdi, 2007, Management of Universities and Higher Education Institutions (Total Quality Acquaintance and Execution), SAMT Publications, Tehran
2- Siavashi, Mohammad, 2007, Study on Readiness of Faculty Members of Physical Education and Sports Science Faculties to Accept Total Quality Management, Thesis of Master’s Program, Physical Education and Sports Science Faculty, The University of Gilan
ISSN 2231-3265 International Journal of Health, Physical Education and Computer Science in Sports
Volume No.2, No.1.
127
pp127-130
A comparative study on the differences in crouch start & standing start in 100 meters
run in Athletics
Dr.Rajesh Kumar, Associate Professor, Dept. of Physical Education, O.U. Hyd
Abstract: The aim of the present study to study the difference in crouch start and standing start in 100 Meters Run in Athletics. 16 Male Athletes between the age group of 18 to 24 Years of Osmania University were taken for the study. The 16 Male Athletes are made to Run 100 M Run first in standing start after the recovery time of one hour again they are made to run 100M Crouch Test. The Hand Timing are use for the Study and IAAF Level I Technical Officials are taken the timing of the Athletes. This study shows that the athlete who ran 100 M Run in Crouch Start are performed well compare to athletes who ran the 100 M Run in Standing Start.It is recommended that Coaches must give good Crouch Start Coaching for better results in sprints. Key words: crouch start, standing start, hand timing, sprints etc. Introduction: Track and field is one of the oldest of sports. Athletic contests were often held in conjunction with religious festivals, as with the Olympic Games of ancient Greece. Track and Field as a modern sport started in England during the 19
th century. English public school and University Students gave the
sport impetus through their inter class meets, or meetings. In 1849 the Royal Military Academy at Sandhurst held the first organized track and field meet of modern times.Not until the 1860s, however did the sport flourish. In 1866 the First English championships were held by the newly formed Amateur Athletic Club, which open the Competition to all gentlemen amateurs, specifically, athletes who received no financial compensation for their efforts. Although meets were held on the North American Continent as early as 1839, track and field first gain popularity in the late 1860s after the formation of the New York Athletic club in 1868.The Amateur Athletic Union of the United States, an association of track and field clubs,was formed in 1887 and has governed the sports in the United States since then. In 1896 the first Modern Olympic Games were staged. Although initially of limited appeal the Olympics captured the imagination of athletes and grew steadily, making track and field an international sport for the first time. In 1913 the International Amateur Athletic Federation was formed by representatives from 16 countries. Sprints are short running events in Athletics and Track and Field. Races over short distances are among the oldest running competitions. The first 13 editions of the Ancient Olympics featured only one event – the stadium race, which was a race from one end of the stadium to the other. There are three sprinting events which are currently held at the Summer Olympics and Outdoor World Championships: the 100 Metres, 200 Metres and 400 Metres. The first starting block were invented by the groundsman. The first starting blocks are not created to produce a better start. They were constructed to preserve the running surface not to damage. The Important Crouch Starts Techniques: 1.Bunch or Bullet Start 2. Medium Start 3.Elongated Start
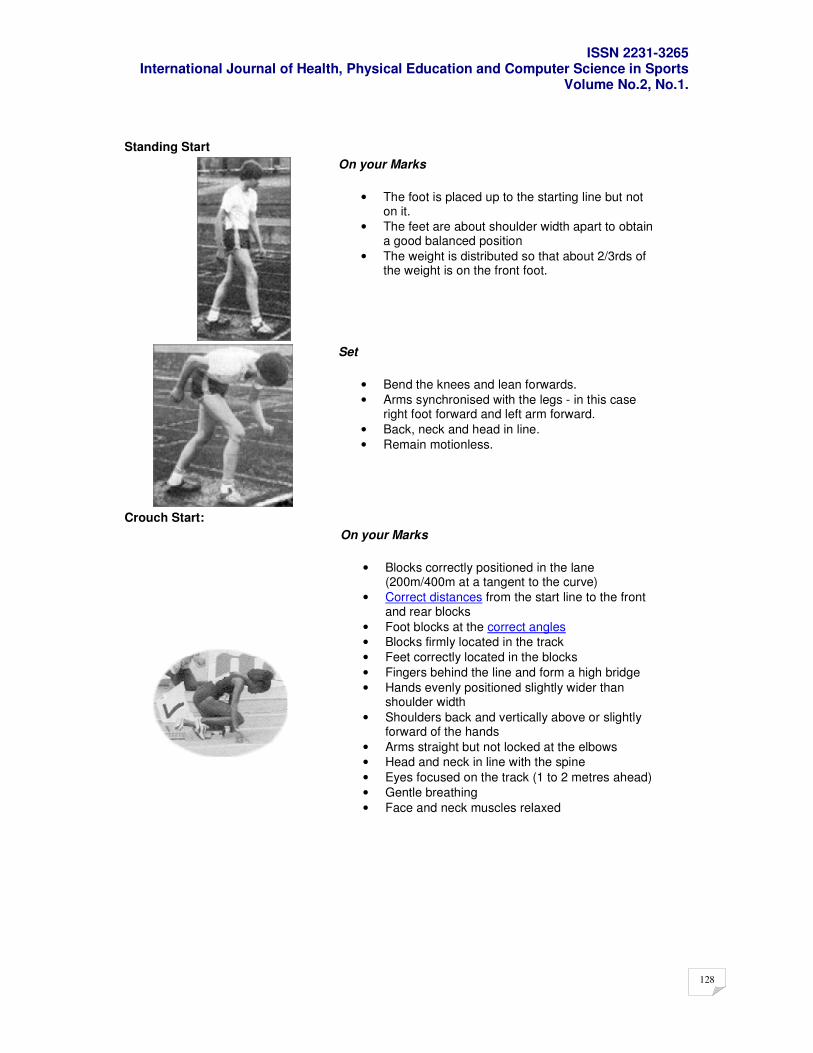
ISSN 2231-3265 International Journal of Health, Physical Education and Computer Science in Sports
Volume No.2, No.1.
128
Standing Start
On your Marks
• The foot is placed up to the starting line but not on it.
• The feet are about shoulder width apart to obtain a good balanced position
• The weight is distributed so that about 2/3rds of the weight is on the front foot.
Set
• Bend the knees and lean forwards.
• Arms synchronised with the legs - in this case right foot forward and left arm forward.
• Back, neck and head in line.
• Remain motionless.
Crouch Start:
On your Marks
• Blocks correctly positioned in the lane (200m/400m at a tangent to the curve)
• Correct distances from the start line to the front and rear blocks
• Foot blocks at the correct angles
• Blocks firmly located in the track
• Feet correctly located in the blocks
• Fingers behind the line and form a high bridge
• Hands evenly positioned slightly wider than shoulder width
• Shoulders back and vertically above or slightly forward of the hands
• Arms straight but not locked at the elbows
• Head and neck in line with the spine
• Eyes focused on the track (1 to 2 metres ahead)
• Gentle breathing
• Face and neck muscles relaxed
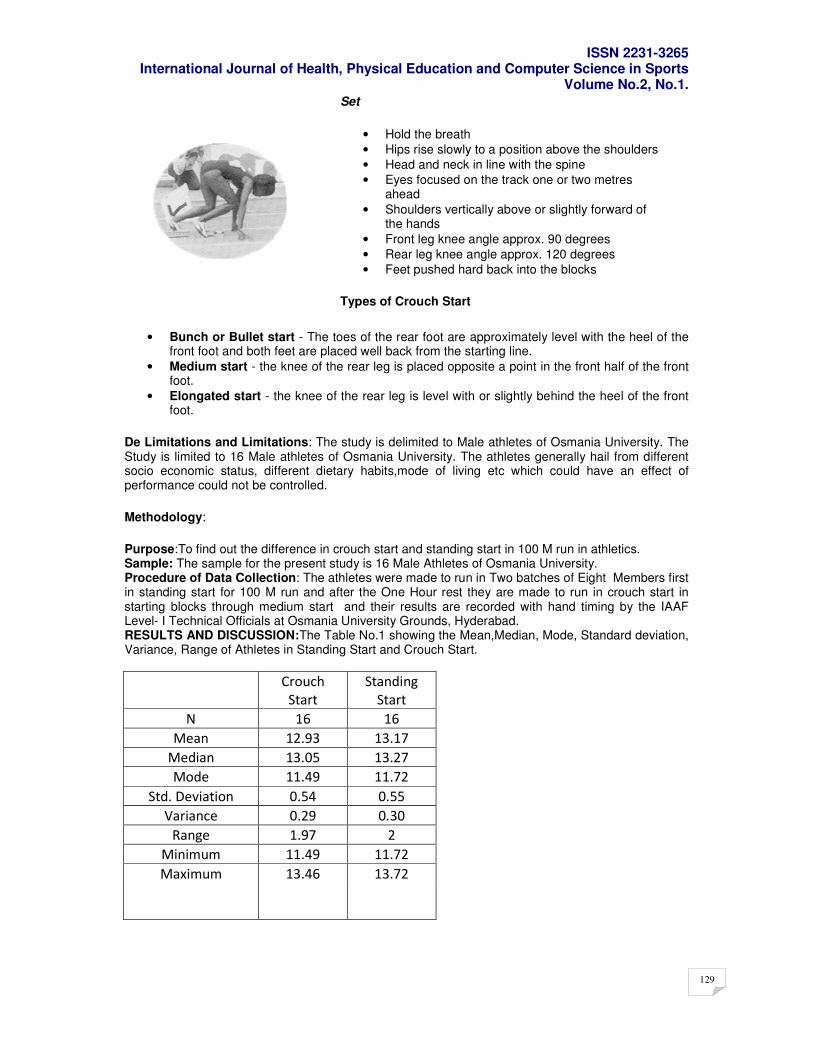
ISSN 2231-3265 International Journal of Health, Physical Education and Computer Science in Sports
Volume No.2, No.1.
129
Set
• Hold the breath
• Hips rise slowly to a position above the shoulders
• Head and neck in line with the spine
• Eyes focused on the track one or two metres ahead
• Shoulders vertically above or slightly forward of the hands
• Front leg knee angle approx. 90 degrees
• Rear leg knee angle approx. 120 degrees
• Feet pushed hard back into the blocks
Types of Crouch Start
• Bunch or Bullet start - The toes of the rear foot are approximately level with the heel of the front foot and both feet are placed well back from the starting line.
• Medium start - the knee of the rear leg is placed opposite a point in the front half of the front foot.
• Elongated start - the knee of the rear leg is level with or slightly behind the heel of the front foot.
De Limitations and Limitations: The study is delimited to Male athletes of Osmania University. The Study is limited to 16 Male athletes of Osmania University. The athletes generally hail from different socio economic status, different dietary habits,mode of living etc which could have an effect of performance could not be controlled.
Methodology:
Purpose:To find out the difference in crouch start and standing start in 100 M run in athletics. Sample: The sample for the present study is 16 Male Athletes of Osmania University. Procedure of Data Collection: The athletes were made to run in Two batches of Eight Members first in standing start for 100 M run and after the One Hour rest they are made to run in crouch start in starting blocks through medium start and their results are recorded with hand timing by the IAAF Level- I Technical Officials at Osmania University Grounds, Hyderabad. RESULTS AND DISCUSSION:The Table No.1 showing the Mean,Median, Mode, Standard deviation, Variance, Range of Athletes in Standing Start and Crouch Start.
Crouch
Start
Standing
Start
N 16 16
Mean 12.93 13.17
Median 13.05 13.27
Mode 11.49 11.72
Std. Deviation 0.54 0.55
Variance 0.29 0.30
Range 1.97 2
Minimum 11.49 11.72
Maximum 13.46 13.72
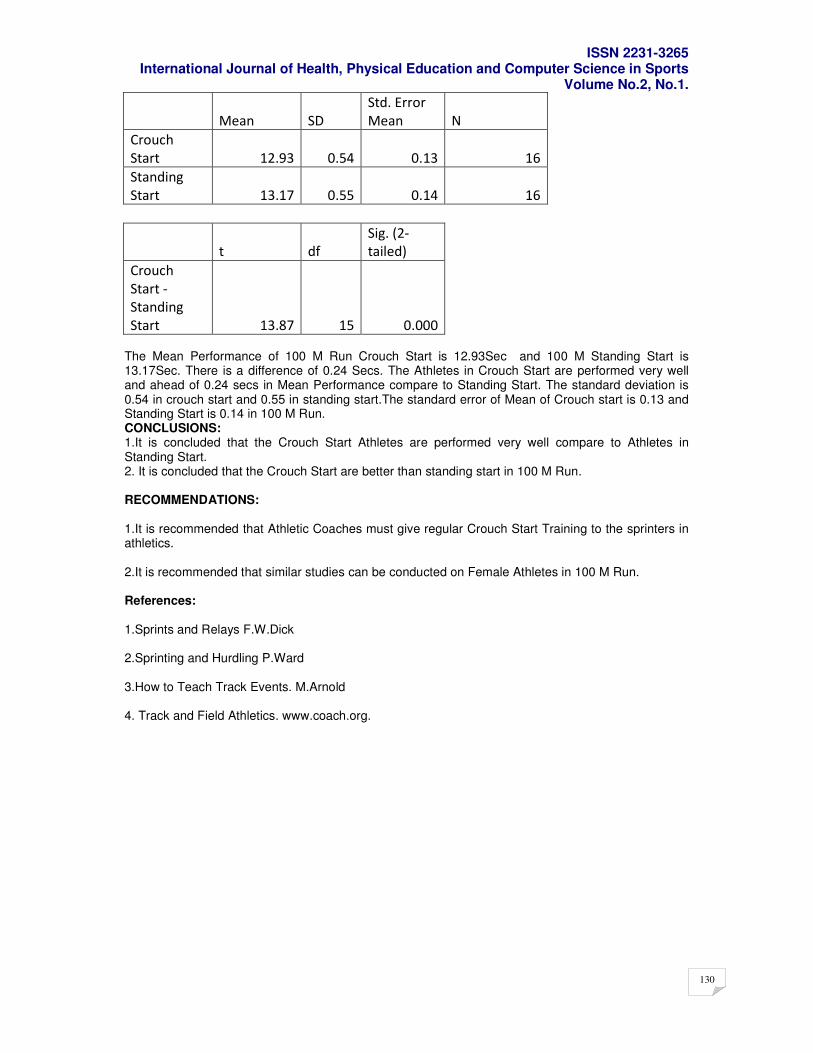
ISSN 2231-3265 International Journal of Health, Physical Education and Computer Science in Sports
Volume No.2, No.1.
130
Mean SD
Std. Error
Mean N
Crouch
Start 12.93 0.54 0.13 16
Standing
Start 13.17 0.55 0.14 16
t df
Sig. (2-
tailed)
Crouch
Start -
Standing
Start 13.87 15 0.000 The Mean Performance of 100 M Run Crouch Start is 12.93Sec and 100 M Standing Start is 13.17Sec. There is a difference of 0.24 Secs. The Athletes in Crouch Start are performed very well and ahead of 0.24 secs in Mean Performance compare to Standing Start. The standard deviation is 0.54 in crouch start and 0.55 in standing start.The standard error of Mean of Crouch start is 0.13 and Standing Start is 0.14 in 100 M Run. CONCLUSIONS: 1.It is concluded that the Crouch Start Athletes are performed very well compare to Athletes in Standing Start. 2. It is concluded that the Crouch Start are better than standing start in 100 M Run. RECOMMENDATIONS: 1.It is recommended that Athletic Coaches must give regular Crouch Start Training to the sprinters in athletics. 2.It is recommended that similar studies can be conducted on Female Athletes in 100 M Run. References: 1.Sprints and Relays F.W.Dick 2.Sprinting and Hurdling P.Ward 3.How to Teach Track Events. M.Arnold 4. Track and Field Athletics. www.coach.org.
ISSN 2231-3265 International Journal of Health, Physical Education and Computer Science in Sports
Volume No.2, No.1.
131
pp131
Stress Management – The key to success in sports
K.Ram Reddy,
Principal, Govt. College of Physical Education,Hyd
Introduction: In day to life stress became a big problem in our society, especially in sports.Though a top class sportsman is having scientific coaching and proper nutrition, still he is lacking in showing top class performance because of more stress. Stress always hamper the performance of an Individual in sports competitions. Stress is the response of the body to any demand placed upon them. It arises when they start to worry that they can’t cope. It is also considered as the ‘wear and tear’ of our mind and body as we adjust to the ever changing environment. Basically we can broadly classify symptoms of stress into three main groups. They are 1. Physical Symptoms 2. Emotional symptoms 3. Relational symptoms Physical Symptoms: Sleep disturbances, hypertension, headaches or migraine, irregular heart beat, palpitation and chest paint, fatigue, hair loss, upset tummy, constipation, acid reflux, heartburn, shortness of breath, asthma attacks, muscle weak, falling sick frequently etc. Emotional Symptoms: Worry, anxiety, irritable, nervous, frustration, depression, moody, lethargy, tired, difficulty in sleeping, confusion and difficulty in concentrating, inability to think clearly, a sense of helplessness. Related symptoms : Increased arguments, aggressive and abusive, tendency to over react, anti-social, violence etc. How to reduce the stress: Stress is inevitable in life but that doesn’t mean that we have to be passive about it and risk being stressed out. The following are the tips to reduce stress. 1.Start a Stress Diary: Keeping a stress diary is an effective way of finding out both what causes you stress and how to avoid stress. 2.Exercise: Taking frequent effective exercise is probably one of the best physical stress reducation techniques available. 3.Relaxation and Meditation Technique: Relaxation and Meditation Techniques are very good techniques to over come the stress. 4.Time Management: Stress is often cited as a result of poor time management. These are often the people who do not prioritize their jobs or tasks. 4.Develop your social net work: When under stress, it is very natural to withdraw from the world and concentrate exclusively on solving the problem that causes the stress. Since stress is a main hurdle to the performance of sports men, it shall be given higher priority to be treated. Hence Physical Education and Exercises plays main role for reducing the stress in sports persons or to any other individuals to become success in the life.
ISSN 2231-3265 International Journal of Health, Physical Education and Computer Science in Sports
Volume No.2, No.1.
132
pp132-133
Rehabilitation of knee injuries in kabbadi players in Punjab
Jalawar Singh,
Master of Sports Physiotherapy (Sports) Dr.Jagmohan Singh,
Professor and Principal, Gian Sagar College of Physiotherapy,Ramnagar, Rajpura, Patiala, Punjab Dr.Masilmani Neethi,
Associate Professor, Gian Sagar College of Physiotherapy, Ramnagar, Rajpura, Patiala, Punjab
Abstract: Background and purpose Rehabilitation is frequently used by physical therapists as an intervention for patients with limited ROM and PAIN in kabbadi (knee injuries). The purpose of the study is to the efficacy of rehabilitation in improving the flexion ROM and relief of PAIN in patients with knee injuries in kabbadi. Materials and MethodsOut of 60 subjects who were diagnose by an Orthopaedician as having knee injuries in kabbadi and who showed a typical restriction of ROM and PAIN. 30 were be given rehabilitation (experimental GROUP A)and the other 30 were (control GROUP B). Analysis was based on the ROM and relief of pain.Results The subjects who were given sports massage and strengthening exercises showed reduction in pain and improve ROM.ConclusionExperimental and Control groups are reducing knee pain with help of Rehabilitation but efficiencyRehabilitation is greater in Experimental group than Control group. Keywords: Kabbadi Knee Injuries; Pain; Range of motion; Rehabilitation; Strengthening etc.
Introduction The knee joint is the most complex joint of the body. The knee is formed by the femur (the thigh bone), the tibia (the shin bone), and the patella (the kneecap)
(14). Several muscles and ligaments
control the motion of the knee and protect it from damage at the same time. Kabbadi is a very complex sport. Knee joint is very vulnerable joint to get injured in kabbadi
(14).
Material and Methods Subjects were selected on the basis of convenient randomized sampling from the patients visiting Out Patient Department of Gian Sagar College of Physiotherapy, (Rajpura), Jotisar physiotherapy centre (Sangrur). Sample and method of selection: A sample of 60 subjects (30 subjects for experiment group and 30 subjects for control group) with kabbadi knee injuries who volunteered to participate and those fulfilling the inclusion and exclusion criteria were included in the study. Table 1: Age and Application distribution
Group No of subjects Age application
Experiment
30 Strengthening, Sports Message.
Control 30
15 – 35yrs
Cryotherapy
Procedure Visual analogue scale: Subject was asked it assign a number from 0 to 10 to his pain according to his perception of the seventy of the pain, with 0 being no pain and 10 being worst pain. I………………………………………………I No pain Worst pain Rom measurement: Universal goniometer (0-360
0)
1. The patient is in prone position with his/her feet off the table (knee fully extended), then subject actively flexes his/her knee to full flexion position
(10).
2. Place the axis of a goniometer at the intersection of the thigh and shank at the knee joint. 3. The stationary arm is along the line from the knee joint to the greater trochanter. 4. The moveable arm is along the lateral aspect of the fibula (fibular head to lateral malleolus).
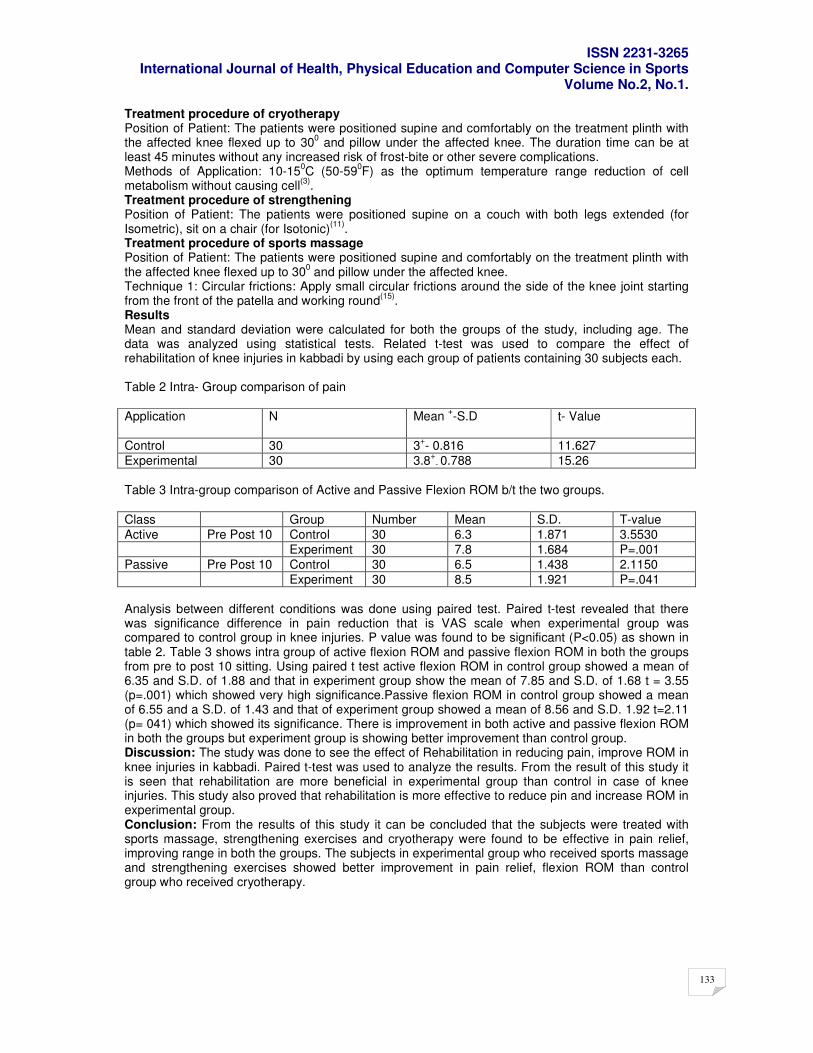
ISSN 2231-3265 International Journal of Health, Physical Education and Computer Science in Sports
Volume No.2, No.1.
133
Treatment procedure of cryotherapy Position of Patient: The patients were positioned supine and comfortably on the treatment plinth with the affected knee flexed up to 30
0 and pillow under the affected knee. The duration time can be at
least 45 minutes without any increased risk of frost-bite or other severe complications. Methods of Application: 10-15
0C (50-59
0F) as the optimum temperature range reduction of cell
metabolism without causing cell(3)
. Treatment procedure of strengthening Position of Patient: The patients were positioned supine on a couch with both legs extended (for Isometric), sit on a chair (for Isotonic)
(11).
Treatment procedure of sports massage Position of Patient: The patients were positioned supine and comfortably on the treatment plinth with the affected knee flexed up to 30
0 and pillow under the affected knee.
Technique 1: Circular frictions: Apply small circular frictions around the side of the knee joint starting from the front of the patella and working round
(15).
Results Mean and standard deviation were calculated for both the groups of the study, including age. The data was analyzed using statistical tests. Related t-test was used to compare the effect of rehabilitation of knee injuries in kabbadi by using each group of patients containing 30 subjects each. Table 2 Intra- Group comparison of pain Application N Mean
+-S.D t- Value
Control 30 3+- 0.816 11.627
Experimental 30 3.8+
- 0.788 15.26
Table 3 Intra-group comparison of Active and Passive Flexion ROM b/t the two groups.
Class Group Number Mean S.D. T-value
Active Pre Post 10 Control 30 6.3 1.871 3.5530
Experiment 30 7.8 1.684 P=.001
Passive Pre Post 10 Control 30 6.5 1.438 2.1150
Experiment 30 8.5 1.921 P=.041
Analysis between different conditions was done using paired test. Paired t-test revealed that there was significance difference in pain reduction that is VAS scale when experimental group was compared to control group in knee injuries. P value was found to be significant (P<0.05) as shown in table 2. Table 3 shows intra group of active flexion ROM and passive flexion ROM in both the groups from pre to post 10 sitting. Using paired t test active flexion ROM in control group showed a mean of 6.35 and S.D. of 1.88 and that in experiment group show the mean of 7.85 and S.D. of 1.68 t = 3.55 (p=.001) which showed very high significance.Passive flexion ROM in control group showed a mean of 6.55 and a S.D. of 1.43 and that of experiment group showed a mean of 8.56 and S.D. 1.92 t=2.11 (p= 041) which showed its significance. There is improvement in both active and passive flexion ROM in both the groups but experiment group is showing better improvement than control group. Discussion: The study was done to see the effect of Rehabilitation in reducing pain, improve ROM in knee injuries in kabbadi. Paired t-test was used to analyze the results. From the result of this study it is seen that rehabilitation are more beneficial in experimental group than control in case of knee injuries. This study also proved that rehabilitation is more effective to reduce pin and increase ROM in experimental group. Conclusion: From the results of this study it can be concluded that the subjects were treated with sports massage, strengthening exercises and cryotherapy were found to be effective in pain relief, improving range in both the groups. The subjects in experimental group who received sports massage and strengthening exercises showed better improvement in pain relief, flexion ROM than control group who received cryotherapy.
ISSN 2231-3265 International Journal of Health, Physical Education and Computer Science in Sports
Volume No.2, No.1.
134
pp134-135
A comparative study on anxiety and aggression among athletes and non-athletes.
Prepared by, Sri. Pradeepkumar.U Physical Cultural Instructor, Government First Grade College, Irkalgada, Koppal Tq & Dist, Karnataka-State.
Dr.Chandrappa, Chairman and H.O.D, Department of Physical Education Karnataka State Women University, Bijapur, Karnataka-State.
Abstract Sports have a very prominent role in the modern society. It is important to individual, a group,
a nation and indeed, the world. Throughout the world, sports have a popular appeal amongst people of all ages and both sexes. The aim of the study was to find out the difference between anxiety and aggression among the athletes and non athletes. Investigator has taken sixty inter university women players were selected as subjects during inter university tournament. The data was collected through the anxiety and aggression scale and collected from the athletes and non-athletes women players were put for‘t’ test statistical treatment to find out the difference between them.. The result of the study found that significance difference between athletes and non-athletes, athletes are more aggressive and anxiety than non-athletes. Introduction: Sports is competitive activity that involves vigorous physical exertion or tan institutionalized he use of relatively complex participation of the intrinsic satisfaction associated with the activity it self and the external reward earned through participation.Sports by their very nature are enjoyable challenging all absorbing and require a certain amount of skill and physical condition. Sports holds a prominent place in the modern life. Millions of people participate in sports activities, watch and red about them and spend billions of dollars annually for sports related activities and equipments. Sports have a very prominent role in the modern society. It is important to individual, a group, a nation and indeed, the world. Throughout the world, sports have a popular appeal amongst people of all ages and both sexes.Sports competitions produce sports personalities, ideal people that we can look up to and achievements that we can marvel at for many youth. The sports stars are better known than the leading politicians of the country. Sports have always reflected development in the society. Sports, indeed has been mirror of society. Aim of the study
A Comparative Study on Anxiety and Aggression among Athletes and Non-Athletes. Objectives of the study To find out the difference exist in anxiety and aggression among the athletes and non-athletes. Methodology To find out the difference exist in anxiety and aggression between athletes and non athletes players, sixty inter university women players were selected as subjects during inter university tournament. Statistical analysis The data collected from athletes and non-athletes women players were put for‘t’ test statistical treatment to find out the difference between them.
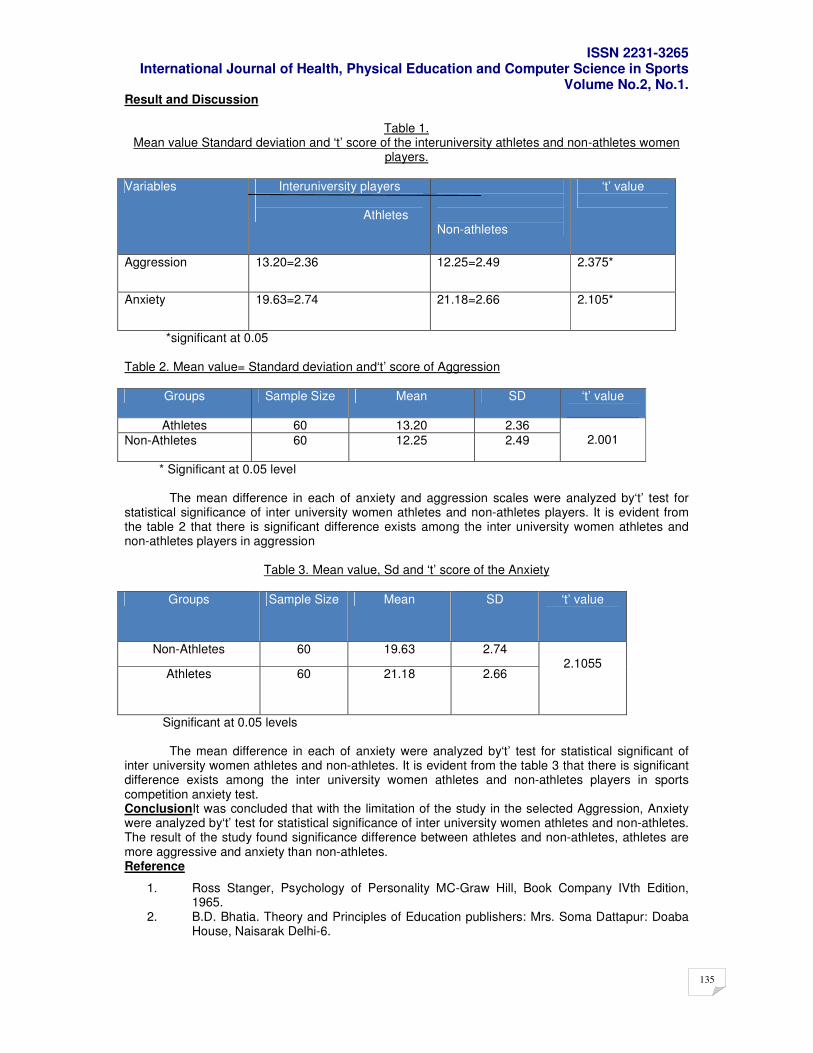
ISSN 2231-3265 International Journal of Health, Physical Education and Computer Science in Sports
Volume No.2, No.1.
135
Result and Discussion
Table 1. Mean value Standard deviation and ‘t’ score of the interuniversity athletes and non-athletes women
players.
Variables Interuniversity players Athletes
Non-athletes
‘t’ value
Aggression 13.20=2.36 12.25=2.49 2.375*
Anxiety 19.63=2.74 21.18=2.66 2.105*
*significant at 0.05 Table 2. Mean value= Standard deviation and‘t’ score of Aggression
Groups Sample Size Mean SD ‘t’ value
Athletes 60 13.20 2.36
Non-Athletes 60 12.25 2.49
2.001
* Significant at 0.05 level The mean difference in each of anxiety and aggression scales were analyzed by‘t’ test for statistical significance of inter university women athletes and non-athletes players. It is evident from the table 2 that there is significant difference exists among the inter university women athletes and non-athletes players in aggression
Table 3. Mean value, Sd and ‘t’ score of the Anxiety
Groups Sample Size Mean SD ‘t’ value
Non-Athletes 60 19.63 2.74
Athletes 60 21.18 2.66
2.1055
Significant at 0.05 levels
The mean difference in each of anxiety were analyzed by‘t’ test for statistical significant of inter university women athletes and non-athletes. It is evident from the table 3 that there is significant difference exists among the inter university women athletes and non-athletes players in sports competition anxiety test. ConclusionIt was concluded that with the limitation of the study in the selected Aggression, Anxiety were analyzed by‘t’ test for statistical significance of inter university women athletes and non-athletes. The result of the study found significance difference between athletes and non-athletes, athletes are more aggressive and anxiety than non-athletes. Reference
1. Ross Stanger, Psychology of Personality MC-Graw Hill, Book Company IVth Edition, 1965.
2. B.D. Bhatia. Theory and Principles of Education publishers: Mrs. Soma Dattapur: Doaba House, Naisarak Delhi-6.
ISSN 2231-3265 International Journal of Health, Physical Education and Computer Science in Sports
Volume No.2, No.1.
136
pp136-138
Nutritional Supplements in Sports- An over view Dr.M.V.L.Surya Kumari
Department of Physical Education, GNITS, Shaikpet, Hyderabad-500 008, India,
Introduction: The first documented use of “ natural preparations” to enhance athletic prowess were the ancient Greeks (300 B.C.). It is probable that ever since that time, athletes have been combining and consuming various nutritional compounds in an effort to increase the ergogenic potential of the supplement and enhance performanceSupplements included in the broad nutritional category include fluid supplements, carbohydrates, fats, proteins/ amino acids and their metabolites, vitamins and minerals, plant extracts, phytochemicals, and engineered industry supplements.Nutritional supplements are not a complete substitute for a well balanced nutrient dense diet. However, nutritional strategies in addition to a nutrient dense diet are vital in assisting the athlete in replenishing the necessary caloric requirements lost through high intensity energy expenditureThe availability and use of nutritional supplements as ergogenic aids have been raisen dramatically in the past few years. Many reports indicated that 50% of normal population, 75% of teenage athletes, and 100% body builders and elite athletes use supplements. Reality of the supplements: 1.Manufacturers are not required to display the entire ingredient list on bottles. 2. Over 20% of the supplements that are not labeled correctly contain a prohibited substance.3. Most manufacturers claim that their products are backed by valid scientific research- really the majority are not. 4. Very few advise consumers about the adverse side effects. Supplement concerns: Most of the athletes have been using Nutritional supplements to boost their performance without properly understanding the health consequences / risks of being caught in the dope test, if the supplement contains banned substance or contaminated. The main reasons for this include, Ignorance of the athlete, Unreliable sources of information, Lack of knowledge about the supplements for coaches, Purity and safety of supplements. Types and forms of nutritional Supplements: Broadly the nutritional supplements can be divided into Macro nutrient supplements (Carbohydrate, Protein and Fat supplements),Micronutrient Supplements (vitamin and Mineral supplements),Fluid supplements (sports drinks, and other liquid supplements). Major forms of Nutritional supplements include, Tablets, capsules, pills, soft gels, creams, liquids, powders, extracts, bars. Major categories of Nutritional supplements based on evidence, benefits, legality For better understanding of nutritional supplements that are effective, safe and legal to use they can be divided into Three major groups. Category-A Supplements This group of supplements may be recommended for athletes. These supplements are having substantial scientific evidence with promise of benefits. Examples include Sports drinks, liquid meal supplements, sports bars, sports gels, multi vitamin and mineral, iron and calcium supplements. For above 18 years of age, following are effective. Creatine, Bicarbonate, Glycerol, antioxidents, Stick packs of Zinc and Vit. C, Glucosamine. Category-B Supplements The supplements that are placed in this category are mostly safe to use. But they may be or may not be effective. No substantial scientific evidence is available about ergogenic benefits of these supplements. They are legal to use. Examples include HMB, Glutamine, Carnitine, Chromium, Ginseng / herbals, coenzyme Q10, amino acids, Medium chain triglecerides. Category-C Supplements All banned nutritional supplements are placed in this group. They are illegal to use. Examples include Anabolic steroids, Stimulants. etc..Athletes who use these category-C supplements will be tested positive in the doping. An estimated one to three million athletes currently use androgens, often combined with stimulants, hormones, and diuretics, to facilitate the training response.
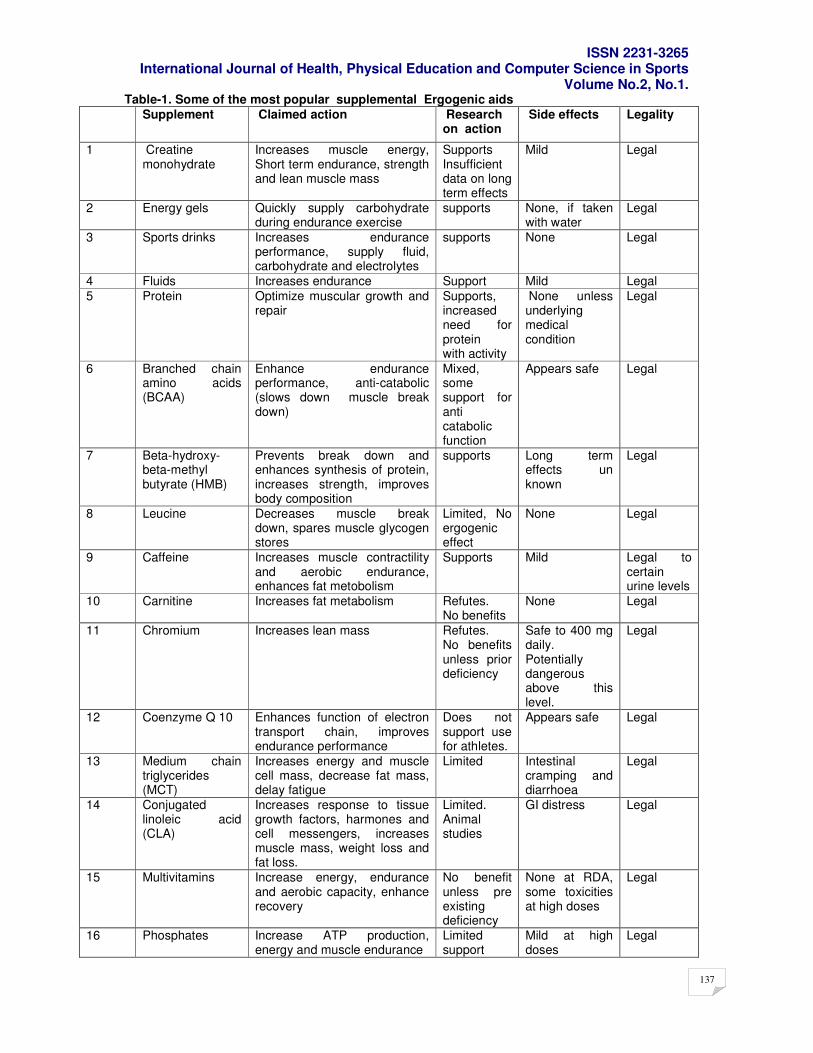
ISSN 2231-3265 International Journal of Health, Physical Education and Computer Science in Sports
Volume No.2, No.1.
137
Table-1. Some of the most popular supplemental Ergogenic aids
Supplement Claimed action Research on action
Side effects Legality
1 Creatine monohydrate
Increases muscle energy, Short term endurance, strength and lean muscle mass
Supports Insufficient data on long term effects
Mild Legal
2 Energy gels Quickly supply carbohydrate during endurance exercise
supports None, if taken with water
Legal
3 Sports drinks Increases endurance performance, supply fluid, carbohydrate and electrolytes
supports None Legal
4 Fluids Increases endurance Support Mild Legal
5 Protein Optimize muscular growth and repair
Supports, increased need for protein with activity
None unless underlying medical condition
Legal
6 Branched chain amino acids (BCAA)
Enhance endurance performance, anti-catabolic (slows down muscle break down)
Mixed, some support for anti catabolic function
Appears safe Legal
7 Beta-hydroxy-beta-methyl butyrate (HMB)
Prevents break down and enhances synthesis of protein, increases strength, improves body composition
supports Long term effects un known
Legal
8 Leucine Decreases muscle break down, spares muscle glycogen stores
Limited, No ergogenic effect
None Legal
9 Caffeine Increases muscle contractility and aerobic endurance, enhances fat metobolism
Supports Mild Legal to certain urine levels
10 Carnitine Increases fat metabolism Refutes. No benefits
None Legal
11 Chromium
Increases lean mass
Refutes. No benefits unless prior deficiency
Safe to 400 mg daily. Potentially dangerous above this level.
Legal
12 Coenzyme Q 10 Enhances function of electron transport chain, improves endurance performance
Does not support use for athletes.
Appears safe Legal
13 Medium chain triglycerides (MCT)
Increases energy and muscle cell mass, decrease fat mass, delay fatigue
Limited Intestinal cramping and diarrhoea
Legal
14 Conjugated linoleic acid (CLA)
Increases response to tissue growth factors, harmones and cell messengers, increases muscle mass, weight loss and fat loss.
Limited. Animal studies
GI distress Legal
15 Multivitamins Increase energy, endurance and aerobic capacity, enhance recovery
No benefit unless pre existing deficiency
None at RDA, some toxicities at high doses
Legal
16 Phosphates Increase ATP production, energy and muscle endurance
Limited support
Mild at high doses
Legal
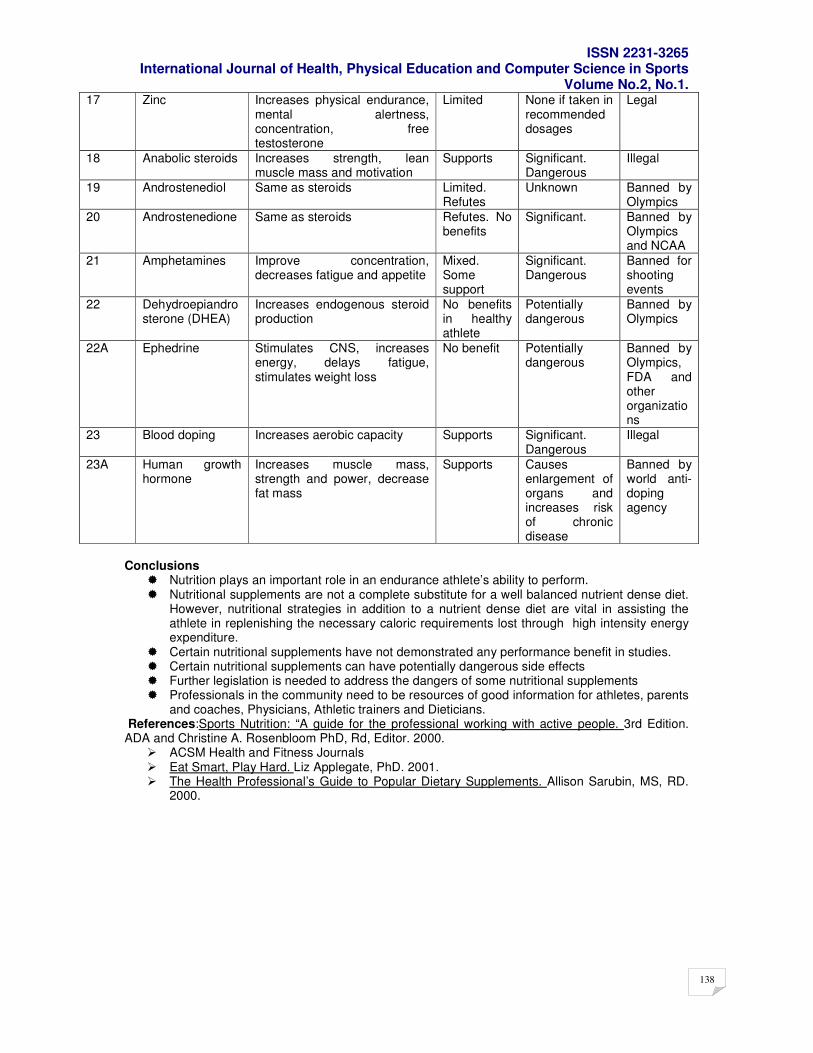
ISSN 2231-3265 International Journal of Health, Physical Education and Computer Science in Sports
Volume No.2, No.1.
138
17 Zinc Increases physical endurance, mental alertness, concentration, free testosterone
Limited None if taken in recommended dosages
Legal
18 Anabolic steroids Increases strength, lean muscle mass and motivation
Supports Significant. Dangerous
Illegal
19 Androstenediol Same as steroids Limited. Refutes
Unknown Banned by Olympics
20 Androstenedione Same as steroids Refutes. No benefits
Significant.
Banned by Olympics and NCAA
21 Amphetamines Improve concentration, decreases fatigue and appetite
Mixed. Some support
Significant. Dangerous
Banned for shooting events
22 Dehydroepiandrosterone (DHEA)
Increases endogenous steroid production
No benefits in healthy athlete
Potentially dangerous
Banned by Olympics
22A Ephedrine Stimulates CNS, increases energy, delays fatigue, stimulates weight loss
No benefit Potentially dangerous
Banned by Olympics, FDA and other organizations
23 Blood doping Increases aerobic capacity Supports Significant. Dangerous
Illegal
23A Human growth hormone
Increases muscle mass, strength and power, decrease fat mass
Supports Causes enlargement of organs and increases risk of chronic disease
Banned by world anti-doping agency
Conclusions
� Nutrition plays an important role in an endurance athlete’s ability to perform. � Nutritional supplements are not a complete substitute for a well balanced nutrient dense diet.
However, nutritional strategies in addition to a nutrient dense diet are vital in assisting the athlete in replenishing the necessary caloric requirements lost through high intensity energy expenditure.
� Certain nutritional supplements have not demonstrated any performance benefit in studies. � Certain nutritional supplements can have potentially dangerous side effects � Further legislation is needed to address the dangers of some nutritional supplements � Professionals in the community need to be resources of good information for athletes, parents
and coaches, Physicians, Athletic trainers and Dieticians. References:Sports Nutrition: “A guide for the professional working with active people. 3rd Edition. ADA and Christine A. Rosenbloom PhD, Rd, Editor. 2000.
� ACSM Health and Fitness Journals � Eat Smart, Play Hard. Liz Applegate, PhD. 2001. � The Health Professional’s Guide to Popular Dietary Supplements. Allison Sarubin, MS, RD.
2000.
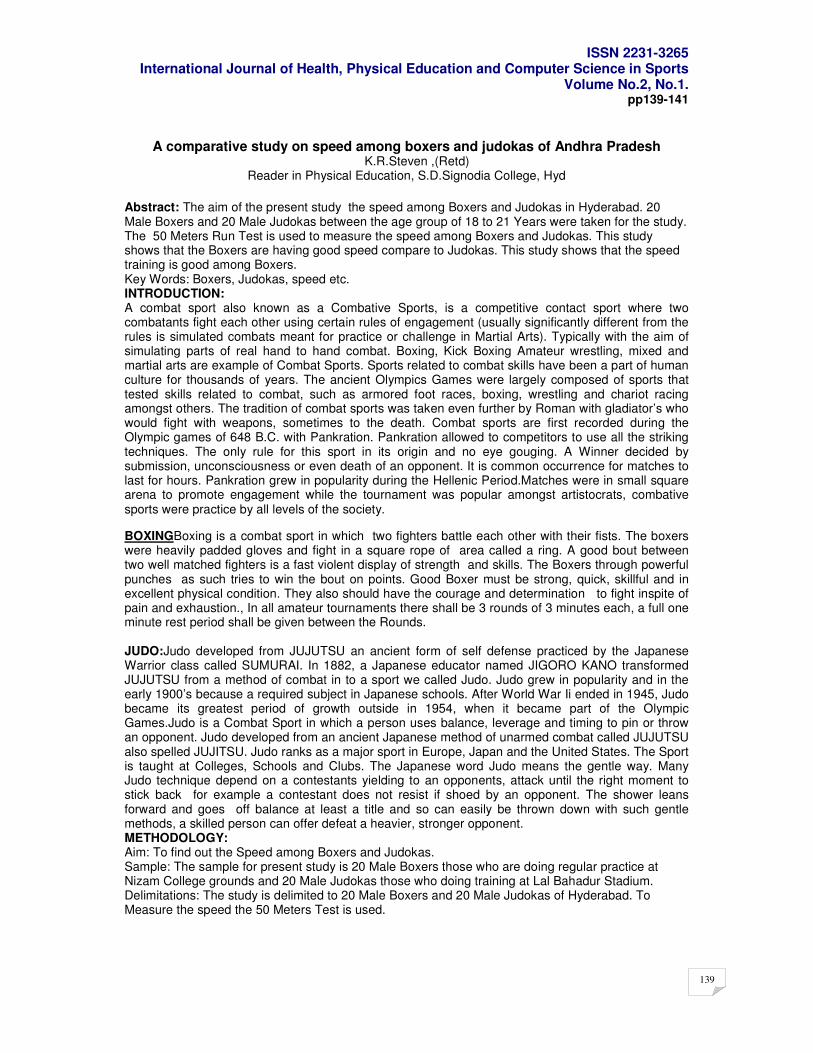
ISSN 2231-3265 International Journal of Health, Physical Education and Computer Science in Sports
Volume No.2, No.1.
139
pp139-141
A comparative study on speed among boxers and judokas of Andhra Pradesh
K.R.Steven ,(Retd) Reader in Physical Education, S.D.Signodia College, Hyd
Abstract: The aim of the present study the speed among Boxers and Judokas in Hyderabad. 20 Male Boxers and 20 Male Judokas between the age group of 18 to 21 Years were taken for the study. The 50 Meters Run Test is used to measure the speed among Boxers and Judokas. This study shows that the Boxers are having good speed compare to Judokas. This study shows that the speed training is good among Boxers. Key Words: Boxers, Judokas, speed etc. INTRODUCTION: A combat sport also known as a Combative Sports, is a competitive contact sport where two combatants fight each other using certain rules of engagement (usually significantly different from the rules is simulated combats meant for practice or challenge in Martial Arts). Typically with the aim of simulating parts of real hand to hand combat. Boxing, Kick Boxing Amateur wrestling, mixed and martial arts are example of Combat Sports. Sports related to combat skills have been a part of human culture for thousands of years. The ancient Olympics Games were largely composed of sports that tested skills related to combat, such as armored foot races, boxing, wrestling and chariot racing amongst others. The tradition of combat sports was taken even further by Roman with gladiator’s who would fight with weapons, sometimes to the death. Combat sports are first recorded during the Olympic games of 648 B.C. with Pankration. Pankration allowed to competitors to use all the striking techniques. The only rule for this sport in its origin and no eye gouging. A Winner decided by submission, unconsciousness or even death of an opponent. It is common occurrence for matches to last for hours. Pankration grew in popularity during the Hellenic Period.Matches were in small square arena to promote engagement while the tournament was popular amongst artistocrats, combative sports were practice by all levels of the society.
BOXINGBoxing is a combat sport in which two fighters battle each other with their fists. The boxers were heavily padded gloves and fight in a square rope of area called a ring. A good bout between two well matched fighters is a fast violent display of strength and skills. The Boxers through powerful punches as such tries to win the bout on points. Good Boxer must be strong, quick, skillful and in excellent physical condition. They also should have the courage and determination to fight inspite of pain and exhaustion., In all amateur tournaments there shall be 3 rounds of 3 minutes each, a full one minute rest period shall be given between the Rounds. JUDO:Judo developed from JUJUTSU an ancient form of self defense practiced by the Japanese Warrior class called SUMURAI. In 1882, a Japanese educator named JIGORO KANO transformed JUJUTSU from a method of combat in to a sport we called Judo. Judo grew in popularity and in the early 1900’s because a required subject in Japanese schools. After World War Ii ended in 1945, Judo became its greatest period of growth outside in 1954, when it became part of the Olympic Games.Judo is a Combat Sport in which a person uses balance, leverage and timing to pin or throw an opponent. Judo developed from an ancient Japanese method of unarmed combat called JUJUTSU also spelled JUJITSU. Judo ranks as a major sport in Europe, Japan and the United States. The Sport is taught at Colleges, Schools and Clubs. The Japanese word Judo means the gentle way. Many Judo technique depend on a contestants yielding to an opponents, attack until the right moment to stick back for example a contestant does not resist if shoed by an opponent. The shower leans forward and goes off balance at least a title and so can easily be thrown down with such gentle methods, a skilled person can offer defeat a heavier, stronger opponent. METHODOLOGY: Aim: To find out the Speed among Boxers and Judokas. Sample: The sample for present study is 20 Male Boxers those who are doing regular practice at Nizam College grounds and 20 Male Judokas those who doing training at Lal Bahadur Stadium. Delimitations: The study is delimited to 20 Male Boxers and 20 Male Judokas of Hyderabad. To Measure the speed the 50 Meters Test is used.
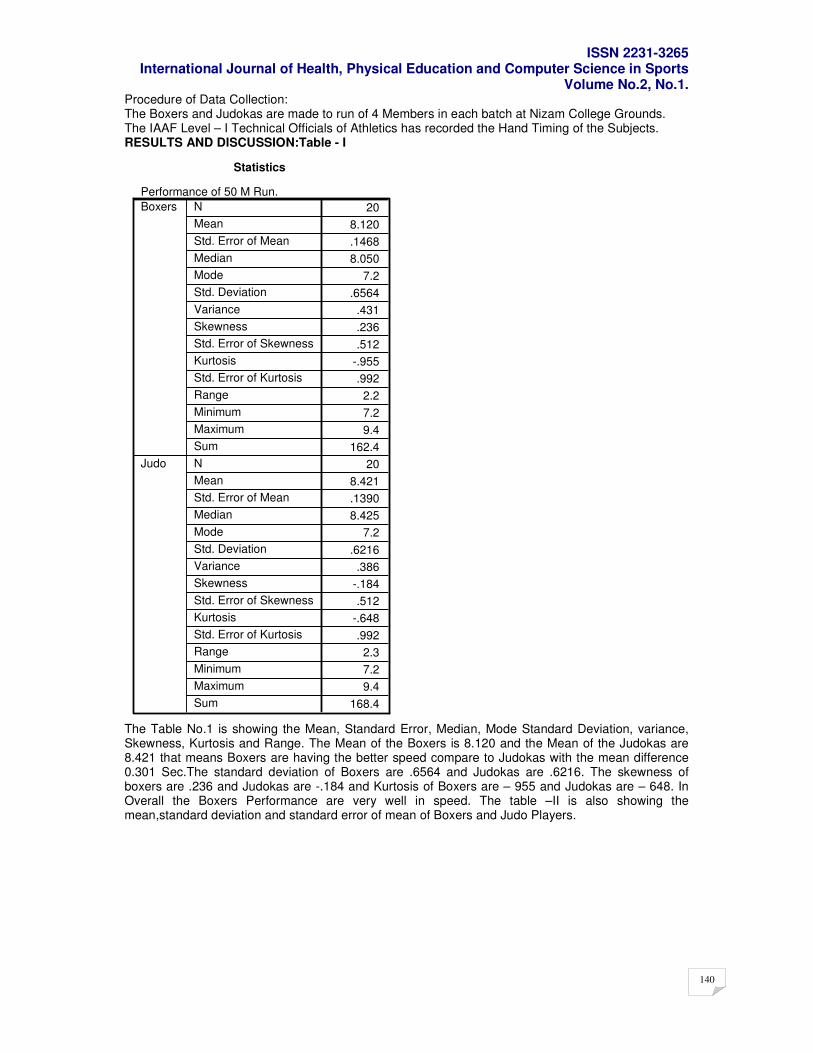
ISSN 2231-3265 International Journal of Health, Physical Education and Computer Science in Sports
Volume No.2, No.1.
140
Procedure of Data Collection: The Boxers and Judokas are made to run of 4 Members in each batch at Nizam College Grounds. The IAAF Level – I Technical Officials of Athletics has recorded the Hand Timing of the Subjects. RESULTS AND DISCUSSION:Table - I
Statistics
Performance of 50 M Run.
20
8.120
.1468
8.050
7.2
.6564
.431
.236
.512
-.955
.992
2.2
7.2
9.4
162.4
20
8.421
.1390
8.425
7.2
.6216
.386
-.184
.512
-.648
.992
2.3
7.2
9.4
168.4
N
Mean
Std. Error of Mean
Median
Mode
Std. Deviation
Variance
Skewness
Std. Error of Skewness
Kurtosis
Std. Error of Kurtosis
Range
Minimum
Maximum
Sum
N
Mean
Std. Error of Mean
Median
Mode
Std. Deviation
Variance
Skewness
Std. Error of Skewness
Kurtosis
Std. Error of Kurtosis
Range
Minimum
Maximum
Sum
Boxers
Judo
The Table No.1 is showing the Mean, Standard Error, Median, Mode Standard Deviation, variance, Skewness, Kurtosis and Range. The Mean of the Boxers is 8.120 and the Mean of the Judokas are 8.421 that means Boxers are having the better speed compare to Judokas with the mean difference 0.301 Sec.The standard deviation of Boxers are .6564 and Judokas are .6216. The skewness of boxers are .236 and Judokas are -.184 and Kurtosis of Boxers are – 955 and Judokas are – 648. In Overall the Boxers Performance are very well in speed. The table –II is also showing the mean,standard deviation and standard error of mean of Boxers and Judo Players.
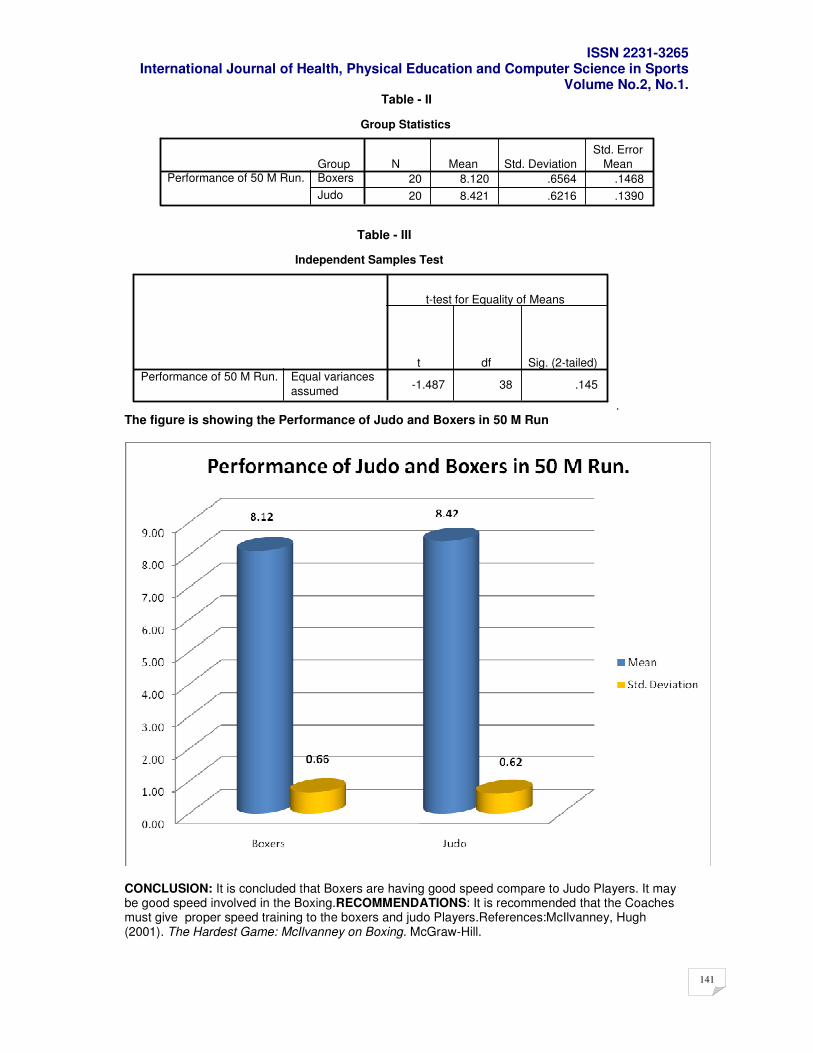
ISSN 2231-3265 International Journal of Health, Physical Education and Computer Science in Sports
Volume No.2, No.1.
141
Table - II
Group Statistics
20 8.120 .6564 .1468
20 8.421 .6216 .1390
GroupBoxers
Judo
Performance of 50 M Run.N Mean Std. Deviation
Std. Error
Mean
Table - III
Independent Samples Test
-1.487 38 .145Equal variances
assumed
Performance of 50 M Run.t df Sig. (2-tailed)
t-test for Equality of Means
. The figure is showing the Performance of Judo and Boxers in 50 M Run
CONCLUSION: It is concluded that Boxers are having good speed compare to Judo Players. It may be good speed involved in the Boxing.RECOMMENDATIONS: It is recommended that the Coaches must give proper speed training to the boxers and judo Players.References:McIlvanney, Hugh (2001). The Hardest Game: McIlvanney on Boxing. McGraw-Hill.
ISSN 2231-3265 International Journal of Health, Physical Education and Computer Science in Sports
Volume No.2, No.1.
142
pp142-143
A study on the physical fitness among basket ball and hand ball players in Hyderabad
By
J.Prabhakar Rao, Head,Department of Physical Education, Osmania University
Abstract: The aim of the present study was to study the difference in Physical Fitness among Basket Ball and Hand Ball Players in Hyderabad. 20 Hand Ball Players and 20 Basket Ball Players between the age group of 18 Years to 21 Years of Osmania University were taken for the Study. The AAPHER Youth Fitness Test consisting of 6 Items were used for the Study. It was found that Hand Ball Players have good Physical Fitness compare to Basket Ball Players. This study shows that the Hand Ball Players are good because they do good Physical Training compare to Basket Ball Players . The Hand Ball Players are having very good speed , and endurance. Key words:Physical fitness, speed, , endurance. INTRODUCTION: Physical fitness comprises two related concepts i.e. general and specific fitness. Physical fitness is generally achieved through correct nutrition, exercise and enough rest. There are so many benefits to be gained from participation in physical fitness and wellness rest. There are so many benefits to be gained from participation in physical fitness and wellness programs and people of all ages and both genders can derive benefits from such programs so as to help them to maintain higher quality of life. The most important benefits of physical fitness and wellness approach in the development of positive attitude that helps people to see life’s possibilities and to work for their attainment so as to make one’s life personality fulfilling and satisfying. It provides the basis for optimal physiological health and gives us the capacity to enjoy a full life. Benefits of Physical Fitness: 1.Condition of Heart and Lungs by increasing the oxygen available to the body therefore enabling the heart to use oxygen more efficiently. 2. Development of physical fitness components such as strength, endurance, agility, flexibility etc. and improvement of muscle tone. 3. Fosters correct posture, figure, body image and physical appearance. 4. Quick recovery after injury, illness and decrease the risk of cardio-vascular disease. 5. Reduces and controls body fat, exercise combined with a proper diet will reduce body fat and also fulfill proper nutritional requirement. 6. Increase energy level of a person and helps to maintain ideal body weight. 7. Through Participation in physical fitness program, leisure (free) time is properly utilized. 8. Improve mood and reduce depression and anxiety. 9. Postpones fatigue and reduces recovery time after vigorous activity. 10. Helps people to meet challenges of life, make them self confident and postpones ageing process. The agility, balance, cardio-vascular endurance, flexibility, strength, power, etc., of the body will be to peak if well and good fitness are achieved. Fitness is the ultimate in life. Aim: To find out the Physical Fitness among the Hand Ball and Soft Ball Players in Hyderabad. Sample:20 Hand Ball and 20 Basket Ball Players of Osmania University those who have taken part in the O.U.Inter College Tournaments has taken for the study.
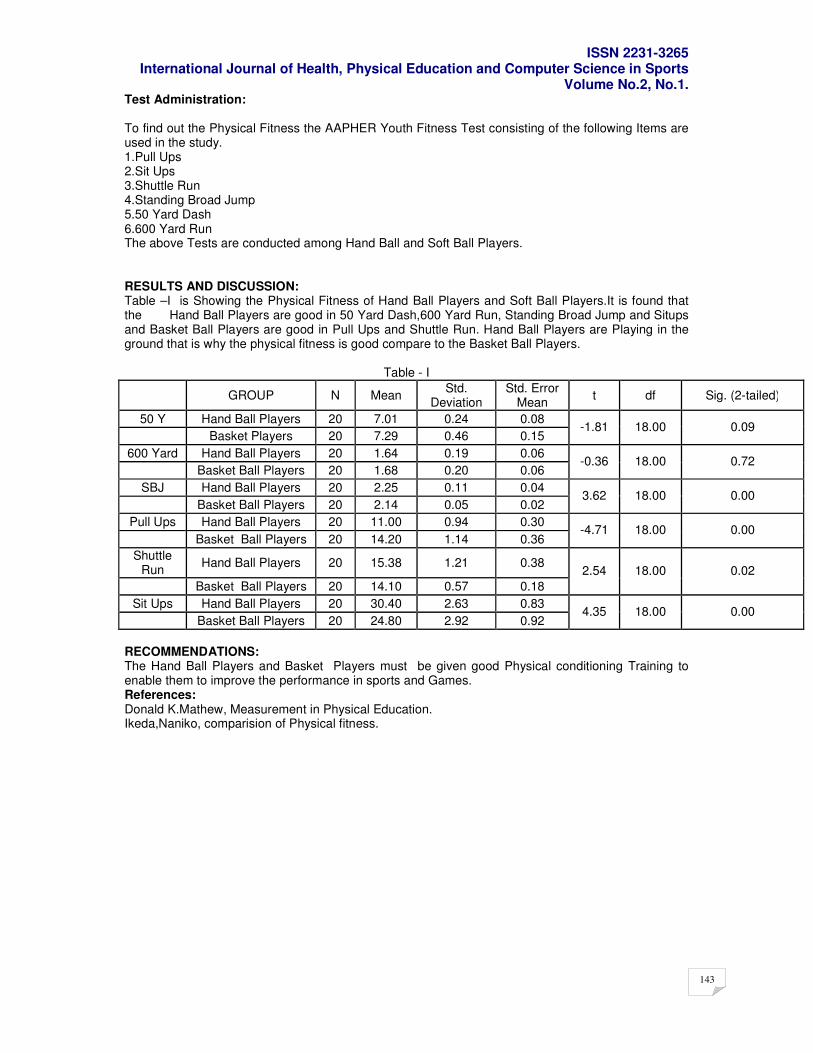
ISSN 2231-3265 International Journal of Health, Physical Education and Computer Science in Sports
Volume No.2, No.1.
143
Test Administration: To find out the Physical Fitness the AAPHER Youth Fitness Test consisting of the following Items are used in the study. 1.Pull Ups 2.Sit Ups 3.Shuttle Run 4.Standing Broad Jump 5.50 Yard Dash 6.600 Yard Run The above Tests are conducted among Hand Ball and Soft Ball Players. RESULTS AND DISCUSSION: Table –I is Showing the Physical Fitness of Hand Ball Players and Soft Ball Players.It is found that the Hand Ball Players are good in 50 Yard Dash,600 Yard Run, Standing Broad Jump and Situps and Basket Ball Players are good in Pull Ups and Shuttle Run. Hand Ball Players are Playing in the ground that is why the physical fitness is good compare to the Basket Ball Players.
Table - I
GROUP N Mean Std.
Deviation Std. Error
Mean t df Sig. (2-tailed)
50 Y Hand Ball Players 20 7.01 0.24 0.08
Basket Players 20 7.29 0.46 0.15 -1.81 18.00 0.09
600 Yard Hand Ball Players 20 1.64 0.19 0.06
Basket Ball Players 20 1.68 0.20 0.06 -0.36 18.00 0.72
SBJ Hand Ball Players 20 2.25 0.11 0.04
Basket Ball Players 20 2.14 0.05 0.02 3.62 18.00 0.00
Pull Ups Hand Ball Players 20 11.00 0.94 0.30
Basket Ball Players 20 14.20 1.14 0.36 -4.71 18.00 0.00
Shuttle Run
Hand Ball Players 20 15.38 1.21 0.38
Basket Ball Players 20 14.10 0.57 0.18
2.54 18.00 0.02
Sit Ups Hand Ball Players 20 30.40 2.63 0.83
Basket Ball Players 20 24.80 2.92 0.92 4.35 18.00 0.00
RECOMMENDATIONS: The Hand Ball Players and Basket Players must be given good Physical conditioning Training to enable them to improve the performance in sports and Games. References: Donald K.Mathew, Measurement in Physical Education. Ikeda,Naniko, comparision of Physical fitness.
ISSN 2231-3265 International Journal of Health, Physical Education and Computer Science in Sports
Volume No.2, No.1.
144
pp144-145
Motivation in sports psychology
Dr.V.Satyanarayana, Associate Professor in Physical Education, O.U.
Sandeep Jadhav, Research Scholar, Osmania University
Introduction: Motivation is an internal energy force that determines all aspects of our behaviour; it also impacts on how we think, feel and interact with others. In sport, high motivation is widely accepted as an essential prerequisite in getting athletes to fulfil their potential. However, given its inherently abstract nature, it is a force that is often difficult to exploit fully. Some coaches, like Portugal manager Luiz Felipe ‘Big Phil’ Scolari, appear to have a ‘magic touch’, being able to get a great deal more out of a team than the sum of its individual parts; others find motivation to be an elusive concept they are forever struggling to master.
Motivational techniques for coaches and athletes
1. Goal settingAthletes should be encouraged to set a few ambitious but achievable long-term goals; perhaps to represent their country in a major championship in three or four years. Through empowering athletes to set their own goals, they are more likely to accept the challenges.To keep athletes on track with their long-term goals, they should also set appropriate medium-term goals. For example, following a bronze medal-winning performance at the 2004 Athens Olympics, UK heptathlete Kelly Sotherton set herself the medium-term goal of winning the 2006 Commonwealth title in Melbourne (which she achieved) en route to pursuing her long-term goal to be crowned Olympic champion at the 2008 Beijing Games; By far the most important goals in practical terms are those for the short-term, as it is these that keep athletes focused on the checkmarks which are seminal to achieving superior performance. Therefore, short-term goals should be predominantly process-oriented. For example, when Manchester United’s Wayne Rooney injured a metatarsal six weeks before the start of the soccer World Cup, he set a series of process goals in his race to regain full fitness. These included daily physiotherapy sessions, remedial exercises in an oxygen chamber, non weight-bearing aerobic activities, monitoring of nutritional intake and so on; Goals need to be monitored and revised on a regular basis. One of the biggest mistakes that coaches make in setting goals is that they are often too rigid in their approach. The goal setting process works best when there is some flexibility and the individual athlete or team take ownership of each goal. Thus, coaches and managers are better off exercising some democracy when setting goals, particularly if working with more experienced athletes.
2. Using extrinsic rewardsAccording to SDT(1), the key aspect in using extrinsic rewards effectively is that they reinforce an athlete’s sense of competence and self-worth. Thus, a reward should be informational in nature rather than controlling. If a reward comes to be controlling, it can significantly undermine intrinsic motivation. For a reward to be informational, it is advisable that it has relatively little monetary worth (ie it is a token reward), such as a ‘woman of the match’ or ‘athlete of the tour’ title. Also, the reward should be presented to an athlete in front of all potential recipients with some emphasis placed on the prestige associated with it. Other popular ways of using token rewards include etching athletes’ names on annual honours boards for their contributions, or awarding a special item of clothing.
3. Motivational music
A particularly good way to motivate athletes in training and prior to competition is through the use of music they perceive to be inspirational. Sydney Olympics rowing gold medallist, Tim Foster, now a respected coach, uses music to punctuate all of the indoor training sessions that he leads. Specifically, during circuit training or rowing ergometer intervals, he puts on loud/fast music, while during recovery periods he plays soft/slow music. Therefore, work and recovery times are regulated by music. Research from Brunel University indicates that this approach increases work output, reduces perceived exertion and improves in-task affect – the pleasure experienced during the
ISSN 2231-3265 International Journal of Health, Physical Education and Computer Science in Sports
Volume No.2, No.1.
145
activity(14,15). 4.Positiveself-talk
Positive self-talk is a technique that can be used to enhance motivation across a wide range of achievement domains. It makes use of an athlete’s powerful inner voice to reinforce their self-esteem or important aspects of their performance. With appropriate repetition, self-talk can positively alter an athlete’s belief system. I use three types of self-talk in my work with athletes and will illustrate each with an example to assist you in coming up with your own.
The first type is known as task-relevant self-talk, which serves to focus an athlete’s attention on the task at hand. A karateka I worked with used the mantra ‘pillar of power’ to reinforce his strong posture. The second type is known as mood-related self-talk, which impacts on how athletes feel. An international water skier came up with ‘butterflies in formation’ to represent how the butterflies in her tummy would work for her rather than against her. The third type is known as a positive self-affirmation statement and the most famous exponent of these was the legendary boxer Mohammed Ali who repeated the claim, ‘I am the greatest’ so many times that even his opponents believed it.
‘I figured that, if I said it enough, I would convince the world that I really was the greatest.’ Mohammed Ali
Summary
Each and every one of us has an untapped energy source that can be drawn upon to bring about superior results. Enhancing motivation is fundamentally about a change of attitude, developing a positive ‘can do’ mindset and engaging in systematic behaviours – the short-term process goals – that facilitate improvement. If you have a leadership role in sport you will have considerable influence on how motivated your athletes or team might feel. You can instil a good work ethic, recognise individual effort and instigate transparent reward structures that reinforce people’s sense of competence. To work best, the techniques mentioned in this article need to be moulded around specific circumstances and the needs of individual athletes. Always strive to be original and innovative in the application of motivational techniques.
References 1. Deci E, Ryan R (1985) Intrinsic Motivation and Self-determination in Human Behavior, New York: Plenum 2. J Personality Social Psych 1987; 53:1024-1037 3. AmPsych 2000; 55:68-78 4. Csikszentmihalyi M (1975) Beyond Boredom and Anxiety, San Francisco, CA: Josey-Bass 5. Csikszentmihalyi M (1990) Flow: The Psychology of Optimal Experience, New York: Harper and Row 6. J Sports Sci 2001; 19:397-409 7. Brit J Educ Psych 1994; 64:253-261 8. Proceedings of the 2001 World Congress on Sport Psychology, Skiathos, Greece 2001; 3:321-323
ISSN 2231-3265 International Journal of Health, Physical Education and Computer Science in Sports
Volume No.2, No.1.
146
pp146-147
A comparative study on aerobic endurance among athletes and hockey player’s of Hyderabad district
Prof.P.Venkat Reddy
Principal, Univ. College of Physical Education
E.Jyothi,
P.E.T. Nasr Girls High School, Hyderabad
Abstract: The aim of the present study was to find out the difference in Aerobic Endurance among athletes and Hockey Players of Hyderabad District. 30 Male Athletes and 30 Male Hockey Players between the age group of 18 -21 Years were taken for the study. The 12 Min Cooper Test were used to measure the Aerobic Endurance of Athletes and Hockey Players . It is concluded that Athletes are having good Aerobic Endurance compare to Hockey Players. Key word: Aerobic Endurance, Cooper Test, Athletes, Hockey Players etc.
Introduction: Aerobic Endurance is the amount of oxygen intake during exercise. Aerobic Endurance is the time which you can exercise, without producing lactic acid in your muscles. During aerobic (with oxygen) work, the body is working at a level that the demands for oxygen and fuel can be meet by the body’s intake. The only waste products formed are carbon-dioxide and water which are removed by sweating and breathing. Aerobic exercise is physical exercise of relatively low intensity and long duration, which depends primarily on the aerobic energy system. Aerobic means “with oxygen”, and refers to the use of oxygen in the body’s metabolic or energy – generating process. Many types of exercise are aerobic, and by definition are performed at moderate levelsof intensity for extended periods of time. Aerobic exercise comprises innumerable forms. In general, it is performed at a moderate level of intensity over a relatively long period of time. For example, running a long distance at a moderate pace is an aerobic exercise, but sprinting is not. Playing singles tennis, with near continuous motion, is generallyconsidered aerobic activity, while golf or two person team tennis, with brief bursts of activity punctuated by more frequent breaks, may not be predominantly aerobic. Some sports are thus inherently “aerobic”, while other aerobic exercises, such as fartlek training or aerobic dance classes, are designed specifically to improve aerobic capacity and fitness.
The Hockey field or pitch is a rectangular field 60 Yards Wide and 100 Yards long.(54.90 M by 91.50 M). Hockey games are played in two 35 Minutes halves with five to ten minutes break at half time. Two umpires control the game. One on each side of the field and to score a goal you must shoot from with the circle (actually a semi-circle) and the ball must pass wholly across the goal line. The Hockey stick is approximately one yard long with a curved end, is flat on one side and rounded on the other. This stick is made from hard wood and usually has a laminated handle. The maximum weight of hockey stick is 28 ounces and the stick must fit through a 2 Inches diameter ring. The ball can only beplayed with the flat side and edge of the stick, but there are mainly situated when it is necessary to turn the stick over with the end pointing downwards in the reverse stick position.There are no left handle hockey sticks but hockey players naturally left handers can still be successful players. The ball is the same size and weight as a cricket ball and is covered by a thin shell of dimpled plastic to keep it water proof. Each team consists of 16 Players and 11 Players including 1 goalkeeper play in the match. The Hockey game is know a days is played on the artificial surface called Polygrass and It is the National Game of India.
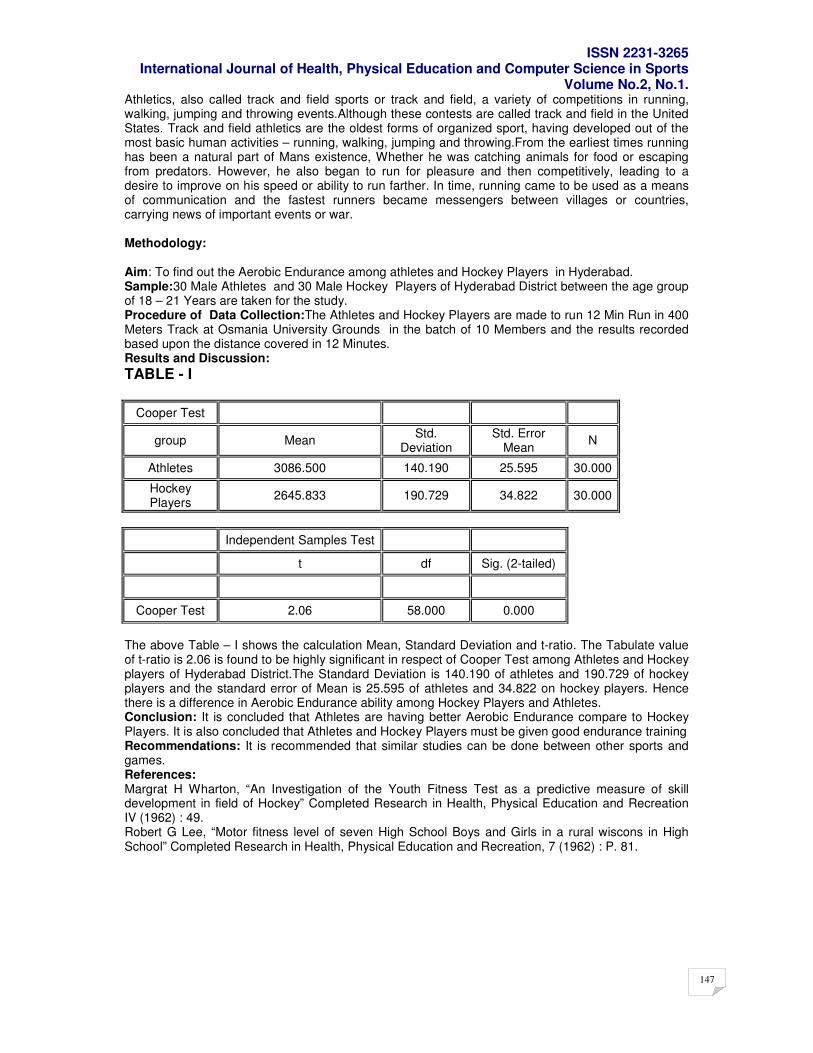
ISSN 2231-3265 International Journal of Health, Physical Education and Computer Science in Sports
Volume No.2, No.1.
147
Athletics, also called track and field sports or track and field, a variety of competitions in running, walking, jumping and throwing events.Although these contests are called track and field in the United States. Track and field athletics are the oldest forms of organized sport, having developed out of the most basic human activities – running, walking, jumping and throwing.From the earliest times running has been a natural part of Mans existence, Whether he was catching animals for food or escaping from predators. However, he also began to run for pleasure and then competitively, leading to a desire to improve on his speed or ability to run farther. In time, running came to be used as a means of communication and the fastest runners became messengers between villages or countries, carrying news of important events or war. Methodology: Aim: To find out the Aerobic Endurance among athletes and Hockey Players in Hyderabad. Sample:30 Male Athletes and 30 Male Hockey Players of Hyderabad District between the age group of 18 – 21 Years are taken for the study. Procedure of Data Collection:The Athletes and Hockey Players are made to run 12 Min Run in 400 Meters Track at Osmania University Grounds in the batch of 10 Members and the results recorded based upon the distance covered in 12 Minutes. Results and Discussion:
TABLE - I
Cooper Test
group Mean Std.
Deviation Std. Error
Mean N
Athletes 3086.500 140.190 25.595 30.000
Hockey Players
2645.833 190.729 34.822 30.000
Independent Samples Test
t df Sig. (2-tailed)
Cooper Test 2.06 58.000 0.000
The above Table – I shows the calculation Mean, Standard Deviation and t-ratio. The Tabulate value of t-ratio is 2.06 is found to be highly significant in respect of Cooper Test among Athletes and Hockey players of Hyderabad District.The Standard Deviation is 140.190 of athletes and 190.729 of hockey players and the standard error of Mean is 25.595 of athletes and 34.822 on hockey players. Hence there is a difference in Aerobic Endurance ability among Hockey Players and Athletes. Conclusion: It is concluded that Athletes are having better Aerobic Endurance compare to Hockey Players. It is also concluded that Athletes and Hockey Players must be given good endurance training Recommendations: It is recommended that similar studies can be done between other sports and games. References: Margrat H Wharton, “An Investigation of the Youth Fitness Test as a predictive measure of skill development in field of Hockey” Completed Research in Health, Physical Education and Recreation IV (1962) : 49. Robert G Lee, “Motor fitness level of seven High School Boys and Girls in a rural wiscons in High School” Completed Research in Health, Physical Education and Recreation, 7 (1962) : P. 81.
ISSN 2231-3265 International Journal of Health, Physical Education and Computer Science in Sports
Volume No.2, No.1.
148
pp148-149
Sports Management
Prof.K.Surender Reddy, Director of Physical Education, O.U.
M.Emily Rose,
Research Scholar, Osmania University, Hyd.
Abstract
In this article the problem of sport management is discussed. Firstly, a brief definition to the notion of
Sport management is given followed by an excurse to history. Than the background and origin of
sport management is discussed the second part of the article is dedicated to the current situation and
prospects of sport management. A special attention is paid to the educational sphere and career
opportunities that potential employees may have in the field of sport management. Finally, the article
is concluded by prospects of sport management.
Introduction
Sport management existed for quite a long period of time and it always accompanied sport as its
essential part. Naturally, it had different forms and differed from the notion of sport management as it
is defined nowadays but such activity is known from ancient times. At least ancient Greeks practiced
such an activity and probably they may be called one of the founders of sport management. This fact
proves the importance of sport and sport management for people of all times. It was and it remains to
be as important for people as their health sine sport provides health for people and sport
management provides effectiveness of sport for all its participants. Nowadays sport management
becomes more and more important because as many other things in the modern world sport is
business and consequently it needs effective management that, in its turn, demands the preparation
of well-qualified specialists in this domain. At the same time sport management is not only business.
As sport so sport management are social phenomena for it involves not only professionals, for whom
sport is their main source of earnings and actually it is their life, but also there is a huge category of
amateurs, for whom sport is just a hobby but they still need sport management to practice sport as
effectively as possible. So, taking into consideration the role of sport and sport management in the
modern world, I would like to discuss this phenomenon in my article and focus my attention on the
notion of sport management itself, its history, and prospects for all those who either on their way or
already work in this field.
The Notion and Role of Sport Management
First of all, it is necessary to start with the definition of sport management. In order to understand any
phenomenon, we have to know what is implied by its definition and interpret it correspondingly.
Speaking about sport management, it is possible to say that there may be different interpretation of
this notion but the main point of all definitions remains practically the same, in other words it may
change its form but its content, its basic principles remain the same.
On analyzing different points of view on sport management, it is possible to make a general
conclusion and give certain conclusion what it actually is. On doing this, I would prefer to define sport
management as follows: "Sport management is a goal-oriented social process within a sport
ISSN 2231-3265 International Journal of Health, Physical Education and Computer Science in Sports
Volume No.2, No.1.
149
enterprise using pragmatic self-determined goals involving the selection of appropriate strategies
andprovisions for directing the work of the sport enterprise, and the control of performance in an effort
to meet the objectives of the organization." (Parkhouse 1996:47). Such a definition provides probably
the best description of sport management and its main characteristics which permit to understand the
essence of this phenomenon.
Naturally, there may be different view on sport management but it is obvious that any sport
organization have to have its goals to achieve. The latter may be done only with the help of sport
management that can organize all the staff of the sport enterprise and mobilize all its forces for
achievement its goals. At the same time, simply to organize the work of a sport organization is not
enough. It is necessary to control the fulfillment of the main tasks each department or even each
person within the organization has to do.
But such a definition helps to realize what sport management is at large. At the same time it is
necessary to take into consideration the position of those people who work in this field and for all
those people who are currently working or are going to work in this sphere sport management is not
just a profession it is rather a set of different professions, basically of administrative character which
provide a person's ability to fulfill his or her duties as a sport manager.
Obviously, management remains management even in such a specific domain as sport, particularly if
we speak about professional sport which nowadays is more than sport. It is a great business and it is
enough to have a look at such monstrous sport associations in North America as NHL, or NBA, for
instance, it will be evident what kind of business it is and how profitable it may be, naturally on the
condition if the management is effective, well planned and the execution of the main tasks is
thoroughly controlled. At the same time we should remember that sport or any sport organization is
more than a commercial enterprise it is also a social phenomenon since very often sport plays very
important role in the life of certain groups of people or even whole countries. For instance, in the
ancient world, namely in Greece, any wars were forbidden during the period of the Olympic games.
So the organization of the Olympic games played a significant peacemaking and consolidating role in
the ancient Greek society.
Unfortunately, nowadays we can hardly find an example like this but still sport remains very important
for any human society and proper organization of sport events as well as effective functioning of
numerous sport enterprises remains extremely significant for people in any country in the world.
Sport Management: Education and Career Opportunities
Taking into consideration the role sport and consequently sport management play in the modern
world, we can presuppose that sport organizations need a great number of well-qualified specialists
that could be provided only by professional education of such specialists on the highest level. The
current situation actually proves that the growing demand engenders the growing offer of sport
management education which matches the basic demands to specialists in this field. But it is
necessary to point out that such a trend has appeared recently, within the last fifty-sixty years.
References: 1.Jones and Barret Learning 2007-1173 2.Essential Reading in sport and Exercise Psychology.David Smith and Michael 2007.
ISSN 2231-3265 International Journal of Health, Physical Education and Computer Science in Sports
Volume No.2, No.1.
150
pp150-151
A comparative study of aerobic endurance among hand ball players and basket ball players in Hyderabad
By Dr.I.Balram Reddy,
Associate Professor, Dept. of Physical Education,OU Mr.A.Xavier,
Physical fitness Coach, Osmania University, Hyderabad Mr.Bikash Karar,
Chairman, Athletics Coaching Academy, Hyderabad Mr.Sunil Dutt,
Physical Fitness Trainer, Athletics Coaching Academy, Hyd Mr.Y.E.Shashi Kumar, Chairman, I.F.C.S.S.
Abstract The aim of the present study was to study the difference in aerobic endurance among Hand Ball and Basket Ball Players.The 40 Male Subjects between the age group of eighteen to twenty one years i.e. Twenty Hand Ball Players and twenty Basket Ball Players of Osmania University who have taken part in the O.U.Inter College sports and games during the year 2010-11 were taken for the study. The 12 Run Cooper Test were used to evaluate the aerobic endurance among Hand Ball and basket Ball Players. The Study shows that the Hand Ball Players are having very good aerobic endurance compare to the Hockey Players. It is recommended that Foot ball and Hockey players must be given good endurance training to play the game in efficient manner. Key words: , Aerobic Endurance,Hand Ball, Basket Ball etc. INTRODUCTION: AEROBIC ENDURANCE: Aerobic Endurance is the amount of oxygen intake during exercise. Aerobic Endurance is the time which you can exercise, without producing lactic acid in your muscles. During aerobic (with oxygen) work, the body is working at a level that the demands for oxygen and fuel can be meet by the body’s intake. The only waste products formed are carbon-dioxide and water which are removed by sweating and breathing. Aerobic exercise is physical exercise of relatively low intensity and long duration, which depends primarily on the aerobic energy system. Aerobic means “with oxygen”, and refers to the use of oxygen in the body’s metabolic or energy – generating process. Many types of exercise are aerobic, and by definition are performed at moderate levels of intensity for extended periods of time. Aerobic exercise comprises innumerable forms. In general, it is performed at a moderate level of intensity over a relatively long period of time. For example, running a long distance at a moderate pace is an aerobic exercise, but sprinting is not. Playing singles tennis, with near continuous motion, is generally considered aerobic activity, while golf or two person team tennis, with brief bursts of activity punctuated by more frequent breaks, may not be predominantly aerobic. Some sports are thus inherently “aerobic”, while other aerobic exercises, such as fartlek training or aerobic dance classes, are designed specifically to improve aerobic capacity and fitness. Basket Ball: Basket Ball is a team sport in which two teams of five active players each tryt o score points against one another by propelling a ball through a 10 feet. Basket Ball is one of the most popular and widely viewed sports in the World. Points are scored by shooting the ball through the basket. The team with more points at the end of the game wins. The ball can be advanced on the court by bouncing it or
passing it between team mates. While Competitive basket ball is primarily an indoor sport, played on
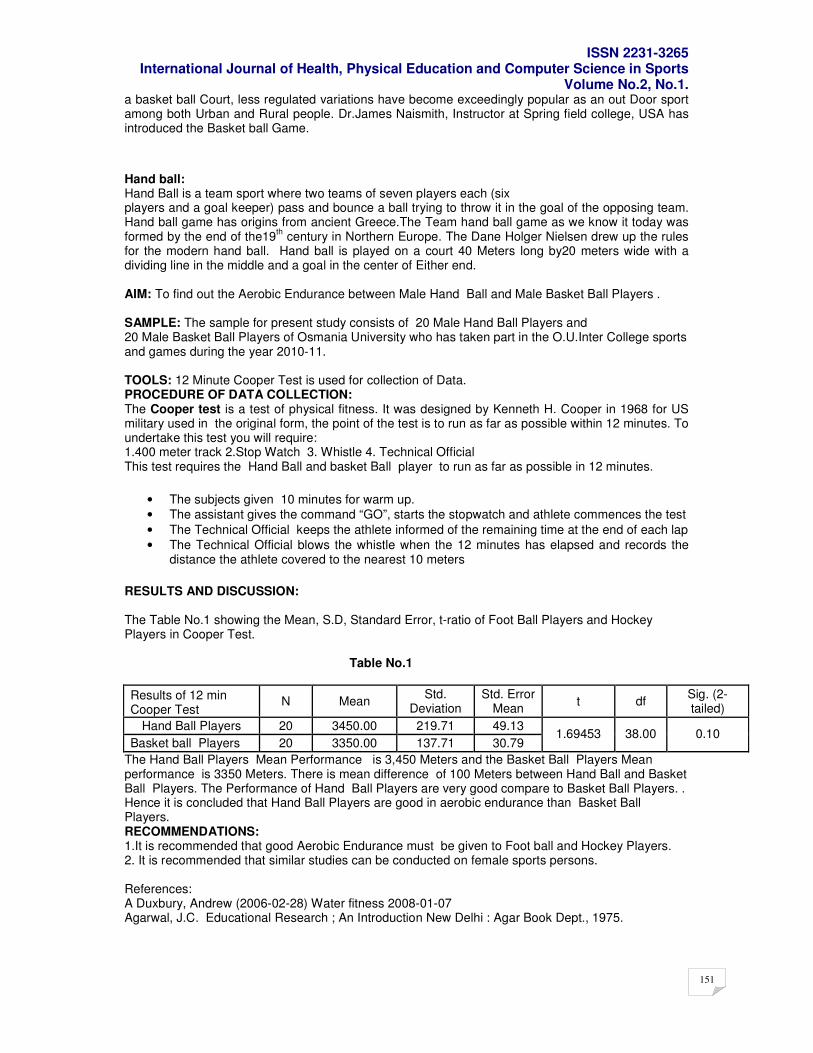
ISSN 2231-3265 International Journal of Health, Physical Education and Computer Science in Sports
Volume No.2, No.1.
151
a basket ball Court, less regulated variations have become exceedingly popular as an out Door sport among both Urban and Rural people. Dr.James Naismith, Instructor at Spring field college, USA has introduced the Basket ball Game.
Hand ball: Hand Ball is a team sport where two teams of seven players each (six players and a goal keeper) pass and bounce a ball trying to throw it in the goal of the opposing team. Hand ball game has origins from ancient Greece.The Team hand ball game as we know it today was formed by the end of the19
th century in Northern Europe. The Dane Holger Nielsen drew up the rules
for the modern hand ball. Hand ball is played on a court 40 Meters long by20 meters wide with a dividing line in the middle and a goal in the center of Either end. AIM: To find out the Aerobic Endurance between Male Hand Ball and Male Basket Ball Players . SAMPLE: The sample for present study consists of 20 Male Hand Ball Players and 20 Male Basket Ball Players of Osmania University who has taken part in the O.U.Inter College sports and games during the year 2010-11. TOOLS: 12 Minute Cooper Test is used for collection of Data. PROCEDURE OF DATA COLLECTION: The Cooper test is a test of physical fitness. It was designed by Kenneth H. Cooper in 1968 for US military used in the original form, the point of the test is to run as far as possible within 12 minutes. To undertake this test you will require: 1.400 meter track 2.Stop Watch 3. Whistle 4. Technical Official This test requires the Hand Ball and basket Ball player to run as far as possible in 12 minutes.
• The subjects given 10 minutes for warm up.
• The assistant gives the command “GO”, starts the stopwatch and athlete commences the test
• The Technical Official keeps the athlete informed of the remaining time at the end of each lap
• The Technical Official blows the whistle when the 12 minutes has elapsed and records the distance the athlete covered to the nearest 10 meters
RESULTS AND DISCUSSION: The Table No.1 showing the Mean, S.D, Standard Error, t-ratio of Foot Ball Players and Hockey Players in Cooper Test. Table No.1
Results of 12 min Cooper Test
N Mean Std.
Deviation Std. Error
Mean t df
Sig. (2-tailed)
Hand Ball Players 20 3450.00 219.71 49.13
Basket ball Players 20 3350.00 137.71 30.79 1.69453 38.00 0.10
The Hand Ball Players Mean Performance is 3,450 Meters and the Basket Ball Players Mean performance is 3350 Meters. There is mean difference of 100 Meters between Hand Ball and Basket Ball Players. The Performance of Hand Ball Players are very good compare to Basket Ball Players. . Hence it is concluded that Hand Ball Players are good in aerobic endurance than Basket Ball Players. RECOMMENDATIONS: 1.It is recommended that good Aerobic Endurance must be given to Foot ball and Hockey Players. 2. It is recommended that similar studies can be conducted on female sports persons. References: A Duxbury, Andrew (2006-02-28) Water fitness 2008-01-07 Agarwal, J.C. Educational Research ; An Introduction New Delhi : Agar Book Dept., 1975.
ISSN 2231-3265 International Journal of Health, Physical Education and Computer Science in Sports
Volume No.2, No.1.
152
pp152-153
Strategy in Chess K.Kanna Reddy,
Lect. In Physical Education, A.V.College
INTRODUCTION:Chess is a two-player board game played on a chessboard, a square-checkered board with 64 squares arranged in an eight-by-eight grid. Each player begins the game with sixteen pieces: One king, one queen, two rooks, two knights, two bishops, and eight pawns. Pieces move in different assigned ways according to their type, and accordingly are used to attack and capture the opponent's pieces. The object of the game is to checkmate the opponent's king, whereby the king is under immediate attack (in "check") and there is no way to move or defend it. Games of chess begin according to either standard (studied in-depth) or non-standard openings, in which the purpose is the development of pieces —moving them into positions where they can be effective. Moves are chosen with offensive and defensive considerations, according to a strategy of attack, or to respond to urgent threats. Throughout the game, players seek to set up and execute exchanges of pieces which gain the advantage in terms of piece value or board position (for example, one may exchange a knight for a knight plus a pawn). At critical stages, winning often requires solving unique or clever situations or puzzles. In addition to checkmate, games may be won by resignation, if too much material has been lost, or if one's position is severely compromised and a checkmate appears unavoidable. Strong players are those who have studied game openings and have developed the skills of depth and insight in their reading of the game position. Theoreticians have developed extensive chess strategies and tactics since the game's inception.
Chess strategy is the aspect of chess playing that is concerned with the evaluation of chess positions and the setting of goals and long-term plans for future play. While evaluating a position strategically, a player must take into account such factors as the relative value of the pieces on the board, pawn structure, king safety, position of pieces, and control of key squares and groups of squares (e.g. diagonals, open files, black or white squares). Chess strategy is distinguished from chess tactics, which is the aspect of chess playing concerned with the move-by-move setting up of threats and defenses. Some authors distinguish static strategic imbalances (e.g. having more valuable pieces or better pawn structure), which tend to persist for many moves, from dynamic imbalances (such as one player having an advantage in piece development), which are temporary. This distinction affects the immediacy with which a sought-after plan should take effect.
Chess strategy consists of setting and achieving long-term goals during the game — for example, where to place different pieces — while tactics concentrate on immediate maneuver. These two parts of chess thinking cannot be completely separated, because strategic goals are mostly achieved by the means of tactics, while the tactical opportunities are based on the previous strategy of play.Because of different strategic and tactical patterns, a game of chess is usually divided into three distinct phases: Opening, usually the first 10 to 25 moves, when players develop their armies and set up the stage for the coming battle; middlegame, the developed phase of the game; and endgame, when most of the pieces are gone and kings start to take an active part in the struggle.A chess opening is the group of initial moves of a game (the "opening moves"). Recognized sequences of opening moves are referred to as openings and have been given names such as the Ruy Lopez or Sicilian Defence. They are catalogued in reference works such as the Encyclopaedia of Chess Openings. It is recommended for anyone but the chessmasters that when left with a choice to either invent a new variation or follow a standard opening, choose the latterThere are dozens of different
openings, varying widely in character from quiet positional play (e.g. the Réti Opening) to very aggressive (e.g. the Latvian Gambit). In some opening lines, the exact sequence considered best for both sides has been worked out to 30–35 moves or moreThe fundamental strategic aims of most openings are simila
• Development: To place (develop) the pieces (particularly bishops and knights) on useful squares where they will have an impact on the game.
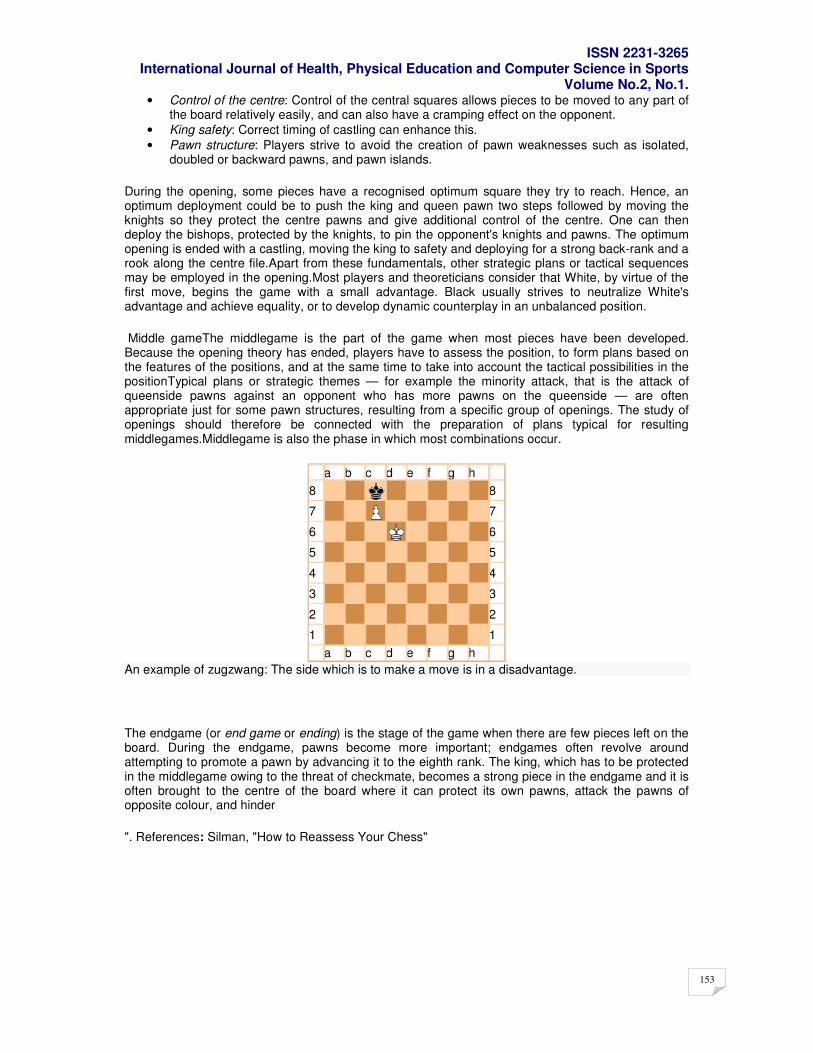
ISSN 2231-3265 International Journal of Health, Physical Education and Computer Science in Sports
Volume No.2, No.1.
153
• Control of the centre: Control of the central squares allows pieces to be moved to any part of the board relatively easily, and can also have a cramping effect on the opponent.
• King safety: Correct timing of castling can enhance this.
• Pawn structure: Players strive to avoid the creation of pawn weaknesses such as isolated, doubled or backward pawns, and pawn islands.
During the opening, some pieces have a recognised optimum square they try to reach. Hence, an optimum deployment could be to push the king and queen pawn two steps followed by moving the knights so they protect the centre pawns and give additional control of the centre. One can then deploy the bishops, protected by the knights, to pin the opponent's knights and pawns. The optimum opening is ended with a castling, moving the king to safety and deploying for a strong back-rank and a rook along the centre file.Apart from these fundamentals, other strategic plans or tactical sequences may be employed in the opening.Most players and theoreticians consider that White, by virtue of the first move, begins the game with a small advantage. Black usually strives to neutralize White's advantage and achieve equality, or to develop dynamic counterplay in an unbalanced position.
Middle gameThe middlegame is the part of the game when most pieces have been developed. Because the opening theory has ended, players have to assess the position, to form plans based on the features of the positions, and at the same time to take into account the tactical possibilities in the positionTypical plans or strategic themes — for example the minority attack, that is the attack of queenside pawns against an opponent who has more pawns on the queenside — are often appropriate just for some pawn structures, resulting from a specific group of openings. The study of openings should therefore be connected with the preparation of plans typical for resulting middlegames.Middlegame is also the phase in which most combinations occur.
a b c d e f g h 8 8
7 7
6 6
5 5
4 4
3 3
2 2
1 1
a b c d e f g h An example of zugzwang: The side which is to make a move is in a disadvantage.
The endgame (or end game or ending) is the stage of the game when there are few pieces left on the board. During the endgame, pawns become more important; endgames often revolve around attempting to promote a pawn by advancing it to the eighth rank. The king, which has to be protected in the middlegame owing to the threat of checkmate, becomes a strong piece in the endgame and it is often brought to the centre of the board where it can protect its own pawns, attack the pawns of opposite colour, and hinder
". References: Silman, "How to Reassess Your Chess"