issn 2008-0050 (print), issn 1927-0097 (online) a … 2008-0050 (print), issn ... and energy...
TRANSCRIPT
Lecture Notes in Management Science (2013) Vol. 5: 74–83 5th International Conference on Applied Operational Research, Proceedings © Tadbir Operational Research Group Ltd. All rights reserved. www.tadbir.ca
ISSN 2008-0050 (Print), ISSN 1927-0097 (Online)
A customer satisfaction model based
on fuzzy TOPSIS and SERVQUAL
methods
Melike Erdoğan, Özge Nalan Bilişik, İhsan Kaya and Hayri Baraçlı
Department of Industrial Engineering, Yildiz Technical University, Istanbul, Turkey [email protected]; [email protected]; [email protected]; [email protected]
Abstract. Service quality is one of the most important factors that increases the use of public transportation system (PTS). Many problems such as traffic congestion, air and noise pollution, and energy consumption can be solved by improvements of service quality in PTS. In this paper, a hybrid methodology which consists of SERVQUAL (Service Quality) method that categorizes evaluation criteria and fuzzy TOPSIS (Technique for Order Preference by Similarity to Ideal Solution) method that ranks alternatives is suggested for evaluation of service quality in PTS. The suggested methodology is applied in a real case that analyzes the PTS in Istanbul. As a result, the public transportation company that provides the highest customer satisfaction
is identified.
Keywords: customer satisfaction, fuzzy logic, multi-criteria decision making
Introduction
The service can be defined as an event that is produced to meet requirements and
currently consumed. Services are economic activities, they are offered one to by
one party to another and employed time-based performances to bring about desired
results in recipients themselves or in objects or other assets for which purchases
have responsibility (Lovelock and Wirtz, 2007). Measuring the degree of satisfaction with service performance concerning a set of relevant criteria is a way to evaluate
service quality. Passengers are the important elements for measuring and evaluating
the service provided (Freitas, 2013). Service quality is one of the most important
factors which extends the use of public transport (Fujii and Van, 2009). Public
transportation is an activity type of service. The understanding the typical characteristics

M Erdoğan et al 75
of the public transportation provides a high quality level that meets the needs and
expectations of the passengers (Freitas, 2013).Evaluation of public transportation
to increase productivity and improve customer satisfaction in terms of quality of
service is very important. All public transport organizations assess the quality of
service regularly.
Although various models developed for measuring service quality in service
organizations, SERVQUAL is accepted as the basis for all of these models
(Saravanan and Rao, 2007). The criteria used for measuring the quality of service are not only limited to quantitative, because service quality dimensions cannot be
measured quantitatively (Awasthi et al., 2011), so as multi-criteria decision making
approaches can be used successfully in this area. By the way, it is determined and
evaluated in subjective and qualitative in nature and described linguistically. To
handle with this, fuzzy logic is used as a mathematical way to represent and handle
vagueness in decision-making (Tseng, 2011).
In this paper, an integrated methodology consists of SERVQUAL and fuzzy
TOPSIS methodology for evaluation of service quality of public transportation
systems (PTS) is proposed. As a real case application, the PTS in Istanbul is investigated
and the public transportation company that provides the highest customer satisfaction
is identified.
The rest of the paper is organized as follows: Section 2 includes a literature review on service quality in PTS. Section 3 gives information about the multi-criteria decision
making (MCDM) methodology that is used in the proposed methodology. In Section
4, conducted real case application for public transportation in Istanbul is analyzed.
The obtained results and future research directions are discussed in Section 5.
Literature review
Altuntas et al. (2012) used analytic hierarchy process (AHP) and analytic network
process (ANP) to acquire the relationship and the level of the importance among
service quality measurement dimension. Olsson et al. (2012) presented the Satisfaction
with Travel Scale (STS) for measuring the service experience in public transport.
They obtained that service experience is multidimensional, consisting of a cognitive
dimension related to service quality and two affective dimensions related to positive
activation, such as enthusiasm or boredom, and positive deactivation, such as
relaxation or stress. Barabino et al. (2012) used modified SERVQUAL approach
compliant with the EN13816, a European standard on service quality in public transport. Their aim was to provide a quality evaluation tool readily usable by
transport operators willing to certify the service offered. Castillo and Benitez
(2012) determined a methodology to identify and quantify the relationship between
the ratings given to the overall satisfaction and those given to specific aspects of
the service or specific ratings to measure the quality of public transport through
user surveys by rating different aspects of the service. Carvalho and Brito (2012)
presented the evaluation about the perceptions of users of public services in order
to improve quality of public services. They aimed to answer the question about

76 Lecture Notes in Management Science Vol. 5: ICAOR 2013, Proceedings
how to assess users’ perceptions in order to improve public service quality.
Awasthi et al. (2011) proposed a hybrid approach based on SERVQUAL and
fuzzy TOPSIS for evaluating service quality of urban transportation systems.
Their approach consisted of three steps. In the first step, they developed a
SERVQUAL based questionnaire to collect data for measuring transportation service
quality. Second step involved the linguistic ratings were combined through fuzzy
TOPSIS to generate an overall performance score for each alternative and finally
in step 3, they conducted a sensitivity analysis to evaluate the influence of criteria weights on the decision making process. Chou et al. (2011) proposed a fuzzy
weighted SERVQUAL model for evaluating the airline service quality and applied a
case study for Taiwanese airline. Hilmola (2011) aimed to evaluate public transportation
efficiency in larger cities and developed four different DEA-based efficiency
benchmarking models to evaluate the public transportation efficiency. Dell’Olio et
al. (2011) explored a methodology used to study the quality of service desired by
users of PTS. They expressed that desired quality was different from perceived
quality because it was not represent the daily experiences of the users, but rather
what they desired, hope for or expect from their PTS. Wang et al. (2010) presented
an instrument based on SERVQUAL for measuring urban transport service quality
from a stakeholder perspective. Pantouvakis and Lymperopoulos (2008) presented
the relative importance of the physical and interactive elements of service on overall satisfaction, particularly when these elements were moderated by the
point-of-view of repeat and new customers in transport sector. Wu et al. (2004)
tested five dimensions of SERVQUAL for hospitals by using the fuzzy set theory
to clarify the positioning of service quality in the healthcare market and suggested
service strategy implementation priorities of service strategies.
The proposed methodology
In this paper, criteria for the public transportation service quality are classified
according to SERVQUAL dimensions. The criteria are categorized with respect to
the SERVQUAL dimensions which are accepted in literature (Awasthi, 2011;
Tseng, 2011; Liou, 2011). Then, fuzzy TOPSIS approach is used to rank the alter-
natives. The fuzzy set theory is applied to deal with uncertainty associated with
the data and to gain more realistic results, thus the effectiveness of multi criteria
decision making methods are increased. The methods that are used in this paper
are briefly explained as follows.
SERVQUAL Approach
SERVQUAL is a useful instrument for performing gaps analysis where a gap is
measured as the difference between the customer expectations and customer
perceptions. The dimensions of SERVQUAL are Tangibles, Service Reliability,
Responsiveness, Assurance and Empathy. These dimensions are defined as follows
M Erdoğan et al 77
(Awasthi et al., 2011): Tangibles include the physical appearance of the service
facility, the equipment, the personnel, and the communication materials, i.e., ap-
pearance of stations, lighting, etc. Service reliability relates to the ability of the
service provider to perform the promised service dependably and accurately, i.e.,
arrival of trains at the right time. Responsiveness is the willingness of the service
provider to be helpful and prompt in providing service, i.e., response of customer
queries by railway personnel. Assurance refers to the knowledge and courtesy of
employees and their ability to inspire trust and confidence, i.e., knowledge staff at information desks. Empathy refers to caring, individualized attention to customers,
i.e., helping old age customers with ticket reservation at kiosks.
Fuzzy TOPSIS
TOPSIS is a multi-criteria decision-making technique to rank different alternatives
through numerical evaluations the decision maker performs with respect to certain
criteria. Weights can also be specified for each criterion, in order to introduce a measure of the relative importance felt by the decision maker (Gamberini et al.,
2006; Kahraman et al., 2009b). The method is based on the consideration that the
chosen alternative should have the shortest distance from the positive- ideal solution
and the farthest distance from the negative ideal solution. TOPSIS defines an index
called similarity to the positive- ideal solution and remoteness from the negative-ideal
solution. Then the method chooses an alternative with the maximum similarity to
the ideal solution (Yoon and Hwang, 1995).
The fuzzy set theory resembles human reasoning in its use of approximate
information and uncertainty to generate decisions. It was specifically designed to
mathematically represent uncertainty and vagueness and provide formalized tools
for dealing with the imprecision intrinsic to many problems. By contrast, traditional computing demands precision down to each bit. Since knowledge can be expressed in
a more natural way by using fuzzy sets, many engineering and decision problems
can be greatly simplified. The decision maker can specify preferences in the form
of natural language expressions about the importance of each criterion (Kahraman
et al., 2004a). In this paper fuzzy TOPSIS approach is used to specify the ranking
of alternatives according to aggregated decision matrix and weight vector as well
as the individual decision matrices and weigh vectors.
Fuzzy TOPSIS was first presented in Chen and Hwang (1992), with reference
to Hwang and Yoon (1981). The basic principle of the fuzzy TOPSIS is that the
chosen alternative should have the shortest distance from the positive ideal solution
and the farthest distance from the negative-ideal solution in a geometrical (i.e.,
Euclidean) sense (Hwang & Yoon, 1981). The steps of fuzzy TOPSIS can be summarized as follows (Chen, 2000; Aydın et al., 2012; Baysal et al., 2013):
Step 1: Form a committee of decision-makers, and then identify the evaluation criteria.
Step 2: Choose the appropriate linguistic variables for the importance weight of
the criteria and the linguistic ratings for alternatives with respect to criteria. For
this aim, Tables 1 and 2 can be used.

78 Lecture Notes in Management Science Vol. 5: ICAOR 2013, Proceedings
Table 1. Linguistic variables for the importance weight of each criterion
Very low (VL) ( 0.0, 0.0, 0.1 )
Low (L) ( 0.0, 0.1, 0.3 )
Medium low (ML) ( 0.1, 0.3, 0.5 )
Medium (M) ( 0.3, 0.5, 0.7 )
Medium high (MH) ( 0.5, 0.7, 0.9 )
High (H) ( 0.7, 0.9, 1.0 )
Very high (VH) ( 0.9, 1.0, 1.0)
Table 2. Linguistic variables for the ratings
Very poor (VP) ( 0, 0, 1 )
Poor (P) ( 0, 1, 3 )
Medium poor (MP) ( 1, 3, 5 )
Fair (F) ( 3, 5, 7 )
Medium good (MG) ( 5, 7, 9 )
Good (G) ( 7, 9, 10 )
Very good (VG) ( 9, 10, 10 )
Step 3: Pool the decision makers' opinions to get the aggregated fuzzy rating ijx
of alternative iA under criterion jC and aggregate the weights of criteria to get the
aggregated fuzzy weight jw of criterion jC by using Eqs. (1) and (2), respectively.
Kijijijij x~)()(x~)(x~
Kx~ 211
(1)
Kjjjj w~)()(w~)(w~
Kw~ 211
(2)
where K is the number of decision makers, K
ijx and K
jw are the rating and the
importance weight of the Kth decision maker. Step 4: Construct the fuzzy decision matrix and the normalized fuzzy decision matrix
as in Eqs. (3) and (4).
n*mijr~R
~ (3)
(4)
where B and C are the set of benefit criteria and cost criteria, respectively,
Step 5: Construct the weighted normalized fuzzy decision matrix by Eqs. (5) and (6).
(5)
ij ij ij j j j
ij ij* * *
ij ij ijj j j
*
j ij j ijii
a b c a a ar , , , j B; r , , , j C;
c b ac c c
c max c if j B; a min a if j C.
ij m nV v
M Erdoğan et al 79
jijij w~r~v~ (6)
Step 6: Determine fuzzy positive-ideal solution (FPIS) and fuzzy negative-ideal
solution (FNIS).
Step 7: Calculate the distances of each alternative from the FPIS (A*) and the
FNIS (A-) as in Eq. (7), respectively.
(7) Step 8: Calculate the closeness coefficient of each alternative as in Eq. (8).
(8)
where d (ii dd ,*
) is the distance measurement between two fuzzy numbers.
Then a closeness coefficient is defined to determine the ranking order of all
alternatives as in Eq. (9).
(9) Step 9: According to the closeness coefficient, the ranking order of all alternatives
can be determined.
A real case application
In Istanbul, the public transportation is generally provided by buses, minibuses,
taxis and private cars. The public transportation firms in Istanbul are Istanbul
Electricity, Tramway and Tunnel General Management (IETT), Metrobus (BRT
System), Private Public Transportation Busses (PPTB) and Otobus Inc. The questionnaire used in this study is applied to totally 2006 passengers who
get on and get off the busses at bus stops and Metrobus stations, and 800 of them
at Metrobus stations and 1206 of them is hold at the bus stops. This sample size
means the %95 ± 2.19 confidence levels. In this customer satisfaction research, 56
bus stops and 7 Metrobus stations are selected. The questionnaire consists of 59
questions. The first eighteen questions are about the demographic characteristics
and so they are not used in the evaluation. The criteria used in this paper are composed
of the questions in the customer satisfaction questionnaire. In conjunction with
these criteria, TOPSIS method is applied to rank the alternatives according to
satisfaction level.
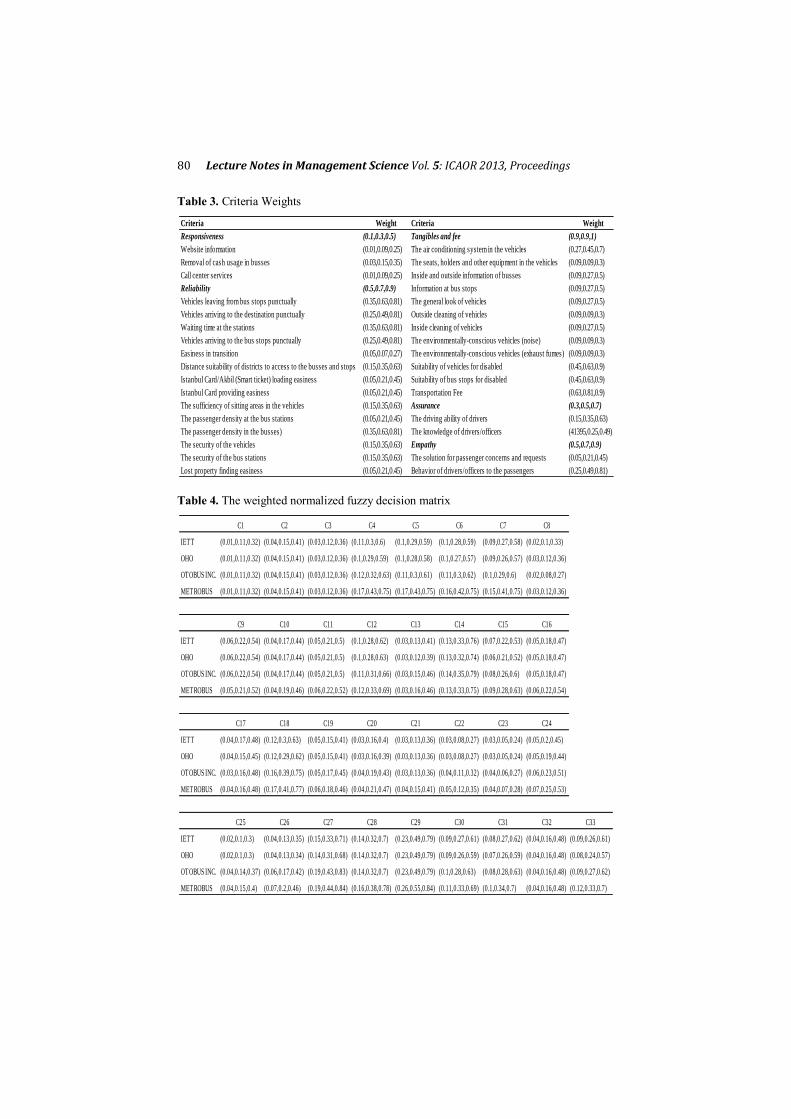
The criteria weights are identified by experts’ evaluations who are decision makers in Institution of Public Transport, as shown in Table 3. The fuzzy TOPSIS
is applied to rank the alternatives. In the first stage, a decision matrix is constructed
from normalized survey results according to the scale of 5-point Likert.
FPIS and FNIS are determined for all criteria. Then, the distances of each alternative
from the fuzzy positive-ideal solution (FPIS, A*) and the fuzzy negative-ideal
solution (FNIS, A-) are calculated as in Eq. (7). The weighted normalized fuzzy
decision matrix is shown in Table 4.
* * * *
1 2 nA (v ,v ,..., v ), 1 2 nA (v ,v ,..., v )
n* *
i ij ij
j 1
d d(v , v ), i 1,2,...,m
n
i ij ij
j 1
d d(v , v ), i 1,2,...,m
i
i *
i i
dCC , i 1,2,...,m
d d
80 Lecture Notes in Management Science Vol. 5: ICAOR 2013, Proceedings
Table 3. Criteria Weights
Table 4. The weighted normalized fuzzy decision matrix
Criteria Weight Criteria Weight
Responsiveness (0.1,0.3,0.5) Tangibles and fee (0.9,0.9,1)
Website information (0.01,0.09,0.25) The air conditioning system in the vehicles (0.27,0.45,0.7)
Removal of cash usage in busses (0.03,0.15,0.35) The seats, holders and other equipment in the vehicles (0.09,0.09,0.3)
Call center services (0.01,0.09,0.25) Inside and outside information of busses (0.09,0.27,0.5)
Reliability (0.5,0.7,0.9) Information at bus stops (0.09,0.27,0.5)
Vehicles leaving from bus stops punctually (0.35,0.63,0.81) The general look of vehicles (0.09,0.27,0.5)
Vehicles arriving to the destination punctually (0.25,0.49,0.81) Outside cleaning of vehicles (0.09,0.09,0.3)
Waiting time at the stations (0.35,0.63,0.81) Inside cleaning of vehicles (0.09,0.27,0.5)
Vehicles arriving to the bus stops punctually (0.25,0.49,0.81) The environmentally-conscious vehicles (noise) (0.09,0.09,0.3)
Easiness in transition (0.05,0.07,0.27) The environmentally-conscious vehicles (exhaust fumes) (0.09,0.09,0.3)
Distance suitability of districts to access to the busses and stops (0.15,0.35,0.63) Suitability of vehicles for disabled (0.45,0.63,0.9)
Istanbul Card/Akbil (Smart ticket) loading easiness (0.05,0.21,0.45) Suitability of bus stops for disabled (0.45,0.63,0.9)
Istanbul Card providing easiness (0.05,0.21,0.45) Transportation Fee (0.63,0.81,0.9)
The sufficiency of sitting areas in the vehicles (0.15,0.35,0.63) Assurance (0.3,0.5,0.7)
The passenger density at the bus stations (0.05,0.21,0.45) The driving ability of drivers (0.15,0.35,0.63)
The passenger density in the busses) (0.35,0.63,0.81) The knowledge of drivers/officers (41395,0.25,0.49)
The security of the vehicles (0.15,0.35,0.63) Empathy (0.5,0.7,0.9)
The security of the bus stations (0.15,0.35,0.63) The solution for passenger concerns and requests (0.05,0.21,0.45)
Lost property finding easiness (0.05,0.21,0.45) Behavior of drivers/officers to the passengers (0.25,0.49,0.81)
C1 C2 C3 C4 C5 C6 C7 C8
IETT (0.01,0.11,0.32) (0.04,0.15,0.41) (0.03,0.12,0.36) (0.11,0.3,0.6) (0.1,0.29,0.59) (0.1,0.28,0.59) (0.09,0.27,0.58) (0.02,0.1,0.33)
OHO (0.01,0.11,0.32) (0.04,0.15,0.41) (0.03,0.12,0.36) (0.1,0.29,0.59) (0.1,0.28,0.58) (0.1,0.27,0.57) (0.09,0.26,0.57) (0.03,0.12,0.36)
OTOBUS INC. (0.01,0.11,0.32) (0.04,0.15,0.41) (0.03,0.12,0.36) (0.12,0.32,0.63) (0.11,0.3,0.61) (0.11,0.3,0.62) (0.1,0.29,0.6) (0.02,0.08,0.27)
METROBUS (0.01,0.11,0.32) (0.04,0.15,0.41) (0.03,0.12,0.36) (0.17,0.43,0.75) (0.17,0.43,0.75) (0.16,0.42,0.75) (0.15,0.41,0.75) (0.03,0.12,0.36)
C9 C10 C11 C12 C13 C14 C15 C16
IETT (0.06,0.22,0.54) (0.04,0.17,0.44) (0.05,0.21,0.5) (0.1,0.28,0.62) (0.03,0.13,0.41) (0.13,0.33,0.76) (0.07,0.22,0.53) (0.05,0.18,0.47)
OHO (0.06,0.22,0.54) (0.04,0.17,0.44) (0.05,0.21,0.5) (0.1,0.28,0.63) (0.03,0.12,0.39) (0.13,0.32,0.74) (0.06,0.21,0.52) (0.05,0.18,0.47)
OTOBUS INC. (0.06,0.22,0.54) (0.04,0.17,0.44) (0.05,0.21,0.5) (0.11,0.31,0.66) (0.03,0.15,0.46) (0.14,0.35,0.79) (0.08,0.26,0.6) (0.05,0.18,0.47)
METROBUS (0.05,0.21,0.52) (0.04,0.19,0.46) (0.06,0.22,0.52) (0.12,0.33,0.69) (0.03,0.16,0.46) (0.13,0.33,0.75) (0.09,0.28,0.63) (0.06,0.22,0.54)
C17 C18 C19 C20 C21 C22 C23 C24
IETT (0.04,0.17,0.48) (0.12,0.3,0.63) (0.05,0.15,0.41) (0.03,0.16,0.4) (0.03,0.13,0.36) (0.03,0.08,0.27) (0.03,0.05,0.24) (0.05,0.2,0.45)
OHO (0.04,0.15,0.45) (0.12,0.29,0.62) (0.05,0.15,0.41) (0.03,0.16,0.39) (0.03,0.13,0.36) (0.03,0.08,0.27) (0.03,0.05,0.24) (0.05,0.19,0.44)
OTOBUS INC. (0.03,0.16,0.48) (0.16,0.39,0.75) (0.05,0.17,0.45) (0.04,0.19,0.43) (0.03,0.13,0.36) (0.04,0.11,0.32) (0.04,0.06,0.27) (0.06,0.23,0.51)
METROBUS (0.04,0.16,0.48) (0.17,0.41,0.77) (0.06,0.18,0.46) (0.04,0.21,0.47) (0.04,0.15,0.41) (0.05,0.12,0.35) (0.04,0.07,0.28) (0.07,0.25,0.53)
C25 C26 C27 C28 C29 C30 C31 C32 C33
IETT (0.02,0.1,0.3) (0.04,0.13,0.35) (0.15,0.33,0.71) (0.14,0.32,0.7) (0.23,0.49,0.79) (0.09,0.27,0.61) (0.08,0.27,0.62) (0.04,0.16,0.48) (0.09,0.26,0.61)
OHO (0.02,0.1,0.3) (0.04,0.13,0.34) (0.14,0.31,0.68) (0.14,0.32,0.7) (0.23,0.49,0.79) (0.09,0.26,0.59) (0.07,0.26,0.59) (0.04,0.16,0.48) (0.08,0.24,0.57)
OTOBUS INC. (0.04,0.14,0.37) (0.06,0.17,0.42) (0.19,0.43,0.83) (0.14,0.32,0.7) (0.23,0.49,0.79) (0.1,0.28,0.63) (0.08,0.28,0.63) (0.04,0.16,0.48) (0.09,0.27,0.62)
METROBUS (0.04,0.15,0.4) (0.07,0.2,0.46) (0.19,0.44,0.84) (0.16,0.38,0.78) (0.26,0.55,0.84) (0.11,0.33,0.69) (0.1,0.34,0.7) (0.04,0.16,0.48) (0.12,0.33,0.7)
M Erdoğan et al 81
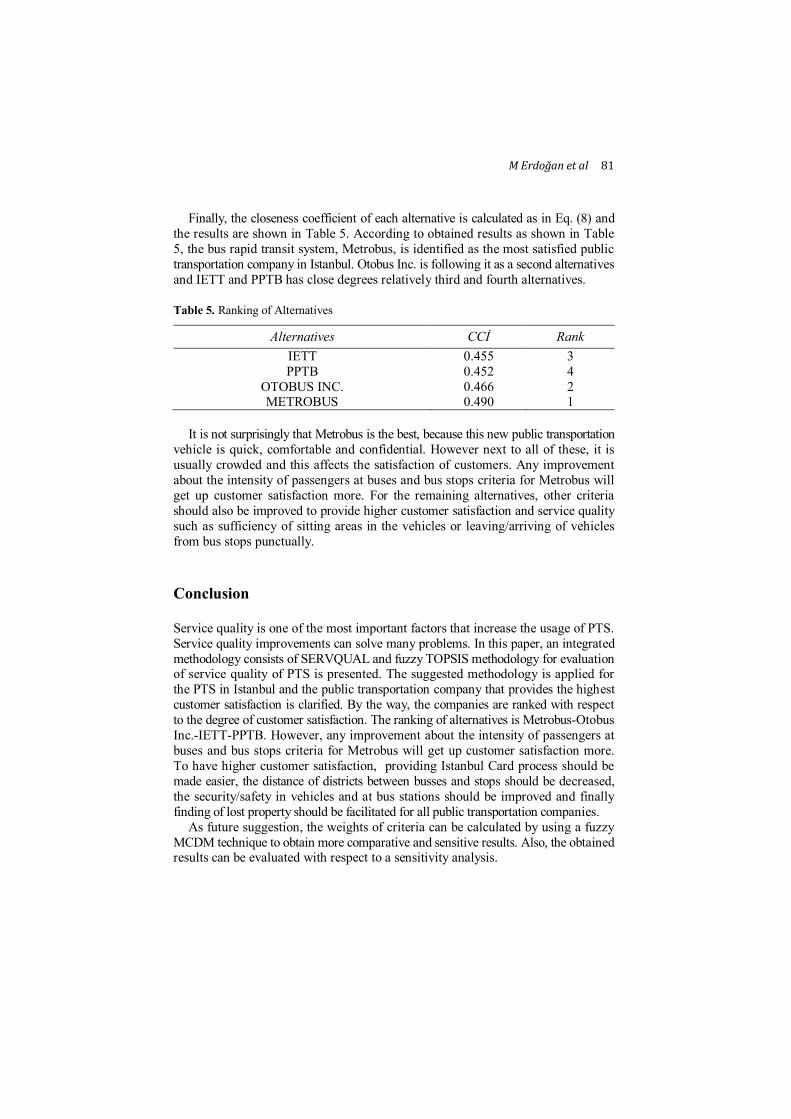
Finally, the closeness coefficient of each alternative is calculated as in Eq. (8) and
the results are shown in Table 5. According to obtained results as shown in Table
5, the bus rapid transit system, Metrobus, is identified as the most satisfied public
transportation company in Istanbul. Otobus Inc. is following it as a second alternatives
and IETT and PPTB has close degrees relatively third and fourth alternatives.
Table 5. Ranking of Alternatives
Alternatives CCİ Rank
IETT 0.455 3
PPTB 0.452 4
OTOBUS INC. 0.466 2 METROBUS 0.490 1
It is not surprisingly that Metrobus is the best, because this new public transportation
vehicle is quick, comfortable and confidential. However next to all of these, it is
usually crowded and this affects the satisfaction of customers. Any improvement
about the intensity of passengers at buses and bus stops criteria for Metrobus will
get up customer satisfaction more. For the remaining alternatives, other criteria
should also be improved to provide higher customer satisfaction and service quality
such as sufficiency of sitting areas in the vehicles or leaving/arriving of vehicles
from bus stops punctually.
Conclusion
Service quality is one of the most important factors that increase the usage of PTS.
Service quality improvements can solve many problems. In this paper, an integrated
methodology consists of SERVQUAL and fuzzy TOPSIS methodology for evaluation of service quality of PTS is presented. The suggested methodology is applied for
the PTS in Istanbul and the public transportation company that provides the highest
customer satisfaction is clarified. By the way, the companies are ranked with respect
to the degree of customer satisfaction. The ranking of alternatives is Metrobus-Otobus
Inc.-IETT-PPTB. However, any improvement about the intensity of passengers at
buses and bus stops criteria for Metrobus will get up customer satisfaction more.
To have higher customer satisfaction, providing Istanbul Card process should be
made easier, the distance of districts between busses and stops should be decreased,
the security/safety in vehicles and at bus stations should be improved and finally
finding of lost property should be facilitated for all public transportation companies.
As future suggestion, the weights of criteria can be calculated by using a fuzzy
MCDM technique to obtain more comparative and sensitive results. Also, the obtained results can be evaluated with respect to a sensitivity analysis.
82 Lecture Notes in Management Science Vol. 5: ICAOR 2013, Proceedings
References
Altuntas S, Dereli T and Yilmaz MK (2012). Multi-criteria decision making methods based weighted SERVQUAL scales to measure perceived service quality in hospitals: a case study from Turkey. Total Quality Management & Business Excellence 23(11-12): 1379-1395
Awasthi A, Chauhan SS, Omrani H, and Panahi A (2011). A hybrid approach based on SERVQUAL and fuzzy TOPSIS for evaluating transportation service quality. Computers
& Industrial Engineering 61: 637–646 Aydın S, Kahraman C and Kaya İ (2012). A New Fuzzy Multi Criteria Decision Making
Approach: An Application for European Quality Award Assessment. Knowledge Based Systems 32: 37-46
Barabino B, Deiana E and Tilocca P (2012). Measuring service quality in urban bus transport: a modified SERVQUAL approach. International Journal of Quality and Service Sciences 4(3): 238 – 252
Baysal ME, Kaya İ, Kahraman C, Sarucan A and Engin O (2013). A Two Phased Fuzzy
Methodology for Selection among Municipal Projects. Technological and Economic Development of Economy, Article in Press
Carvalho C and Brito C (2012). Assessing Users' Perceptions on how to Improve Public Services Quality. Public Management Review 14(4): 451-472
Castillo JMD and Benitez FG (2012). A methodology for modeling and identifying users’ satisfaction issues in public transport systems based on users surveys. Procedia - Social and Behavioral Sciences 54:1104 – 1114
Chen CT (2000). Extensions of the TOPSIS for group decision-making under fuzzy envi-
ronment. Fuzzy Sets and Systems 114: 1-9 Chen SJ and Hwang, CL 1992. Fuzzy Multiple Attribute Decision Making: Methods and
Applications. Springer –Verlag, Berlin Chou CC, Liu LJ, Huang SF, Yih, JM and Han TC (2011). An evaluation of airline service
quality using the fuzzy weighted SERVQUAL method. Applied Soft Computing 11: 2117–2128
Dell’Olio L, Ibeas A and Cecin P (2011). The quality of service desired by public transport users. Transport Policy 18: 217–227
Freitas ALP (2013). Assessing the quality of intercity road transportation of passengers: An exploratory study in Brazil, Transportation Research Part A 49: 379–392.
Fujii S and Van HT (2009). Psychological Determinants of the Intention to Use the Bus in Ho Chi Minh City, Journal of Public Transportation 12(1):97-110
Gamberini R, Grassi A and Rimini B (2006). A new multi- objective heuristic algorithm for solving the stochastic assembly line re-balancing problem. International Journal of Production Economics 102:226- 243
Hilmola OP (2011). Benchmarking efficiency of public passenger transport in larger cities. Benchmarking: An International Journal 18(1): 23 – 41
Hwang CL and Yoon K (1981). Multiple Attributes Decision Making Methods and Applications. Springer, Berlin Heidelberg
James JH (2011). Variable Consistency Dominance-based Rough Set Approach to formulate airline service strategies. Applied Soft Computing 11: 4011–4020
Kahraman C, Engin O, Kabak O and Kaya I (2009). Information systems outsourcing decisions using a group decision-making approach. Engineering Applications of Artificial Intelligence 22:832–841
Kahraman C, Cebeci A, Ruan D (2004). Multi-attribute comparison of catering service
companies using fuzzy AHP: The case of Turkey. International Journal of Production Economics 87:171–184
M Erdoğan et al 83
Lovelock CH and Wirtz J (2007). Services Marketing: People, Technology, Strategy, Prentice Hall
Olsson LE, Friman M, Pareigis J and Edvardsson B (2012). Measuring service experience:
Applying the satisfaction with travel scale in public transport. Journal of Retailing and Consumer Services 19: 413–418
Pantouvakis A and Lymperopoulos K (2008). Customer satisfaction and loyalty in the eyes of new and repeat customers: Evidence from the transport sector. Managing Service Quality 18(6): 623 – 643
Saravanan R and Rao KSP (2007). The impact of total quality service age on quality and operational performance: an empirical study. The TQM Magazine 19(3): 197 - 205
Tseng ML (2011). Using hybrid MCDM to evaluate the service quality expectation in linguistic
preference. Applied Soft Computing 11: 4551–4562 Wang SM, Feng CM and Hsieh CH (2010). Stakeholder perspective on urban transport system
service quality. Total Quality Management & Business Excellence 21(11): 1103-1119 Wu WY, Hsiao SW and Kuo HP (2004): Fuzzy Set Theory Based Decision Model for
Determining Market Position and Developing Strategy for Hospital Service Quality. Total Quality Management & Business Excellence 15:4, 439-456
Yoon KP and Hwang CL (1995). Multiple attribute decision making: An introduction. Sage publications, India.