issn 1735-8523 (print), issn 1927 ... - repository.supsi.ch
TRANSCRIPT

Journal of Applied Operational Research (2012) 4(3), 110–124 © Tadbir Operational Research Group Ltd. All rights reserved. www.tadbir.ca
ISSN 1735-8523 (Print), ISSN 1927-0089 (Online)
Robust multicasting on stochastic
wireless actuator networks: an
algorithmic approach
Nihat Engin Toklu and Roberto Montemanni *
Istituto Dalle Molle di Studi sull’Intelligenza Artificiale (IDSIA), Manno, Switzerland
Abstract. In this paper, we study the minimum power multicasting problem where the transmission power required for one
network terminal to transmit to another is subject to uncertainty. We present our algorithmic approach which executes a
classical mixed integer linear programming approach on the problem and then executes algorithmic procedures on the solution
to improve its robustness. We then show our experimental procedures which test our approach on different levels of uncertainty
and study the trade-off provided by the approach between solution cost and robustness. We also mathematically verify the
correctness of the sampling method used in the experiments.
Keywords: wireless networks; minimum power multicasting; robust optimization; mathematical programming
* Received September 2011. Accepted April 2012
Introduction
Minimum power multicasting problem is a problem faced for remotely commanding actuators which operate
where the conditions are not human friendly. Another situation where this problem is faced is the establishment
of communication in areas where the existing infrastructure is damaged by natural disasters (Leggieri et al.,
2008). Terminals being the devices which are used for establishing the network, in this study, we consider the
applications in which a source terminal has to do multicasting to a set of destination terminals. The destination
terminals can either receive the message sent from the source terminal directly, or via intermediate terminals acting
as routers (Rappaport, 1996). Also, since the messages are sent by multicasting (via the antennea attached to the
terminals), several terminals can receive data from the same terminal if they are in the range of the transmitting
terminal's coverage area. This is known as the wireless multicast advantage (Wieselthier et al., 2002). Wireless
multicast advantage is illustrated in Figure 1.
* Correspondence: Roberto Montemanni, Istituto Dalle Molle di
Studi sull’Intelligenza Artificiale (IDSIA), Galleria 2, CH-6928
Manno, Switzerland. E-mail: [email protected]

NE Toklu and R Montemanni
111
Fig. 1. The wireless multicast advantage. In this example, both terminals 2 and 3 are within the coverage area of terminal 1.
Therefore, terminal 1 is multicasting to terminals 2 and 3.
Because the terminals depend on small batteries, it is important to find routing paths which depend on smaller
coverage areas, minimizing the power usage on terminals, thus allowing the network to survive longer. This
problem is known as minimum power multicasting problem (MPMP), where the goal is to find a coverage area
for each terminal such that all destination terminals are reached from the source and the total transmission power
is minimized (Leggieri, 2008). MPMP is illustrated in Figure 2.
Fig. 2. An example instance for minimum power multicasting problem (MPMP), and two example solutions, which are ob-
tained according to different decisions on coverage areas of terminals. The total transmission power, which is to be mini-
mized, can vary significantly between such solutions.
In traditional optimization models, it is assumed that the data of the problem is known exactly. Because of
unforeseen (or ignored) events, however, the actual data of the problem can differ and the optimum solution of
the original model can turn out to be far from optimal, or even infeasible in reality (Ben-Tal and Nemirovski,
1998; Ben-Tal and Nemirovski, 2000). An early study on optimization against uncertainty can be found in
(Soyster, 1973). Robust optimization (Bertsimas and Sim, 2003; Bertsimas and Sim, 2004; Babonneau et al.,
2010) is a methodology which assumes that there are data with uncertainty in the problem and those data with

Journal of Applied Operational Research Vol. 4, No. 3
112
uncertainty reflect into the robust optimization model as intervals or sets, instead of exactly known numbers. An
example of robust optimization applications in stochastic processes can be found in (Bertsimas et al., 2010).
In this paper, we study MPMP and we also consider that the data of the problem, i.e. the transmission power
required for the network terminals to transmit to others (shortly, power requirement values), are subject to uncertainty.
This uncertainty represents the fact that the power requirement values are affected by weather conditions and errors in
the measurements of the distances between the network terminals. Engineers are in charge of estimating th is
uncertainty.
On the version of MPMP with uncertain power requirement values considered here, due to some technical reasons,
it is not straightforward to apply the method described in (Bertsimas and Sim, 2003) and to represent the robust
counterpart model as a mixed integer linear programming formulation. Therefore, in this study, we present our
three-steps approach. The three-steps approach solves the problem by using a mixed integer linear programming
formulation and constructs an early topology in the first step; then, based on the early topology, estimates the
criticalities of the terminals in the second step; and reinforces the protections of the critical terminals against the
uncertainty in the third step. Since step one is equivalent to a classical approach used in practice (see, for example,
(Leggieri et al., 2008; Montemanni and Mahdabi, 2011)), the three-steps approach can be seen as an extension to
the classical approach, which adds two steps implementable as polynomial time procedures, therefore does not
change the complexity class of the overall method, and improves the robustness of solutions.
The structure of this paper is as follows: in section 2, the definition of the problem is made. In section 3, our
three-steps approach is described. Section 4 presents our experimental results. Section 5 provides further formulations
which can be used to validate the results found in the experiments. Conclusions are finally drawn in section 6.
Problem definition
Let us have a graph G = (V, A) where V is the set of nodes and A = {(i, j) | i, j V} is the set of arcs. Within the
graph G, each node i V represents a terminal of the network. Each arc (i, j) A represents a transmission link
between the terminals represented by the nodes i and j. To include terminal j within its coverage area (i.e. to be
able to transmit to terminal j), the transmission power spent by terminal i has to be at least the power requirement
value between terminals i and j. These power requirement values are denoted by rij | i, j V. The power require-
ment value for a terminal to reach itself is always set as 0 (i.e. rii = 0 i V ). The objective of MPMP is to decide a
transmission power i for each node i V in such a way that a message produced by the source terminal s V
can reach (directly or via multi-hop communications) the destination terminals D (V \ {s}), with the minimum
total cost . We say that terminal i reaches reaches terminal j when i rij. Notice that it is not necessary
to reach terminals which are not destinations (i.e., which are not in the set D). They can be however used as routers
to decrease the total transmission power spent over the network.
In this study, we consider that the problem has a stochastic behavior, having uncertain rij. When the uncertainty
is introduced into the power requirement values, rij are not numbers anymore, but they are intervals which represent
possible power requirement values which can be encountered. Therefore, for each (i, j) A, rij becomes .
It is assumed that the actual power requirement values can be any value from their intervals according to a uniform
probability distribution. A scenario being a realization where single power requirement values are picked from
their intervals, we define robustness as having as many destination nodes reached in as many scenarios as possible.
Therefore, we define the objective as a trade-off between the maximization of the scenarios in which the destination
nodes are reached and the minimization of the total transmission power of the network topology returned.
The three-steps approach
In this section, we introduce our three-steps approach. At the first step, the transmission links are decided by
mathematical programming, for which the formulations are widely available in the literature. Then, at the second
step, it decides which terminals are critical. In the final step, protection being the additional power spent to make
sure a connection is established, protections on the less critical nodes are decreased and the protections on the

NE Toklu and R Montemanni
113
more critical nodes are increased. The basic idea is to gain additional power from less critical nodes and use that
power to reinforce the critical parts of the network to have a more robust same-cost solution.
The behavior of the approach is configured by the decision maker, by using two parameters:
[0; 1], which is the reference protection ratio used for generating the basic structure of the network;
[0; 1] which is the minimum protection ratio that a node should at least have.
The reference protection value affects the solution cost (i.e. the total transmission power of the network). In
more details, as goes towards 1, the solution cost goes higher. Therefore, the parameter is used as a setting
the trade-off between cost and robustness. The parameter, which is a number less than , configures the behavior of
the three-steps approach during the adjustment of the protections on the nodes: it ensures that while the protections
of the critical nodes are increased, the less critical nodes still have some protection. The rest of this section describes each section in more details.
Step one
The purpose of this step is to have an early network topology by deciding the transmission links between the terminals.
In more details, in this step, we decide which terminals should transmit to which other terminals and which terminals
should not transmit at all. The latter steps will take these decisions as basis and then the final transmission powers
will be decided.
To have the early network topology, a mixed integer linear programming formulation is used. The formulation
is based on an adaptation of the network flow model proposed in (Montemanni and Mahdabi, 2011).
This step depends on , the reference protection ratio parameter which is given by the decision maker. By using
this reference protection value, a special scenario is constructed where all power requirement values are set as
and the mathematical model is executed on top of this special scenario.
We now define an array vi for each node i. Each destination node j of a node i is stored in v
i, where nodes are
sorted in a non-decreasing order according to . The first element of vi is always node i itself. To make the v
i
concept clear, we provide an example in Figure 3. In addition, when we say k-th destination of node i, we refer to
the node .
Fig. 3. A portion of an example instance. It can be seen that, according to the protection vaslue , the power requirement of
the arc (1, 2) is greater than the power requirement of the arc (1, 3) (i.e. ). Therefore, for node 1, we say v1 = {1, 3, 2}.
For the model, we define xik as the binary decision variable which tells whether the node i should configure its
transmission power enough to reach its k-th destination exactly. We also define yij as a variable which represents
the flow from node i to node j. These variables are used to enforce the connectivity of the network (see
(Montemanni and Mahdabi, 2011)). Using these variables, the model can be formulated as follows:

Journal of Applied Operational Research Vol. 4, No. 3
114
Constraints (2) impose that only one xik has to be set as 1 for each node i, so that one node will not be able to
have more than one transmission power level simultaneously assigned to it. Constraints (3) provide the connection
between x variables and y variables. Constraints (4) impose that the network flow indicated by variables y must
form an arborescence routed at s and reaching all the destination nodes in D. Constraints (5) and (6) specify the
domains of y and x variables, respectively.
After having solved the model above, we have the basic structure for our network, given by the xik variables of
the model. Also, an early decision about the transmission powers is made. We denote these transmission powers
as , and we define them as follows:
For each node i V we also define as the most distant node reached by i while transmitting at power
(this information will be used in step three):
We finally define the total transmission power C of the topology found during this step as follows:
Notice that the final network topology returned after step three (see Section 3.3) will not exceed C.
An interesting feature of the three-steps approach is that, while it is based on the mathematical programming
method presented above, the additional steps it introduces are actually independent from the formulations used.
This means that the first step is a component which can be chosen by the decision maker or the implementer
according to the factors like ease of implementation or the execution time required by the formulation. In addition
to alternative mathematical model formulations, it could be possible to plug heuristics too into the first step as
components. Such heuristic methods are widely available in the literature (Montemanni and Mahdabi, 2011;
Montemanni et al., 2005; Wieselthier et al., 2002). Using a heuristic for the first step, or combining the second
and third steps in another way with a heuristic and analyzing the effects on the results is left for future studies.

NE Toklu and R Montemanni
115
Step two
At the previous step, the basic structure of the network was decided and the early transmission powers were
prepared. At this step, the purpose is to estimate the criticalities of the nodes, so that the next step can adjust their
protections against uncertainty. The criticality of a node i is denoted by Ii, which is a non-negative real number. Ii
values mean higher criticalities, while Ii = 0 means that the criticality of node i is at minimum.
We now propose a scoring system where the idea is that when the probability to reach a destination terminal is
low, the terminals carrying data to that destination should be considered critical. The estimation of criticalities
can be done by recursively traversing from a source terminal, picking the most reliable paths leading to each
destination terminal (i.e. for each destination node d D, picking the path which has the largest probability to
reach d). Later, within each most reliable path P reaching a node d D, for each node i P, Ii is increased by 1
minus the probability of reaching the destination node d from the source s via the path P. The algorithmic listing
of this procedure is shown in Algorithm 1.
Although in experiments, the time consumed by Algorithm 1 was seen to be insignificant, it is classified as an
exponential-time procedure. Therefore, we propose an alternative procedure, which does the estimations in polynomial
time. For the polynomial-time procedure, we first introduce the concept of dependency. Assuming that the
transmission powers are and the power requirement values are , if node j receives data
from node i, we say node j depends on node i. Also, if node k receives data from node k, we say node k depends
on nodes i and j.

Journal of Applied Operational Research Vol. 4, No. 3
116
We now define the concept of critical dependency. If node j receives data from node i, but the connection (i, j)
fails in the worst case scenario, we say that node j critically depends on node i. In this situation, we also say that
node i weakly reaches node j. On the other hand, if the connection (i, j) is also established in the worst case scenario,
then we say that node j non-critically depends on node i and that node i strongly reaches node j. The formulations
of the queries for strongly or weakly reaching are as follows:
Now we define a function which returns a ratio indicating the quality of the connection between node i and
node j. If node j is reached strongly by node i, then the quality is 1, which is the maximum quality. If the transmission
power of node i, i.e. i is equal to the power requirement value imposed by the underlying scenario, i.e. , then
we say the quality is at minimum, therefore, 0. According to the position of i in the interval , we assign a
quality between 0 and 1. If node i can not reach node j, then there is no quality to assign. The calculation of
reaching quality is formulated as follows:
Now we define the polynomial-time procedure which estimates the criticalities of the nodes. Similar to the
procedure shown in Algorithm 1, the whole recursive criticality estimation process is started by calling the criticality
estimation function with the starting node argument s (i.e. the source node). After visiting node i, for each non-
visited reachable node j, the function calls itself with the starting node argument j. While visiting node j from
node i, if the connection (i, j) is critical, the function adds node i to the stack of critical dependencies. Also,
according to the reaching quality from i to j, the criticality values of each node in the stack are increased. In particular,
as the reaching quality for the visited node goes lower, the increasing amounts for the criticality values of the
nodes in the stack goes higher. If node j is a destination node, the criticalities are multiplied by a factor (chosen as
|V| after some preliminary tests), to express the importance of reaching a destination. In more details, if node i
weakly reaches node i' D and if node j weakly reaches node j' D; even if both nodes i and j are depended by
the same number of nodes (one weakly reached node for each), node i should be classified as more critical, because
the node it reaches is a destination node. Therefore, its criticality (and the criticalities of its dependencies) is multiplied
by |V|. When a node is done being traversed, it is removed from the critical dependencies stack, if it was there.
The function is summarized in Algorithm 2.

NE Toklu and R Montemanni
117
Since, the function estimate_criticalities marks each visited node and a marked node is not visited again, this
function is executed for |V| times. While visiting a node, the function scans for all other nodes to see which ones
are reachable. Therefore, this whole recursive process ends in O(|V|2) time. This shows that executing this procedure
is very fast in practice.
By using the polynomial-time estimation procedure, instead of the exponential-time one, we give up the guarantee
that the criticalities will be estimated according to the most reliable paths. This is because the polynomial-time
procedure visits each node once: it does not consider alternative paths and does not pick among them. According
to our experiments, there was no significant difference between the results of these two procedures.
The result of this step is the Ii values, each indicating the criticality of a node. These criticality values serve as
priority indicators for step three, during the adjustment of transmission powers.
Step three
The purpose of this step is to make the final decisions on the transmission powers. The idea of this step is that,
according to the criticality values provided by the second step, the critical nodes should be protected more against
the uncertainty, while the protections of the less critical nodes can be decreased. The additional constraints that
the total transmission power over the network can not exceed the cost upper bound C found in step one.
This step is expressed by a linear programming formulation, where the transmission powers i are variables,
while the criticality values Ii (defined in step two) and nodes (defined in step one) are constants. The formulation
is as follows:

Journal of Applied Operational Research Vol. 4, No. 3
118
The objective (13) states that the protections of the nodes against the uncertainty should be maximized, with
the priorities given to the critical nodes. The constraints (14) define the lower and upper bounds for the transmission
powers of the nodes, lower bounds stating that all terminals reached by terminal i in the reference scenario should
have at least the minimum protection imposed by . The constraint (15) imposes that the total power consumption
of the network can not exceed that of the solution retrieved in step one. The constraint (16) is a technical constraint
imposing that all transmission powers have to be real values.
It is important to stress that executing step three corresponds to solve the linear program described before. This
tasks can be accomplish in polynomial time (see (Karmarkar, 1984)), and therefore very quickly in practice.
Experimental results
The three-steps approach was implemented in C++, by using Gurobi 4.5 library for solving the mixed integer linear
programming formulations. To evaluate our three-steps approach, we compared its solutions to the early solutions
generated by the step one, which, by itself, is equivalent to a classical mathematical programming-based approach. In
rest of this section, we will refer to using step one alone as taking the classical approach.
The comparison of the two approaches is done by solving an example instance by using both the classical approach
and the three-steps approach, with the same value. Being given the same value, both approaches generate
solutions with the same solution cost. Finally, these cost-wise equivalent solutions are evaluated in terms of
robustness. The evaluation of a solution is done by testing it on 10000 randomly generated scenarios, where the
power requirement values are randomly picked from their intervals according to uniform probability distribution.
If, in a scenario, a destination node can not be reached from the source s (i.e. it is isolated because the connections
leading to it fail), then we call this situation a disconnection. If, in a scenario, there is at least one disconnection,
we call that scenario a flawed scenario. Based on this, for each scenario, the evaluation of a solution is done according
to how much in total disconnections occur on the destination nodes and how much of the scenarios are flawed.
For comparing the three-steps approach and the classical approach, instances were randomly generated. Given
that the number of nodes |V| and the number of destinations |D| are passed as arguments to the instance generator,
the following procedure is followed:
a 2-dimensional area with size 100x100 is prepared;
for each node, a random sized circle with a maximum radius R (R being a parameter), is generated;
for each looping arc (i, i), and are set as 0;
for each arc (i, j) with i j, becomes B added the minimum distance between the circles of nodes i
and j to the power of 4 and becomes B added the maximum distance between the circles of nodes i
and j to the power of 4, where B is the base transmitting cost, set as 1 in our experiments;
One of the nodes is declared as the source terminal and other |D| nodes are declared as destination terminals.
To sum up, the procedure above associates circles for each node assumes that the nodes are positioned within
the areas covered by those circles. Then, power requirement intervals are calculated according to the minimum
and maximum distances of those circles. By generating circles of random radius for each node, the situation of
having the same sized intervals for all rij is avoided.
Let us first analyze the solutions provided by both approaches according to =0.9 on a single instance. The
instance was generated by following the procedure above, with R=1, with 20 nodes and 10 destination nodes. The
NE Toklu and R Montemanni
119
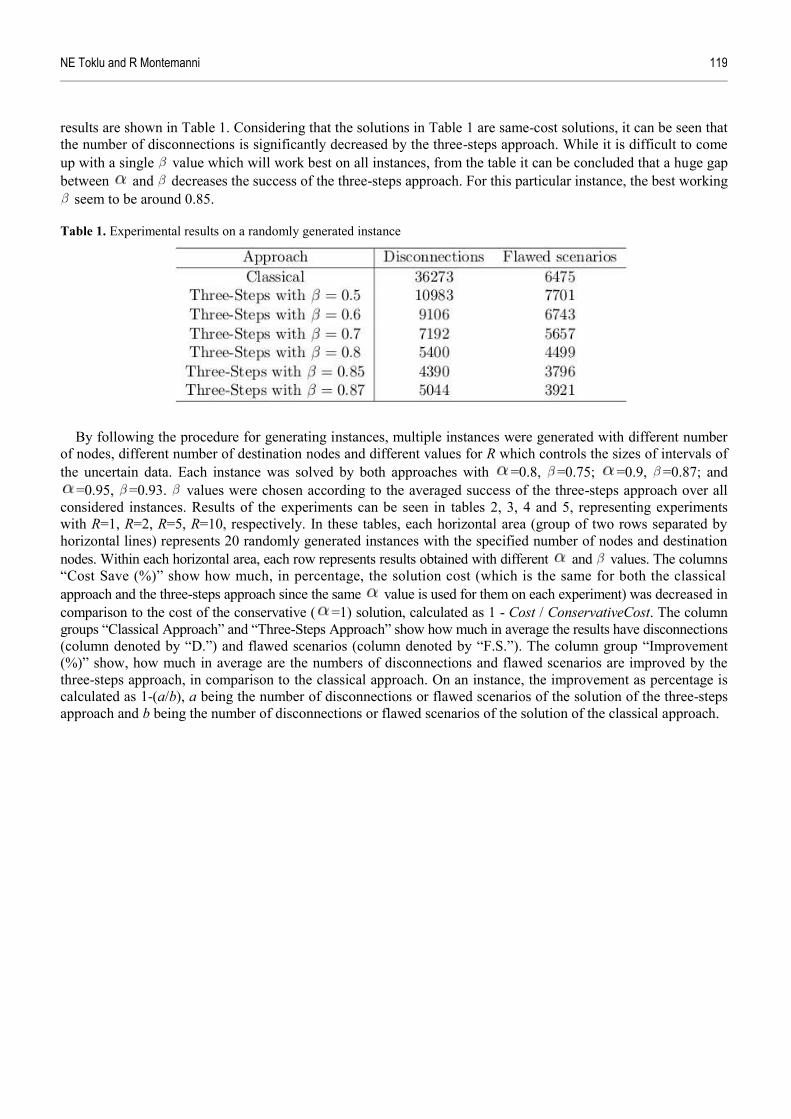
results are shown in Table 1. Considering that the solutions in Table 1 are same-cost solutions, it can be seen that
the number of disconnections is significantly decreased by the three-steps approach. While it is difficult to come
up with a single value which will work best on all instances, from the table it can be concluded that a huge gap
between and decreases the success of the three-steps approach. For this particular instance, the best working
seem to be around 0.85.
Table 1. Experimental results on a randomly generated instance
By following the procedure for generating instances, multiple instances were generated with different number
of nodes, different number of destination nodes and different values for R which controls the sizes of intervals of
the uncertain data. Each instance was solved by both approaches with =0.8, =0.75; =0.9, =0.87; and
=0.95, =0.93. values were chosen according to the averaged success of the three-steps approach over all
considered instances. Results of the experiments can be seen in tables 2, 3, 4 and 5, representing experiments
with R=1, R=2, R=5, R=10, respectively. In these tables, each horizontal area (group of two rows separated by
horizontal lines) represents 20 randomly generated instances with the specified number of nodes and destination
nodes. Within each horizontal area, each row represents results obtained with different and values. The columns
“Cost Save (%)” show how much, in percentage, the solution cost (which is the same for both the classical
approach and the three-steps approach since the same value is used for them on each experiment) was decreased in
comparison to the cost of the conservative ( =1) solution, calculated as 1 - Cost / ConservativeCost. The column
groups “Classical Approach” and “Three-Steps Approach” show how much in average the results have disconnections
(column denoted by “D.”) and flawed scenarios (column denoted by “F.S.”). The column group “Improvement
(%)” show, how much in average are the numbers of disconnections and flawed scenarios are improved by the
three-steps approach, in comparison to the classical approach. On an instance, the improvement as percentage is
calculated as 1-(a/b), a being the number of disconnections or flawed scenarios of the solution of the three-steps
approach and b being the number of disconnections or flawed scenarios of the solution of the classical approach.

Journal of Applied Operational Research Vol. 4, No. 3
120
Table 2. Experimental results on instances generated with R=1
Table 3. Experimental results on instances generated with R=2

NE Toklu and R Montemanni
121
Table 4. Experimental results on instances generated with R=5
Table 5. Experimental results on instances generated with R=10
The results in tables 2, 3, 4 and 5 show that, among the considered instances, the three -steps approach can
significantly reduce the number of disconnections most of the time. Improvements in the numbers of flawed scenarios
can also be observed. Interestingly, there were cases where the numbers of flawed scenarios were higher for the

Journal of Applied Operational Research Vol. 4, No. 3
122
three-steps approach than the classical approach, however, in most of such cases, the numbers of disconnections
were still reduced by the three-steps approach. This reflects into the average results as higher improvement
percentages for the number of disconnections, in comparison to the number of flawed scenarios. From the instance
groups where all nodes except the source are destinations, it can be seen that the three-steps approach can be applied to
broadcasting problems (in which the objective is to transmit to all nodes except the source node), in addition to
multicasting problems.
In the experimental results, it becomes visible that, with =0.8, the number of flawed scenarios increases
considerably for both the classical approach and the three-steps approach (despite the improvements it introduces
over the classical approach). The practical values for seems to be around or greater than 0.9. Also, it can be
seen that the flawed scenarios keep increasing with the size of the instance, when the same value for is considered.
Calculation of the flawed scenarios
In this section, we present formulations for estimating the number of flawed scenarios, to provide an alternative
to finding it by scenario sampling. A solution, generated by the classical approach, or the three-steps approach, is
a set of transmission power value for each terminal. According to these transmission power values, for each arc
(i, j), there is a probability to reach terminal j. In this section, we provide the formulations to calculate the probability
to reach all destination terminals d D from the source terminal s.
Let us first define the concept of important arcs. An arc is an important arc if it exists within a non-looping
path which starts from the source terminal s and reaches at least one destination terminal. The set of all important
arcs are denoted by A*.
Since, the arcs are probabilistic, depending on the scenario, different important arcs can be enabled or disabled.
Therefore, we define a configuration K A* as a set of important arcs, which represents the assumption that
each important arc (i, j) K can reach terminal j and each important arc (i', j') (A* \ K) can not reach j'. Now
we define a connective configuration as a configuration in which the arcs provide at least one path to each destination
terminal d D, from the source terminal s.
To estimate the number of flawed scenarios, first, all important arcs are identified. This can be done by following
all the paths from source terminal s to all destination terminals by using a recursive depth-first search.
After identifying all important arcs, each possible configuration K A* is listed and its probability is calculated.
For this purpose, we begin by formulating the function ProbArc(i, j) which calculates the probability for arc (i, j)
to reach terminal j:
By using the function ProbArc(i, j), now we can formulate the function to find the probability of a configuration as:
The probability of having all destinations reached, ProbFlawless, is then calculated as the sum of the probabilities
of all connective configurations:
The probability of having at least one destination terminal disconnected is ProbFlawed=1-ProbFlawless.
Among n trials of establishing connection, the number of flawed scenarios is finally estimated as n . ProbFlawed.
Estimating the flawed scenarios via mathematical means, this approach can be used to verify the correctness of
the sampling engine available. For this purpose, the numbers of flawed scenarios of the solutions of some randomly
generated instances were estimated by both sampling engine and the formulations presented in this section. The
results of these comparisons are shown in Table 6. The instances were generated with R=1, and solved by the
three-steps approach with parameters =0.9, =0.87. Within the table, under the column group “Estimated

NE Toklu and R Montemanni
123
flawed scenarios”, the column “Sampling” represents the estimations of the sampling engine, and the column
“Formulations” represents the estimations of the approach presented in this section. The column “Errors” represents
the error made by the sampling engine, in comparison to the estimations of the formulations, calculated as (a-b)/10000
where a is the result of the sampling engine, b is the result of the formulations and 10000 is the number of scenarios.
In the table, it can be seen that the absolute values of the errors made by the sampling engine are always below
1%. Therefore, the results of the sampling engine can be verified as close to the formulations.
Table 6. Flawed scenario estimations via the sampling engine and via the formulations presented in Section 5.
Conclusions
A three-steps approach was discussed for multicasting on wireless networks, which takes into account the uncertainty
on the power requirement values between the terminals.
The three-steps approach takes a classical mathematical programming approach as a base and adds two more
steps which make adjustments on the transmission powers on the nodes to make the network more robust. Therefore,
the three-steps approach can also be interpreted as a two-step addition to a classical mathematical programming
approach. These additional steps can be implemented as polynomial-time procedures, therefore the complexity
class of the approach is the same with the classical mathematical programming.
The experiments show that the additional two steps introduced by the three-steps approach can be useful in
improving the robustness of the solutions, compared to the classical mathematical programming approach.
Acknowledgments—N.E. Toklu was supported by the Swiss National Science Foundation through project 200020-140315/1: “Robust
Optimization II: applications and theory”. The authors would like to thank an anonymous referee for the valuable suggestions.
References
Babonneau F, Vial JP and Apparigliato R (2010). Handbook
on “Uncertainty and Environmental Decision Making”,
chapter Robust optimization for environmental and
energy planning, pages 97–126. Springer Verlag.
Ben-Tal A and Nemirovski A (1998). Robust convex optimiza-
tion. Mathematics of Operations Research, 23(4):769–805.
Ben-Tal A and Nemirovski A (2000). Robust solutions of
linear programming problems contaminated with un-
certain data. Mathematical Programming, 88:411–424.

Journal of Applied Operational Research Vol. 4, No. 3
124
Bertsimas D, Gamarnik D and Rikun AA (2010). Perfor-
mance analysis of queuing networks via robust optimi-
zation. Operations Research, 59(2):455–466.
Bertsimas D and Sim M (2003). Robust discrete optimiza-
tion and network flows. Mathematical Programming
Series B, 98:49–71.
Bertsimas D and Sim M (2004). The price of robustness.
Operations Research, 52(1):35–53.
Karmarkar N (1984). A new polynomial time algorithm for
linear programming. Combinatorica, 4(4):373–395.
Leggieri V, Nobili P, and Triki C (2008). Minimum power
multicasting problem in wireless networks. Mathemat-
ical Methods of Operations Research, 68:295–311.
Montemanni R, Gambardella LM and Das AK (2005). The
minimum power broadcast problem in wireless net-
works: a simulated annealing approach. In Proceedings
of IEEE WCNC 2005 - Wireless Communications and
Networking Conference.
Montemanni R and Mahdabi P (2011). A linear program-
ming-based evolutionary algorithm for the minimum
power broadcast problem in wireless sensor network.
Journal of Mathematical Modelling and Algorithms,
10(2):145–162.
Rappaport T (1996). Wireless Communications: Principles
and Practices. Prentice Hall.
Soyster AL (1973). Convex programming with set-
inclusive constraints and applications to inexact linear
programming. Operations Research, 21(5):1154–1157.
Wieselthier JE, Nguyen GD and Ephremides, A (2002).
Energy-efficient broadcast and multicast trees in wire-
less networks. Mobile networks and applications,
7(6):481–492.