isotope biogeochemistry: tracers of solutes or … · slides from carol kendall's usgs nitrate...
TRANSCRIPT

slides from Carol Kendall's USGS nitrate isotope course notes
class notes from April 28, 2007 1
California Groundwater Resources Association
“Isotope Methods for Groundwater Investigations” Short-course
March 28, 2007Concord, CA
( http://www.grac.org/isotope.asp )
Carol KendallUSGS, Menlo Park CA
This file contains the entire set of slides used for the nitrate isotope portion of the short-course – except for a few slides with unpublished
data.
ISOTOPE BIOGEOCHEMISTRY: Tracers of solutes or reactions
This part of the short course will focus on two specific kinds of applications:
tracing sources of nitrate, and
ecological applications.
Other major biogeochemical applications are tracing sources of organic contaminants, determining degradation reactions, and geochemical modeling – and there are a LOT of other kinds of applications, with all sorts of isotopes.

slides from Carol Kendall's USGS nitrate isotope course notes
class notes from April 28, 2007 2
For information about using isotopes to trace sources of nitrate and organic matter, I have several web-based seminars that can be accessed from the following URLs:
an informal presentation at the SJR DO TMDL technical working group (TWG) meeting in March 2006 about the status of our DO TMDL-related research: http://www.sjrdotmdl.org/meetings013.html(click on the Kendall link further down on the page).
a USGS seminar in May 2005 about tracing causes of hypoxia at: http://wwwrcamnl.wr.usgs.gov/wrdseminar/pastseminars2005.html(click on the Kendall link further down on the page).
a CUAHSI seminar in April 2005 about tracing sources of organics and nutrients in watersheds at: http://www.cuahsi.org/sem-archive.html (click on the Kendall link further down on the page).
a seminar about tracing agricultural contaminants with isotopesgiven at an EPA workshop on Animal Feeding Operations (AFOs) in December 2004 at: http://www.epa.gov/osp/regions/afo.htm (click on the Kendall link further down on the page).
On-line presentations
The nitrification and denitrification processes (from Havlin and others, 1999, p. 87, Pearson Education, Inc., Upper Saddle River, New Jersey).
Cartoon of agricultural sources and sinks of N

slides from Carol Kendall's USGS nitrate isotope course notes
class notes from April 28, 2007 3
Nitrate isotopesFrom
Kendall (1998)
The Nitrogen Cycle
This cartoon shows nitrogen transformation and processes affecting δ15N values in forest ecosystems. In general, all of these processes (arrows) cause isotope fractionation, with the lighter isotopes being
preferentially transferred into the products.
Nitrogen Cycle
Denitr
ificati
on
Each of these forms of N may have a different isotopic composition !
Assimilation OrganicN
Nitrification
NO3-
Remineralization
NH4+
N fixation
External Sources
N2N2O
External Sources(from Scott Wankel)

slides from Carol Kendall's USGS nitrate isotope course notes
class notes from April 28, 2007 4
Sources and sinks can often be identified, traced, and semi-quantified because:
nitrate derived from different sources and land uses often has distinctively different isotope compositions, and
different kinds of sinks can sometimes cause distinctive shifts in isotopic compositions.
In other words, different sources nitrate often have distinctive isotope “fingerprints” that can provide a better understanding of the system than just chemicaldata.
How do isotopes help trace sources of nitrate ?
There are 2 stable nitrogen isotopes (15N,14N).
There are 3 stable oxygen isotopes (18O,17O,16O).Ratios of 18O/16O are reported as δ18O.Ratios of 17O/16O are reported as δ17O.
The standard for N isotopes is Air – which is defined as 0.
The standard for O isotopes is V-SMOW – which is defined as 0.
Isotope Nomenclature

slides from Carol Kendall's USGS nitrate isotope course notes
class notes from April 28, 2007 5
Ranges of soil water δ15N values for different land uses
(Fogg et al., 1998)
δ15N
40
10
20
0
-10
30
Animal waste
NaturalFertilizer Septic
In most instances, NO3 derived from fertilizer (~ 0‰) can be distinguished from NO3 derived from animal and human waste (10-20‰).
aver
age
Expected ranges of δ18O and δ15N values of nitrate from different sources
mic
robi
al
nitr
ifica
tion
denitrification
These are the general ranges of values from many published studies.
Note the “trend line” for waters undergoing denitrification, with δ values increasing with extent of the reaction.
A complication: isotope fractionation during denitrification (and uptake and nitrification) all can confuse source signatures .…

slides from Carol Kendall's USGS nitrate isotope course notes
class notes from April 28, 2007 6
Isotopic FractionationIsotopic Fractionation (the changes in the isotopic compositions of materials because of processes) can make
different sources more distinctive or hide differences between sources.
How does this work? During biological processes (e.g., assimilation, nitrification, denitrification), the lighter isotope (14N) is concentrated in the products while the heavier isotope (15N) is concentrated in the residual reactants.
Example: during the reaction NO3 N2, the resulting N2 has a lower δ15N than the residual NO3.
The magnitude of the fractionation is dependent on a variety ofenvironmental conditions.
Biological fractionations can make it very difficult to identify sources and quantify mixing proportions.
The following slide is a cartoon showing how fractionation complicates interpretation…
Cartoon showing how denitrification can increase the δ15N value of residual NO3 derived from fertilizer, causing problems
for interpretations of sources of N
δ15N
NO3
Therefore, we often cannot easily distinguish between:
(1) a manure source and
(2) a fertilizer source that has denitrified to have the same δ15N as manure.
An example:
Solution: use a multi-isotope
approach

slides from Carol Kendall's USGS nitrate isotope course notes
class notes from April 28, 2007 7
Common microbial processes that may be expected to fractionate oxygen isotopes in NO3, leaving the residual NO3 enriched in 15N and 18O, include: assimilation (uptake), absorption/desorption, and denitrification. Of these three, there are limited data only on denitrification. Denitrification along a flowpath changes the δ18O and δ15N of residual nitrate in a distinctive manner, making the combined analysis of δ18O and δ15N of nitrate a powerful tool for recognizing denitrification. Nitrification also causes isotope fractionation.
There seems to be little information about possible O isotope exchange between water and nitrate. Many have speculated that NO3might behave somewhat like SO4, with slow exchange rates with water except at high temperatures and low pH values. Experiments in our lab and elsewhere show that nitrate only exchanges in really low-pH water. This needs further testing; however, the consistency of data from field areas argues against significant rapid exchange.
Processes causing fractionation of nitrate isotopes
The next few slides will discuss what is known about processes causing fractionation….
Changes in the δ15N of fertilizer during nitrification
After anhydrous ammonia is applied, the δ15N of soil nitrate first drops and then rises to higher than original values.
Volatization of ammonia causes the increasingly high δ15N values of soil ammonium and nitrate.
(Modified from
Feiginet al. 1974)
Hence, the δ15N of nitrate produced by nitrification of ammonium or urea fertilizers may be different than the original fertilizer, especially immediately
after fertilizer application.
Another example of how fractionation makes source determination more difficult

slides from Carol Kendall's USGS nitrate isotope course notes
class notes from April 28, 2007 8
Another example of fractionation – but in this case, it is useful and provides a way of tracing sources of NH4 :
The δ15N of NH4 derived from volatilization of NH3 from animal waste lagoons is very low compared to the δ15N of other N sources.
Nitrification of NH4 produces NO3 with a δ15N that is only about 0 to 2‰ higher than the δ15N of the NH4 (if most of the NH4 is nitrified).
Contributions of atmospheric N from NH3 emissions, or leakage of lagoon waste into groundwater or streams. can often be readily quantified using δ15N.
HogHog Waste in
LagoonMature Lagoon
δ15Nhog ≈
+3‰
δ15Nwaste ≈
+2‰
δ15NNH3 ≈
-15 to -25‰
Volatilization of NH3
δ15NNH4 ≈
+30‰
Lagoon Residual wastematuration
Extent of saturation
UnsaturatedSaturated
ConfinedConfined
UnconfinedUnconfined
AerobicAerobicAnaerobicAnaerobic
Aquitard
Denitrification
Denitrification
Oxygen-rich recharge
Nitrate &
Carbon source
Nitrate &
Carbon source
MicrobialMicrobial activity
activity
NO3 NO
2 N2
Aquitard
Extent of saturation
UnsaturatedSaturated
UnsaturatedSaturated
ConfinedConfined
UnconfinedUnconfined
ConfinedConfined
UnconfinedUnconfined
AerobicAerobicAnaerobicAnaerobic
Aquitard
Denitrification
Denitrification
Oxygen-rich recharge
Oxygen-rich recharge
Nitrate &
Carbon source
Nitrate &
Carbon source
Nitrate &
Carbon source
Nitrate &
Carbon source
MicrobialMicrobial activity
activity
NO3 NO
2 N2
Aquitard
Conceptual model of denitrification in a confined aquifer
(from Harry Beller, LLNL)
The presence of denitrification vastly complicates the use of nitrate isotopes to determine sources. The next several slides discuss several ways of dealing with this problem.

slides from Carol Kendall's USGS nitrate isotope course notes
class notes from April 28, 2007 9
How to distinguish mixing from denitrification?
1. Geochemical evidence of a reducing environment (e.g., low dissolved O2, high H2S, etc).
2. Analysis of the NO3 for δ18O as well as δ15N, to see if there is a systematic increase in δ18O with increase in δ15N and decrease in NO3, consistent with denitrification.
3. Hyperbolic vs exponential relationships between δ15N and NO3(i.e., mixing is a hyperbolic function whereas denitrification is exponential). Hence, if mixing of two sources is responsible for the curvilinear relationship between δ15N and NO3, plotting δ15N vs 1/NO3 will result in a straight line. In contrast, if denitrification (or assimilation) is responsible for the relationship, plotting δ15N vs lnNO3 will produce a straight line.
4. Analysis of dissolved N2 (produced by the denitrification of NO3) for δ15N, to show that there are systematic increases in the δ15N of N2 with decreases in NO3 and increases in the δ15N of NO3.
5. No change in ∆17O during a process that has δ18O and/or δ15N trends characteristic of denitrification (if material has ∆17O >0).
Besides just using water chemistry to determine if denitrification is POSSIBLE, analysis of some solutes for isotopic composition can help demonstrate (and perhaps even quantify) denitrification.
For example:
Where denitrification proceeds via the oxidation of organic carbon: 4NO3
- + 5CH2O + 4H+ 2N2 + 5CO2- + 7H2O ,
a decrease the increases in δ15N and δ18O should be accompanied by a decrease in δ13C of DIC.
If the electron donor is H2S instead of organic carbon:
14NO3- + 5FeS2 + 4H+ 7N2 + 10SO4
2- + 5Fe2+ + 2H2O ,
the δ34S of sulfate is likely to decrease – and the δ18O of the sulfate will probably also show a change (depending on the δ18O of the ambient water and O2).

slides from Carol Kendall's USGS nitrate isotope course notes
class notes from April 28, 2007 10
Problem: Denitrification increases the δ15N and δ18O values of nitrate from fertilizer, producing data that looks like there has
been mixing with a manure or septic source.
mic
robi
al
nitr
ifica
tion
denitrification
There are various other ways to detect whether there is enough denitrification to make it difficult to estimate mixing of different sources
– as shown in the next few slides….
Useful rule of
100 80 60% 40% 20%
It is difficult to see denitrification until the amount of NO3 has been reduced to about 80% of the original extent. Below are the approximate changes in δ values with decreases in NO3 %.
Use of δ15N and δ18O of NO3 for distinguishing mixing from denitrification
The proportions of the two original nitrate sources can be estimated by projecting back to the mixing line from the final composition of the mixed and denitrified nitrate (in purple).
This model assumes that the slope of the denitrification line is known (which seems to be a moderately good assumption in GW studies).
Modified from Kendall (1998)

slides from Carol Kendall's USGS nitrate isotope course notes
class notes from April 28, 2007 11
Analysis of nitrate for both δ15N and δ18O can help resolve the question of mixing vs denitrification as the source of the
high δ15N values
mic
robi
al
nitr
ifica
tion denitrification
Denitrification in groundwater causes a
characteristic slope for samples collection
along the reaction path
The main reason I put this slide here was that I thought this would be a good time to point out an interesting change in the δ18O values of precipitation nitrate on this type of plot in some publications – as shown on the next slide….
Typical pre-2005 plot of the different ranges of δ18O and δ15N values for sources
The main difference is the low values for δ18O of atmospheric nitrate: some recent studies have suggested that the previous values < 50‰ may be erroneous (contamination by organics, exchange with glass, etc).
Note that precipitation samples have δ18O values as low at +18‰. Is this change real or an artifact? This is not entirely clear yet.

slides from Carol Kendall's USGS nitrate isotope course notes
class notes from April 28, 2007 12
How to differentiate the curve (on plots of nitrate concentration vs δ15N) resulting from mixing of two nitrate sources, from the curve
resulting from denitrification
From
Ken
dall
(199
8)
The basic point is that mixing is a hyperbolic function whereas denitrification is exponential. Hence, if mixing of two sources is responsible for the curvilinear relationship between δ15N and NO3, plotting δ15N vs 1/NO3 will result in a straight line.
In contrast, if denitrification (or assimilation) is responsible for the relationship, plotting δ15N vs ln NO3 will produce a straight line.
Kinetic fractionation factors can be defined as:
αp-s = Rp/Rs
where Rp and Rs are the 15N/14N ratios of the product and substrate (reactant), respectively.
An isotope enrichment factor, ε, can be defined as:
εp-s = 1000 * (α - 1) .
Be aware that both α and ε values are defined in various ways by different authors. In the biological literature, these terms are commonly defined "in reverse" of normal usage to avoid using values of ε < 0, or α values < 1.
For example, the enrichment factor is sometimes defined in reverse (i.e., εs-p), fractionation factors are commonly defined in reverse (i.e., α = Rs/Rp), many use the relation β = 1/α so that β > 1, and some workers define a "discrimination factor" Ds/p = (αs/p -1)*1000 where s/p denotes substrate relative to products.
Terminology used to express isotope fractionations
It is important to remember that environmental conditions strongly affect kinetic (biological) fractionations, especially concentration of nitrate and which step of a reaction is the rate-determining one. If a rate determining step has minimal fractionation, the net reaction has little fractionation.

slides from Carol Kendall's USGS nitrate isotope course notes
class notes from April 28, 2007 13
Mixing lines can be distinguished from fractionation lines by making different kinds of plots
The curves on a plot of δ15N vs NO3 :(a) resulting from mixing of two sources of nitrate with different concentrations can be distinguished from the curves resulting from denitrification with two different fractionations by plotting δ15N vs ln NO3
(b) where different denitrification fractionations yield straight lines whereas mixing yields a curve, and by plotting δ15N vs 1/NO3
(c) where different denitrification fractionations yield curves whereas mixing yields a straight line.
From
Ken
dall
et a
l. (2
007)
δ15N
During denitrification, the δ15N value of the residual nitrate increases in proportion to the logarithm of the residual nitrate fraction. This can be expressed using the classical Rayleigh equation, that may be approximated in some situations (Mariotti et al., 1982) as:
δΡ = δRo + ε ln C/Co
where δR is the δ15N value of the reactant nitrate at time t, δRo is the initial δ15N value of the nitrate, C is the NO3 content at time t, Co is the initial NO3content, and ε is the enrichment factor (with ε < 0 to make the algebra work).
Since mixing and denitrification curves can be similar, data should also be plotted as δ15N vs. 1/NO3 (which will yield a straight line for mixtures of two sources), and δ15N vs. ln NO3 (which will yield a straight line for any process, like denitrification, which can be described using the Rayleigh equation --i.e., any exponential relation).
Under favorable circumstances, plotting data in this way can provide supporting evidence for the determination of whether mixing or denitrification has occurred (Mariotti et al., 1988), and can be used to estimate the enrichment factor and initial conditions.
Fractionation during denitrification

slides from Carol Kendall's USGS nitrate isotope course notes
class notes from April 28, 2007 14
In my opinion, the best way to quantify the extent of denitrification –and perhaps be able to quantify the mixing of sources of nitrate prior to denitrification – is to analyze the δ15N of the dissolved N2 gas in addition to analyzing nitrate and other isotopes in the water.
The idea is to determine how much of the N2 is derived from denitrification, apply a fractionation factor, and then back-calculate the original δ15N of the TOTAL original nitrate.
Gas samples are easy to collect, archive moderately well, and are not hard to analyze for δ15N. However, you must also have the gas analyzed for gas ratios, like N2/Ar or N2/Xe, to calculate how much of the N2 is “natural” – i.e., enters during recharge.
The next slides discuss this method of quantifying denitrification….
Changes in the δ15N of residual nitrate and produced N2 during denitrification
From
Ken
dall
(199
8)
This diagram shows how the δ15N of residual NO3 increases as low-δ15N NO3 is removed by denitrification to N2. Hence, the δ15N of the N2 continues to increase as the reaction progresses.
The different curves are for different Rayleigh fractionation factors.
start end

slides from Carol Kendall's USGS nitrate isotope course notes
class notes from April 28, 2007 15
Perhaps the first study showing GW denitrification using δ15N of NO3 and N2
The δ15N of the original NO3 can be calculated by:
(1) analysis of the δ15N of the N2 in the sample (which consists of both atmospheric N2 added during recharge plus N2 produced during denitrification), and
(2) “correcting” for the effect of the atmospheric N2 by use of ratios of other gases (Ar, Ne, etc) added during recharge.
Bohlke and Denver (1995) provides a nice discussion of the method.

slides from Carol Kendall's USGS nitrate isotope course notes
class notes from April 28, 2007 16
Bohlke (2002)
N2 concentrations, N2/Ar ratios, and δ15N of N2 in
groundwater can be used to calculate the δ15N of the
original nitrate prior to partial denitrification.
Reconstructed groundwater record of nitrate concentrations beneath agricultural land in coastal-plain sediments at the Locust Grove site in Maryland from about 1940 to 1992, based on analyses of samples collected in 1990–1992 (Böhlke and Denver, 1995).
GW is an archive of information about past fertilizer use
Bohlke (2002)

slides from Carol Kendall's USGS nitrate isotope course notes
class notes from April 28, 2007 17
Modified from Böhlke and Denver (1995).
Analysis of the δ15N of N2 and NO3, combined with water age-dating techniques:
(1) explains why different streams in an agricultural watershed in MD have different NO3 concentrations, and
(2) determines how long it will take for natural remediation processes to remove the fertilizer NO3 from groundwater.
This is the end of the discussion of denitrification.
Now let’s think about some of the other fractionating mechanisms …
What causes the range of δ18O of “terrestrial” sources of NO3 produced by microbial nitrification ?
mic
robi
al
nitr
ifica
tion
denitrification
This plot shows the typical range of δ18O values – but δ18O values > +20 ‰and < -10 ‰ are not unusual.

slides from Carol Kendall's USGS nitrate isotope course notes
class notes from April 28, 2007 18
Biochemical and bacteriological literature to date indicates that nitrate produced by microbial nitrification in laboratory cultures derives two oxygens from the oxygen in water molecules and one oxygen from O2.
If the oxygens are incorporated without any fractionation, then the *18O of microbial nitrate can be calculated (in theory!) if the *18O of water and O2are known, as shown below:
δ18O (NO3) = ⅔ δ18O (H2O) + ⅓ δ18O (O2) .
For waters with δ18O values in the normal range of -25 to +4‰, the δ18O of soil nitrate formed from in situ nitrification of ammonium, should be in the range of -10 to +10‰, respectively. For highly evaporated water (+20‰), the δ18O of nitrate could be as high as about +21‰ (Böhlke et al., 1997).
The above model makes four critical assumptions: (1) the proportions of oxygen from water and O2 are the same in soils as observed in laboratory cultures, (2) there are no fractionations resulting from the incorporation of oxygen from water or O2, (3) the δ18O of water used by the microbes is identical to that of the bulk soil water, and (4) the δ18O of the O2 used by the microbes is identical to that of atmospheric O2.
How nitrate produced by nitrification obtains its δ18O value
(a) The range of nitrate-δ18O values expected for microbial nitrification with ambient H2O-δ18Ovalues ranging from -25 to +4‰ (winter to summer precipitation values), and O2-δ18Ovalues ranging from that of the atmosphere (+23‰) to +60‰ for soil O2 fractionated by respiration.
(b) Microbial nitrification can produce a wide range of nitrate-δ18Oand -δ15N values; several scenarios for how these values might evolve over time are shown.
Kend
all (
1998
)
Causes of the wide range of δ18O values produced by nitrification

slides from Carol Kendall's USGS nitrate isotope course notes
class notes from April 28, 2007 19
Often it has been found that the δ18O of microbial NO3- is a few ‰ higher than
expected for the equation and assumptions above.
A variety of explanations have been offered for these high δ18ONO3 values including:
(1) nitrification in soil waters with higher than expected δ18O values because of evaporation (Böhlke et al. 1997) or seasonal changes in rain δ18O (Wassenaar 1995); (2) changes in the proportion of O from H2O and O2 sources (i.e., > 1/3 from O2) (Aravena et al. 1993); (3) nitrification using O2 that has a high δ18O due to respiration (Kendall 1998); (4) nitrification that occurs simultaneously via both heterotrophic and autotrophic pathways (Mayer et al. 2001).
At this time, it is still unresolved how each of these mechanisms affects δ18ONO3 during nitrification reactions. Another mechanism has been proposed for lower δ18O than expected: that during nitrification there is exchange between the O in nitrate and water (Casciotti et al., 2002).
Hence, nitrification of different materials (manure, waste, ammonium fertilizer) can get distinctive δ18O values if the δ18O of the ambient H2O and O2 are different. The δ18O of water is affected by its source and subsequent evaporative fractionation. The δ18O of O2 gas is affected by all the O-consuming reactions in the subsurface (nitrification, respiration, etc).
Measured δ18O values of NO3 in GW as a function of the:
(A) measured δ18O[H2O] of GW, and (B) measured δ15N[NO3] in GW.
Solid symbols represent samples unaffected by denitrification in the aquiferOpen symbols represent samples affected by denitrification in the aquifer.
(B) The lines indicate the range of fractionation trends reported for NO3reduction.
δ18O[NO3] = δ18O[O2-air]
δ18O[NO3] = 2/3 δ18O[H2O] +1/3 δ18O[O2-air]
δ18O[NO3] = δ18O[H2O]
McMahon & Bohlke (2006)
Nitrification controlled by δ18O of O2
Nitrification controlled by δ18O of H2O

slides from Carol Kendall's USGS nitrate isotope course notes
class notes from April 28, 2007 20
What about fractionation of nitrate during assimilation by bacteria or uptake by plants?Fogel & Cifuentes (1993) present an elegant model for ammonium assimilation in aquatic algae that predicts total fractionations of -4, -14, or -27 ‰ depending on whether algae cells are nitrogen limited, enzyme limited, or diffusion limited, respectively. However, for the low pH values and low NH4
+ concentrations common to soils and many aquatic environments, the model predicts that availability of N is the limiting condition and the transport of ammonium across cell walls is probably rapid, resulting in a small (< -4 ‰) overall fractionation.
More recently, Needoba et al. (2004) demonstrated that NO3- assimilation by marine phytoplankton imparts a large “apparent fractionation” (-13 to -6 ‰) depending on growth rate and conditions. Fractionations are higher at higher concentrations of nitrate.
While there have been few studies of the effects of O fractionations during assimilation on the δ18O of the residual NO3
-, nitrate assimilation by marine phytoplankton seems to cause ~1:1 changes in the δ15N and δ18O of nitrate, regardless of species or the magnitude of the isotope effect; hence, these fractionations can be viewed as strongly “coupled” (Granger et al. 2004).
Our studies in the Mississippi Basin (Battaglin et al., 2001a&b) and San Joaquin Basin (Kratzer et al., 2004) show δ15N fractionations of 4 – 8 ‰, as shown next….
0
2
4
6
8
10
12
14
16
0 5 10 15 20 25
Downstream Site Number
δ15N
δ15N POMδ15N NO3
Stan
isla
us R
.
Mer
ced
R.
Tuol
umne
R.
Sacr
amen
to R
.
DW
SC
Mos
sdal
e
Mud
Slo
ugh
Gol
den
Gat
e
NO3
POM
Ore
stim
baC
k. 4
2
0
POM in the River section is mostly algae, and its δ15N tracks the δ15N of nitrate (with fractionations of 2 - 8‰). POM and nitrate patterns in the
Delta are weird because of the WWTP source inputs. The lower fractionations (1-3‰) in the Bay are due to the lower amounts of NO3.
Bay Delta River
Nitrate-N
(mg/L)
These data suggest that the δ15N of algae (and algal POM) can sometimes be a useful proxy for changes in the δ15N of nitrate.

slides from Carol Kendall's USGS nitrate isotope course notes
class notes from April 28, 2007 21
Now some examples of successful applications of nitrate isotopes.
How can nitrate isotopes (nitrate δ15N and δ18O) help determine the dominant source of nitrate?
mic
robi
al
nitr
ifica
tion
denitrification
Nitrate isotopes are particularly useful for distinguishing:
(1) atmospheric from terrestrial sources, and
(2) fertilizer from manure/septic waste.

slides from Carol Kendall's USGS nitrate isotope course notes
class notes from April 28, 2007 22
(from Kendall 1998; Campbell et al. 2002)
Use of δ18O of nitrate to quantify relative proportions of microbial vs atmospheric nitrate during snowmelt in
streams in small forested watershedsat
mos
pher
icm
icro
bial
These data are from Loch Vale (CO) and show that <50% of the nitrate in streamwater is derived from the melting snowpack in 1995.
(from Silva et al., 2002; Kendall, 1998)
Seasonal contributions of atmospheric NO3 (from overland flow) and sewage in urban streams in Austin TX
During stormflowconditions, most of the nitrate in these urban streams is derived from atmospheric nitrate.
During baseflow conditions, the nitrate comes from a mixture of sources dominated by human/animal waste.

slides from Carol Kendall's USGS nitrate isotope course notes
class notes from April 28, 2007 23
Surface water nitrate in the Mississippi River Basin has higher δ18O and lower δ15N values than nitrate in the San Joaquin Basin
Mississippi River Basin (Chang et al., 2002)
San Joaquin River Basin (Kratzer et al., 2003)
NE USA rivers, (Mayer et al., 2002)
denitrification
atmospheric nitrate appears to be a significant source in urban and forested catchments, for small and large watersheds
Seiler (2005)
Mixing lines of wastewater nitrate and background nitrate, plus denitrification, can explain much of the variation in δ15N.
Fertilizer mixing line
Wastewater mixing line
Sources of nitrate in groundwater in Northern Nevada
Soil NO
3

slides from Carol Kendall's USGS nitrate isotope course notes
class notes from April 28, 2007 24
0
20
40
60
80
100
120
140
160
180
200
0 2 4 6 8 10 12 14 16 18 20
Transect Location
Lower South Bay
SuisunBay
San Pablo Bay
South Bay
Central Bay
0
2
4
6
8
10
12
14
16
0 2 4 6 8 10 12 14 16 18 20
Transect Location
-10
-5
0
5
10
15
0 2 4 6 8 10 12 14 16 18 20
Transect Location
δ18O
of N
O3
δ15N
of N
O3
NO
3 (u
M)
What is the source of nitrate in the Lower South Bay and what is the relationship between it and nitrate elsewhere in the rest of the Bay?
The data are 3-point moving averages.
There is considerable spatial variability, both N to S and from shallow to deep waters.
EastSouth West
(modified from Wankel et al., 2006)
Example of using boron isotopes to distinguish between thermal and wastewater sources of boron.
By plotting δ11B vs 1/B mixing lines can be determined.
(from Barth, 2000)
Boron has two naturally occurring stable isotopes, 10B and 11B, with relative abundances of about 20% and 80%, respectively.
The large relative mass difference between the boron isotopes leads to a wide range in δ11B values (~90 ‰).

slides from Carol Kendall's USGS nitrate isotope course notes
class notes from April 28, 2007 25
Advantages and disadvantages of Nitrate and Borate Advantages and disadvantages of Nitrate and Borate isotopesisotopes
δ15N NONO33: intrinsic molecule: intrinsic molecule
δ11B CoCo--migrant of the NOmigrant of the NO33 moleculemolecule
•• Useful for determining mixing processes.Useful for determining mixing processes.
•• Isotopic fractionation by natural denitrification.Isotopic fractionation by natural denitrification.
•• Useful for determining mixing processes.Useful for determining mixing processes.
•• NotNot affected by natural denitrification.affected by natural denitrification.
•• Isotopic fractionation by adsorption/desorptionIsotopic fractionation by adsorption/desorption
on clay mineralson clay minerals
From Dave Widory
Isotopic characterization of pollution sources
Widory et al. (2004)
• δ15N mainly discriminates fertilizers from sewage and animal manure.
• δ11B mainly discriminates animal manure from sewage and fertilizers.
• The combination allows differentiation of sewage vs manure.

slides from Carol Kendall's USGS nitrate isotope course notes
class notes from April 28, 2007 26
Analysis of δ15N and δ11B to determine sources of GW pollution in France
From Dave Widory
• Same non-polluted end-member.
• Identification of at least 2 pollution sources.
Boron isotopes
Nitrogen isotopes• 1 non-polluted end-member.• No natural denitrification so nitrogen is controlled by mixing processes.• Identification of at least 2 pollution sources.
The δ15N-NO3 in the minor tributaries (except for Westport Drain) does not account well for the δ15N-NO3 in the SJR
2001
02468
1012141618
δ15N
-NO
3
Vernalis Laird Crows above Merced
Mud
Lonetree Cr.Hospital Cr.
Dry Cr.Westport Drain
Spanish DrainOrestimba Cr.
Stanislaus R. Tuolumne R. Merced R.downstream
Therefore, the agricultural drains and minor tributaries are not significant sources of nitrate.
Fert
ilize
r & s
oil
was
teK
ratzeret al. (2004)

slides from Carol Kendall's USGS nitrate isotope course notes
class notes from April 28, 2007 27
-10
0
10
20
30
40
50
60
70
80
90
100
-15 -10 -5 0 5 10 15 20 25 30 35 40nitrate - δ15N
nitr
ate
- δ18
O
manure & septic
waste
NH4 in fertilizer and rain
NO3 inprecipitation
NO3 fertilizer
soil N
San Joaquin River and Mud Slough
Minor tributaries
Much of the nitrate in San Joaquin River samples appears to be derived from a manure or septic source
Many small dairies line the river…
A new study is investigating possible contamination of GW from dairies
What is the main source of nitrate to the SJR river?
denitrification
Kratzeret al. (2004)
Seasonal changes in the nitrate concentrations and isotopic compositions
NO3
What is the cause? Dilution? Changes in sources? Uptake by algae?

slides from Carol Kendall's USGS nitrate isotope course notes
class notes from April 28, 2007 28
What is causing this seasonal shift in nitrate concentration? The isotope data suggest that it is caused by a seasonal
change in the amounts of 2 different nitrate sources.
Seasonal shift from a low-NO3 source with high δ values in the summer, to a high-NO3 source with low δ values in the winter.
Kendall (unpub. data)
Extreme values (ie, end-members) of samples from the Wabash River
Mississippi River samples
What is causing this seasonal shift in nitrate concentration?
Probably a seasonal mixing of nitrate derived from manure and nitrate from nitrification of soil organic matter
Could these data indicate denitrification? Probably not (because of the slope and because other ways of modeling the data do not support this explanation).
Note this is a pre-2005 plot w
ith pptw
ith low d18O
values

slides from Carol Kendall's USGS nitrate isotope course notes
class notes from April 28, 2007 29
average values for the 16 basins are plotted; these fall into three groups
Relation between δ15N and δ18O in major rivers in the northeastern USA
from Mayer et al. (2002)
δ15N of nitrate
δ18O
of n
itrat
e
There is another reason to be skeptical about interpreting the data as denitrification when river nitrate data plot along what appears to be a denitrification line: the fact that “benthic denitrification” appears to have little or no N or O fractionation.
The extent of fractionation during denitrification is highly dependent on environmental conditions. Authors have distinguished between “benthic”denitrification in which NO3
- diffuses into the anerobic groundwater from a surficial aerobic environment before denitrification can occur, and “riparian”denitrification where there is partial conversion of the nitrate in the anaerobic groundwater (Sebilo et al. 2003).
The apparent fractionation associated with benthic denitrification is small (ranging from -1.5 to -3.6 ‰), because NO3
- diffusion through the water-sediment interface, which causes minimal fractionation, is the rate determining step. In contrast, riparian denitrification causes a much larger fractionation (about -18 ‰; Sebilo et al. 2003).
IMPORTANT POINT: If the rate determining step of a reaction has minimal fractionation, the net reaction has minimal fractionation.
Next slide is a cartoon that shows benthic vs riparian denitrification….

slides from Carol Kendall's USGS nitrate isotope course notes
class notes from April 28, 2007 30
δ15N
δ15N
(mod
ified
from
Seb
iloet
al.,
200
3)
Cartoons showing how benthic denitrification (occurring in anoxic sediments of rivers) would cause little or no enrichment in 15N whereas riparian (GW) denitrification would cause large enrichment.
The reason why benthic denitrification causes minimal fractionation is because diffusion of nitrate into the anoxic sediments is the rate determining step and it has minimal fractionation.
Do different anthropogenic sources of atmospheric nitrate (from NOx and NHy) have distinctive δ15N, δ18O, and/or δ17O values?
mic
robi
al
nitr
ifica
tion
denitrification

slides from Carol Kendall's USGS nitrate isotope course notes
class notes from April 28, 2007 31
Where does atmospheric nitrate come from?
• Natural processes (fire, lightening, soil emissions)
• Agricultural emissions
• Power plant exhaust
• Vehicle emissions
Two major NOx sources can have different isotopic signatures (Heaton, 1990).
δ15NNOx = +6 to +13‰
δ15NNOx = -13 to -2‰
Example of how mass dependent and non-mass dependent fractionations affect nitrate δ18O and δ17O
Modified from Michalski et al. (2002)
Atmospheric NO3 is labeled by its δ17O and δ18O values
All terrestrial-derived samples plot along the terrestrial line, showing the normal mass dependent relation between δ18O and δ17O.
In contrast, atmospheric-derived samples plot above the terrestrial line because of the non-mass dependent relation between δ18O and δ17O in O3 in the troposphere.

slides from Carol Kendall's USGS nitrate isotope course notes
class notes from April 28, 2007 32
Relations between δ18O and δ17O values:
In all terrestrial materials, there is a constant relation between the δ18O and δ17O values of any given substance because isotope fractionations are mass dependent.
The mass dependent fractionation results in:
δ17O = 0.52 (δ18O)
In many oxides derived from high atmospheric processes there “excess 17O” (beyond the 17O expected from the 18O value) derived from a mass independent fractionation (MIF) such that:
∆17O = δ17O - 0.52 (δ18O)
Hence, ∆17O values > 0‰ are a useful tracer of O derived from atmospheric processes.
Origin of the high δ18O and δ17O values of atmospherically derived NO3
NO generated by combustion, biomass burning, or biological emissions is eventually oxidized to NO2 by several reactions. One such reaction is:
NO + O3 NO2 + O2 (this O3 has high δ18O and δ17O values)
The NO2 is then photolyzed back to NO, and is the primary source of troposphere O3:
NO2 + hv NO + O O + O2 O3
The NO is then re-oxidized to NO2 etc etc. Eventually NO2 is removed by several “sink” reactions. For example:
NO2 + OH HNO3
Nitric acid can then react to form nitrate:
HNO3 + NaCl NaNO3 + HCl
slides from Carol Kendall's USGS nitrate isotope course notes
class notes from April 28, 2007 33
So why is ∆17O so exciting to isotopists?
1. ∆17O values provide a very persuasive indicator of an atmospheric source for the compound (i.e., nitrate, sulfate, etc) with the O.
2. δ17O provides an additional tracer for nitrate, meaning that we can solve for an additional source or process term.
3. ∆17O is NOT affected by any terrestrial fractionating process (e.g., denitrification).
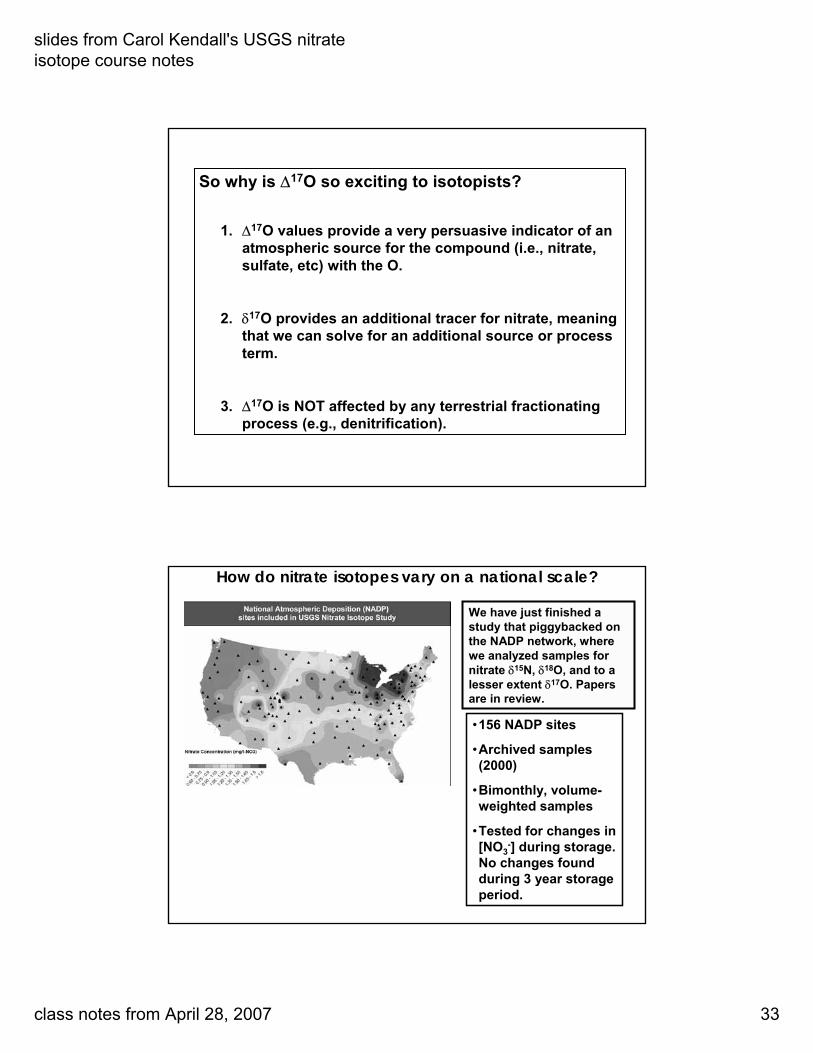
How do nitrate isotopes vary on a national scale?
•156 NADP sites
•Archived samples (2000)
•Bimonthly, volume-weighted samples
•Tested for changes in [NO3
-] during storage. No changes found during 3 year storage period.
We have just finished a study that piggybacked on the NADP network, where we analyzed samples for nitrate δ15N, δ18O, and to a lesser extent δ17O. Papers are in review.

slides from Carol Kendall's USGS nitrate isotope course notes
class notes from April 28, 2007 34
NEXT:
A brief review of several potential applications of isotopes to tracing agricultural pollution (and solving agricultural problems) – with my opinions about whether the applications are:
easily usable tools (i.e., “ready for prime time”), or that they still need more research;
under what conditions do the tools work best,
what additional isotope and chemical tracers appear to be beneficial for the application, and
selected examples.
For more information, see the list of references.
Tracing sources of agricultural N using isotopic techniques:
the state of the science
(from materials prepared for an EPA-sponsored workshop on AFOs, December 2004, College Park MD.
http://www.epa.gov/osp/regions/afo.htm

slides from Carol Kendall's USGS nitrate isotope course notes
class notes from April 28, 2007 35
Why is this?Perhaps because one of the first attempts to use natural abundance 15N to understand the causes of the increases in nitrate concentrations in surface waters in many agricultural areas (Kohl et al., 1971, Science) elicited a hyper-critical response by 10 prominent soil scientists and agronomists (Hauck et al., 1972, Science), which concluded that use of 15N was a “questionable approach.”
While stable isotopes have become common tools for tracing sources of waters and solutes in small watersheds, they are currently under-utilized in larger basins, especially in agricultural and urban rivers.
Current Isotopic Tools for Agricultural Pollution Studies
• Nitrate: analyzed for δ15N and δ18O (and sometimes for δ17O).
• POM (particulate organic matter): filtered, acidified, and analyzed for δ15N and δ13C (and sometimes for δ34S).
• Water: analyzed for δ18O and δ2H.
• DIC (dissolved inorganic carbon): analyzed for δ13C.
• DOC (dissolved organic carbon): analyzed for δ13C.
Some even newer tools: B, Li, Sr, U isotopes
• DON (dissolved organic nitrogen): analyzed for δ15N.
• Ammonium: analyzed for δ15N.
• Phosphate: analyzed for δ18O.
• Sulfate: analyzed for δ34S (and sometimes for δ18O and δ17O).
• O2 (DO = dissolved oxygen): analyzed for δ18O.

slides from Carol Kendall's USGS nitrate isotope course notes
class notes from April 28, 2007 36
NEXT:
A brief review of several potential applications of isotopes to tracing agricultural pollution (and solving agricultural problems) – with my opinions about whether the applications are:
easily usable tools (i.e., “ready for prime time”), or that they still need more research;
under what conditions do the tools work best,
what additional isotope and chemical tracers appear to be beneficial for the application, and
selected examples.
For more information, see the list of references.
Fertilizer vs animal waste source of nitrate: nitrate-δ15N
Tool usually works.
(Fogg et al., 1998)
δ15N
40
10
20
0
-10
30
Animal waste
NaturalFertilizer Septic

slides from Carol Kendall's USGS nitrate isotope course notes
class notes from April 28, 2007 37
In this case, quantification can be successful if …
the effects of denitrification can be estimated using:
analysis of dissolved N2 for δ15N (to correct for the N2 produced by denitrification),
nitrate-δ18O (this tracer usually is not as useful for this purpose as N2-δ15N); and
geochemical modeling using chemical data and perhaps DIC-δ13C, SO4-δ34S, 87Sr/86Sr, etc.
use of all 3 methods, along with age-dating of the water using CFCs or 3He/T, will improve quantification of source contributions.
Fertilizer vs animal waste source of nitrate: nitrate-δ15N
Tool often works. But it is more costly if the soils are clayey or the groundwater is not well-oxygenated, so that significant denitrification is suspected.
What about use in rivers, streams, and wetlands?
This can provide semi-quantitative to quantitative estimates of contributions in streams and rivers if:
denitrification in the riparian zone and/or hyporheic zone can be ruled out or quantified,
nitrate from soil organic matter is insignificant (or its δ15N is similar to fertilizer),
uptake of nitrate by phytoplankton is minimal (or data are adjusted for this fractionation),
nitrification in the stream is minimal (or data are adjusted for this fractionation).
Fertilizer vs animal waste source of nitrate: nitrate-δ15N
Tool often works.
But may require a fair amount of biogeochemical and hydrologic data.
or … use other chemical and/or isotopic tracers (e.g., nitrate-δ18O or POM-δ15N/δ13C/δ34S) in addition to nitrate-δ15N.

slides from Carol Kendall's USGS nitrate isotope course notes
class notes from April 28, 2007 38
The N isotope fractionation between NO3 and POM is dependent on NO3concentration, and varies from ~ 0 ‰ in the Bay when NO3 is low, to ~ 4 ‰ in
the SJR and Delta when NO3 is high.
The data are consistent with algae mainly growing in the SJR in contact with the observed nitrate
0
2
4
6
8
10
12
14
16
0 2 4 6 8 10 12 14 16 18 20 22 24 26
Site Number
15N
0
5
10
15
20
[NO
3]
[NO3]
nitrate δ 15N
POM δ 15N
Bay Delta SJR and tribs
4
3
2
1 NO
3-N
(mg/
L)
downstream
nitrate δ15N
POM δ15N
[NO3]
Transect in October 2002San Francisco Ecosystem Restoration Program
(Kendall and Silva, unpub.)
Soil vs animal waste source of nitrate: nitrate-δ15N
Tool often works.
(Fogg et al., 1998)
δ15 N
40
10
20
0
-10
30
Animal waste
NaturalFertilizer Septic
But…

slides from Carol Kendall's USGS nitrate isotope course notes
class notes from April 28, 2007 39
Soil vs animal waste source of nitrate: nitrate-δ15N
Tool often works…But sometimes does not work because soil nitrates can be quite variable in δ15N and sometimes overlap the δ15N values of animal manure. More likely to work with pigs than other animals because pig waste from lagoons usually has a much higher nitrate-δ15N.
Quantification using only nitrate-δ15N can be successful if:
the groundwater is well-oxygenated, the soils are sandy instead of clayey, so denitrification can be ruled out,
nitrate from soil organic matter is insignificant (or its δ15N is similar to fertilizer), and
nitrates from representative source areas (under the fields, feedlots, manure lagoons, septic fields, etc) are analyzed to insure that the nitrate-δ15N values of possible sources are a few ‰ different.
Do you need nitrate-δ18O?
No …
but it probably would help improve the quantification if there is some difference in
the water-δ18O of soil water vs groundwater or lagoon water, or
in the O2-δ18O in the soil zone or groundwater;
these instances are not uncommon).
Therefore, obtaining nitrate-δ18O is recommended.
Soil vs animal waste source of nitrate: nitrate-δ15N
Tool often works.

slides from Carol Kendall's USGS nitrate isotope course notes
class notes from April 28, 2007 40
from Mayer et al. (2002)
Positive correlation of δ15N and land use in major river basins in NE USA
The increase in δ15N is usually attributed to increased nitrate from waste but an alternative explanation is increased denitrification of nitrate at larger scales.
Septic waste vs animal manure: nitrate-δ15N
Tool usually does NOT work using only nitrate-δ15N.
(because the nitrate-δ15N values are usually overlapping).
But…

slides from Carol Kendall's USGS nitrate isotope course notes
class notes from April 28, 2007 41
Septic waste vs animal manure: nitrate-δ15N
Tool usually does NOT work using only nitrate-δ15N.
(because the nitrate-δ15N values are usually overlapping).
However, these types of waste can sometimes be distinguished if:
the average diets of the humans and animals are at different trophic levels,
nitrate-δ18O values of the wastes are different,
other isotope tracers that are specific for the different sources are used (B, Sr, S, C, Li, U),
other chemical tracers that are specific for the different sources are used (caffeine, pharmaceuticals, K, REEs, heavy metals, etc).
See example of usefulness of K for distinguishing septic vs poultry waste …
The use of 2 tracers (K plus δ15N of NO3) did a better job of distinguishing sources of nitrate from five source categories than the use of δ15N alone
Spruill et al 2002 (JEQ)
K p
lus
δ15N
δ15N

slides from Carol Kendall's USGS nitrate isotope course notes
class notes from April 28, 2007 42
Nitrate from waste from different kinds of farm animals:
Tool maybe will work.There have been several very recent, very promising studies in Europe. We are investigating this in the US as parts of collaborations with Harter (UCD) and Hutchins (EPA).
Therefore, semi-quantification of contributions of nitrate derived from different kinds of farm animals might be possible if:
nitrate-δ15N and nitrate-δ18O are not expected to provide clear separations without the combined use of other tracers,
other isotope tracers that are specific for the different sources are used (B, Sr, S, C, Li), and/or
other chemical tracers that are specific for the different sources are used (caffeine, pharmaceuticals, REEs, heavy metals, etc).
Widory et al. (2004)
δ15N, δ11B, and 87Sr/86Sr characterization of the NO3 sources present in the watersheds in France show that different kinds of animals have different isotope “signatures”

slides from Carol Kendall's USGS nitrate isotope course notes
class notes from April 28, 2007 43
Why do different kinds of animal waste-derived nitrate have different B-Li-S-Sr-U isotopic signatures?
Mostly because of different sources of washing materials (for B, S, and maybe Sr) used for people vs AFOs (that result in differences in septic waste/WWTPs vs waste lagoons/spraying.
Perhaps also because of different food additives. Li might be useful because pharmaceutical-grade Li has very high (or sometimes very low 7Li) because of the nuclear processing industry.
Phosphate from fertilizer vs animal waste/septic waste vs soil organic matter: phosphate-δ18O:
Tool maybe ready for use (needs further study).
There have been a few recent and very promising studies of phosphate sources using various isotope tracers.
U isotopes: Uranium is a trace constituent of geologic sources of phosphate. Hence, analysis of 234U and 238U can distinguish between “natural” and “geologic” sources.
Sr isotopes: Strontium is a trace constituent of geologic sources of phosphate. Different sources of geologic phosphate (phosphorites vs carbonatites) appear to have different concentrations of trace metals and REEs; hence, these can be used as tracers of phosphate and/or fertilizer source.
All of these isotope tracers will provide more quantitative information if they are combined with other isotope and chemical tracers.

slides from Carol Kendall's USGS nitrate isotope course notes
class notes from April 28, 2007 44
New isotope tool: the New isotope tool: the δδ1818O of phosphate (POO of phosphate (PO44))
P has only 1 stable isotope so it cannot be used as a natural isotopic tracer. However, the O atoms bound to the P are potentially useful tracers of P sources and sinks.
Since the P-O bond in phosphate is resistant to inorganic hydrolysis, δ18O of phosphate may be used as a tracer of phosphate sources and cycling under certain conditions.
P
O
O O
O
OO
O
O
OH H
New isotope tool: the New isotope tool: the δδ1818O of phosphate (POO of phosphate (PO44))However, if phosphate is limiting and is actively cycled, δ18O of phosphate rapidly equilibrates with water-δ18O during ATP-ADP cycling within the cells.
Therefore, PO4-δ18O is usually only a usable tracer in systems with excess PO4 where the waters associated with the two sources (e.g., waste vs natural) have δ18O values that are different by several ‰.
After equilibration, the δ18O of PO4 is 20‰ higher than the water. So if the water in a WWTP or manure lagoon is highly evaporated and has a δ18O that is 5 ‰ higher than the local drinking water, then the δ18O of the PO4 from the evaporated WWTP or lagoon is also (in theory) 5 ‰ higher than the PO4 that equilibrated with the local water.

slides from Carol Kendall's USGS nitrate isotope course notes
class notes from April 28, 2007 45
Main water management applications:
PO4-δ18O should be very useful for near-shore investigations of sources of PO4 to the marine ecosystems where the suspected sources are WWTPs, AFOs, upwelling marine waters, and other sources.
PO4-δ18O is also likely to be useful in any location where there is evaporative enrichment of water-δ18O in a lagoon, or locations where the public supply water is from a much different geographic location or elevation than the local soil water or groundwater.
New isotope tool: the New isotope tool: the δδ1818O of phosphate (POO of phosphate (PO44))
0
1
2
0 10 20 30
Salinity (psu)
[SR
P] u
M
-15
-5
5
15
25
0 10 20 30Salinity (psu)
δ18O
North Bay Transect, October 2002
waternitrate
phosphate
Anomalous site near mouth of Napa River
Question: what is the cause of the variability in P concentrations along the salinity gradient ?
Poor mixing of stratified waters?
Local point sources?
Example of a high-P source
Mclaughlin et al. (2005)

slides from Carol Kendall's USGS nitrate isotope course notes
class notes from April 28, 2007 46
October January June August
25000
20000
15000
10000
5000
0
20
16
12
8
4
0
Nap
a R
iver
Dis
char
ge (
ft3 /
s)
δ18O
ph
osp
hat
e(‰
)
The anomalous site deviates from the simple mixing relation when Napa River discharge is greatest
Modified from McLaughlin et al., 2005
Organic matter from animal waste vs human waste:
Tool often works.
Quantification of waste from human vs animals can be successful if:
analyzed for δ15N and/or δ13C of the organic matter (using both is best, and adding δ34S can help),
the average diets of the humans and animals are at different trophic levels (i.e., one group is herbivorous), and/or
one group eats a diet based on C3 plants, and the other eats a diet primarily based on C4 plants (corn and sugar cane are the main C4 crops);
other isotope tracers that are specific for the different sources are used (B, Sr, S, C, Li, U),
other chemical tracers that are specific for the different sources are used (caffeine, pharmaceuticals, K, REEs, heavy metals, etc).

slides from Carol Kendall's USGS nitrate isotope course notes
class notes from April 28, 2007 47
Quantification of sewage contributions to coastal sediments
Isotopic compositions of fingernails as a proxy for diet
Nar
doto
et a
l. (2
006)
7.0
7.5
8.0
8.5
9.0
9.5
10.0
10.5
11.0
11.5
12.0
-22.0 -21.0 -20.0 -19.0 -18.0 -17.0 -16.0 -15.0 -14.0 -13.0 -12.0
δ13C (‰)
δ15N
(‰)
Vegetarians (USA)
Omnivores (Brazil)
Omnivores (USA)
Vegetarians (Brazil)
Me
Therefore, the isotopic composition of DOM and POM in water is likely to be a useful tracer of source of the organics (human vs different animal types). I will discuss this in more detail in the “Ecological applications” section….
slides from Carol Kendall's USGS nitrate isotope course notes
class notes from April 28, 2007 48
Other useful tools for agricultural studies:
Water isotopes: Analysis of the water for δ18O and δ2H (these are almost perfect tracers of the water itself) can provide extremely useful information about the sources of the nitrate and other solutes in the water.
Sulfur isotopes: Analysis of sulfate for δ34S and δ18O, or organic matter for δ34S, can provide information about fertilizer and waste sources.Age-dating nitrate contamination of groundwater: One powerful potential application of technological advances in the age-dating of young groundwater is to evaluate the impact of changes in agricultural management practices on water quality. Tracers includetritium (3H), 3H/3He, and CFCs.Examples of environmental changes that can be assessed by this method include: changes in the amount and types of fertilizers used, different fertilizer application times, relocation of potential pollutant sources, different remediation strategies, determination of timescales for remediation, and the installation of drainage systems.
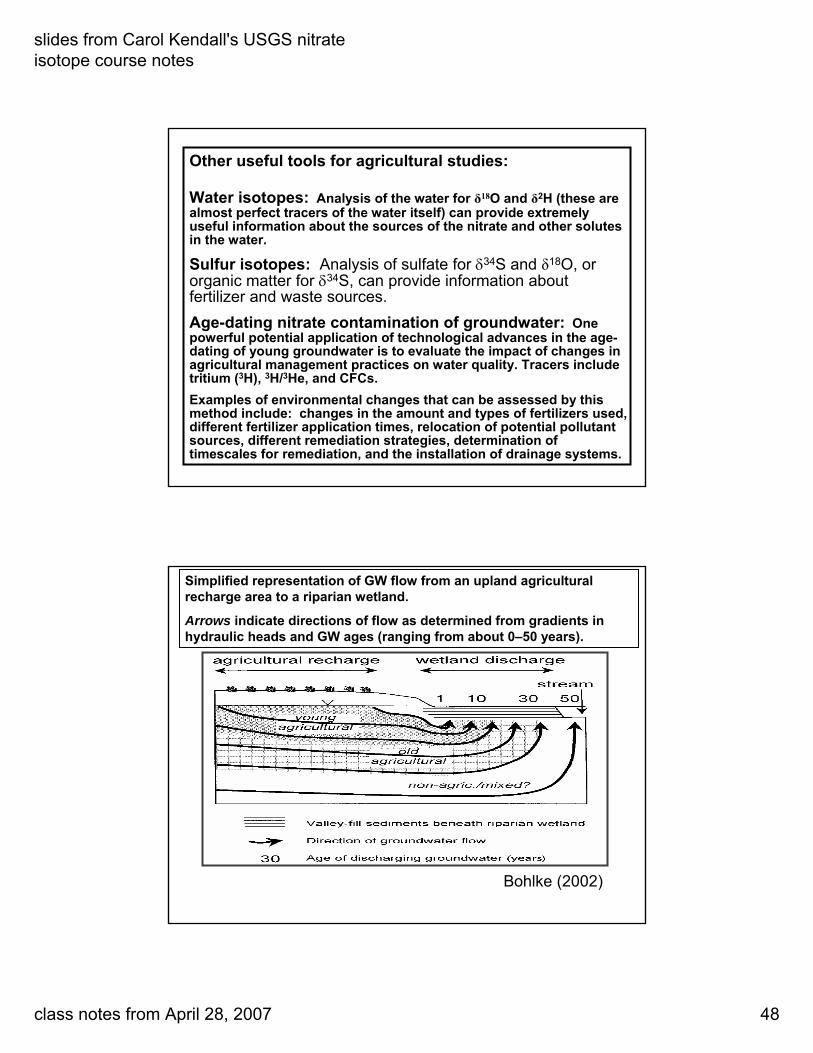
Simplified representation of GW flow from an upland agriculturalrecharge area to a riparian wetland.
Arrows indicate directions of flow as determined from gradients in hydraulic heads and GW ages (ranging from about 0–50 years).
Bohlke (2002)

slides from Carol Kendall's USGS nitrate isotope course notes
class notes from April 28, 2007 49
Analysis of the δ15N of N2 and NO3, combined with water age-dating techniques, explains why:
(1) different streams in an agricultural watershed in MD have different NO3 concentrations, and
(2) determines how long it will take for natural remediation processes to remove the fertilizer NO3 from groundwater.
Other useful tools for agricultural studies:
Isotope biomonitoring: analysis of the δ15N of algae, terrestrial plants, and animals as “proxies” for the isotopic compositions of nitrate and/or ammonium – and hence sources and land uses. Statistical, geochemical, and hydrologic modeling: We are past the time when simple bivariate plots and linear regressions are sufficient for interpreting data. Other approaches: EMMA (End Member Mixing Analysis), geochemical reaction path modeling, principal components analysis, and classification trees.Other chemical constituents: pharmaceuticals specific to different animal types, trace elements and REE for tracing fertilizers, and basic chemistry. You can do a lot with just simple Cl concentrations for identifying animal waste contamination of rivers and groundwaters.

slides from Carol Kendall's USGS nitrate isotope course notes
class notes from April 28, 2007 50
Some good advice: ALWAYS ARCHIVE SAMPLES
Many of these stable isotope tools archive very well --filtered, preserved, or frozen (depending on type). DIC and DO are the exceptions; they are good for months not years (unless you make special precautions).
So collect many more samples that you can afford to analyze, and archive them. Then used an “adaptive management practice” to decide what to analyze first.
You might also want to archive samples for possible analysis for metal and semi-metal isotopes. In general, these are filtered thru 0.2 micron and then acidified –using very pure reagents that don’t contain K or anything that might contribute radiogenic materials.
Proposed sampling scheme for all future river nutrient studies
Each time chemistry samples are collected at each site, collect and archive the following samples:
1) Nitrate isotope samples: Collect and archive ~60 ml, filtered (0.2 um), frozen, water samples.
2) POM isotope samples: Filter ~1L of water through a flat, pre-combusted, glass fiber filter (0.7 um), freeze the filters, and archive them.
3) Water isotope samples: Collect and archive 10-20 ml of water (unfrozen).
4) DOC/DON and SO4 isotope samples: If you have sufficient freezer space, save the eluent from filtering the POM samples and save this for future isotopeanalyses.
5) Biota isotope samples: Archive ~1 cc frozen aliquots of biological samples (algae, riparian terrestrial plants, aquatic invertebrates, fish), especially ones collected along river reaches.
After chemical data are examined and modeled, these archived samples can be used to test hypotheses with new isotope data.
slides from Carol Kendall's USGS nitrate isotope course notes
class notes from April 28, 2007 51
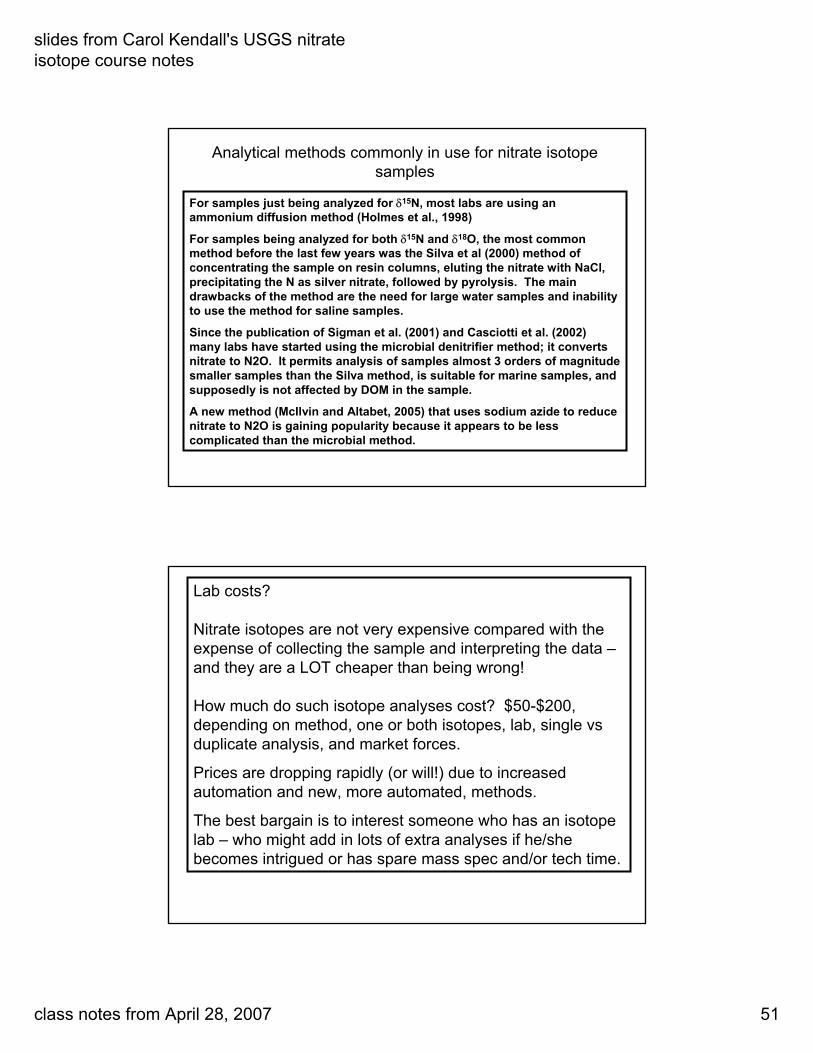
Analytical methods commonly in use for nitrate isotope samples
For samples just being analyzed for δ15N, most labs are using an ammonium diffusion method (Holmes et al., 1998)
For samples being analyzed for both δ15N and δ18O, the most common method before the last few years was the Silva et al (2000) method of concentrating the sample on resin columns, eluting the nitrate with NaCl, precipitating the N as silver nitrate, followed by pyrolysis. The main drawbacks of the method are the need for large water samples and inability to use the method for saline samples.
Since the publication of Sigman et al. (2001) and Casciotti et al. (2002) many labs have started using the microbial denitrifier method; it converts nitrate to N2O. It permits analysis of samples almost 3 orders of magnitude smaller samples than the Silva method, is suitable for marine samples, and supposedly is not affected by DOM in the sample.
A new method (McIlvin and Altabet, 2005) that uses sodium azide to reduce nitrate to N2O is gaining popularity because it appears to be less complicated than the microbial method.
Lab costs?
Nitrate isotopes are not very expensive compared with the expense of collecting the sample and interpreting the data –and they are a LOT cheaper than being wrong!
How much do such isotope analyses cost? $50-$200, depending on method, one or both isotopes, lab, single vs duplicate analysis, and market forces.
Prices are dropping rapidly (or will!) due to increased automation and new, more automated, methods.
The best bargain is to interest someone who has an isotope lab – who might add in lots of extra analyses if he/she becomes intrigued or has spare mass spec and/or tech time.
slides from Carol Kendall's USGS nitrate isotope course notes
class notes from April 28, 2007 52
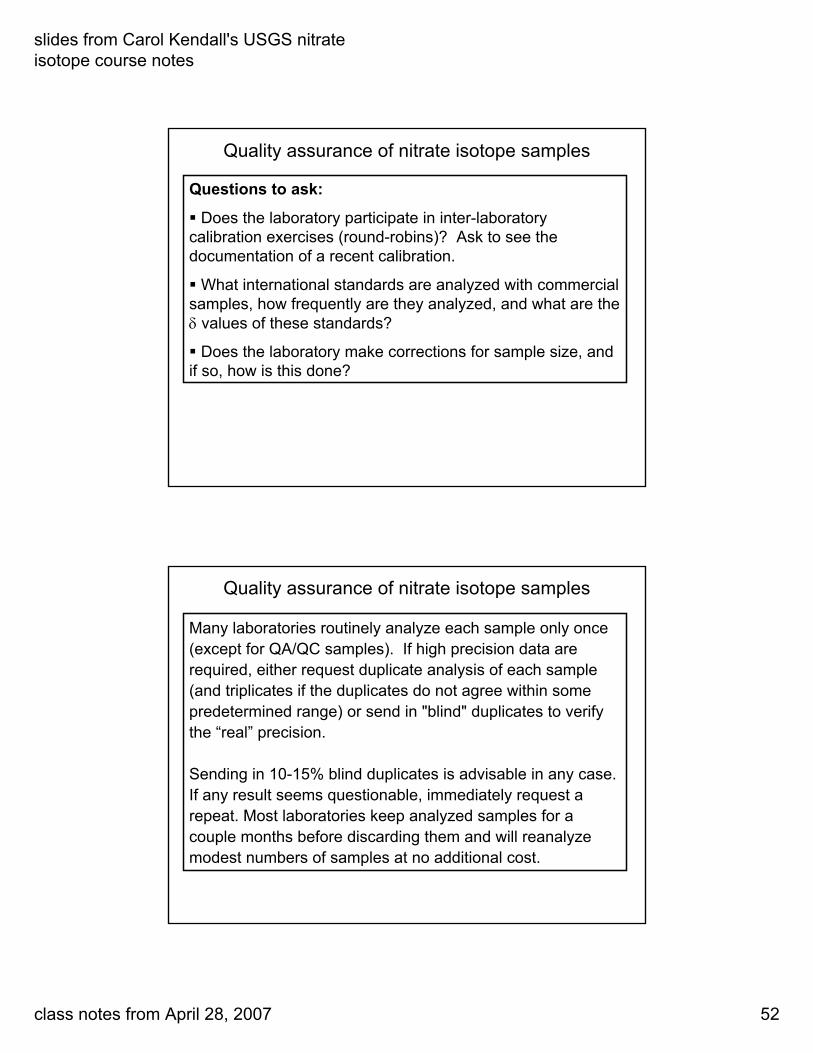
Questions to ask:
Does the laboratory participate in inter-laboratory calibration exercises (round-robins)? Ask to see the documentation of a recent calibration.
What international standards are analyzed with commercial samples, how frequently are they analyzed, and what are the δ values of these standards?
Does the laboratory make corrections for sample size, and if so, how is this done?
Quality assurance of nitrate isotope samples
Many laboratories routinely analyze each sample only once (except for QA/QC samples). If high precision data are required, either request duplicate analysis of each sample (and triplicates if the duplicates do not agree within some predetermined range) or send in "blind" duplicates to verify the “real” precision.
Sending in 10-15% blind duplicates is advisable in any case. If any result seems questionable, immediately request a repeat. Most laboratories keep analyzed samples for a couple months before discarding them and will reanalyze modest numbers of samples at no additional cost.
Quality assurance of nitrate isotope samples

slides from Carol Kendall's USGS nitrate isotope course notes
class notes from April 28, 2007 53
Quality assurance of nitrate isotope samples
Immediately plot the data on a δ18O vs. δ15N diagram. Data that plot appreciably outside the compositions expected for “terrestrial” sources of nitrate (e.g., nitrification of soil N, ammonium fertilizers, waste N) and do not plot along a “denitrification” slope should be viewed with skepticism and possibly reanalyzed. Few natural processes produce waters that plot significantly outside these ranges.
Exceptions include places where much of the nitrate is derived from atmospheric sources or from the application of nitrate-rich (e.g., Chilean nitrate) fertilizers, producing waters with high δ18O but normal δ15N values.
QA/QC of nitrate isotope samples
What are suspicious values? Basically anything not on the denitrification line or data that plot outside these boxes UNLESS there is reason to suspect that the sample contains a fair amount of atmospheric nitrate. If the suspected nitrate source is wastewater, these “suspicious” samples are definitely suspect and should be reanalyzed!!
-10
0
10
20
30
40
50
60
70
80
90
100
-15 -10 -5 0 5 10 15 20 25 30 35 40nitrate - δ15N
nitrat
e - δ18
O
manure & septic waste
NH4 in fertilizer and rain
NO3 inprecipitation
NO3 fertilizer
soil N
Example of suspicious values
Nitrate – δ15N
Nitr
ate
–δ1
8 O

slides from Carol Kendall's USGS nitrate isotope course notes
class notes from April 28, 2007 54
Although many samples from these small watershed sites in NY plot outside the boxes, large contributions from atmospheric nitrate are expected so these
sample δ18O values are probably OK
Summary:
1) There has been a lot of progress with isotope characterization and tracing of agricultural contaminant sources in the last few years, particularly with regard to distinguishing between different kinds of animals (including humans) with “uncommonly” used isotopes.
2) You should not rely on a single isotope (δ15N) but instead use a multi-isotope, multi-tracer, approach if you want to answer questions about sources in complicated systems.
3) Use a multiple lines of evidence (and multiple testable hypotheses).
4) And don’t forget that you need to consider the hydrology and basic chemistry of the system – not just isotopes or organics.

slides from Carol Kendall's USGS nitrate isotope course notes
class notes from April 28, 2007 55
Biggest problems for isotope studies:
Different sources can have partially overlapping isotopic compositions.
Sources can have considerable spatial and temporal variation in isotopic composition.
Isotope fractionations can blur initially distinctive compositions.
Solution:
use a multi-isotope, multi-tracer, approach – with a lot of hydrologic and chemical data.
Value of isotopes for water resources management:
1) To tell us things about water resources that we didn’t know before.
2) To tell us things about water resources that CONTRADICT what we thought we knew before.
3) And therefore, to increase the likelihood that any proposed remediation plans will be effective – because the correct source was identified and quantified.
Final words …

References for Kendall slides used in GRA isotope short-course March 28, 2005
Anderson, M.G., & Burt, T.P. (1990) Process studies in hillslope hydrology. John Wiley and Sons, Chichester.
Anderson, C. & Cabana, G. (2005) delta N-15 in riverine food webs: effects of N inputs from agricultural watersheds. Canadian Journal of Fisheries and Aquatic Sciences, 62, 333-340.
Aravena, R., Evans, M.L. & Cherry, J.A. (1993) Stable isotopes of oxygen and nitrogen in sources identification of nitrate from septic systems. Ground Water, 31, 180– 186.
Baedecker, M.J., and Back, 1979. Hydrogeochemical processes at a landfill. Ground Water, 17: 429-437. *
Barth, S.R., 2000. Utilization of boron as a critical parameter in water quality evaluation: implications for thermal and mineral water resources in SW Germany and N Switzerland. Environmental Geology 40: 73-89
Bates, A.L., Orem, W.H., Harvey, J.W. & Spiker, E.C. (2002) Tracing sources of sulfur in the Florida Everglades, Journal of Environmental Quality, 31, 287-299. *
Battaglin, W.A., Kendall, C., Chang, C.C.Y., Silva, S.R. et al. (2001a) Chemical and isotopic composition of organic and inorganic samples from the Mississippi River and its tributaries, 1997-98, USGS Water Resources Investigation Report, 01- 4095, pp. 57.
Battaglin, W.A., Kendall, C., Chang, C.C.Y., Silva, S.R. et al. (2001b) Chemical and isotopic evidence of nitrogen transformation in the Mississippi River, 1997-98. Hydrological Processes, 15, 1285-1300.
Birks, S.J., Gibson, J.J., Gourcy, L., Aggarwal, P.K., & Edwards, T.W.D. (2002) Maps and animations offer new opportunities for studying the global water cycle. EOS Transactions 83 (37), 10 September 2002 (Available at http://www.agu.org/eos_elec/020082e.html).*
Böhlke, J.K., and Denver, J.M., 1995. Combined use of ground-water dating, chemical, and isotopic analyses to resolve the history and fate of nitrate contamination in two agricultural watersheds, atlantic coastal plain, Maryland. Water Resour. Res., 31: 2319-2339.
Böhlke, J.K., Eriksen, G.E. & Revesz, K. (1997) Stable isotope evidence for an atmospheric origin of desert nitrate deposits in northern Chile and southern California, U.S.A. Isot. Geos., 136, 135-152.
Bowen, G.J., & Wilkinson, B. (2001) Spatial distribution of δ18O in meteoric precipitation. Geology 30 (4), 315-318.*
Bowen, G.J., & Revenaugh, J. (2003) Interpolating the isotopic composition of modern meteoric precipitation. Water Resources Research 39 (10), doi:10.1029/2003WR002086.*
Burns, D.A., Plummer, L.N., McDonnell, J.J., Busenberg, E., Casile, G.C., Kendall, C., Hooper, R.P., Freer, J.E., Peters, N.E., Beven, K.J., & Schlosser, P. (2003) The geochemical evolution of riparian ground water in a forested piedmont catchment. Ground Water 41 (7), 913-925.
Cabana, G. & Rasmussen, J.B. (1996) Comparison of aquatic food chains using nitrogen isotopes. Proc. Natl. Acad. Sci., 93, 10844-10847.
Campbell, D.H., Kendall, C., Chang, C.C.Y., Silva, S.R., Tonnessen, K.A., 2002, Pathways for nitrate release from an alpine watershed: determination using δ15N and δ18O, Water Res. Res. 38: 9-1 to 9-11.
1

Casciotti, K.L., Sigman, D.M., Hastings, M.G., Bohlke, J.K. et al. (2002) Measurement of the oxygen isotopic composition of nitrate in seawater and freshwater using the denitrifier method, Anal. Chem., 74, 4905-12.
Böhlke, J.K. 2002. Groundwater recharge and agricultural contamination, Hydrogeology Journal, 10:153–179.
Coplen, T. (1993) Uses of environmental isotopes. In: Alley, W.M. (ed) Regional Ground-Water Quality. Van Nostrand Reinhold, New York, pp. 227-254.
Davisson, M. L., Hudson, G.B., Moran, J.E., Niemeyer, S., and Herndon, R., 1998. Isotope Tracer Approaches for Characterizing Artificial Recharge and Demonstrating Regulatory Compliance, UCRL-JC-129656, LLNL report.
Dawson, T.E., 1993. Water sources of plants as determned from xylem-water isotopic composition: perspectives on plant competition, distrbution, and water relations. In: J.R. Ehleringer, A.E. Hall and G.D. Farquhar (Es), Stable Isotopes and Plant Carbon-Water Relations, Academic Press, Inc., San Diego, pp. 465-496.
Dawson, T.E. and Ehleringer, J.R., 1991. Streamside trees that do not use stream water. Nature, 350: 335- 337.
Dawson, T.E. and Ehleringer, J.R., 1998. Plants, Isotopes and Water Use: A Catchment-Scale Perspective, Chapter 6, In: C. Kendall and J.J. McDonnell (Eds.), Isotope Tracers in Catchment Hydrology, Elsevier, Amsterdam, p. 165-202.
DeWalle, D. , Swistock, B.R. and Share, W.E., 1988. Three component tracer model for stormflow on a small Appalachian forested catchment. Jour. of Hydro!., 104: 301-310.
Elliott, E.M., Kendall, C., Wankel, S.D., Burns, D.A. et al. (In review). An isotopic tracer of station
Faure, G., 1986. Principles of Isotope Geology, 2nd Ed., John Wiley and Sons, New York, 589 p. Feigin, A., Shearer, G., Kohl, D.H. & Commoner, B. (1974) The amount and nitrogen-15 content
of nitrate in soil profiles from two central Illinois fields in a corn-soybean rotation. Soil Sci. Soc. Amer. Proc., 38, 465-471.
Ferronsky, V.I. and Polyakov, V.A., 1982. Environmental isotopes in the hydrosphere. Translated by S. Ferronsky, John Wiley and Sons, New York, 466 p.
Finlay, J.C., and Kendall, C., 2007. Stable isotope tracing of temporal and spatial variability in organic matter sources to freshwater ecosystems, Chapter 10, In: R.H. Michener and K. Lajtha (Eds.), Stable Isotopes in Ecology and Environmental Science, 2nd edition, Blackwell Scientific Press (in press).
Fogel, M.L. & Cifuentes, L.A. (1993) Isotope fractionation during primary production. In: Engel, M.H. and Macko, S.A. (Eds). Organic Geochemistry, Plenum Press, New York, pp. 73-98.
Fogg, G.E., Rolston, D.E., Decker, D.L., Louie, D.T., and Grismer, M.E., 1998. Spatial variation in nitrogen isotope values beneath nitrate contamination sources. Ground Water, 36: 418-426.
Fritz, P., and Fontes, J.Ch. (Editors), 1980. Handbook of Environmental Isotope Geochemistry, Vol. 1. Elsevier, New York, 545 pp.
Fritz, PJ. , Cherry, A , Weyer, K.U. and Sklash, M. , 1976. Storm runoff analyses using environmental isotopes and major ions. In: Interpretation of Environmental Isotope and Hydrochemical Data in Groundwater Hydrology, IAEA, Vienna, Austria, pp. 111- 130.
Friedman, I, Smith, G.I., Gleason, J.D., Warden, A. and Harris, J.M , 1992. Stable Isotope compositions of waters in southeastern California: Par I, Modem precipitation. Jour. of Geophys. Research. 97(D5): 5795-5812.
2

Gat, J.R. and Gonfiantini, R., (Eds) 1981. Stable Isotope Hydrology: Deuterium and Oxygen-18 in the Water Cycle. IAEA Technical Report Series #210, Vienna, 337 p.
Gat, J.R., Bowser, C.J., and Kendall, C., 1994, The contribution of evaporation from the North American Great Lakes to the continental atmospheric water balance--detection by means of the stable isotope signature of evaporated waters: Geophysical Research Letters, 21: 557-560.
Gibson, J.J., P. Aggarwal, J. Hogan, C. Kendall, L.A. Martinelli, W. Stichler, D. Rank, I. Goni, M. Choudhry, J. Gat, S. Bhattacharya, A. Sugimoto, B. Fekete, A. Pietroniro, T. Maurer, H. Panarello, D. Stone, P. Seyler, L. Maurice-Bourgoin and A. Herczeg. 2002. Isotope studies in large river basins: a new global research focus. EOS 83 (52) 24: 613, 616-617.
Granger J., Sigman D. M., Needoba J. A., & Harrison P. J. (2004) Coupled nitrogen and oxygen isotope fractionation of nitrate during assimilation by cultures of marine phytoplankton. Limnology and Oceanography 49(5), 1763-1773.
Hauck, R.D., Bartholomew, W.V., Bremner, J.M., Broadbent, F.E. et al. (1972) Use of variations in natural nitrogen isotope abundance for environmental studies: a questionable approach. Science, 177, 453-454.
Heaton, T H.E. (1990) 15N/14N ratios of NOx from vehicle engines and coal-fired power stations. Tellus, 42B, 304-307.
Holmes, R., McCleland M.J., Sigman, W., Fry, D.M. et al. (1998) Measuring 15N-NH4+ in
marine, estuarine and fresh waters: An adaptation of the ammonia diffusion method for samples with low ammonium concentrations. Marine Chemistry, 60, 235-243.
Horita, J., 1989. Analytical aspects of stable isotopes in brines. Chem. Geol., 79: 107-112. Ingraham, N.L. (1998). Isotopic Variations in Precipitation, Chapter 3, In: C. Kendall and J.J.
McDonnell (Eds.), Isotope Tracers in Catchment Hydrology, Elsevier, Amsterdam, p. 87-118.
Ingraham, N.L. and Criss, R.E., 1993. Effects of Surface Area and Volume on the Rate ofIsotopic Exchange Between Water and Water Vapor. Jour. of Geophys. Research, 98(Dll): 20,547-20,553.
Ingraham, N.L. and Taylor, B.E., 1991. Light Stable Isotope Systematics of Large-Scale Hydrologic Regimes in California and Nevada. Water Resour. Res., 27: 77-90.
Kendall, C., 1993, Impact of Isotopic Heterogeneity in Shallow Systems on Stormflow Generation, Ph.D. dissertation, University of Maryland, College Park, 310 p.
Kendall, C., 1998. Tracing nitrogen sources and cycling in catchments, Chapter 16, In: C. Kendall and J.J. McDonnell (Eds.), Isotope Tracers in Catchment Hydrology, Elsevier, Amsterdam, p. 519-576.
Kendall, C. and Caldwell, E.A., 1998. Fundamentals of isotope geochemistry, Chapter 2, In: C. Kendall and J.J. McDonnell (Eds.), Isotope Tracers in Catchment Hydrology, Elsevier, Amsterdam, p. 51-86.
Kendall, C., and Doctor, D.H., 2005. Stable isotope applications in Hydrologic Studies, in Drever, J.I., ed., Surface and ground water, weathering, and soils: Treatise on Geochemistry, v. 5, chapter 11, p. 319-364.
Kendall, C., and Coplen, T.B., 2001. Distribution of oxygen-18 and deuterium in river waters across the United States, NASQAN Special Issue, Hydrological Processes. 15:1363-1393.
Kendall, C., Sklash, M.G., and Bullen, T.D., 1995a. Isotope tracers of water and solute sources in catchments, In: S. Trudgill (Editor), Solute Modelling in Catchment Systems, Wiley and Sons, New York, p. 261-303.
3

Kendall, C., Silva, S.R., and Kelly, V.J., 2001. Carbon and nitrogen isotopic compositions of particulate organic matter in four large river systems across the United States, Hydrological Processes. 15:1301-1346.
Kendall, C., Elliott, E.M., and Wankel, S.D., 2007. Tracing anthropogenic inputs of nitrogen to ecosystems, Chapter 12, In: R.H. Michener and K. Lajtha (Eds.), Stable Isotopes in Ecology and Environmental Science, 2nd edition, Blackwell Scientific Press (in press).
Kennedy, V.C., Kendall, C., Zellweger, G.W., Wyerman, T.A., and Avanzino, R.J., 1986, Determination of the components of stormflow using water chemistry and environmental isotopes, Mattole River Basin, California: Journal of Hydrology, 84: 107-140.
Kohl, D.H., Shearer, G.B., and Commoner, B., 1971. Fertilizer nitrogen: contribution to nitrate in surface water in a corn belt watershed. Science, 174: 1331-1334.
Kohl, D.H., Commoner, B. & Shearer, G.B. (1972) Use of variations in natural nitrogen isotope abundance for environmental studies - a questionable approach. Science, 177, 455-xxx.*
Krabbenhoft, D.P., Bowser, C.J., Kendall, C., and Gat, J.R., 1994, Use of oxygen-18 and deuterium to assess the hydrology of ground-water/lake systems, in: Baker, L.A. (ed.) Environmental Chemistry of Lakes and Reservoirs, American Chemical Society, Monograph #237, p. 67-90.
Kratzer, C.R., Dileanis, P.D., Zamora, C., Silva, S.R., Kendall, C., Bergamaschi, B.A., and Dahlgren, R.A. (2004). Sources and transport of nutrients, organic carbon, and chlorophyll-a in the San Joaquin River upstream of Vernalis, California, during summer and fall, 2000 and 2001, USGS WRI 03-4127. online: http://water.usgs.gov/pubs/wri/wri034127/ .
Mariotti, A., Landreau, A., Simon, B., 1988. 15N isotope biogeochemistry and natural denitrification process in groundwater: application to the chalk aquifer of northern France. Geochim. Cosmochim. Acta 52, 1869– 1878.
Mayer, B., Bollwerk, S.M., Mansfeldt, T., Hütter, B. et al. (2001) The oxygen isotopic composition of nitrate generated by nitrification in acid forest floors. Geochim. Cosmochim., Acta 65(16), 2743-2756.
Mayer, B., Boyer, E.W., Goodale, C., Jaworski, N.A. et al. (2002) Sources of nitrate in rivers draining sixteen watersheds in the northeastern US: Isotopic constraints, Biogeochemistry, 57, 171-197.
McGuire, K.J., McDonnell, J.J., Weiler, M., Kendall, C., McGlynn, B.L., Welker, J.M., and Seibert, J. 2005. The role of topography on catchment-scale water residence time, Water Resources Research: 41, W05002, doi:10.1029/2004WR003657.
McGuire, K.J., & McDonnell, J.J. (2006) A review and evaluation of catchment transit time modeling. Journal of Hydrology in press.
McHale, M.R., McDonnell, J.J., MitchellM.J., and Cirmo, C.P., 2002. A field-based study of soil water and groundwater nitrate release in an Adirondack forested watershed, WATER RESOURCES RESEARCH, VOL. 38, NO. 4, 1031, 10.1029/2000WR000102,
McIlvin, M. & Altabet, M. A. (2005) Chemical Conversion of Nitrate and Nitrite to Nitrous Oxide for Nitrogen and Oxygen Isotopic Analysis in Freshwater and Seawater, Anal. Chem. 77: 5589-5595
McLaughlin, K., C. Kendall, S. R. Silva, M. Young, and A. Paytan (2006), Phosphate oxygen isotope ratios as a tracer for sources and cycling of phosphate in North San Francisco Bay, California, J. Geophys. Res., 111, G03003, doi:10.1029/2005JG000079.
4

McMahon, P.B. & Böhlke, J.K. (2006) Regional patterns in the isotopic composition of natural and anthropogenic nitrate in groundwater, High Plains, USA, Environmental Science & Technology, 40 (9), 2965 -2970.
Michalski, G., Savarino, J., Bohlke, J.K. & Thiemans, M. (2002) Determination of the total oxygen isotopic composition of nitrate and the calibration of a Del 17O nitrate reference material. Anal. Chem., 74, 4989-93.
Nardoto, G.B., Silva, S., Kendall, C., Ehleringer, J.R., Chesson, L.A., Ferraz, E.S.B., Moreira, M.Z., Ometto, J.P.H.B., and Martinelli, L.A., 2006, Geographical patterns of human diet derived from stable-isotope analysis of fingernails, American Journal of Physical Anthropology, 131: 137-146, doi:10.1002/ajpa.20409.
Needoba, J.A., Sigman, D.M., & Harrison, P.J. (2004) The mechanism of isotope fractionation during algal nitrate assimilation as illuminated by the 15N/14N of intracellular nitrate. Journal of Phycology, 40, 517-522.
O’Neil, J.R., 1986. Theoretical and experimental aspects of isotopic fractionation. In: J.W. Valley, H.P. Taylor and J.R. O’Neil (Eds), Stable Isotopes in High Temperature Geological Processes. Reviews in Mineralogy, Volume 16, pp. 1-40.
Payne, B. 1970 (some IAEA report??) Plummer, L.N., Prestemon, E.C. and Parkhurst, D.L., 1991. An interactive code (NETPATH) for
modelling net geochemical reactions along a flow path. USGS Water-Rources Inves. Report 91-4078, 227 p.
Rademacher, L.K., Clark, J.F., and Hudson, G.B. 2002. Temporal changes in stable isotope composition of spring waters: Implications for recent changes in climate and atmospheric circulation, Geology; 30: 139–142.
Rock, L. & Mayer, B. (2004) Isotopic Assessment of Sources of Surface Water Nitrate within the Oldman River Basin, Southern Alberta, Canada. Water, Air, and Soil Pollution, 4, 545-562.
Rose, T.P., Davisson, M.L., and Criss, R.E. (1996) Isotope hydrology of voluminous cold springs in fractured rock from an active volcanic region, northeastern California. Journal of Hydrology 179: 207-236
Saurer, M , Cherubini, P, Ammann, M, De Cinti, B, Siegwolf, R., 2004. First detection of nitrogen from NOx in tree rings: a 15N/14N study near a motorway, Atmospheric Environment 38, 2779–2787.
Sebilo, M., Billen, G., Grably, M., and Mariotti, A. 2003. Isotopic composition of nitrate-nitrogen as a marker of riparian and benthic denitrification at the scale of the whole Seine River system, Biogeochemistry 63: 35–51.
Sigman, D.M., Casciotti, K.L., Andreani, M., Barford, C., et al. (2001) A bacterial method for the nitrogen isotopic analyses of nitrate in seawater and freshwater. Anal. Chem., 73, 4145-4153.
Shanley, J., Kendall, C., Smith, T., Wolock, D., and McDonnell, J.J., 2002. Controls on old and new water contributions to stream flow at some nested catchments in Vermont, Hydrological Processes 16: 589-609.
Siegenthaler, U. (1979) Stable hydrogen and oxygen isotopes in the water cycle. In: Jäger, E., and Hunziker, J.C. (eds) Lectures in isotope geology. Springer-Verlag, Berlin, Germany, pp. 264-273.
5

Silva, S.R., Kendall, C., Wilkison, D.H., Ziegler, A.C., Chang, C.C., and Avanzino, R.J, 2000. A new method for collection of nitrate from fresh water and the analysis of nitrogen and oxygen isotope ratios, J. of Hydrology, 228: 22-36.
Silva S.R., Ging P.B., Lee R.W., Ebbert J.C., Tesoriero A.J., and Inkpen E.L. (2002) Forensic applications of nitrogen and oxygen isotopes of nitrate in an urban environment. Environmental Forensics 3, 125-130.
Sklash, M.G., and Farvolden, R.N., 1982. The use of environmental isotopes in the study of high-runoff episodes in streams. In: E.C Perry. Jr., and C.W. Montgomery (Editors), Isotope Studies of Hydrologic Processes, Northern Illinois University Press, DeKalb, Illinois, pp. 65-73.
Spruill, T.B., et al. 2002. Application of Classification-Tree Methods to Identify Nitrate Sources in Ground Water. Journal of Environmental Quality. Vol. 31. pp.1538-1549.
Tucker, J., Sheats, N., Giblin, A.E., Hopkinson, C.S. and Montoya, J.P. 1999. Using stable isotopes to trace sewage-derived material through Boston Harbor and Massachusetts Bay.*
Van Dover C.L., Grassle, J.F., Fry, B., Garritt, R.H. and Starczak, V.R. 1992. Stable isotope evidence for entry of sewage-derived organic material into a deep-sea food web. Nature 360: 153-155.*
Vogel, J.C., Talma, A.S., Heaton, T.H.E., 1981. Gaseous nitrogen as evidence for denitrification in groundwater. J. Hydrol. 50, 191–200.
Wankel, S.D., Kendall, C., Francis, C.A. & Paytan, A. (2006) Nitrogen sources and cycling in the San Francisco Bay Estuary: A nitrate dual isotope approach. Limnol. Oceanogr., 51, 1654-1664.
Wassenaar, L.I. 1995. Evaluation of the Origin and Fate of Nitrate in the Abbotsford Aquifer Using the Isotopes of 15N and 18O in NO3-. Applied Geochemistry. Vol. 10. pp.391-405.*
Wassenaar, L.I., Hendry, M.J. & Harrington, N. (2006) Decadal geochemical and isotopic trends for nitrate in a transboundary aquifer and implications for agricultural beneficial management practices. Environmental Science & Technology, 40: 4626-32*
Weiler, M., McGlynn, B.L., McGuire, K.J., & McDonnell, J.J. (2003) How does rainfall become runoff? A combined tracer and runoff transfer function approach. Water Resources Research 39 (11), 1315, doi:1310.1029/2003WR002331.
Widory, D., Kloppmann, W., Chery, L., Bonnin, J., Rochdi, H., Guinamant, JL, 2004. Nitrate in groundwater: an isotopic multi-tracer approach. Journal of Contaminant Hydrology, 72:165–188.
* papers not mentioned in current handouts (but should have been!)
6