isbn 9780128148976,
TRANSCRIPT
This is the self-archived version of:
Oliver Lah, Lew Fulton, Magdala Arioli,Chapter 3 - Decarbonization Scenarios for Transport and the Role of Urban Mobility,Editor(s): Oliver Lah,Sustainable Urban Mobility Pathways,Elsevier, 2019, Pages 65-80,ISBN 9780128148976,https://doi.org/10.1016/B978-0-12-814897-6.00003-X.

Oliver Lah, Lew Fulton, Magdala Arioli
Decarbonisation scenarios for transport and the role of urban mobility
Book Chapter
Sustainable Urban Mobility Pathways
This version is available at
https://doi.org/10.1016/B978-0-12-814897-6.00003-X
Terms of use
This work is protected by copyright and/or related rights. You are free to use this work in any way permitted by the copyright and related rights legislation that applies to your usage. For other uses, you must obtain permission from the rights-holder(s).

Decarbonisation scenarios for transport and the role of urban mobility Oliver Lah, Lew Fulton, Magdala Arioli Abstract To bring transport onto a decarbonisation pathway, significant action is required on policies and investments. This includes decarbonisation of fuels, more efficient vehicles, urban design and changes in travel patterns and mode shares. This chapter shows that growth in mobility demand for mobility outpaces efficiency gains, which shows that technological progress will not deliver the transformative change that is needed for the sector and highlights the need for policy intervention. The analysis carried out for in this chapter builds on a range of assessments of the climate change mitigation potential of the sector and applies their data in different quantitative scenarios that aim to provide a perspective on local and international decarbonisation scenarios. It shows that a decarbonisation pathway for transport requires a policy approach that combines compact and mixed-use city design, high capacity public transport system, efficient logistics solutions, fuel efficiency and fuel switch options and emphasises that isolated measures will fall short of achieving the climate change mitigation targets and Sustainable Development Goals. Keywords: Scenarios, transport, climate change, urban mobility
Introduction The transport sector plays an important role in global climate change mitigation strategies, as it currently accounts for about 23% of global energy-related greenhouse gas emissions. If current trends in motorisation persists transport greenhouse gas emissions could double by 2050 (IPCC 2014). There is substantial potential in both technical and behavioural mitigation measures for all transport modes. These could reduce total transportation CO2-eq emissions in 2050 by as much as 60% below the baseline and 30% below 2010 levels (IEA 2014). In some cases, this mitigation potential could be tapped at very low or even negative net costs from a societal perspective along with generating substantial sustainable development benefits. However to realise this potential, an integrated policy approach that combines all intervention areas for transport policy and involves all levels of government is required. A package that achieves low-carbon transport and fosters sustainable developed includes avoided journeys through compact urban design and shifts to more efficient modes of transport, uptake of improved vehicle and engine performance technologies, low-carbon fuels, investments in related infrastructure, and changes in the built environment. Travel demand per capita in developing and emerging economies is still substantially lower than in developed countries. Emission reductions in developed countries have to be deeper over the coming decades and growth in developing countries slower to stay on a pathway that is in line with a 2 Degree warming stabilisation.
Decarbonising land transport – a global perspective A number of short-term measures, such as eco-driving, vehicle fuel efficiency and improved logistics are available to cost-effectively reduce greenhouse gas emissions and also particulate matter (including black carbon), tropospheric ozone and aerosol precursors (including NOx). In addition to the climate change mitigation aspect, this can also instantly improve human health and wellbeing. Maintaining current shares of low-carbon modes designing emerging
cities in many developing countries is another important short to medium term measure, whereas the redesign of cities and regaining of modal share of walking, cycling and public transport often requires a long-term strategy, which can also unlock a number of co-benefits that contribute to sustainable and liveable cities. The great potential for co-benefits and synergies of an integrated policy approach, but also the risk for trade-offs of isolated measures, makes the transport sector a particularly interesting case for the analysis presented in this thesis. The interplay between local and national policy actions and institutions is a key feature of governing the transition towards sustainable mobility which will aim to shed new light on the relationship between policy design and implementation process. Much mitigation potential can be exploited through avoided journeys and modal shift resulting from behavioural-change, use of improved vehicle and engine technologies, low-carbon fuels, improved infrastructure and other changes to the built environment. In order, however, to achieve deep GHG reductions, both short- and long-term transport mitigation strategies must be followed.
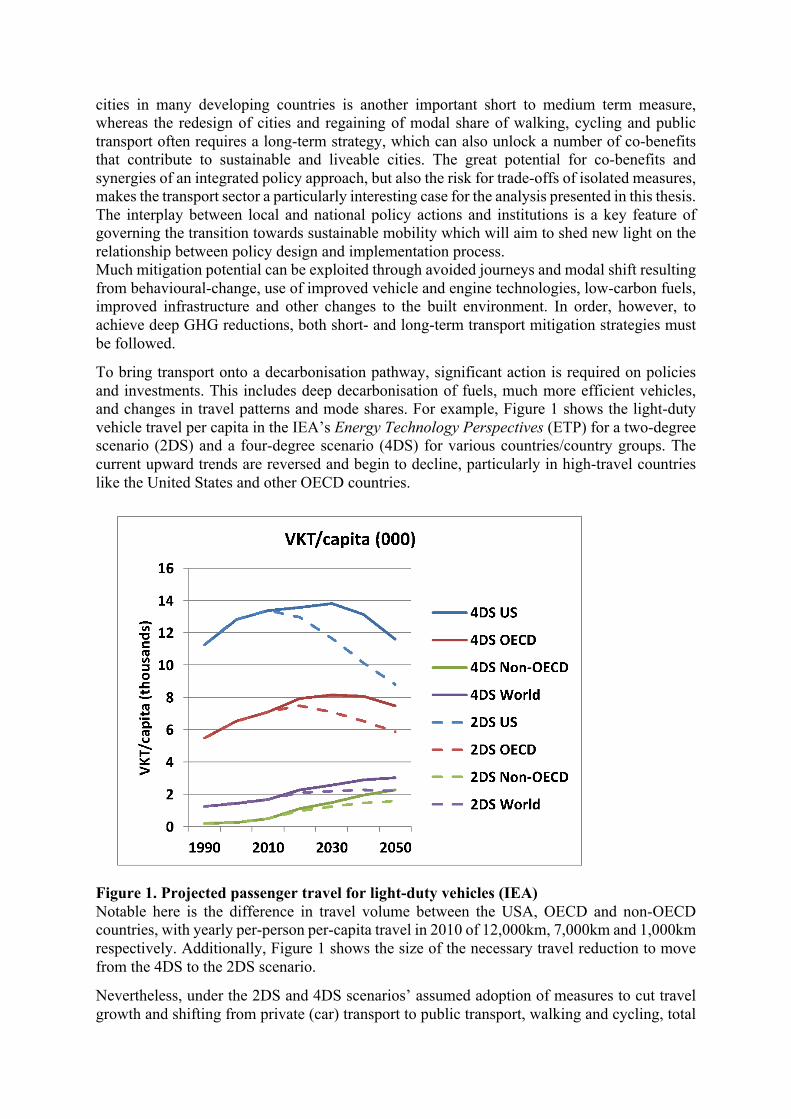
To bring transport onto a decarbonisation pathway, significant action is required on policies and investments. This includes deep decarbonisation of fuels, much more efficient vehicles, and changes in travel patterns and mode shares. For example, Figure 1 shows the light-duty vehicle travel per capita in the IEA’s Energy Technology Perspectives (ETP) for a two-degree scenario (2DS) and a four-degree scenario (4DS) for various countries/country groups. The current upward trends are reversed and begin to decline, particularly in high-travel countries like the United States and other OECD countries.
Figure 1. Projected passenger travel for light-duty vehicles (IEA) Notable here is the difference in travel volume between the USA, OECD and non-OECD countries, with yearly per-person per-capita travel in 2010 of 12,000km, 7,000km and 1,000km respectively. Additionally, Figure 1 shows the size of the necessary travel reduction to move from the 4DS to the 2DS scenario.
Nevertheless, under the 2DS and 4DS scenarios’ assumed adoption of measures to cut travel growth and shifting from private (car) transport to public transport, walking and cycling, total

mobility stays high and continues to grow over time in non-OECD countries. Although the VKT per capita is set to considerably decrease in most OECD countries, the global population is set to increase to more than 9 billion by 2050, causing travel demand to continue to grow in non-OECD countries. Thus, if the transport sector is to be brought onto a 2°C stabilisation pathway, car travel must decline in OECD countries over most of the projection period to compensate. This paper introduces ways in which this can be achieved, potentially at little, or even negative cost.
Roles of different mitigation strategies Transport emissions can be reduced in three ways:
1. shift to lower-emitting transport modes (e.g. pedestrian, cycling, public transport etc.),
2. increasing the efficiency of private motorised modes (e.g. car electrification)
3. decreasing the overall amount of travel/transport activity.
None of these represent a silver bullet; a mixture of measures is required to achieve large reductions in transport emissions, and a multi-prong approach helps avoid over-reliance on single measures. For example, targeting a major shift to low carbon vehicles and fuels is important but if targets (such as electric vehicle sales targets) are not met, then other measures must pick up this shortfall. Similarly, technology and fuels must contribute more if travel demand continues to increase in an unmanaged manner and low-carbon transport modes lose importance.
Figure 2. Light vehicle fleet until 2050 in OECD countries under different scenarios (Adapted from Fulton, Lah, Cuenot 2013) Figure 2 (for OECD countries) and 3 (for non-OECD) show the percent changes in travel per capita, efficiency and CO2 per unit fuel that can achieve transport CO2 emissions targets under 2DS for a couple of different approaches. These include an “Avoid-Shift” (AS) only approach, an “Intensity-Fuels” (IF) only approach, and one with all of these aspects changing. In this combined approach, the reductions needed in each one are significantly less than in the first two approaches.

While in developing and emerging countries the focus will be on maintaining the – currently still high – share of low-carbon transport modes, fuel efficiency will play an important role in accommodating the growth in travel demand while still making a contribution to global climate change mitigation efforts.
Figure 3. Light vehicle fleet until 2050 in OECD countries under different scenarios (Adapted from Fulton et al. 2013) Chapter 7 of this book explores some examples of key policies, which will contribute to mitigating emissions from the transport sector. However, it is crucial that national and local level policies mutually support and reinforce each other in order to maximise the success of both.
While it is acknowledged that current measures in most countries are insufficient to bring transport onto a pathway that is in line with the Paris Agreement, it is becoming more and more apparent that policies and technologies are already available which would contribute to the decarbonisation of the transport sector (IPCC 2014). It is feasible to achieve a policy-led decline in transport GHG emissions provided that key policy measures at the national level are in place, such as fuel and vehicle taxation, combined with local actions such as compact design and the provision of modal choices (Sims et al. 2014). The scenario outlined below explores the roles of different elements of low-carbon transport strategies to highlight the interaction of different measures.
The role of public transport, walking and cycling in a 2°C pathway
Public transport, walking and cycling have huge potential to cut urban transport CO2 emissions, in both OECD and non-OCED countries (Fulton, Replogle and Berliner 2014). Two scenarios developed by Fulton et al. (2014) highlight the emission reduction potential in OECD and non-OECD countries of increasing public transport, walking and cycling at the expense of more energy intensive modes (results shown in Figure 5), and will be examined further here.

Firstly, a baseline scenario adjusted from the 4°C global warming scenario (4DS) developed by the Mobility Model of the International Energy Agency. Secondly the ‘High Shift’ (HS) scenario, which involves adjusting the growth rates in non-OECD countries to reduce private light-duty vehicle travel by 50% (replacing it with increased public transport and non-motorised vehicle use), while in OECD countries total urban passenger travel is reduced through urban planning (compact land use, which shortens trips), increased telecommunicating, changing lifestyles, and demographic shifts.
As shown in Figure 4, OECD residents each travelled almost twice as much as non-OECD residents in 2010. By 2050, according to the HS scenario, OECD travel will reduce to around 8,000km per person per year – suggesting more equal levels of mobility than currently or as predicted in the baseline scenario.
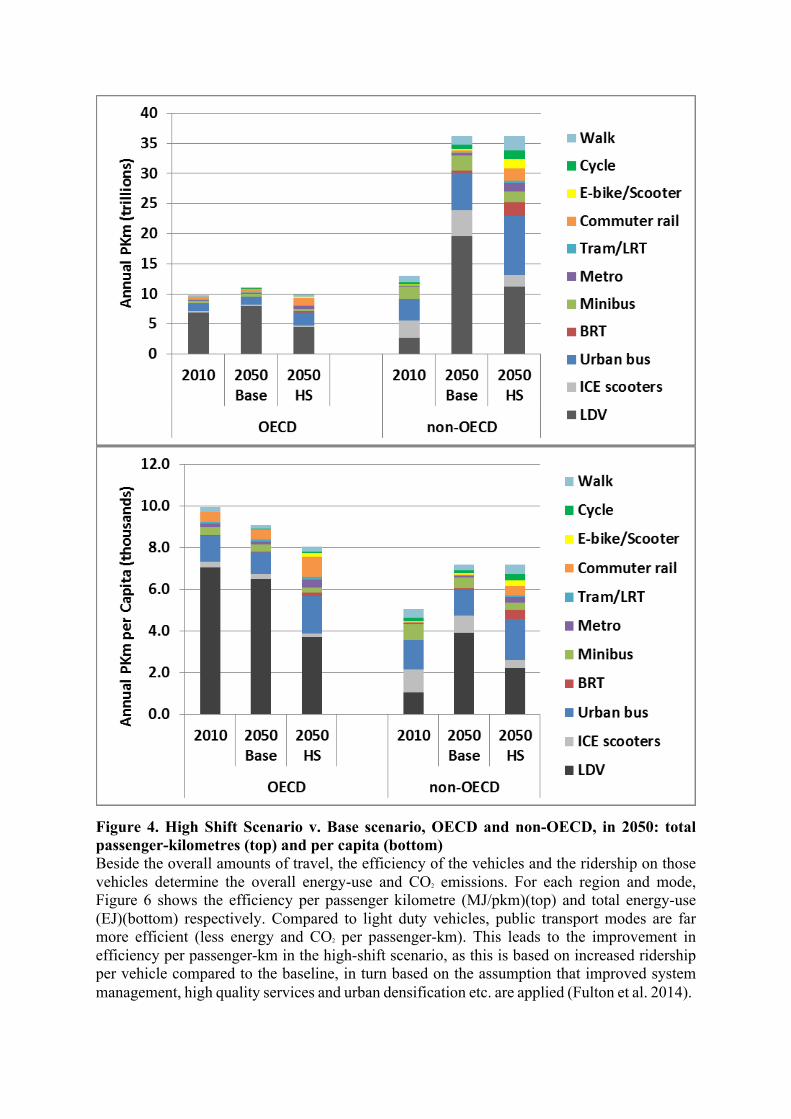
Figure 4. High Shift Scenario v. Base scenario, OECD and non-OECD, in 2050: total passenger-kilometres (top) and per capita (bottom) Beside the overall amounts of travel, the efficiency of the vehicles and the ridership on those vehicles determine the overall energy-use and CO2 emissions. For each region and mode, Figure 6 shows the efficiency per passenger kilometre (MJ/pkm)(top) and total energy-use (EJ)(bottom) respectively. Compared to light duty vehicles, public transport modes are far more efficient (less energy and CO2 per passenger-km). This leads to the improvement in efficiency per passenger-km in the high-shift scenario, as this is based on increased ridership per vehicle compared to the baseline, in turn based on the assumption that improved system management, high quality services and urban densification etc. are applied (Fulton et al. 2014).

Cities as hotspots of co-benefits and enablers for the transition to a low-carbon economy
Urbanisation is increasing rapidly, particularly in developing and emerging economies, which creates great opportunities, but also poses significant challenges. Cities currently account for about 70 percent of energy consumption and about 80 percent of energy related Greenhouse Gas Emissions, while only covering 2 percent of the earth´s landmass. However, cities can also be a hotspot for synergies and co-benefits when addressing global climate change and sustainable development objectives. Improving the efficiency of urban energy, resource and transport systems can help unlocking co-benefits, such as improved air quality, health, energy security and productivity. Urban mobility has a particularly important role to play in this by providing access to economic and social activities and being one of the key sources of CO2 emissions and air pollutants. The New Urban Agenda, which was approved by countries at the Habitat III summit in Quito in 2016 highlights the vital role of urban mobility to deliver on the Sustainable Development Goals (SDGs) and the Paris Agreement at the city level (UN 2016a). The drive towards sustainable mobility provides the social, economic and environmental rationale through the provision of access, equality and the provision of development opportunities for all (UN 2016b). The New Urban Agenda is now an integral part of the success of global climate change and sustainable development agendas, which recognises cities role as powerhouses of the global economy, drivers of innovation and centres of social interaction (Caprotti et al. 2017). The Conference of the Parties in 2015 (COP 21) achieved a remarkable consensus on climate action and emphasized the role of cities in implementing climate action measures. The target of limiting global warming to 1.5° C above pre-industrial levels will not be feasible without decisive action at the local level. Critical preconditions for the delivery of urban mobility services are a human-centred, inclusive and multi-level governance approach, integrated urban development, applying the principle of subsidiarity and appropriate legislative frameworks and enforcement mechanisms and ensure coordinated action. To support this, intra- and inter-city learning and capacity building can help to leap-frog to sustainable solutions. International efforts to implement the New Urban Agenda need to focus on all levels of governance and decision-making, to ensure that all multilateral and bilateral organisations, local authorities as well as national governments conform to and adopt the Urban Agenda. The New Urban Agenda stressed the point that access for everyone to all urban basic services is an essential precondition to enable the achievement of the Sustainable Development Goals. Delivering appropriate mobility services that provide access to jobs, social opportunities, health and education to everyone requires concerted action from the national, regional and local levels. The principle of subsidiarity was emphasised by the New Urban Agenda considering that local infrastructure and policy decisions need to be enabled by the provision of sufficient funds from the national level. Urban mobility is vital enablers for social and economic development and with that the key to achieve the Sustainable Development Goals and access and mobility are regarded as basic human rights, which needs strong support from the local and national policy level (UN 2016a). Mid-sized cities in emerging economies will play a vital role in global decarbonisation efforts. The following section outlines scenarios for two cities, which have been actively engaged in the SOLUTIONS project and who represent a growing number of second-trier

cities that will face a rapid growth of mobility demand over the coming decades. The scenarios outline a path towards 2 degree Celsius scenario (2DS) and 1.5 degree Celsius scenario (1.5DS) in Belo Horizonte, Brazil and Kochi, India and compare this to a Business-as-Usual (BAU) reference case. This aims to highlight possible developments for the cities and propose measures in the context of an integrated mobility policy package. Implementing sustainable urban mobility measures in mid-sized cities is a process that can be supported by a number of actions. The following section explores two cities, one from Asia and one from Latin America that represent a rapidly growing group of mid-sized cities that hold the key to decarbonising the transport sector in the context of inclusive, sustainable urban development. Urban Mobility in Belo Horizonte, Brazil In recent years, Brazil has experienced rapid urbanization and motorization. Belo Horizonte City, the capital of the State of Minas Gerais, with a population of nearly 2.5 million and 5.7 million people live in the metropolitan area, is one example of such development. The Belo Horizonte metropolitan region hosts one of the main industrial parks in Brazil. The volume of commuting trips to and from the central area is considerable. Falling behind of the rapidly developing economy, attractive transportation alternatives are still lacking: according to the 2012 household travel survey in Belo Horizonte, 65% of the daily trips are carried by motorized vehicles and only 0.4% by bicycles (BHTRANS 2016). As the first city in Brazil, Belo Horizonte developed a Sustainable Urban Mobility Plan, (Plan-Mob-BH), with measures including Transit Oriented Development (TOD), Bus Rapid Transit (BRT) and bicycling solutions with a long-term vision linking mobility to the urban development goals. The plan includes targets such as the reduction of GHG emissions by 20% by 2030 (base year 2007) ~0.5 MtCO2, at least 20% low carbon buses by 2025, and at least 40% low carbon vehicles (1180 buses) by 2030 (SOLUTIONS 2016a). To monitor and evaluate the implementation of PlanMob-BH through specific indicators, the city created an Urban Mobility Observatory and a Mobility Council, two important entities of social control and dialogue, which are responsible for collecting civil society demands and providing information for improving mobility. In 2017, the city worked on a technical review of the PlanMob-Bh, adapting current and new projects, policies and new targets for 2030. Some of the measures to rationalize the use of individual motorized vehicles are low emissions zones, parking management and congestion charges. New projects to improve the public transport includes: expand MOVE BRT, increase the length of dedicate bus lanes and support the implementation of line 2 and 3 of the Metro. For walking and cycling, Belo Horizonte plans cycling infrastructure of 400 km by 2020, 750 km by 2025 and 1,000 km by 2030. Also seeks to improve pedestrian infrastructure and implement Zone 30 (BHTRANS 2017). Urban Mobility in Kochi, India Kochi is the second largest city in the south-western Indian state Kerala. Kochi is also a major Indian port-city on the south-west coast. The municipal corporation of Kochi has a population of over 600,000 inhabitants and the metropolitan region is home for over 2 million inhabitants. With rapid urbanisation Kochi, like many other growing Indian cities, faces a pressure to increase the facilities to cater for the movement of its people (SOLUTIONS 2016b). The traditional forms of transport in Kochi i.e. waterways, bus transport, walking and cycling, are becoming increasingly unpopular in particular among the growing middle class. This has led to a rapid motorisation, both in motorised two-wheelers and personal cars and also the fleet of auto-rickshaws has increased substantially (from 61k to 87k in only one year from 2013 to 2014) (UMTC 2015). To strengthen walking,
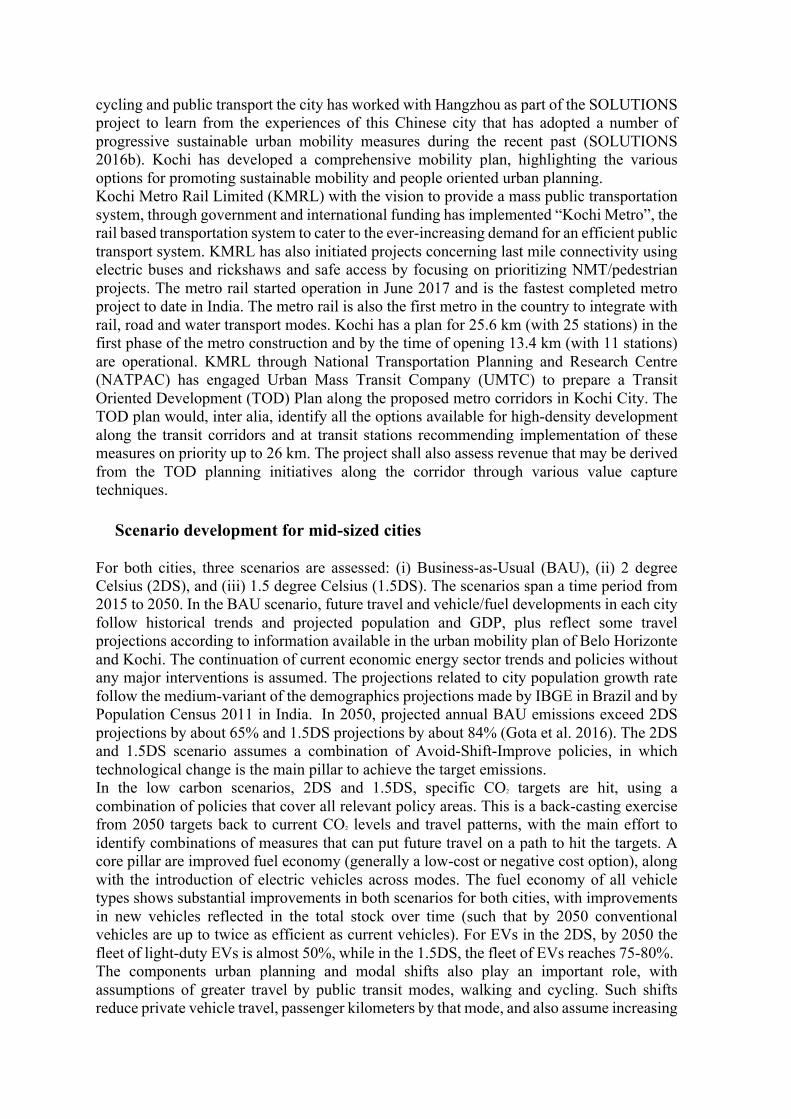
cycling and public transport the city has worked with Hangzhou as part of the SOLUTIONS project to learn from the experiences of this Chinese city that has adopted a number of progressive sustainable urban mobility measures during the recent past (SOLUTIONS 2016b). Kochi has developed a comprehensive mobility plan, highlighting the various options for promoting sustainable mobility and people oriented urban planning. Kochi Metro Rail Limited (KMRL) with the vision to provide a mass public transportation system, through government and international funding has implemented “Kochi Metro”, the rail based transportation system to cater to the ever-increasing demand for an efficient public transport system. KMRL has also initiated projects concerning last mile connectivity using electric buses and rickshaws and safe access by focusing on prioritizing NMT/pedestrian projects. The metro rail started operation in June 2017 and is the fastest completed metro project to date in India. The metro rail is also the first metro in the country to integrate with rail, road and water transport modes. Kochi has a plan for 25.6 km (with 25 stations) in the first phase of the metro construction and by the time of opening 13.4 km (with 11 stations) are operational. KMRL through National Transportation Planning and Research Centre (NATPAC) has engaged Urban Mass Transit Company (UMTC) to prepare a Transit Oriented Development (TOD) Plan along the proposed metro corridors in Kochi City. The TOD plan would, inter alia, identify all the options available for high-density development along the transit corridors and at transit stations recommending implementation of these measures on priority up to 26 km. The project shall also assess revenue that may be derived from the TOD planning initiatives along the corridor through various value capture techniques.
Scenario development for mid-sized cities For both cities, three scenarios are assessed: (i) Business-as-Usual (BAU), (ii) 2 degree Celsius (2DS), and (iii) 1.5 degree Celsius (1.5DS). The scenarios span a time period from 2015 to 2050. In the BAU scenario, future travel and vehicle/fuel developments in each city follow historical trends and projected population and GDP, plus reflect some travel projections according to information available in the urban mobility plan of Belo Horizonte and Kochi. The continuation of current economic energy sector trends and policies without any major interventions is assumed. The projections related to city population growth rate follow the medium-variant of the demographics projections made by IBGE in Brazil and by Population Census 2011 in India. In 2050, projected annual BAU emissions exceed 2DS projections by about 65% and 1.5DS projections by about 84% (Gota et al. 2016). The 2DS and 1.5DS scenario assumes a combination of Avoid-Shift-Improve policies, in which technological change is the main pillar to achieve the target emissions. In the low carbon scenarios, 2DS and 1.5DS, specific CO2 targets are hit, using a combination of policies that cover all relevant policy areas. This is a back-casting exercise from 2050 targets back to current CO2 levels and travel patterns, with the main effort to identify combinations of measures that can put future travel on a path to hit the targets. A core pillar are improved fuel economy (generally a low-cost or negative cost option), along with the introduction of electric vehicles across modes. The fuel economy of all vehicle types shows substantial improvements in both scenarios for both cities, with improvements in new vehicles reflected in the total stock over time (such that by 2050 conventional vehicles are up to twice as efficient as current vehicles). For EVs in the 2DS, by 2050 the fleet of light-duty EVs is almost 50%, while in the 1.5DS, the fleet of EVs reaches 75-80%. The components urban planning and modal shifts also play an important role, with assumptions of greater travel by public transit modes, walking and cycling. Such shifts reduce private vehicle travel, passenger kilometers by that mode, and also assume increasing

load factors in both scenarios compared to BAU. A summary of the assumptions is described in Table 2, which provides the basis for the policy actions that need to be taken to achieve those scenarios (see chapter 7). Table 2: Assumptions and policy implications for BAU, 2DS and 1.5DS projections
BAU 2DS 1.5DS
Vehicle stock- ICE
In Belo Horizonte, we are assuming a growth rate of 1%-3% to all modes. In Kochi the growth rate is more aggressive, 0.7%-8%, but in some cases it slowed over time
Fleet will growth till 2025 equal to BAU, then start decreasing and by 2050 is 3%-15% lower compared to BAU
Fleet will growth till 2025 equal to BAU, then start decreasing and by 2050 is 5%-20% lower compared to BAU
Vehicle stock – EV
Both cities we are assuming a range of 1-10% of EV fleet for all modes
Range of 40-50% of EV for all modes
Range of 50-80% of EV for all modes
Average annual travel per vehicle
Assuming a growth of 2.5% every 5 year for Car, M2W and M3W
Growth equal to BAU till 2020, start decreasing and by 2050 is 11-30% lower compared to BAU, considering the modes - Car, M2W and M3W. Large buses and minibuses do not change
Growth equal to BAU till 2020, start decreasing and by 2050 is 25-40% lower compared to BAU, considering the modes - Car, M2W and M3W. Large buses and minibuses do not change
Load factor
For car, assuming it will decrease occupancy 2%-5% every 5 years. For other modes no significant changes
Increasing the occupancy in 2020 and by 2050 will be 6%-15% higher compared to BAU
Increasing the occupancy in 2020 and by 2050 will be 9%-23% higher compared to BAU
Fuel type
Only in Belo Horizonte we are assuming a blend of 25% ethanol/75% gasoline and 7% biodiesel/93% diesel
A blend of 35% ethanol/65% gasoline and 20% biodiesel/80% diesel (only in Belo Horizonte)
A blend of 50% ethanol/50% gasoline and 20% biodiesel/80% diesel (only in Belo Horizonte)
Fuel economy
Improve fuel economy 3% every 5 years
Same improvements as BAU till 2030, then increase the improvements and by 2050 is 3%-5% more efficient compared to BAU
Same improvements as BAU till 2030, then increase the improvements and by 2050 is 5%-7% more efficient compared to BAU
Results and discussion This section presents the results of the scenarios, in terms of CO2 emissions, energy consumption, mode shares and the combination of policies and measures we have used to capture the “Avoid-Shift-Improve” potential in the scenarios. The following section presents data and projections for Belo Horizonte and Kochi to enable comparisons between the two cities along this section. CO2 emissions and energy use of the scenarios The results of total CO2 emissions for urban mobility in the BAU, 2DS and 1.5DS are shown for each city in Figure 2. In the BAU scenario the CO2 emissions would increase in Belo Horizonte from 2 MtCO2 in 2015 to 2.7 MtCO2 by 2050, and in Kochi from 1.1 MtCO2 to 2.1 MtCO2, more than 85% of the emissions in 35 years. In Belo Horizonte, the emissions would
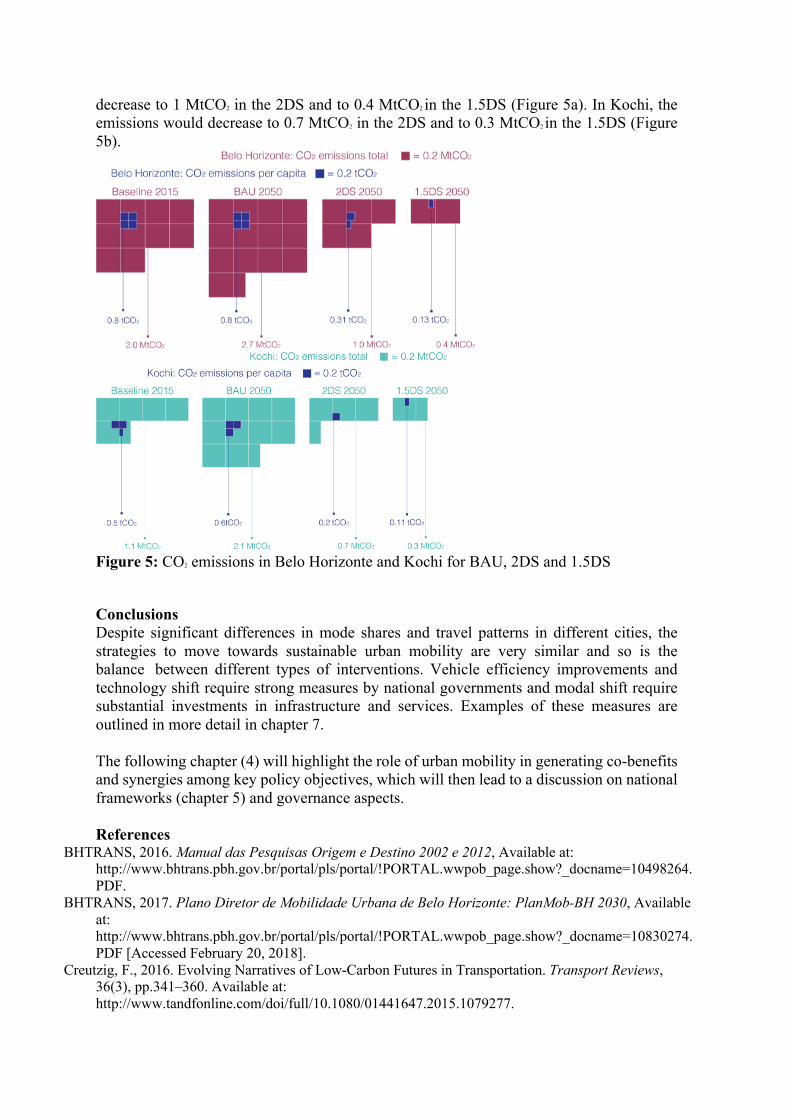
decrease to 1 MtCO2 in the 2DS and to 0.4 MtCO2 in the 1.5DS (Figure 5a). In Kochi, the emissions would decrease to 0.7 MtCO2 in the 2DS and to 0.3 MtCO2 in the 1.5DS (Figure 5b).
Figure 5: CO2 emissions in Belo Horizonte and Kochi for BAU, 2DS and 1.5DS
Conclusions Despite significant differences in mode shares and travel patterns in different cities, the strategies to move towards sustainable urban mobility are very similar and so is the balance between different types of interventions. Vehicle efficiency improvements and technology shift require strong measures by national governments and modal shift require substantial investments in infrastructure and services. Examples of these measures are outlined in more detail in chapter 7. The following chapter (4) will highlight the role of urban mobility in generating co-benefits and synergies among key policy objectives, which will then lead to a discussion on national frameworks (chapter 5) and governance aspects. References
BHTRANS, 2016. Manual das Pesquisas Origem e Destino 2002 e 2012, Available at: http://www.bhtrans.pbh.gov.br/portal/pls/portal/!PORTAL.wwpob_page.show?_docname=10498264.PDF.
BHTRANS, 2017. Plano Diretor de Mobilidade Urbana de Belo Horizonte: PlanMob-BH 2030, Available at: http://www.bhtrans.pbh.gov.br/portal/pls/portal/!PORTAL.wwpob_page.show?_docname=10830274.PDF [Accessed February 20, 2018].
Creutzig, F., 2016. Evolving Narratives of Low-Carbon Futures in Transportation. Transport Reviews, 36(3), pp.341–360. Available at: http://www.tandfonline.com/doi/full/10.1080/01441647.2015.1079277.

Dhar, S., Pathak, M. & Shukla, P.R., 2018. Transformation of India’s transport sector under global warming of 2 °C and 1.5 °C scenario. Journal of Cleaner Production. Available at: http://www.sciencedirect.com/science/article/pii/S0959652617323697?_rdoc=1&_fmt=high&_origin=gateway&_docanchor=&md5=b8429449ccfc9c30159a5f9aeaa92ffb [Accessed November 6, 2017].
Fulton, L., Cazzola, P. & Cuenot, F., 2009. IEA Mobility Model (MoMo) and its use in the ETP 2008. Energy Policy, 37(10), pp.3758–3768.
Gota, S., Huizenga, C. & Peet, K., 2016. Implications of 2DS and 1 . 5DS for Land Transport Carbon Emissions in 2050. , (November), pp.1–61.
IBGE IEA, 2016. Energy, Climate Change and Enviroment 2016 Insights. , p.133. Available at:
http://www.iea.org/publications/freepublications/publication/ECCE2016.pdf. IEA, 2017. Energy Technology Perspectives 2017, IEA, 2013. Policy Pathway A policy guide on how to transform cities by improving energy efficiency in
urban transport systems, Available at: http://www.iea.org/publications/freepublications/publication/Renewed_Cities_WEB.pdf [Accessed January 31, 2018].
Lèbre La Rovere, E. et al., 2015. Pathways to deep decarbonization in Brazil. Available at: http://deepdecarbonization.org/wp-content/uploads/2015/12/DDPP_BRA.pdf [Accessed July 8, 2017].
Schipper, L., Marie-Lilliu, C. & Gorham, R., 2000. Transportation and CO2 emissions: Flexing the link-a path for the World Bank, Paris, France.
SOLUTIONS, 2016a. SOLUTIONS in Latin America: Urban mobility needs, policy barriers and the uptake of sustainable solutions in Latin American partner countries,
SOLUTIONS, 2016b. SOLUTIONS in Asia: Urban mobility needs, policy barriers and the uptake of sustainable solutions in Asian partner countries,
UMTC, 2015. Comprehensive Mobility Plan for Greater Kochi Region, Available at: https://kochimetro.org/rfp-comprehensive-mobility-plan-and-parking-master-plan-for-greater-kochi-region/.