isabel whisson rozina haque julie kedroske munshi sulaiman
TRANSCRIPT

Isabel WhissonRozina Haque
Julie KedroskeMunshi Sulaiman
Imran MatinNarayan Das
Syed Hashemi


The State of Economic Inclusion Report 2021
THE POTENTIAL TO SCALE
Isabel Whisson, Rozina Haque, Julie Kedroske, Munshi Sulaiman, Imran Matin, Narayan Das, and
Syed Hashemi
CASE STUDY 3: ADAPTING BRAC’S GRADUATION PROGRAM TO THE CHANGING POVERTY CONTEXT IN BANGLADESH
© 2021 International Bank for Reconstruction and Development / The World Bank1818 H Street NW, Washington, DC 20433Telephone: 202-473-1000; Internet: www.worldbank.org
Some rights reserved
This work is a product of the staff of The World Bank with external contributions. The findings, interpretations, and conclusions expressed in this work do not necessarily reflect the views of The World Bank, its Board of Executive Directors, or the governments they represent. The World Bank does not guarantee the accuracy, completeness, or currency of the data included in this work and does not assume responsibility for any errors, omissions, or discrepancies in the information, or liability with respect to the use of or failure to use the information, methods, processes, or conclusions set forth. The boundaries, colors, denominations, and other information shown on any map in this work do not imply any judgment on the part of The World Bank concerning the legal status of any territory or the endorsement or acceptance of such boundaries.
Nothing herein shall constitute or be construed or considered to be a limitation upon or waiver of the privileges and immunities of The World Bank, all of which are specifically reserved.
Rights and Permissions
This work is available under the Creative Commons Attribution 3.0 IGO license (CC BY 3.0 IGO) http://creativecommons.org/licenses/by/3.0/igo. Under the Creative Commons Attribution license, you are free to copy, distribute, transmit, and adapt this work, including for commercial purposes, under the following conditions:
Attribution—Please cite the work as follows: Whisson, Isabel, Rozina Haque, Julie Kedroske, Munshi Sulaiman, Imran Matin, Narayan Das, and Syed Hashemi. 2021. “The State of Economic Inclusion Report 2021: The Potential to Scale. Case Study 3: Adapting BRAC’s Graduation Program to the Changing Poverty Context in Bangladesh.” Washington, DC: World Bank. License: Creative Commons Attribution CC BY 3.0 IGO.
Translations—If you create a translation of this work, please add the following disclaimer along with the attribution: This translation was not created by The World Bank and should not be considered an official World Bank translation. The World Bank shall not be liable for any content or error in this translation.
Adaptations—If you create an adaptation of this work, please add the following disclaimer along with the attribution: This is an adaptation of an original work by The World Bank. Views and opinions expressed in the adaptation are the sole responsibility of the author or authors of the adaptation and are not endorsed by The World Bank.
Third-party content—The World Bank does not necessarily own each component of the content contained within the work. The World Bank therefore does not warrant that the use of any third-party-owned individual component or part contained in the work will not infringe on the rights of those third parties. The risk of claims resulting from such infringement rests solely with you. If you wish to re-use a component of the work, it is your responsibility to determine whether permission is needed for that re-use and to obtain permission from the copyright owner. Examples of components can include, but are not limited to, tables, figures, or images.
All queries on rights and licenses should be addressed to World Bank Publications, The World Bank Group, 1818 H Street NW, Washington, DC 20433, USA; e-mail: [email protected].
Cover and interior design: Will Kemp, World Bank Group
This booklet contains the case study, as well as a list of contents, from The State of Economic Inclusion Report 2021: The Potential to Scale, doi: 10.1596/978-1-4648-1598-0. A PDF of the final book, once published, will be available at https://openknowledge.worldbank.org/ and http://documents.worldbank.org/, and print copies can be ordered at www.amazon.com. Please use the final version of the book for citation, reproduction, and adaptation purposes.

iii
Contents
Foreword . . . . . . . . . . . . . . . . . . . . . . . . . . . . . . . . . . . . . . . . . . . . . . . . . . . . . . . . . . . . . . . . . . . v
Case Study 3: Adapting BRAC’s Graduation Program to the Changing Poverty Context in Bangladesh . . . . . . . . . . . . . . . . . . . . . . . . . . . . . . . . . . . . . . . . . . . . . . . . . . . . . 1
Introduction . . . . . . . . . . . . . . . . . . . . . . . . . . . . . . . . . . . . . . . . . . . . . . . . . . . . . . . . . . . . . . . . .1
BRAC’s 2017 programmatic shifts . . . . . . . . . . . . . . . . . . . . . . . . . . . . . . . . . . . . . . . . . . . . . 6
Lessons . . . . . . . . . . . . . . . . . . . . . . . . . . . . . . . . . . . . . . . . . . . . . . . . . . . . . . . . . . . . . . . . . . . 10
Notes . . . . . . . . . . . . . . . . . . . . . . . . . . . . . . . . . . . . . . . . . . . . . . . . . . . . . . . . . . . . . . . . . . . . . .13
References . . . . . . . . . . . . . . . . . . . . . . . . . . . . . . . . . . . . . . . . . . . . . . . . . . . . . . . . . . . . . . . . .13
Contents of The State of Economic Inclusion Report 2021: The Potential to Scale . . . . . . . . . . . . . . . . . . . . . . . . . . . . . . . . . . . . . . . . . . . . . . . . . . . . . . . . 14


v
Foreword
The State of Economic Inclusion Report 2021: The Potential to Scale gives voice to one of the most stubborn challenges in development—transforming the economic lives of the extreme poor and vulnerable. At the time of writing, this
challenge is being magnified by the fallout of the COVID-19 pandemic. The pandemic affects the poor and vulnerable most strongly, with early evidence suggesting dispro-portionate gender impacts. Economic inclusion programs face the dual challenge of adapting delivery norms during a pandemic and ensuring readiness to respond as part of the medium- and long-term recovery efforts.
Against a backdrop of much uncertainty, this report provides some hope. A central hypothesis of the report is that people who are poor and vulnerable face multiple constraints when encountering “poverty traps” for which a multidimensional response is required. Economic inclusion programs now under way in over 75 countries demonstrate that this hypothesis and response show signs of success. Defined here as a bundle of coordinated multidimensional interventions that support individuals, households, and communities in increasing incomes and assets, economic inclusion programs show flexibility in a variety of settings. One area with transformative potential is women’s economic empowerment. There is now a considerable body of operational work focused on explicit gender-intentional program design to promote empowerment and mitigate unintended household and community risks.
The global landscape for economic inclusion has shifted significantly in recent years. A surge in global operations is driven by the scale-up of government-led programs that build on social protection, livelihoods and jobs, and financial inclusion investments. Continued momentum draws on a wealth of innovation and learning, spanning several technical experiences and domains, including graduation, social safety nets “plus,” and community-driven programs as well as local economic development initiatives. A major contribution of this report is to present—for the first time—a systematic review of both government and nongovernment efforts. Evidence gathered in the report provides a unique baseline to benchmark the current global landscape and will enable us to track how it evolves in coming years.
All of this brings to the fore a central question: What is the potential for these multidimensional programs to scale up? The true potential of economic inclusion programs will be unlocked through the scale that is achieved through adoption by government actors. Many countries are at a nascent stage of this journey and wrestling with questions of program feasibility and sustainability. For this reason, the report focuses squarely on the political realities surrounding program scale-up and the manifold trade-offs that governments face in moving this agenda forward. The report highlights opportunities for improved program delivery and fiscal and policy coherence with stronger leadership and collaboration. Of course, successful government-led interventions also require strong partnership at the local level, with community organizations, nongovernmental organizations (NGOs), and the private sector.
The State of Economic Inclusion Report 2021 emphasizes the possibility of leveraging social protection systems and the cross-sectoral collaboration that this involves. Recent years have seen a strong increase in financing and coverage of social protection programs across the world, with a demonstrated set of impacts reflecting how cash transfers, in particular, can boost the equity and resilience of the poorest. As countries expand the coverage and financing of this form of social protection, the terms safety nets–plus and

vi
T H E S T A T E O F E C O N O M I C I N C L U S I O N R E P O R T 2 0 2 1 : T H E P O T E N T I A L T O S C A L E
cash-plus are gaining prominence, the “plus” indicating the potential to complement cash with additional inputs and service components or link to other sectors (agriculture, environment, financial services, and so forth). Economic inclusion is a key driver of the social safety nets–plus agenda, demonstrating particular promise to strengthen program impacts, but also bringing with it the reality of increased costs and complexity.
For this reason, the report moves forward key debates on program impact and costs, which are central to the sustainability of economic inclusion programs at scale. The report identifies a promising and potentially sustained set of impacts across a wide range of outcomes. A multicountry costing analysis helps to clarify the major cost driv-ers and cost ranges in different programs. Notably, the discussion brings into focus the need to rebalance debates on impacts and costs to reflect a shift from stand-alone nonprofit-led projects to government-led programs. This will have important opera-tional implications for identifying cost-effective interventions and for cost optimization. Continued learning and evidence generation will be especially important as programs adapt to changing poverty contexts and megatrends, such as fragility, shocks (including climate change), urbanization, digitization, and demography.
As a flagship publication under the Partnership for Economic Inclusion (PEI), the report places a welcome emphasis on joint learning and collaboration. PEI is a dedi-cated platform to support the adoption and adaptation of national economic inclusion programs working with a variety of stakeholders, including national governments and bilateral, multilateral, NGO, research, and private-sector organizations. The partnership network is critical for contributing to evidence-based good practice, crowding in exper-tise, and providing a platform to refine and share cutting-edge knowledge on economic inclusion, with a strong emphasis on women’s economic inclusion. As an example of this joint learning, the report is launched with an online and open-access PEI Data Portal (www.peiglobal.org), which will facilitate cross-learning and help track the development of the global landscape in years to come.
To this end, we welcome The State of Economic Inclusion Report 2021 as an important milestone for continued learning in the common mission to support the scale-up of cost-effective and sustainable economic inclusion programs for the poorest in the years to come.
We look forward to continued and successful collaboration.
Michal RutkowskiGlobal DirectorSocial Protection and Jobs, World Bank
Rakesh RajaniVice President, ProgramsCo-Impact
Shameran AbedSenior DirectorBRAC
Birgit PickelDeputy Director GeneralBMZ (Federal Ministry for Economic Cooperation and Development, Germany)

1
C A S E S T U D Y 3
Adapting BRAC’s Graduation Program to the Changing Poverty Context in Bangladesh
Introduction
BRAC, an international nongovernmental organization (NGO) headquartered in Bangladesh, was already engaged in large-scale development programming when it began to develop its flagship graduation program. Prompted to rethink its approach in the early 2000s when evaluations revealed that its existing programs to promote food security and livelihoods were not serving the needs of the poorest, BRAC devel-oped a new program that was scaled up nationwide within a few years. Building on the experience and infrastructure of its other programs, BRAC saw its program reach over 2 million households by 2020, with some 100,000 female heads of households accepted into the program each year. Randomized controlled trials of BRAC’s program revealed sizable economic impacts that have been sustained seven years after participants entered the program (Bandiera et al. 2017).
This case study explores BRAC’s experience evolving the graduation approach over the last 20 years, paying special attention to the lessons for governments and NGOs alike that have emerged from the most recent periods of implementation. Specifically, this case study looks at how, since the program started in 2002, BRAC has sought to ensure high program quality and maximize sustainable impacts, at scale, in a chang-ing poverty context. By employing a historical perspective from nearly two decades of program implementation, the study reflects the reality that graduation and economic inclusion programs require staying power enabled by long-term investment and innova-tion supported by research.
The case study brings into focus aspects of program delivery, emphasizing the principles and processes that have enabled the program’s strong impacts and the rigorous learning practices undertaken by BRAC to correct course when the program has shown signs of ineffectiveness. BRAC has attributed the success of the program largely to an ethos of learning and critical self-evaluation that is deeply embedded in the way BRAC has developed and continually improved the program. After nearly 15 years of implementation, however, it became clear that the program’s components needed more significant reimagining. BRAC relied heavily on research and evalua-tion teams to provide the analytical basis for changes to what were previously consid-ered the core elements of its graduation model. This case study looks into how, despite compelling external evidence that BRAC’s program was having an impact, the organiza-tion transformed the program, introducing new elements not previously associated with graduation programming. It will situate this series of decisions and activities within the broader context of the evolution of the program and the shifting poverty context of Bangladesh since the early 2000s.
This case study was written by Isabel Whisson, with contributions from Rozina Haque, Julie Kedroske, and Munshi Sulaiman (from BRAC), and Imran Matin, Narayan Das, and Syed Hashemi (from BRAC University).
2
T H E S T A T E O F E C O N O M I C I N C L U S I O N R E P O R T 2 0 2 1 : T H E P O T E N T I A L T O S C A L E
Context
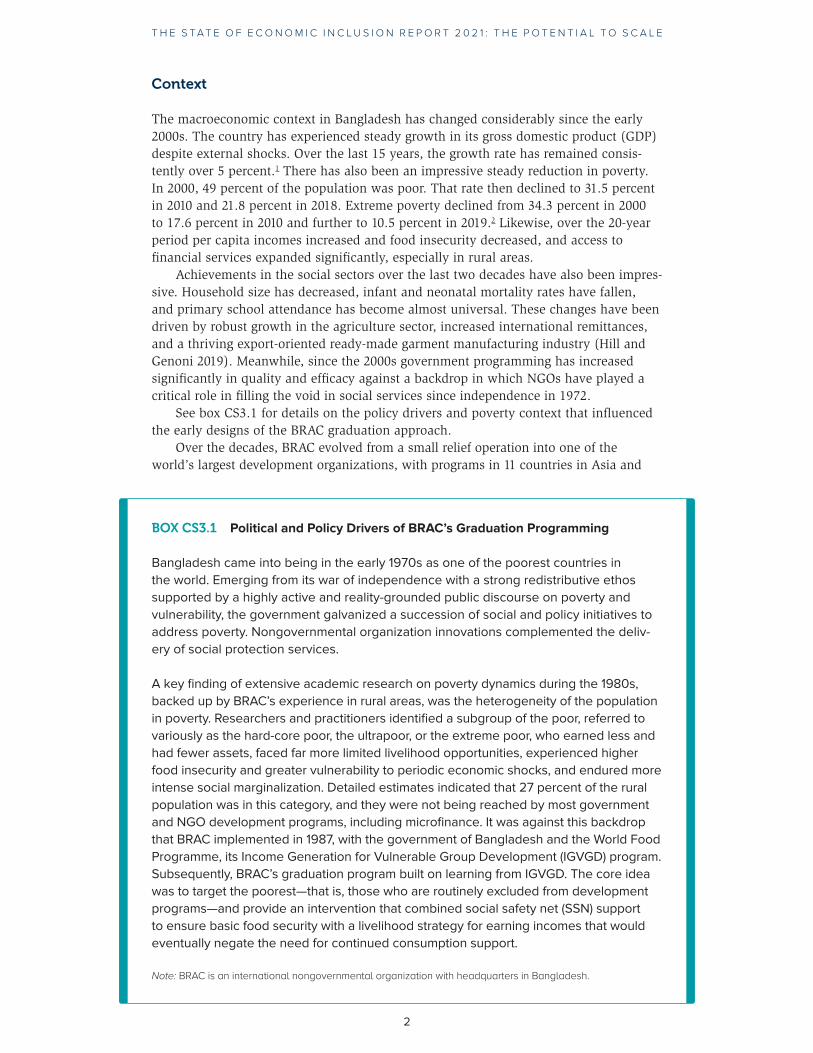
The macroeconomic context in Bangladesh has changed considerably since the early 2000s. The country has experienced steady growth in its gross domestic product (GDP) despite external shocks. Over the last 15 years, the growth rate has remained consis-tently over 5 percent.1 There has also been an impressive steady reduction in poverty. In 2000, 49 percent of the population was poor. That rate then declined to 31.5 percent in 2010 and 21.8 percent in 2018. Extreme poverty declined from 34.3 percent in 2000 to 17.6 percent in 2010 and further to 10.5 percent in 2019.2 Likewise, over the 20-year period per capita incomes increased and food insecurity decreased, and access to financial services expanded significantly, especially in rural areas.
Achievements in the social sectors over the last two decades have also been impres-sive. Household size has decreased, infant and neonatal mortality rates have fallen, and primary school attendance has become almost universal. These changes have been driven by robust growth in the agriculture sector, increased international remittances, and a thriving export-oriented ready-made garment manufacturing industry (Hill and Genoni 2019). Meanwhile, since the 2000s government programming has increased significantly in quality and efficacy against a backdrop in which NGOs have played a critical role in filling the void in social services since independence in 1972.
See box CS3.1 for details on the policy drivers and poverty context that influenced the early designs of the BRAC graduation approach.
Over the decades, BRAC evolved from a small relief operation into one of the world’s largest development organizations, with programs in 11 countries in Asia and
BOX CS3.1 Political and Policy Drivers of BRAC’s Graduation Programming
Bangladesh came into being in the early 1970s as one of the poorest countries in the world . Emerging from its war of independence with a strong redistributive ethos supported by a highly active and reality-grounded public discourse on poverty and vulnerability, the government galvanized a succession of social and policy initiatives to address poverty . Nongovernmental organization innovations complemented the deliv-ery of social protection services .
A key finding of extensive academic research on poverty dynamics during the 1980s, backed up by BRAC’s experience in rural areas, was the heterogeneity of the population in poverty. Researchers and practitioners identified a subgroup of the poor, referred to variously as the hard-core poor, the ultrapoor, or the extreme poor, who earned less and had fewer assets, faced far more limited livelihood opportunities, experienced higher food insecurity and greater vulnerability to periodic economic shocks, and endured more intense social marginalization . Detailed estimates indicated that 27 percent of the rural population was in this category, and they were not being reached by most government and NGO development programs, including microfinance. It was against this backdrop that BRAC implemented in 1987, with the government of Bangladesh and the World Food Programme, its Income Generation for Vulnerable Group Development (IGVGD) program . Subsequently, BRAC’s graduation program built on learning from IGVGD . The core idea was to target the poorest—that is, those who are routinely excluded from development programs—and provide an intervention that combined social safety net (SSN) support to ensure basic food security with a livelihood strategy for earning incomes that would eventually negate the need for continued consumption support .
Note: BRAC is an international nongovernmental organization with headquarters in Bangladesh.

T H E S T A T E O F E C O N O M I C I N C L U S I O N R E P O R T 2 0 2 1 : T H E P O T E N T I A L T O S C A L E
3
Sub-Saharan Africa. In the field of economic inclusion, BRAC is widely associated with the graduation approach—a programming methodology that promotes strong livelihood, social empowerment, and financial inclusion outcomes for the poorest populations. The flagship graduation program, which BRAC launched in 2002 in Bangladesh as a pilot with 5,000 households, now enrolls up to 100,000 households a year. This rapid scale-up was enabled by a large network of branch offices established by BRAC’s microfinance program, which already operated nationwide. As of 2020, the program in Bangladesh had reached more than 2 million households—nearly 9 million people. Rigorous eval-uations conducted by BRAC’s independent research arm and the London School of Economics have revealed significant impacts across a range of development indicators, including income, asset value, consumption, and savings (Bandiera et al. 2017).
Yet after more than a decade of implementation, the drivers of poverty and political economy had begun to shift in Bangladesh, prompting a redesign of BRAC’s program. Consistent economic growth and the government’s investment in public services have contributed to significantly changing the context of extreme poverty in Bangladesh. According to BRAC, the annual household income of the poorest participants entering the program rose from $80 in 2002 to $188 in 2016. Food insecurity was all but resolved in Bangladesh, as reflected in the higher spending on nonfood expenditures, even by the poorest. The daily per capita food expenditure of households entering the program increased from $0.30 in 2002 to $0.48 in 2016. Indicators of education and hygiene also improved. By 2016, 13 percent of household heads were literate, compared with just 4 percent in 2002, and 43 percent had a sanitary latrine, compared with 7 percent in 2002. It was also increasingly common for the poorest households to have access to some services provided by government, NGOs, or microfinance institutions. In addi-tion to the changed nature of poverty, the geographic spread of poverty in Bangladesh shifted as well. Whereas the program had originally been implemented in 42 districts of Bangladesh (roughly two-thirds of the country), by 2016 the remaining pockets of extreme poverty were concentrated in fewer areas.
Beyond macroeconomic changes in Bangladesh that rendered aspects of the current program less relevant, analysis of data from the randomized controlled trial revealed the significant heterogeneity of impacts. Although the data showed significant positive impacts on average, they obscured the fact that many participants thrived considerably, while many were only nominally better off and did not demonstrate a strong trajec-tory in livelihood growth (Bandiera et al. 2012). This pattern was clear-cut among older women who often had limited ability to engage in income-generating activities.
BRAC graduation approach, an iterative response
Although BRAC is known for the graduation approach, the effectiveness of the program has been sustained over a long period of time through continual adaptation. Developed in the early 2000s, the program was born out of learning from BRAC’s previous long period of program implementation. It was established to address the finding by eval-uators at BRAC that its existing programs did not do enough to build the long-term capacity of the poorest households it was reaching across Bangladesh to enter into sustainable livelihoods. A continued assessment of the program’s responsiveness to a changing poverty context, enabled by learning processes that were embedded into all aspects of program development, iteration, rollout, scale-up, and implementation, were key to ensuring the program’s continued relevance.
From 2002 to 2016, BRAC implemented several iterations of the graduation program. It rigorously targeted the poorest households in communities across the 42 districts of Bangladesh known to have the deepest pockets of extreme poverty. Female heads of households were entered into a program that included (1) a weekly stipend to cover

4
T H E S T A T E O F E C O N O M I C I N C L U S I O N R E P O R T 2 0 2 1 : T H E P O T E N T I A L T O S C A L E
essential needs for the first few months; (2) enterprise training; (3) productive asset transfers (valued at approximately $100); (4) weekly household coaching and monitor-ing visits; (5) access to savings; (6) biweekly visits from a community health worker; (7) life skills development training; and (8) monthly meetings of the village poverty reduction committee. This program lasted 24 months at a cost of $450–$550 per house-hold. Meanwhile, BRAC realized that another population was slightly better-off than the poorest but was nonetheless too vulnerable for microfinance alone. For this second group, BRAC adjusted the graduation program to include the same components just described, with the stipulation that assets would be transferred as part of a soft loan that participants would have to repay over the course of the program period.
In a more recent round of changes starting in 2017, BRAC again confronted the need to significantly reform its long-standing graduation program. This process was guided by two questions: Which program elements are essential for the extreme poor in the current context? What elements or components of the program could BRAC optimize to be more efficient?
Four design and implementation considerations loomed large in these discussions:
1. Heterogeneity of impacts. Women over a certain age invested less time and money in their enterprises and saw smaller economic gains.
2. Sustainability of impact. Livelihood packages needed to remain large enough for the poorest households to earn a decent income in an evolving market.
3. Shifts in financial capacity. Any continued financial support must account for chang-ing consumption patterns and levels of food security.
4. Operational and cost efficiencies. The program design and operations should explore opportunities to simplify or reduce inputs wherever it would not compromise impacts.
Although BRAC was open to revising all the components of the program, it remained faithful to two principles: (1) a focus on reaching the poorest, and (2) delivery of a package of interventions that would empower the poorest house-holds both socially and economically to attain sustainable livelihoods. These principles ensured that staff, who included some with decades of field experience, focused on the outcomes needed in modern-day Bangladesh and not simply on the activities they had been accustomed to implementing. Adaptive program design in support of outcomes was also enabled by a flexible funding agreement in place from 2011 to 2020 with the United Kingdom’s Department for International Development (DFID) and Australia’s Department for Foreign Affairs and Trade (DFAT).
BRAC segmented participant selection based on age group as well as wealth category. The core program would focus on women under the age of 50. Among this group, partici-pants were split into two groups—the poorest and those slightly better-off—with interven-tions tailored to each. Women over the age of 50 would receive a less resource- intensive package of support and would be connected to other government services.
The cost per household of implementing the program came down from $550 to approximately $350 for most participants. Although BRAC increased the value of the asset transfers, it also identified cost efficiencies in program components, management, and operations that enabled it to reduce the overall operating costs.
The program rolled out the changes in 2017 in a phased approach, initially to roughly half of its annual capacity—45,000 households—giving staff the space to work out kinks in implementation and enabling cross-learning among field staff. Once the program was scaled back up to 100,000 households in 2018, BRAC targeted the 36 districts in which poverty was most concentrated. The program further accounted for contextual differences in environment between regions. Box CS3.2 provides an overview of the newly designed program.

T H E S T A T E O F E C O N O M I C I N C L U S I O N R E P O R T 2 0 2 1 : T H E P O T E N T I A L T O S C A L E
5
BOX CS3.2 Overview of the BRAC Ultra Poor Graduation Program (2017 Onward)
Targeting Targeting was based on three approaches: (1) poverty mapping; (2) participatory rural appraisal; and (3) household verification via survey.
Program components for women under age 50 Productive asset transfer. Options include livestock such as cows, goats, and chick-ens, or a combination of agriculture, fisheries, and small trade. Assets are transferred as an interest-free partial loan valued at $200. Participants in both the poorest and better-off wealth categories repay 30–50 percent and 80 percent of the asset value, respectively, over 24 months.
Livelihood training. Ten days of enterprise development training, of which seven days are tailored to the specific enterprise a participant selected.
Financial services. Savings matched at 1:1, up to $1 .20 per month, and credit shield life insurance .
Life skills training. Biweekly group-based training on a range of topics related to child welfare, health, safety, and women’s issues .
Household coaching. Biweekly individual household visits to monitor progress of partici-pants, including their enterprises, understanding of life skills topics, and financial manage-ment, and to offer guidance and support.
Community mobilization and integration. Bimonthly village social solidarity committees (VSSCs) to promote social integration and raise voices of the extreme poor within the community.
Links to health care. Reserve fund is set aside in the event of medical emergencies, which BRAC would cover . For general ailments, local managers are present at the local government clinic for four hours one day a week to ensure that participants and their families can access health care as needed .
Intervention period. 24 months .
Program cost per household. $350 .
Program adaptations for women over age 50 Productive asset transfer. Options include livestock, agriculture, and small trade . Assets are transferred on a grant basis and are valued at $60–$95 . Participant does not receive credit shield insurance facility .
Links to government social safety nets. BRAC shares a list of participants with local govern-ment officials, so participants can enroll in a range of SSNs for which they may be eligible, including allowances for the elderly, widows, and persons with disabilities and other special programs . Because of government quotas, only a small proportion of participants are success-fully admitted .
Intervention period. 12 months .
Program cost per household. $200 .
Note: BRAC is an international nongovernmental organization with headquarters in Bangladesh.
6
T H E S T A T E O F E C O N O M I C I N C L U S I O N R E P O R T 2 0 2 1 : T H E P O T E N T I A L T O S C A L E
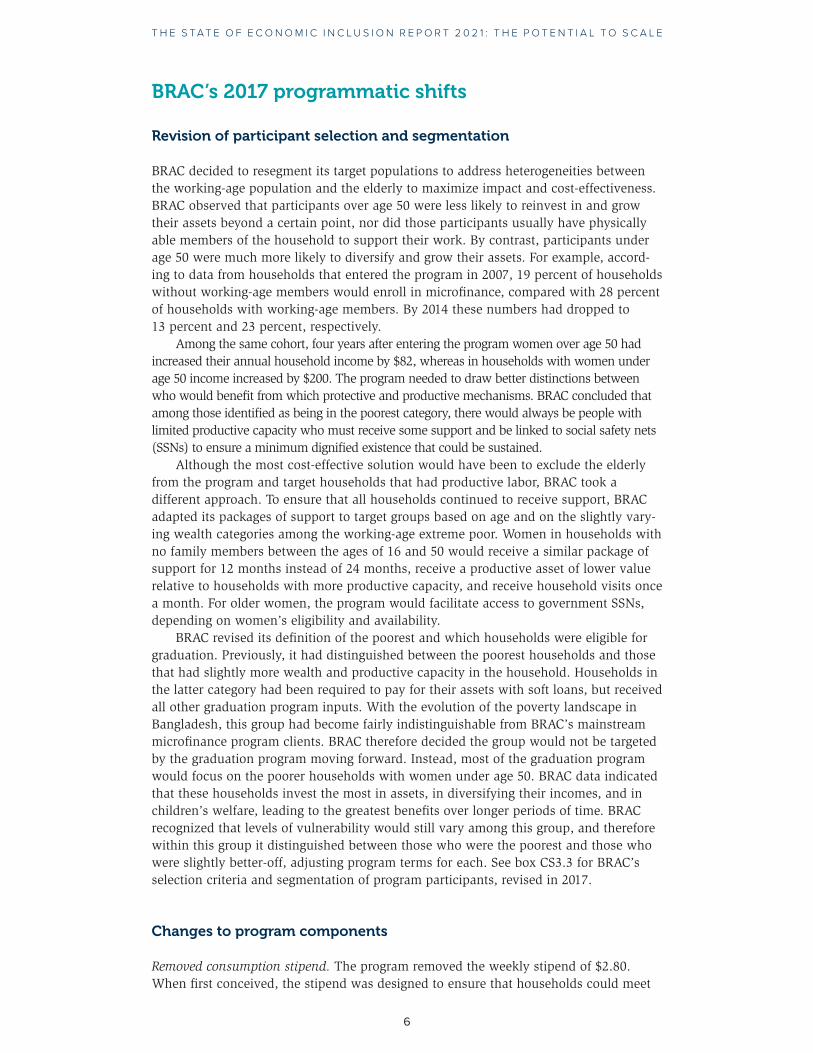
BRAC’s 2017 programmatic shifts
Revision of participant selection and segmentation
BRAC decided to resegment its target populations to address heterogeneities between the working-age population and the elderly to maximize impact and cost-effectiveness. BRAC observed that participants over age 50 were less likely to reinvest in and grow their assets beyond a certain point, nor did those participants usually have physically able members of the household to support their work. By contrast, participants under age 50 were much more likely to diversify and grow their assets. For example, accord-ing to data from households that entered the program in 2007, 19 percent of households without working-age members would enroll in microfinance, compared with 28 percent of households with working-age members. By 2014 these numbers had dropped to 13 percent and 23 percent, respectively.
Among the same cohort, four years after entering the program women over age 50 had increased their annual household income by $82, whereas in households with women under age 50 income increased by $200. The program needed to draw better distinctions between who would benefit from which protective and productive mechanisms. BRAC concluded that among those identified as being in the poorest category, there would always be people with limited productive capacity who must receive some support and be linked to social safety nets (SSNs) to ensure a minimum dignified existence that could be sustained.
Although the most cost-effective solution would have been to exclude the elderly from the program and target households that had productive labor, BRAC took a different approach. To ensure that all households continued to receive support, BRAC adapted its packages of support to target groups based on age and on the slightly vary-ing wealth categories among the working-age extreme poor. Women in households with no family members between the ages of 16 and 50 would receive a similar package of support for 12 months instead of 24 months, receive a productive asset of lower value relative to households with more productive capacity, and receive household visits once a month. For older women, the program would facilitate access to government SSNs, depending on women’s eligibility and availability.
BRAC revised its definition of the poorest and which households were eligible for graduation. Previously, it had distinguished between the poorest households and those that had slightly more wealth and productive capacity in the household. Households in the latter category had been required to pay for their assets with soft loans, but received all other graduation program inputs. With the evolution of the poverty landscape in Bangladesh, this group had become fairly indistinguishable from BRAC’s mainstream microfinance program clients. BRAC therefore decided the group would not be targeted by the graduation program moving forward. Instead, most of the graduation program would focus on the poorer households with women under age 50. BRAC data indicated that these households invest the most in assets, in diversifying their incomes, and in children’s welfare, leading to the greatest benefits over longer periods of time. BRAC recognized that levels of vulnerability would still vary among this group, and therefore within this group it distinguished between those who were the poorest and those who were slightly better-off, adjusting program terms for each. See box CS3.3 for BRAC’s selection criteria and segmentation of program participants, revised in 2017.
Changes to program components
Removed consumption stipend. The program removed the weekly stipend of $2.80. When first conceived, the stipend was designed to ensure that households could meet

T H E S T A T E O F E C O N O M I C I N C L U S I O N R E P O R T 2 0 2 1 : T H E P O T E N T I A L T O S C A L E
7
their necessary caloric intake and guard against selling off assets to pay for food. By 2016, even the poorest households were able to meet their basic food needs, and the value of the consumption stipend was deemed to bring a negligible financial benefit.
Increased value and choice of productive assets. Conversely, BRAC recognized that the approximate $100 value assigned to the productive assets provided before 2016 was no longer on pace with most markets and had limited income growth potential. The program doubled the value of the productive asset for women under 50, giving house-holds an even bigger push to becoming self-sufficient. This decision was informed by the study by Bandiera et al. (2017), which suggests that BRAC’s graduation program in earlier years had broken the poverty trap for the poorest by providing a sufficiently large injection of resources to enable the extreme poor to access productive opportu-nities otherwise inaccessible to them. Market assessments indicated that a significant increase in asset value would enable households to compete in local markets, bringing
BOX CS3.3 Selection Criteria, Ultra-Poor Graduation Program, 2017
Over age 50 • No family member between the ages of 16 and 50 .
• Per capita monthly income not to exceed $20.
• No member of the household is a regular beneficiary of a nongovernmental organi-zation or has a loan with a microfinance or financial institution.
Under age 50: Poorest • Per capita monthly income not to exceed $20.
• No member of the household is a regular beneficiary of an NGO or has a loan with a microfinance or financial institution.
• Female household members must work (as domestic labor, agricultural labor, and so forth) .
• At least two of the following: • Household has productive asset value of $6 or less .
• Household owns 10 decimalsa of land or less .
• One or more household members face chronic disease or mental and physical disability .
Under age 50: Better-off • Per capita monthly income not to exceed $20.
• No member of the household is a regular beneficiary of an NGO or has a loan with a microfinance or financial institution.
• At least two of the following: • Household is dependent on irregular income .
• Household has productive asset value of $12 or less .
• Household owns 30 decimalsa of land or less .
• One or more household members face chronic disease or mental and physical disability .
a. A decimal is one-hundredth of an acre.

8
T H E S T A T E O F E C O N O M I C I N C L U S I O N R E P O R T 2 0 2 1 : T H E P O T E N T I A L T O S C A L E
sufficient financial returns to participants to make up for the added cost. The program also expanded the number of livelihood options available to participants, taking advan-tage of new opportunities within local markets and ways to avoid increasing competi-tion between households.
Changed payment for productive assets to partial loans with flexible terms and protections. The profile of participants under age 50 entering the program had changed; they were not as vulnerable or resource-constrained as participants in earlier years. They were more likely than earlier participants to own some land, earn some income, or have been exposed to microfinance (widely available across rural Bangladesh by then). They also demonstrated higher aspirations—wanting to feel a sense of owner-ship as opposed to dependence on aid. These considerations informed the decision to require all participants under age 50 to repay some of the asset value. Specifically, the poorest would have to repay 30–50 percent of the asset value, and better-off participants would repay 100 percent of the asset value, interest-free, by the end of the 24-month program. Repayment was later reduced to 80 percent for the latter group. The collection of installments would be administered by BRAC’s microfinance program. Participants would have a grace period of one month. In addition, all participants would receive two vouchers that entitled them to a 15-day installment deferment. The vouchers gave participants flexibility in the event they faced a period of higher expenses or diminished cash flow. The graduation program leveraged other new products and services being widely offered by BRAC’s microfinance program, such as credit shield life insurance for all participants, whereby the repayment balance is forgiven in the event an earner in the household passes away. In such cases, BRAC returns the principal the household had already paid back, plus an additional financial benefit of $118 to support funeral costs.
Increased financial management support. The decision to introduce partial asset value repayment to all participants underscored and increased the importance of coach-ing support for participants. During household visits, program officers would provide one-on-one guidance on tracking income and expenditures, calculating how much to set aside for savings and installments and planning for income growth or diversifica-tion. In addition, BRAC microfinance staff, who administered the biweekly meetings on installment and savings collections, provided routine guidance on the terms and expectations of repayment and savings collection.
Introduced a match savings mechanism. A critical outcome of the program was to build financial resilience by encouraging regular savings behavior and ensuring a sizable savings balance in the event of financial shocks. As program staff conducted learning visits of similar programs implemented in Bangladesh, BRAC learned of a “savings match” component in the government program Ektee Bari, Ektee Khamar (One Farm, One House). As a result, BRAC introduced a match savings mechanism to further give participants an incentive to save regularly. For every 1 Bangladesh taka ($0.01) saved, BRAC would match it two to one, up to a maximum of Tk 100 ($1.20). BRAC later revised the match to one to one to promote greater financial independence.
Alternated individual household visits with group visits. BRAC moved from weekly individual home visits to alternating between biweekly home visits and biweekly group visits. This change enabled BRAC to bring the staff-to-participant ratio down, while maintaining touch points with staff at four times per month.
Revised life skills training curriculum. BRAC added a focus on noncommunicable diseases to the curriculum because such diseases had become a leading cause of higher morbidity and mortality in Bangladesh.
Adjusted terms of village social solidarity committees. Village committee schedules were changed to every two months instead of once a month, with the option to call an emergency meeting sooner if needed. This change helped to reduce the workload of branch managers, who previously were administering 12–13 committees at a time.

T H E S T A T E O F E C O N O M I C I N C L U S I O N R E P O R T 2 0 2 1 : T H E P O T E N T I A L T O S C A L E
9
Furthermore, sometimes issues raised in the committee meetings could not be resolved within a month.
Linked participants to health and water, sanitation, and hygiene (WASH) services. Instead of continuing to provide participants directly with sanitary latrines, the program linked participants to BRAC’s water and sanitation program, thereby reducing costs. The widespread availability of government health services across Bangladesh also meant the program could link participants in need to the health care providers operating locally instead of to BRAC’s health program. Program staff would also leverage the village social solidarity committees (VSSCs) to help mobilize financial support if needed. Both changes promoted sustainability of access to health care and support by enabling participants to rely on these mechanisms after the program ended and without BRAC’s support.
Factored in localized area contextualization. BRAC factored regional contextual differences among its target locations into slight program adjustments. For example, a third of program sites are located in regions affected by climate change. In those regions, adaptations include alternative livelihood options, awareness-raising on disaster preparedness, and support to make homes and shelters more resilient.
Scale and adaptation through leveraging investments in infrastructure, staff, and learning
BRAC has reached more than 100 million people in Bangladesh through a systematic effort to scale up and leverage its investments in infrastructure, staff, insights, and learning from earlier and existing programs. BRAC is recognized for both its horizontal and functional scale and for implementing expansive programs in microfinance, educa-tion, health, human rights and legal empowerment, and disaster preparedness, which address the multidimensional aspects of poverty. Over the years, the organization has expanded to over 2,000 branch offices covering all 64 districts of the country.
BRAC’s initial scale nationwide is attributed to community mobilization efforts related to the health care work it undertook in the 1980s as it trained households on how to mix oral rehydration solution. These community mobilization efforts were leveraged to offer microfinance for poor women in rural communities, thereby creating a demand for a network of branches and staff infrastructure that would later be used to offer additional development services, including livelihoods training, human rights awareness-raising and local advocacy, WASH, and other health programs. Outside of Bangladesh, BRAC has largely continued a similar trajectory of using microfinance to develop a presence, layering other development programs alongside it. For example, in Uganda, where BRAC has its largest presence outside of Bangladesh, it serves 208,000 microfinance clients and offers additional development programs in 100 of its 160 branches.
In the graduation and other programs, continuous feedback loops ensured that field insights informed management decisions. The richest insights on program effec-tiveness from field staff are systematically fed up to management. Regional managers, who spend three weeks a month in the field and one week a month in the head office in Dhaka, collect observations from program officers from across branch locations and identify patterns to be considered or addressed by management in charge of opera-tions. This mechanism for learning was critical to understanding how participants were responding to the program changes. For example, in 2017 anecdotes from program offi-cers, who work directly with households, suggested that a third of eligible households whom the program had classified as being in the “better-off” category of households and therefore were expected to repay the full value of the asset were self-excluding from the program. The program’s monitoring and evaluation department verified that the self-exclusion rate of eligible households was roughly 30 percent. Researchers identified

10
T H E S T A T E O F E C O N O M I C I N C L U S I O N R E P O R T 2 0 2 1 : T H E P O T E N T I A L T O S C A L E
the main reason for this finding: this group felt that the expectation that they would repay the full amount while others paid less than half was unfair, and so they did not want to participate. Thus before scaling back up to 100,000 households in 2018, management brought the repayment expectation down to 80 percent of the asset value, which, among other factors, led to a reduction in self-exclusion rates. To test the design before a full-scale implementation, BRAC cut its normal graduation program intake by over half, enabling staff to learn by doing, with half directly implementing and sharing knowledge and implementation suggestions with others before BRAC expanded.
The scaled-up nature of BRAC’s program implies that large-scale organizational shifts are often required to successfully operationalize programmatic shifts. For exam-ple, in spite of a strong staff implementation capacity, recent graduation program changes required a shift in the mindset and skills of field staff, many of whom had been implementing the program for more than a decade. To ensure a continued orga-nizational capacity for the program at scale, all field implementation staff received an in-depth orientation around the changes and the rationale behind them, helping to build buy-in. In particular, the program’s new emphasis on building participants’ capac-ity to pay installments meant all staff had to be skilled in supporting careful financial planning, monitoring spending, and assessing business plans. To increase efficiency and reduce costs, BRAC streamlined its field management structures, increasing the number of regions and districts under each regional manager. Recognizing the organizational lift required to achieve these programmatic changes at scale, BRAC led an inclusive change management process. From the beginning, the redesign process was enriched by cross-program learning from field officers, management, and research staff involved in consultations, market assessments, design workshops, and program design prototyp-ing. The phased rollout was launched in 2017. All staff were subsequently engaged in assessing the effectiveness of the new design.
BRAC’s efforts in graduation have also pivoted toward a new dimension of scale—supporting governments in implementing their own programs through policy advocacy and technical assistance. BRAC recognized that the global magnitude of extreme poverty demanded government-scale programs and that NGOs could do much to support the launch of such programs. Since 2014, BRAC has explored a new modal-ity for scaling the graduation approach by supporting the adoption, implementation, and scale-up of graduation programs by governments through advocacy and in-depth technical assistance. To date, it has worked with the governments of Afghanistan, Guinea, Kenya, Lesotho, Pakistan, the Philippines, Rwanda, and Tamil Nadu (India).
Lessons
The revised program is undergoing a quasi-experimental evaluation to assess the impacts of the redesigned program, and end-line surveys were being conducted at the time of this writing. However, because the characteristics of target groups vary between pre- and post-2017 cohorts, the impacts of the two program designs will not be directly comparable. This section outlines the pertinent lessons for graduation and economic inclusion programs at the programmatic level on how to enable effective adaptation and scale.
Effective adaptation
BRAC’s iterative approach to the evolution of its program has been supported by long-term investment with flexible terms. BRAC’s program benefited from the stability of a long-standing funding instrument with DFID and DFAT. This arrangement gave BRAC

T H E S T A T E O F E C O N O M I C I N C L U S I O N R E P O R T 2 0 2 1 : T H E P O T E N T I A L T O S C A L E
11
the flexibility to adapt and adjust the program because it was held accountable for outcomes and not for specific program design expectations.
Graduation should be viewed as an adaptive methodology aimed at facilitating key outcomes for the poorest, not as a rigid program model. The understanding that graduation is a set of principles rather than a set of fixed components gave BRAC the creative freedom to make the adjustments demanded by the context, regardless of what had been proved to work previously. Its focus on the needs of the poorest and intended outcomes enabled BRAC to ensure fidelity to the original program’s ability to generate sustainable outcomes for the poorest while providing plenty of room for adaptation to the new context. BRAC has continued to apply this approach to other vulnerabilities and pockets of extreme poverty in Bangladesh, such as adaptations for persons with disabilities, refugee host communities, and urban communities, as well as for other NGOs and governments outside of Bangladesh.
Because the contexts of poverty invariably change, graduation programming can add value to a tapestry of antipoverty interventions by maintaining a focus on helping the poorest achieve a basic standard of living through a multidisciplinary approach—one that activates households’ latent economic potential. As contexts develop, it can become even harder for the poorest population to keep pace. Graduation programs have a role to play in ensuring the poor’s access to opportunities to address their most salient issues. For example, although a variety of SSNs and health services had become avail-able to the poorest, many needed help to access them.
BRAC has sought to be intentional in seeking out the poorest, and it recognizes the changing contexts of poverty mean that the indicators used to identify the extreme poor must be continually reevaluated, in addition to the interventions most appropri-ate to building social and economic empowerment and financial inclusion outcomes for this population. The poorest are often the most marginalized, and typically they require proactive targeting and identification so they are not left behind. Programs must also be intentional about addressing heterogeneity among the poorest in order to maximize cost-effectiveness and program outcomes. For BRAC, this meant understanding distinc-tions between women considered to be of “working age” versus women who were older with a limited capacity to engage in income-generating activities. Understanding these distinctions can help inform how certain interventions may be more or less impactful and cost-effective. For example, although older women still needed some level of livelihood support from BRAC, they were less likely to invest in livelihoods, would gradually become less productive, and thus would benefit more from receiving additional support via government SSNs. BRAC therefore intentionally shifted toward allotting a greater portion of programming resources to building the livelihoods of women under age 50.
Continuous learning and evaluation have proved integral to achieving impact at scale. Such a process goes beyond inviting external researchers to conduct evaluations at the end of an implementation period. The use of a range of research, monitoring and evaluation in development, scale-up, adaptation, and implementation measures ensures that insights, questions, or issues about the program’s effectiveness can be addressed quickly and efficiently. BRAC credits its ability to achieve a highly impactful program at scale to the deeply embedded role that research and learning had in the development and continued adaptation of the program. Large-scale programs in return create robust opportunities for learning by offering large data sets from which BRAC can more easily identify patterns and understand heterogeneous effects more clearly.
BRAC’s field implementation staff have been critical stakeholders in change management. BRAC’s evolution of the graduation program has relied heavily on enabling and empowering staff operating at the grassroots to inform decision-making at the highest levels. Feedback loops from the front lines are vital to ensuring that learning

12
T H E S T A T E O F E C O N O M I C I N C L U S I O N R E P O R T 2 0 2 1 : T H E P O T E N T I A L T O S C A L E
and observation are incorporated into senior-level decision-making on program design, adaptation, and operations.
The coaching component of graduation can be a critical element in moving the program in new directions. Coaching is a vital mechanism for monitoring how partici-pants are responding to particular program elements. For example, when BRAC intro-duced all of its participants to partial loan repayments, the value of individual coaching was reinforced as a mechanism for mitigating risk and easing participants into the new demands on their abilities.
Some participants can contribute to the costs of the program. Where this option is explored, programs must conduct rigorous market assessments to indicate whether live-lihoods will generate sufficient returns for participants to pay regular installments and earn a profit. Meanwhile, managers must consider participants’ financial capacity to repay loans, and, if repayments are expected of participants, the program must dedicate resources to building financial literacy and skills, building in protections, and carefully monitoring and supporting participants.
Scale
Programs should seek cost efficiencies by leveraging existing structures and services. In fact, all graduation and economic inclusion programs should review the constella-tion of available services and structures for possible leverage and should design inter-ventions to fill these gaps. Such an effort would promote functional scale by layering on what is available, as well as horizontal scale by identifying cost efficiencies. These effi-ciencies do not need to be internal to the implementing organization. Although BRAC was able to leverage its own microfinance branch network to scale up the graduation program across Bangladesh, it also took advantage of the ability to link participants to available government SSNs and health care services. Geographic coverage should be driven by where there is the greatest need. Although BRAC maintained the same intake of households, it reduced the geographic scale of the program to focus on areas with the greatest concentrations of extreme poverty. This principle should be maintained, especially where resources limit the ability to scale up nationwide.
For BRAC, an intentional shift toward supporting governments to scale up their own graduation programs implies new learning and innovation and exploring new arrangements for implementation and contexts suitable for graduation. Through its work with governments in different contexts, BRAC has explored a variety of imple-menting arrangements, from direct government implementation to government–NGO partnerships, seeking to understand which operational approaches apply best in which settings or circumstances. Specifically, BRAC has been exploring how the graduation approach can be adapted to refugee settlements and host communities, urban reset-tled populations, fragile contexts, violence- and conflict-affected communities, and people with disabilities. BRAC is also seeking to address questions of cost-effectiveness by exploring opportunities to layer onto existing government schemes, such as cash transfers, public works programs, and other livelihood schemes.
BRAC’s work implicitly leverages funds that governments and multilateral donors already dedicate to social protection programming. Instead of seeking additional funds to set up new programs, BRAC has found that graduation provides a framework through which existing government programs and measures can be converged, and therefore resources can be leveraged. This convergence also reveals opportunities for interministerial collaboration and cost-sharing among, for example, ministries of agri-culture, trade, and industry and small business or labor, where existing programs can be adapted and leveraged to serve the most vulnerable as part of a holistic approach to alleviating extreme poverty on a national level.

T H E S T A T E O F E C O N O M I C I N C L U S I O N R E P O R T 2 0 2 1 : T H E P O T E N T I A L T O S C A L E
13
Notes
1. Data in this section are from the World Bank’s World Development Indicators (database), https://data.worldbank.org/country/bangladesh.
2. Bangladesh Bureau of Statistics, http://bbs.portal.gov.bd/sites/default/files/files/bbs.portal .gov.bd/page/5695ab85_1403_483a_afb4_26dfd767df18/2019-12-17-16-30-614e10bcb101bc1df5938723cc141c5d.pdf.
References
Bandiera, Oriana, Robin Burgess, Das Narayan, Selim Gulesci, Imran Rasul, Raniya Shams, and Munshi Sulaiman. 2012. “Asset Transfer Programme for the Ultra Poor: A Randomized Control Trial Evaluation.” CFPR Working Paper No. 22, BRAC Research and Evaluation Division, Dhaka.
Bandiera, Oriana, Robin Burgess, Das Narayan, Selim Gulesci, Imran Rasul, and Munshi Sulaiman. 2017. Labor Markets and Poverty in Village Economies. Oxford, U.K.: Oxford University Press.
Hill, Ruth, and Maria Eugenia Genoni. 2019. Bangladesh Poverty Assessment: Facing Old and New Frontiers in Poverty Reduction. Washington, DC: World Bank. http://documents.worldbank.org/curated/en/793121572582830383/Bangladesh-Poverty -Assessment-Facing-Old-and-New-Frontiers-in-Poverty-Reduction.
14
Contents of The State of Economic Inclusion Report 2021: The Potential to Scale
Foreword . . . . . . . . . . . . . . . . . . . . . . . . . . . . . . . . . . . . . . . . . . . . . . . . . . . . . . . . . . . . . . . . . . . xi
Acknowledgments . . . . . . . . . . . . . . . . . . . . . . . . . . . . . . . . . . . . . . . . . . . . . . . . . . . . . . . . . . xiii
About the Authors . . . . . . . . . . . . . . . . . . . . . . . . . . . . . . . . . . . . . . . . . . . . . . . . . . . . . . . . . . xv
Abbreviations . . . . . . . . . . . . . . . . . . . . . . . . . . . . . . . . . . . . . . . . . . . . . . . . . . . . . . . . . . . . . xvii
Executive Summary . . . . . . . . . . . . . . . . . . . . . . . . . . . . . . . . . . . . . . . . . . . . . . . . . . . . . . . . . . . 1
PART A: Moving to Scale: Concepts, Practice, and Evidence . . . . . . . . . . . . . . . . . . . . 15
1. Economic Inclusion: A Framework . . . . . . . . . . . . . . . . . . . . . . . . . . . . . . . . . . . . . . . . 16
Spotlight 1: Economic Inclusion and COVID-19 Recovery . . . . . . . . . . . . . . . . . . 34
2. Moving to Scale: Political Realities and Entry Points . . . . . . . . . . . . . . . . . . . . . . . . 38
3. A Surge in Economic Inclusion Programming Worldwide . . . . . . . . . . . . . . . . . . . 60
Spotlight 2: Promoting Women’s Empowerment through Economic Inclusion 83
4. Moving to Scale through Government-Led Programs . . . . . . . . . . . . . . . . . . . . . . 92
Spotlight 3: Linking Economic Inclusion and Markets for the Poorest . . . . . . . 110
5. An Assessment of Program Impacts . . . . . . . . . . . . . . . . . . . . . . . . . . . . . . . . . . . . . . 116
6. Assessing the Cost of Economic Inclusion Programs . . . . . . . . . . . . . . . . . . . . . .152
PART B: Case Studies . . . . . . . . . . . . . . . . . . . . . . . . . . . . . . . . . . . . . . . . . . . . . . . . . . . . . . . 177
Case Study 1: Productive Inclusion Measures and Adaptive Social Protection in the Sahel . . . . . . . . . . . . . . . . . . . . . . . . . . . . . . . . . . . . . . . . . . . . . . . . . . . 178
Case Study 2: The State of Bihar’s Approach to Economic Inclusion: JEEViKA and the SJY Program . . . . . . . . . . . . . . . . . . . . . . . . . . . . . . . . . . . . . . . . . . . .194
Case Study 3: Adapting BRAC’s Graduation Program to the Changing Poverty Context in Bangladesh . . . . . . . . . . . . . . . . . . . . . . . . . . . . . . . . . . . . . . . . . . 209
Case Study 4: Haku Wiñay: An Economic Inclusion Program in Peru . . . . . . . . . . 222
Appendix A: Survey Methodology . . . . . . . . . . . . . . . . . . . . . . . . . . . . . . . . . . . . . . . . . . 236
Appendix B: Review of Program Impact . . . . . . . . . . . . . . . . . . . . . . . . . . . . . . . . . . . . . 244
Appendix C: Economic Inclusion Program Costing Survey Methodology and Analysis . . . . . . . . . . . . . . . . . . . . . . . . . . . . . . . . . . . . . . . . . . . . . . . . . . . . . . . . . . . . 270
Appendix D: Economic Inclusion Programs Mapped Globally . . . . . . . . . . . . . . . . . 283
Appendix E: Components of Economic Inclusion Programs . . . . . . . . . . . . . . . . . . . 311
Glossary . . . . . . . . . . . . . . . . . . . . . . . . . . . . . . . . . . . . . . . . . . . . . . . . . . . . . . . . . . . . . . . . . . .321

SKU 33442
The State of Economic Inclusion Report 2021 sheds light on one of the most intractable challenges faced by development policy makers and practitioners: transforming the economic lives of the world’s poorest and most vulnerable people.
Economic inclusion programs are a bundle of coordinated, multidimensional interventions that support individuals, households, and communities so they can raise their incomes and build their assets. Programs targeting the extreme poor and vulnerable groups are now under way in 75 countries.
This report presents data and evidence from 219 of these programs, which are reaching over 90 million beneficiaries. Governments now lead the scale-up of economic inclusion interventions, often building on preexisting national programs such as safety nets, livelihoods and jobs, and financial inclusion, and 93 percent of the total beneficiaries are covered by government programs.
The report offers four important contributions:
• A detailed analysis of the nature of these programs, the people living in extreme poverty and vulnerability whom they support, and the organizational challenges and opportunities inherent in designing and leading them.
• An evidence review of 80 quantitative and qualitative evaluations of economic inclusion programs in 37 countries.
• The first multicountry costing study including both government-led and other economic inclusion programs, indicating that programs show potential for cost efficiencies when integrated into national systems.
• Four detailed case studies featuring programs under way in Bangladesh, India, Peru, and the Sahel, which highlight the programmatic and institutional adaptations required to scale in quite diverse contexts.
Data from the report are available on the PEI Data Portal (http://www.peiglobal.org), where users can explore and submit data to build on this baseline.