is your sales comp plan working?
TRANSCRIPT

Atlanta | Chicago | San Francisco | Scottsdale | Stamford
Is Your Sales Compensation Plan Working? How to Assess Your Compensation Plan and Prepare for 2013 September 12, 2012
Rachel Parrinello Principal, Sales Compensation Practice 415-276-5664 [email protected]
Paul Vinogradov Vice President 415-276-5670 [email protected]

© 2012 The Alexander Group, Inc.® 2
Welcome!
Introductions – Us and You!
Is Your Plan Working?
AGI Framework and Guidance
AGI Offerings and Concluding Remarks
Questions and Answers

© 2012 The Alexander Group, Inc.® 3
About Us
Rachel Parrinello Principal, Sales Compensation Practice
Paul Vinogradov Vice President
15+ years of sales effectiveness consulting Runs AGI’s western region office Runs AGI’s benchmarking practice Sales compensation speaker
12+ years of sales compensation consulting Manages AGI’s Sales Incentive Benchmarking Sales compensation speaker

© 2012 The Alexander Group, Inc.® 4
About You
How many employees total in your company?
13%
6%
28%
14%
39%
1 to 500 501-1,000 1,001-5,000 5,001-10,000 10,001+

© 2012 The Alexander Group, Inc.® 5
About You
How many unique compensation plans do you manage?
36%
26% 21%
17%
1 to 10 11 to 30 31 to 50 More than 50

© 2012 The Alexander Group, Inc.® 6
About You
Do you have less, equal or more plans than you have selling roles?
46% 40%
15%
Less Plansthan Roles
Equal Number of Rolesand Plans
More Plansthan Roles

© 2012 The Alexander Group, Inc.® 7
About You
What degree of pain are you experiencing with your current sales compensation program?
12%
75%
10% 3%
0-2 LOW:plans work well,few complaints
3-5 MEDIUM:some adjustments
needed
6-8 HIGH:signs of failure,
changes needed
9-10 VERY HIGH:complete overhaul
required!

© 2012 The Alexander Group, Inc.® 8
Most Companies Update Their Plans Each Year
*Source: The Alexander Group (AGI) 2012 Sales Compensation Trends Survey (n= 118)
3%
53%
31%
13%
No changes will be made
Minor changes to some ofthe plans
Significant changesaffecting some of the plans
Major changes affectingmost all incentive plans
97% plan to make
program changes for 2012

© 2012 The Alexander Group, Inc.® 9
Laggard
World Class
Where does your company’s compensation plan fit along this continuum?

© 2012 The Alexander Group, Inc.® 10
Assessment Framework
Program Effectiveness
Strategic Alignment
Market Alignment
Principle Alignment
Does your program drive your company’s strategy and align with its job roles? 1
Does your program align to best in class principles?
2 How aligned is your
program to the market?
3

© 2012 The Alexander Group, Inc.® 11
Strategic Alignment – Why?
SALES LEADERSHIP
STRATEGY STRUCTURE
Opportunity Segments
1
Coverage Design
2
Sales Process
3
Job Design & Organizational
Structure
4
Resource Deployment
5
Sales Talent
6
Productivity Metrics
7
Performance Management & Compensation
8
MANAGEMENT
SALES OPERATIONS & TECHNOLOGIES
THE EIGHT PILLARS MODEL
1

© 2012 The Alexander Group, Inc.® 12
Strategic Alignment – How to Do It
Review and confirm your go-to-market model
Conduct interviews
Conduct ride-along’s with sales employees
Inventory your sales roles – create profiles for each
Summarize findings/issues and confirm with sales leadership
1

© 2012 The Alexander Group, Inc.® 13
Illustrative Segmentation and Coverage Map 1
Strategic
Enterprise
Small and Medium Business
Sales Engineer
Account Manager
Inside Sales
Sales Support
Product Specialist
Channel Manager

© 2012 The Alexander Group, Inc.® 14
Primary Input – Job Design
Customer: Target Segments Target Accounts Buyer Needs Sales Potential
Sales Process: Lead Generation Account Development Propose/Close After Sales Service Conversion, Penetration, Retention
Products and Services: Product Type and Complexity Knowledge Required New Versus Current Product Job
Bandwidth
1

© 2012 The Alexander Group, Inc.® 15
Job Profile Example – Strategic AM
Job Summary Responsible for end user sales of Company
products and services to new and existing strategic (5,000+ employees) accounts Executes complex sales and effectively
manage the sales process and activities Effectively engages other sales resources as
required
Primary Secondary
Teaming
Independent Small Team Large Team
Product Type
Point Product Solution Architecture
Job Category
Technical
Account
Partner
Product
Sales Motion
Market Coverage Mature Emerging
Segment
Generalist Specialist
Selling Type
Inside
Field Hybrid
Sales Strategy
Identify / Qualify Lead
Qualify & Develop Oppty
Validate & Approve Solution
Fulfill
Renew Sell-Thru / Enablement
Sales Cycle
0 Months 18 Months 24+ Months 6 Months
Sales Process Complexity
Low Medium High
Sales Process
Management
People Manager
None
Global
No / Minimal Focus
Strategic Enterprise Commercial SMB
Specialization
Quota $4M - $10M
Account Load 3 – 5 Accounts
New Opportunities in Existing Accounts
Renewal / Recurring in Existing Accounts
New Business in New Accounts
Sales Process Sales Focus
Type of Sale
Channel-led Strategic Transactional
Key Metrics
Renewal Bookings
New Bookings
E/B
1

© 2012 The Alexander Group, Inc.® 16
Overall Strategic Goal
Plan Elements
Execution
Guiding Parameters
Charter
Rules To Govern Design Solutions
Guidelines for Specific Program Components
Supporting Programs: Required for Any Sales Compensation Plan
Principle Alignment – Why? 2

© 2012 The Alexander Group, Inc.® 17
Plan Elements
Execution
Guiding Parameters
Charter
Rules To Govern Design Solutions
Guidelines for Specific Program Components
Supporting Programs: Required for Any Sales Compensation Plan
Sales Compensation Principle Framework
Attract, Retain and Reward Sales Resources To Drive Sales Results
2

© 2012 The Alexander Group, Inc.® 18
Plan Elements
Execution
Guiding Parameters
Charter
Guidelines for Specific Program Components
Supporting Programs: Required for Any Sales Compensation Plan
Sales Compensation Principle Framework
Strategy & Job Alignment
Sales Force Motivation
Pay for Performance
1 2 3
Attract, Retain and Reward Sales Resources To Drive Sales Results
2

© 2012 The Alexander Group, Inc.® 19
Plan Elements
Execution
Guiding Parameters
Charter
Supporting Programs: Required for Any Sales Compensation Plan
Sales Compensation Principle Framework
Strategy & Job Alignment
Sales Force Motivation
Pay for Performance
1 2 3
Attract, Retain and Reward Sales Resources To Drive Sales Results
Eligibility Pay Levels
Pay Mix Leverage Measures
Mechanics & Pay Curve
Perf & Payout Periods
Quotas/ Targets
Special Incentives
Crediting & Policies
1 2 3 4 5 6 7 8 9 10
2

© 2012 The Alexander Group, Inc.® 20
Plan Elements
Execution
Guiding Parameters
Charter
Sales Compensation Principle Framework
Strategy & Job Alignment
Sales Force Motivation
Pay for Performance
1 2 3
Attract, Retain and Reward Sales Resources To Drive Sales Results
Eligibility Pay Levels
Pay Mix Leverage Measures
Mechanics & Pay Curve
Perf & Payout Periods
Quotas/ Targets
Special Incentives
Crediting & Policies
1 2 3 4 5 6 7 8 9 10
Investment ROI Communication Administration Governance, Assessment,
Design
1 2 3 4
2

© 2012 The Alexander Group, Inc.® 21
Principle Alignment – How?
Confirm or create principles based on pay philosophy
Gather seller feedback via survey and interviews
Analyze pay, performance, and plan design data
Summarize findings - what’s working and what’s not?
Summarize topics and issues that require addressing for next plan period
2

© 2012 The Alexander Group, Inc.® 22
What Is a World Class Sales Compensation Plan?
The Sales Compensation Plan is a Valuable Management Tool to Drive Sales Results if Done Correctly
Drives business goals and sales strategy
Aligns with each sales job’s role and objectives
Closely links pay to performance
Motivates and rewards higher levels of achievement
Provides market-competitive pay to attract and retain appropriate level of talent
Is simple to understand
2

© 2012 The Alexander Group, Inc.® 23
What is a World Class Sales Compensation Program?
Linked with fair, equitable and stretch goals
Effectively communicated and documented
Sale force understands the plan
Sales leadership messages how the plan supports strategy
Is fiscally responsible and aligns with budget
Efficiently administrated to provide consistent, accurate, and timely pay
Provides the right level of alignment / equity across the organization
Includes ongoing governance to ensure program integrity
Designed by a collaborative process with key stakeholders from sales, finance, human resources, and sales operations
The Plan’s Effectiveness Depends on the Support of People, Processes, and Systems
2

© 2012 The Alexander Group, Inc.® 24
Low Performers Median Performers High Performers
75th
50th
25th
What is Your Pay For Performance Philosophy?
2

© 2012 The Alexander Group, Inc.® 25
Complete a Survey to Capture Sellers Sentiments
Competitive TTC
Motivates Overachievement
Challenging, Achievable
Quotas
Clearly Communicated
Easily Track Comm. Earned
Overall Rating
3.4 3.6 2.8 3.7 3.1 3.2
Strongly Agree Agree Disagree Strongly Disagree
-5% -9% -13% -4% -10% -5%
-13% -9%
-28%
-10%
-23% -19%
51% 49% 31%
53% 36% 38%
7% 16%
4%
19%
9% 5%
2

© 2012 The Alexander Group, Inc.® 26
Analyze Your Program’s Data
Pay Mix Analysis What: Pay mix averages and variance for each role.
Purpose: Assess appropriateness and consistency of pay mixes.
Pay vs. Performance Scatter Plots What: Correlation of incentive pay and sales performance.
Purpose: Identify inconsistencies between pay and performance.
Incentive Payout Percentile Distributions What: Range of incentive payouts across incumbents by percentile.
Purpose: Examine pay discrimination and assess upside opportunity.
2

© 2012 The Alexander Group, Inc.® 27
Analyze Your Program’s Data (Continued)
Quota Performance Distributions What: Performance distribution across incumbents.
Purpose: Assess the effectiveness of the goal setting process and compare performance range and shape with best practice distribution.
Quota Size Correlation Scatter Plots What: Effect of quota size on target achievability.
Purpose: Assess the effectiveness of the goal allocation process and need varied accelerator structures based on quota size.
Quota Performance Percentile Distributions What: Range of quota performance across incumbents by percentile.
Purpose: Assess current threshold and excellence levels; determine percent of incumbents above and below target performance levels.
2
© 2012 The Alexander Group, Inc.® 28
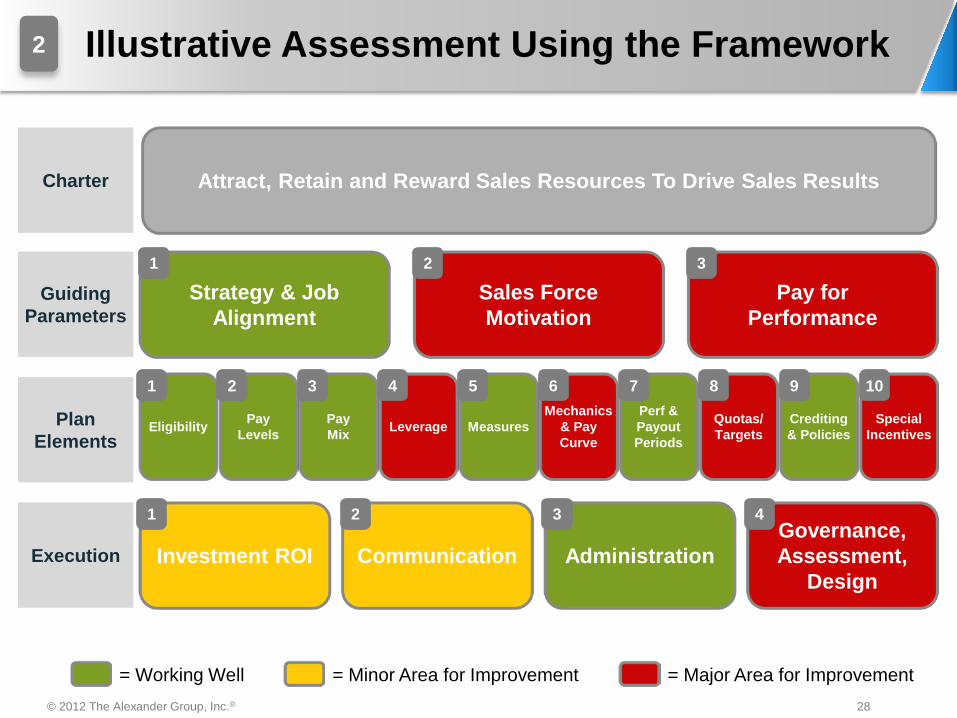
Investment ROI Communication Administration Governance, Assessment,
Design
Attract, Retain and Reward Sales Resources To Drive Sales Results
Eligibility Pay Levels
Pay Mix Leverage Measures
Mechanics & Pay Curve
Perf & Payout Periods
Strategy & Job Alignment
Sales Force Motivation
Pay for Performance
Plan Elements
Execution
Guiding Parameters
Charter
1 2 3
1 2 3 4
Quotas/ Targets
Special Incentives
Crediting & Policies
1 2 3 4 5 6 7 8 9 10
Illustrative Assessment Using the Framework
= Working Well = Minor Area for Improvement = Major Area for Improvement
2

© 2012 The Alexander Group, Inc.® 29
x x
x
Market Alignment – Why?
Know how you compare to market practice
Know how you compare to the competition for top sales talent
Make fact-based and data-driven decisions on how you will compete and differentiate
3
Laggard Market Practice
World Class

© 2012 The Alexander Group, Inc.® 30
Market Alignment – How?
Capture internal employee’s sentiments and knowledge – use caution
Network with peers in your industry
Formulate your hypotheses
Use 3rd party data – survey houses, research associations, and consultants; research your options
Invest time/resources/budget to get good data
Interpret the results carefully – in light of your phase of growth and strategy
3

© 2012 The Alexander Group, Inc.® 31
Analyze all plan design components
Plan Design Components
Pay Mix
Performance Measures/Weights
Plan Mechanics (Bonus, ICR, etc.)
Payout Curves & Rates
Thresholds
Excellence Points
Upside/Leverage
Caps
Linkages, Hurdles
Performance Period
Payout Frequency
Add-on Bonuses
Sales Quota Crediting
Sample Plan Component Analysis
3

© 2012 The Alexander Group, Inc.® 32
Illustrative Market Comparison Data
Plan Type Sales Incentive
Plan Mgmt. Incentive
Plan Profit Sharing
Pay Levels Pay Mix New Hire Practices Excessive Payout
Practices
3
Measures At-Risk Add-On Linked
Pay Curve Thresholds Excellence Caps
Formula / Calculation Methodology
Performance Period Payout Frequency Crediting Rules
Policies HR Changes Quota Changes
Cost Metrics Plan Administration
Administration Tool FTE Ticket Accuracy Rate Processing
Communication
Plan Data at Job Measure Level Data Program Data

© 2012 The Alexander Group, Inc.® 33
Illustrative Market Alignment Comparison
Aligned w/ Market Minor Misalignment w/ Market Major Misalignment w/ Market To Be Determined Legend:
Plan Component Market Comparison Comparison Details
Pay Mix • Pay mix is on par with benchmark companies
Measures • Benchmark companies use between 2-3 measures, including linked metrics
Mechanics • All benchmark companies use a quota based mechanic
# of Pay Curves • More pay curves than benchmark companies
Thresholds • Most benchmark companies pay from the first dollar
Payout Limits • Most benchmark companies do not use a deceleration rate and/or cap
Leverage • Equal upside opportunity than the benchmark companies
Excellence • Calculated excellence points appear aligned to market
Pay Curve • Rates >100% are below average relative to benchmark companies
Performance Period • Most benchmark companies use annual performance period
Payout Frequency • Most benchmark companies provide monthly payouts
Calc. Methodology • Most companies use cumulative methodology; some use cumulative-period-to-date
Crediting • Sales crediting at bookings aligns; however shipment/invoice payment credit does not
Key areas of misalignment include # of accelerator rates, the rates and crediting.
Summary Benchmark Findings
AM
Overall Comparison
3

© 2012 The Alexander Group, Inc.® 34
AGI’s Sales Compensation Services
Sales Compensation Process Design and Optimization 2
Sales Compensation Design Principles 3
Sales Compensation Scorecard 4
Sales Incentive Benchmarking 5
Surveys 6 On-Going Advisory
Services 7
Plan Design 1

© 2012 The Alexander Group, Inc.® 35
AGI’s Sales Incentive Benchmarking (SIB)
Pay Mix Leverage Measures Measurement Level # of Pay Curves Thresholds Caps Pay Curve Linkages Performance Period Payout Frequency Crediting Events New Hire Practices And 15 More Topics

© 2012 The Alexander Group, Inc.® 36
Closing Remarks
Convene a design team with the right stakeholders
Develop a work plan of activities and events – typical process takes 8-20 weeks depending on # of jobs & payees and degree of change
Develop a scorecard to assess your overall program and drive continual improvements
The difference between an average program and a best-in-class program can drive .5% - 5% difference in sales results.
Don’t miss your opportunity to leverage one of the most
powerful levers the sales organization has to drive results!
© 2012 The Alexander Group, Inc.® 37
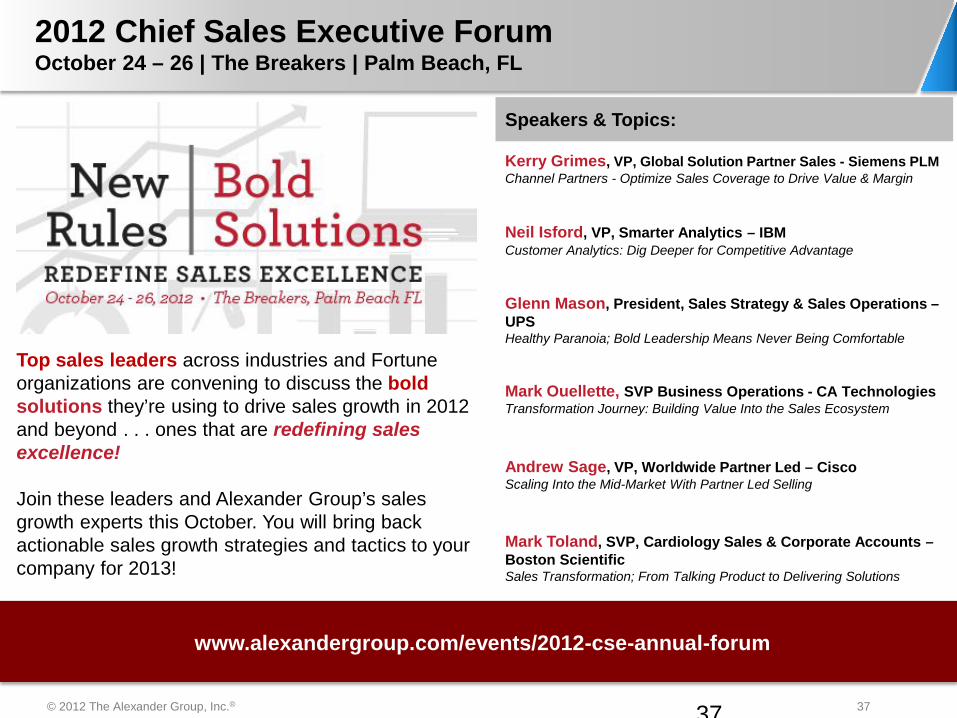
2012 Chief Sales Executive Forum October 24 – 26 | The Breakers | Palm Beach, FL
37
Top sales leaders across industries and Fortune organizations are convening to discuss the bold solutions they’re using to drive sales growth in 2012 and beyond . . . ones that are redefining sales excellence! Join these leaders and Alexander Group’s sales growth experts this October. You will bring back actionable sales growth strategies and tactics to your company for 2013!
www.alexandergroup.com/events/2012-cse-annual-forum
Speakers & Topics:
Kerry Grimes, VP, Global Solution Partner Sales - Siemens PLM Channel Partners - Optimize Sales Coverage to Drive Value & Margin
Neil Isford, VP, Smarter Analytics – IBM Customer Analytics: Dig Deeper for Competitive Advantage
Glenn Mason, President, Sales Strategy & Sales Operations – UPS Healthy Paranoia; Bold Leadership Means Never Being Comfortable
Mark Ouellette, SVP Business Operations - CA Technologies Transformation Journey: Building Value Into the Sales Ecosystem
Andrew Sage, VP, Worldwide Partner Led – Cisco Scaling Into the Mid-Market With Partner Led Selling
Mark Toland, SVP, Cardiology Sales & Corporate Accounts – Boston Scientific Sales Transformation; From Talking Product to Delivering Solutions

© 2012 The Alexander Group, Inc.® 38
Questions?

© 2012 The Alexander Group, Inc.® 39
Rachel Parrinello Principal, Sales Compensation Practice
415-276-5664 [email protected]
Please contact either of us for any additional information or questions.
Paul Vinogradov Vice President 415-276-5670