is there a relation between the amount of schooling and financial success in later life?
TRANSCRIPT
Is There a Relation between the Amount of Schooling and Financial Success in Later Life?Author(s): Otha Bowman StaplesSource: The Elementary School Teacher, Vol. 10, No. 6 (Feb., 1910), pp. 261-269Published by: The University of Chicago PressStable URL: http://www.jstor.org/stable/993142 .
Accessed: 23/05/2014 16:09
Your use of the JSTOR archive indicates your acceptance of the Terms & Conditions of Use, available at .http://www.jstor.org/page/info/about/policies/terms.jsp
.JSTOR is a not-for-profit service that helps scholars, researchers, and students discover, use, and build upon a wide range ofcontent in a trusted digital archive. We use information technology and tools to increase productivity and facilitate new formsof scholarship. For more information about JSTOR, please contact [email protected].
.
The University of Chicago Press is collaborating with JSTOR to digitize, preserve and extend access to TheElementary School Teacher.
http://www.jstor.org
This content downloaded from 91.229.248.145 on Fri, 23 May 2014 16:09:56 PMAll use subject to JSTOR Terms and Conditions
VOLUME X NUMBER 6
THE ELEMENTARY SCHOOL TEACHER
FEBRUARY, 191O
IS THERE A RELATION BETWEEN THE AMOUNT OF SCHOOLING AND FINANCIAL SUCCESS
IN LATER LIFE?
OTHA BOWMAN STAPLES
I. The problem.-While unanimity is lacking among the statisticians who have made a study of elimination, or the number of children who drop out of school at various stages, they are all practically agreed that not more than 50 per cent. of all the children enrolled in the schools complete even the eight grades of the elementary school, while only one in ten goes through the high school.
This investigation was undertaken with a view to ascertaining what the actual effect of elimination has been upon a repre- sentative group of adults, taking their later financial success as the criterion by which to, measure the effect.
2. The method of investigation.-Five hundred adults now engaged in productive activity, and representing practically all the activities of a typical community, were asked regarding the date of leaving school and their present income. The data were secured at Lake Geneva, Wis., a town of some 3,800 inhabitants, and situated in an agricultural and dairying region. The five hundred respondents constitute about 75 per cent. of the voting citizens. With few exceptions all the professional and business men of the town were canvassed. The 25 per cent. not canvassed were chiefly common laborers and artisans, which classes are nevertheless the most largely represented in the investigation. As to numbers in various grades of occupation the order would
261
This content downloaded from 91.229.248.145 on Fri, 23 May 2014 16:09:56 PMAll use subject to JSTOR Terms and Conditions
262 THE ELEMENTARY SCHOOL TEACHER
be: carpenters, day laborers, teamsters, painters, merchants and shop-keepers, stonemasons, plumbers, butchers, clerks, barbers, etc., concluding with six to ten each of physicians, lawyers, and ministers. And in addition to those immediately in the town
forty-four farmers living in the adjacent vicinity were canvassed as to the same facts.
With a view to securing as correct data as possible the object of the investigation was explained to each respondent and an
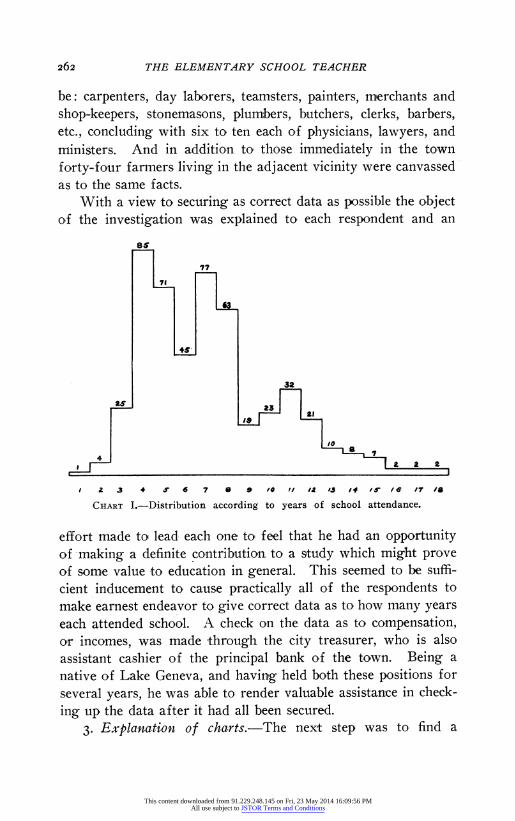
1 3 2 6 7 8 9 fl /a 1* 3 14 i /6 /7 /3
CHART I.-Distribution according to years of school attendance.
effort made to lead each one to feel that he had an opportunity of making a definite contribution to a study which might prove of some value to education in general. This seemed to be suffi- cient inducement to cause practically all of the respondents to make earnest endeavor to give correct data as to how many years each attended school. A check on the data as to compensation, o'r incomes, was made through the city treasurer, who is also assistant cashier of the principal bank of the town. Being a native of Lake Geneva, and having held both these positions for several years, he was able to render valuable assistance in check-
ing up the data after it had all been secured. 3. Explanation of charts.-The next step was to find a
This content downloaded from 91.229.248.145 on Fri, 23 May 2014 16:09:56 PMAll use subject to JSTOR Terms and Conditions

SCHOOLING AND FINANCIAL SUCCESS 263
method of comparing these two sets of data, namely, those relat- ing to school attendance and those relating to income, so as to ascertain how much correlation, if any, exists between them. This was done by means of the charts which
follow. Arranging each set of data according to the "normal distribution curve" as represented in Charts I and II we are at once struck with a general resemblance between the two distribution curves, although they differ more or less in details. That is to say, taking up
200 300 0 o 500 600 700 800 900 /000 //O /0200 /30• /* /*4 /1 20 0 / / $ 00 2000 Ued 3 6S r* J000 6000
CHART II.-Distribution according to present salaries.
Chart I we observe that the entire range of years in sch~ool attendance is from one to eighteen; but 341, or 68 per cent. of the entire number, attended school from four to eight years, with comparatively few attending less than four or more than eight years. Making similar observation of Chart II we find that the salaries or incomes range from $200 to $6,ooo; but 354, or 71 per cent. of the entire five hundred, receive between $500 and
$I,ooo, only twenty people receiving less than $400, and seven- teen more than $2,000.
Passing from this more general comparison of the distribu- tions, in which we see a gross similarity, let us take up Chart III,
This content downloaded from 91.229.248.145 on Fri, 23 May 2014 16:09:56 PMAll use subject to JSTOR Terms and Conditions

264 THE ELEMENTARY SCHOOL TEACHER
in which by the use of cross-hatching and a more definite method of comparison we get an exact expression of correlation between the number of years these five hundred individuals attended school and their respective salaries or incomes.
1 3 s * - 6 7' a 9 /0 // / a 3 /4 / /s6 /7 /8
CHART III.-Oblique lines from upper right to lower left indicate those
receiving more than $700; obliques from upper left to lower right those receiv-
ing $700 or less.
By actual count we find that half the entire number of indi- viduals received over $700 as salaries or incomes; the other half of course receiving $700, or less. Therefore by using oblique lines from upper right to lower left to represent those who receive over $700, and oblique lines from upper left to lower right to
This content downloaded from 91.229.248.145 on Fri, 23 May 2014 16:09:56 PMAll use subject to JSTOR Terms and Conditions
SCHOOLING AND FINANCIAL SUCCESS 265
represent those receiving $700, or less, and by arranging the entire number of respondents in columns according to the num- ber of years they attended school, it becomes evident at a glance that the majority of those receiving $7oo or less, attended school less than eight years, whereas the majority of those receiving over $700 attended school more than six years.
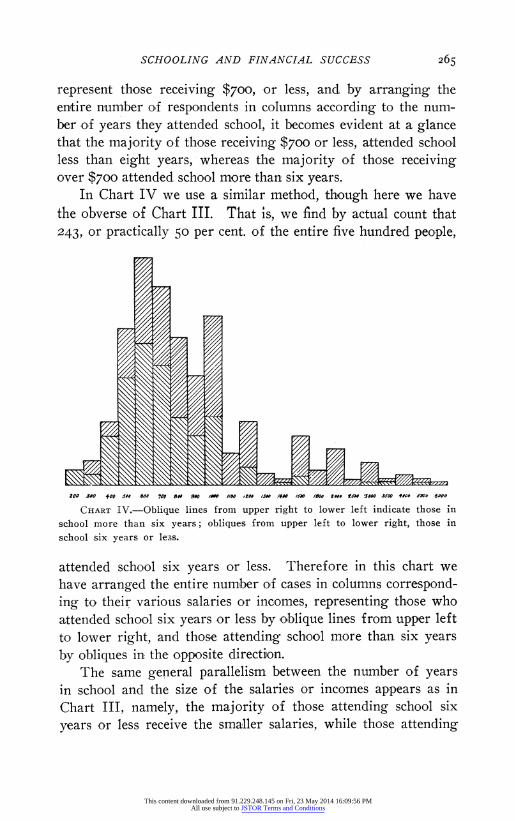
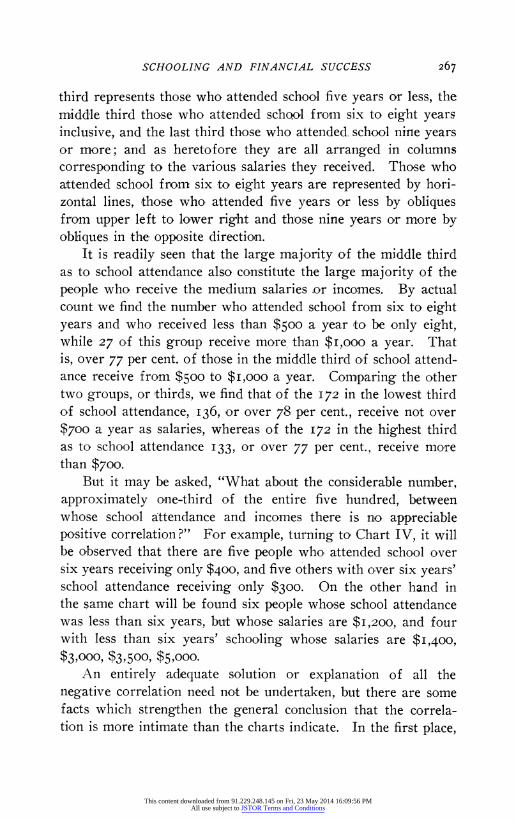
In Chart IV we use a similar method, though here we have the obverse of Chart III. That is, we find by actual count that 243, or practically 50 per cent. of the entire five hundred people,
*00 510 500 P 0 lo Oiv gm 90/ * he// oo /3 JO /f a /oop *"m /00 S to 00 l MOOfooo fo 6000
CHART IV.-Oblique lines from upper right to lower left indicate those in school more than six years; obliques from upper left to lower right, those in school six years or le3s.
attended school six years or less. Therefore in this chart we have arranged the entire number of cases in columns correspond- ing to their various salaries or incomes, representing those who attended school six years or less by oblique lines from upper left to lower right, and those attending school more than six years by obliques in the opposite direction.
The same general parallelism between the number of years in school and the size of the salaries or incomes appears as in Chart III, namely, the majority of those attending school six
years or less receive the smaller salaries, while those attending
This content downloaded from 91.229.248.145 on Fri, 23 May 2014 16:09:56 PMAll use subject to JSTOR Terms and Conditions
266 THE ELEMENTARY SCHOOL TEACHER
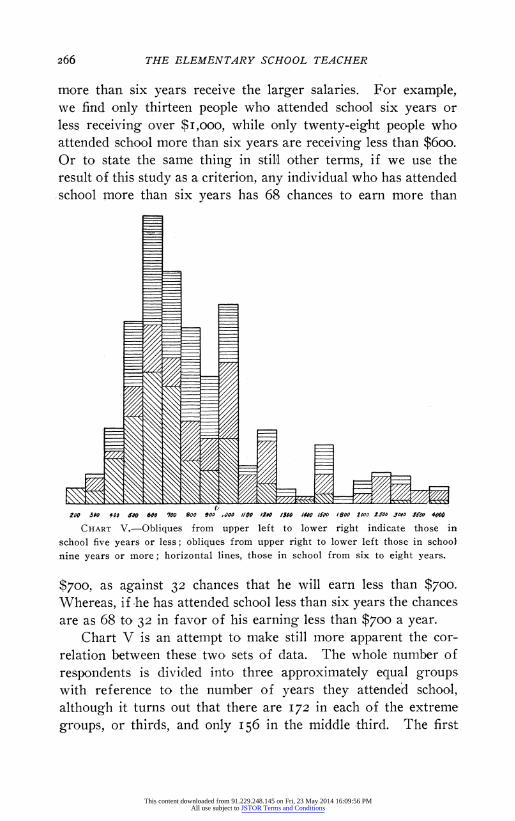
more than six years receive the larger salaries. For example, we find only thirteen people who attended school six years or less receiving over $I,ooo, while only twenty-eight people who attended school more than six years are receiving less than $6oo. Or to state the same thing in still other terms, if we use the result of this study as a criterion, any individual who has attended school more than six years has 68 chances to earn more than
Zoo 3JAN f 0 $4100 600 700 800 900 1000O i/011/ /SOP I /001'O / 1800 2 00 2400 310 3X 4000
CHART V.-Obliques from upper left to lower right indicate those in
school five years or less; obliques from upper right to lower left those in school
nine years or more; horizontal lines, those in school from six to eight years.
$700, as against 32 chances that he will earn less than $700. Whereas, if he has attended school less than six years the chances are as 68 to- 32 in favor of his earning less than $700 a year.
Chart V is an attempt to, make still more apparent the cor- relation between these two sets of data. The whole number of
respondents is divided into three approximately equal groups with reference to the number of years they attended school, although it turns out that there are 172 in each of the extreme
groups, or thirds, and only 156 in the middle third. The first
This content downloaded from 91.229.248.145 on Fri, 23 May 2014 16:09:56 PMAll use subject to JSTOR Terms and Conditions
SCHOOLING AND FINANCIAL SUCCESS 267
third represents those who attended school five years or less, the middle third those who attended school from six to eight years inclusive, and the last third those who attended. school nine years or more; and as heretofore they are all arranged in columns
corresponding to the various salaries they received. Those who attended school from six to, eight years are represented by hori- zontal lines, tho-se who attended five years or less by obliques from upper left to lower right and those nine years or more by obliques in the opposite directioin.
It is readily seen that the large majority of the middle third as to school attendance also constitute the large majority of the
people who receive the medium salaries .or incomes. By actual count we find the number who attended school from six to eight years and who received less than $500 a year to be only eight, while 27 of this group receive more, than $I,ooo a year. That is, over 77 per cent. of those in the middle third of school attend- ance receive from $500 to $I,ooo a year. Comparing the other two groups, or thirds, we find that of the 172 in the lowest third of school attendance, 136, or over 78 per cent., receive not over
$700 a year as salaries, whereas of the 172 in the highest third as to school attendance 133, or over 77 per cent., receive more than $700.
But it may be asked, "What about the considerable number, approximately one-third of the entire five hundred, between whose school attendance and incomes there is no appreciable positive correlation ?" For example, turning to Chart IV, it will be observed that there are five people who attended school over six years receiving only $400, and five others with over six years' school attendance receiving only $300. On the other hand in the same chart will be found six people whose school attendance was less than six years, but whose salaries are $1,200, and four with less than six years' schooling whose salaries are $1,400,
$3,000, $3,500, $5,000. An entirely adequate solution or explanation of all the
negative correlation need not be undertaken, but there are some facts which strengthen the general conclusion that the correla- tion is more intimate than the charts indicate. In the first place,
This content downloaded from 91.229.248.145 on Fri, 23 May 2014 16:09:56 PMAll use subject to JSTOR Terms and Conditions

268 THE ELEMENTARY SCHOOL TEACHER
referring to the ten above mentioned in Chart IV whose school- ing was more than six years but whose salaries were only three and four hundred dollars it should be said they are women clerks in stores and shops of different kinds. Again in Chart IV, it may be observed that 18 of those receiving only $500 attended school more than six years. Of those eighteen five are women teachers. These fifteen comprise the entire number of women respondents and help to explain part of the negative correlation. That is to say, the'data o-f these somewhat lower the percentage of corrrelation between the amount of schooling and compensa- tion for the reason that women of equal schooling as a rule receive lower wages.
Age is another factor which helps to explain some part of the lack of perfect correlation. By examining the records of the individuals whose school attendance is below six years, but whose salaries are above $I,2oo we find that with few exceptions they are men from forty-five to sixty. They appear to be well endowed by nature; they found their life-work early, and have
pursued it diligently. The one who receives $5,0oo is president of a bank and also a prosperous farmer, age 54. The one receiv-
ing $3,500 is postmaster and also president of a large hardware
company, age 56. On the other hand the young men who have
recently completed high school and college and have gone to
productive work are in the main receiving comparatively low salaries because of lack of experience, while their school attend- ance is of course comparatively high. Then, too, the schooling of the ministers was high as compared to their salaries.
It may justly be argued that the social and financial standing of a child's family will largely influence his income as an adult. That is to say, it is admitted that the child receives much training and assistance in the home, and in his social environment outside the school, which makes for or against his futlire financial suc- cess. But it should be remembered that the social and financial influences which make for the future success of the child likewise contribute to the prolongation of his period of schooling; whereas if the social and financial condition of his family be such as to limit him with reference to his future financial success these
This content downloaded from 91.229.248.145 on Fri, 23 May 2014 16:09:56 PMAll use subject to JSTOR Terms and Conditions

SCHOOLING AND FINANCIAL SUCCESS 269
same conditions will likewise tend to decrease his period of schooling. In other words, there is a complete parallelism between social condition in the family and period of schooling. If the facts presented in the above tables with regard to period of school are treated merely as symptoms of a more funda- mental fact the interpretation of the result may be more com- plete, but it will be in no wise in conflict with the obvious implication that there is a marked correlation between school attendance and income in later life.
4. Conclusions.-I. That in the five hundred individuals can- vassed there is a correlation of about 68 per cent. between the length of time they attended school and their salaries.
2. That in the remaining 32 per cent. of negative correlation fifteen of the cases may be explained by the fact that being women they receive relatively low wages.
3. That age and experience also help to explain part of the negative correlation; young men of more education but less experience often receiving lower salaries than older men of less education but more experience.
This content downloaded from 91.229.248.145 on Fri, 23 May 2014 16:09:56 PMAll use subject to JSTOR Terms and Conditions