is the randstad a city network? the randstad a city network? ... especially those over 20...
TRANSCRIPT

IS THE RANDSTAD A CITY NETWORK? EVIDENCE FROM COMMUTING PATTERNS
Jan Ritsema van Eck & Daniëlle Snellen
Ruimtelijk Planbureau (Netherlands Institute for Spatial Research) PO box 30314, 2500 GH The Hague, The Netherlands
[email protected] / [email protected]
1. INTRODUCTION In recent years the concept of city networks has been introduced in Dutch spatial planning [Ministry of HSPE, 2004]. In previous policy documents the daily urban system was considered as the level at which main interactions took place. However, an (assumed) expansion of the span of activities to larger networks underlies the new policy. The relationships with other cities or daily urban systems in the region are assumed to be gaining importance over the relationships between urban centres and their suburban areas. Specialisation of centres within this network and, as a result of that, complementarity are factors in this process. In the Netherlands the Randstad Holland, the western most urbanised part of the country, is viewed as an example of the expansion of urban interaction to a polycentric city network. In a recent study, the Dutch National Institute for Spatial Research is looking for answers to the question to what extent specialisation en complementarity of centres within the city network Randstad actually occur. Furthermore, the study aims to find out whether this leads to functioning as a city network. In other words: does the city network Randstad exist or is it still nothing more than a group of daily urban systems located relatively close to each other. In this paper we present the results of an analysis of commuting patterns within the Randstad region. In contrast to the method proposed in the abstract, we did not follow the measure of spatial interaction by Limtanakool and her fellow researchers [Limtanakool et al, 2005a and b]. However, we did measure several aspects of relationships, e.g. strength and symmetry. The strength concerns the intensity of interaction between centres in the network. Symmetry of interaction is related to the directionality of flows. For the analysis, the Randstad region is divided in nine urban regions and their position in the network will be assessed. For comparison, several urban regions in the rest of the Netherlands as well as the Green Hart of the Randstad and its green belt will be considered. 2. DATA The analyses in this paper are based on data from the Dutch Travel Survey (OVG) and the Questionnaire Labour Force (EBB) from the periods 1990-1994 and 2001-2003. These data sources provide us with data on home and work locations of Dutch workers and on the travel behaviour for home-to-
©Association for European Transport and contributors 2006

work-trips. The spatial resolution of the data is at the level of municipalities. However, since our main research questions are about the position of, and relations between daily urban systems, most analyses are carried out at this aggregate level. The daily urban systems of the Randstad are shown in figure 1. For comparison, we also look at daily urban systems outside the Randstad area, the Green Heart of the Randstad, the outer ring of the Randstad (a zone of approximately 20 kilometres around the Randstad area) and the rest of the Netherlands. Figure 2 shows the classification of areas.
Figure 1. Name and location of daily urban systems in the Randstad
Red = urban centre of Randstad daily urban system Pink = suburban area of Randstad daily urban system Light green = Green Heart of the Randstad Turquoise = outer ring of the Randstad Orange = urban centre of other daily urban system Yellow = suburban area of other daily urban system Grey = rest of the Netherlands Figure 2. Classification of areas.
©Association for European Transport and contributors 2006
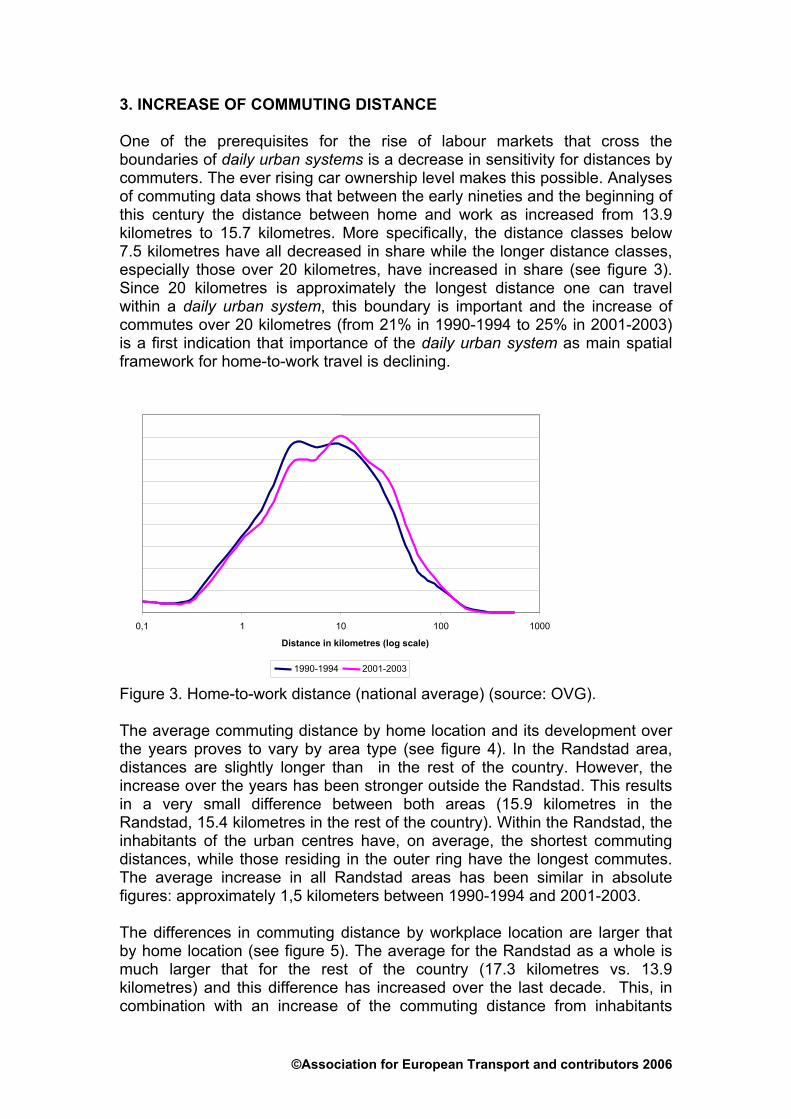
3. INCREASE OF COMMUTING DISTANCE One of the prerequisites for the rise of labour markets that cross the boundaries of daily urban systems is a decrease in sensitivity for distances by commuters. The ever rising car ownership level makes this possible. Analyses of commuting data shows that between the early nineties and the beginning of this century the distance between home and work as increased from 13.9 kilometres to 15.7 kilometres. More specifically, the distance classes below 7.5 kilometres have all decreased in share while the longer distance classes, especially those over 20 kilometres, have increased in share (see figure 3). Since 20 kilometres is approximately the longest distance one can travel within a daily urban system, this boundary is important and the increase of commutes over 20 kilometres (from 21% in 1990-1994 to 25% in 2001-2003) is a first indication that importance of the daily urban system as main spatial framework for home-to-work travel is declining.
0,1 1 10 100 1000
Distance in kilometres (log scale)
1990-1994 2001-2003
Figure 3. Home-to-work distance (national average) (source: OVG). The average commuting distance by home location and its development over the years proves to vary by area type (see figure 4). In the Randstad area, distances are slightly longer than in the rest of the country. However, the increase over the years has been stronger outside the Randstad. This results in a very small difference between both areas (15.9 kilometres in the Randstad, 15.4 kilometres in the rest of the country). Within the Randstad, the inhabitants of the urban centres have, on average, the shortest commuting distances, while those residing in the outer ring have the longest commutes. The average increase in all Randstad areas has been similar in absolute figures: approximately 1,5 kilometers between 1990-1994 and 2001-2003. The differences in commuting distance by workplace location are larger that by home location (see figure 5). The average for the Randstad as a whole is much larger that for the rest of the country (17.3 kilometres vs. 13.9 kilometres) and this difference has increased over the last decade. This, in combination with an increase of the commuting distance from inhabitants
©Association for European Transport and contributors 2006

outside the Randstad, points at a growing group of long distance commuters travel to their workplaces in the Randstad from outside this area. Within the Randstad area, the commuting distances by workplace location vary by area type in a reverse order in comparison the distance by home location. Workers in the urban centres have the longest commute (19.0 kilometres), while those in the Green Heart and the outer ring live relatively close by (14.9/15.0 kilometres). The increase in commuting distances has been the largest for workers in suburban areas of the daily urban systems (+2.3 kilometres), a larger increase than for workers in the urban centres (+2.0 kilometres). This indicates the arise of a more polycentric structure in the dispersal of employment.
1012141618202224
Net
herla
nds
tota
l
Ran
dsta
dto
tal
Net
herla
nds
othe
r
Ran
dsta
dur
ban
cent
res
Ran
dsta
dsu
burb
anar
eas
Gre
enH
eart
Out
er ri
ng
Km
Average distance 1990-1994 Average distande 2001-2003
Figure 4. Average home-to-work distance by home location (source: OVG).
1012141618202224
Net
herla
nds
tota
l
Ran
dsta
dto
tal
Net
herla
nds
othe
r
Ran
dsta
dur
ban
cent
res
Ran
dsta
dsu
burb
anar
eas
Gre
enH
eart
Out
er ri
ng
Km
Average distance 1990-1994 Average distande 2001-2003
Figure 5. Average home-to-work distance by workplace location (source: OVG).
©Association for European Transport and contributors 2006
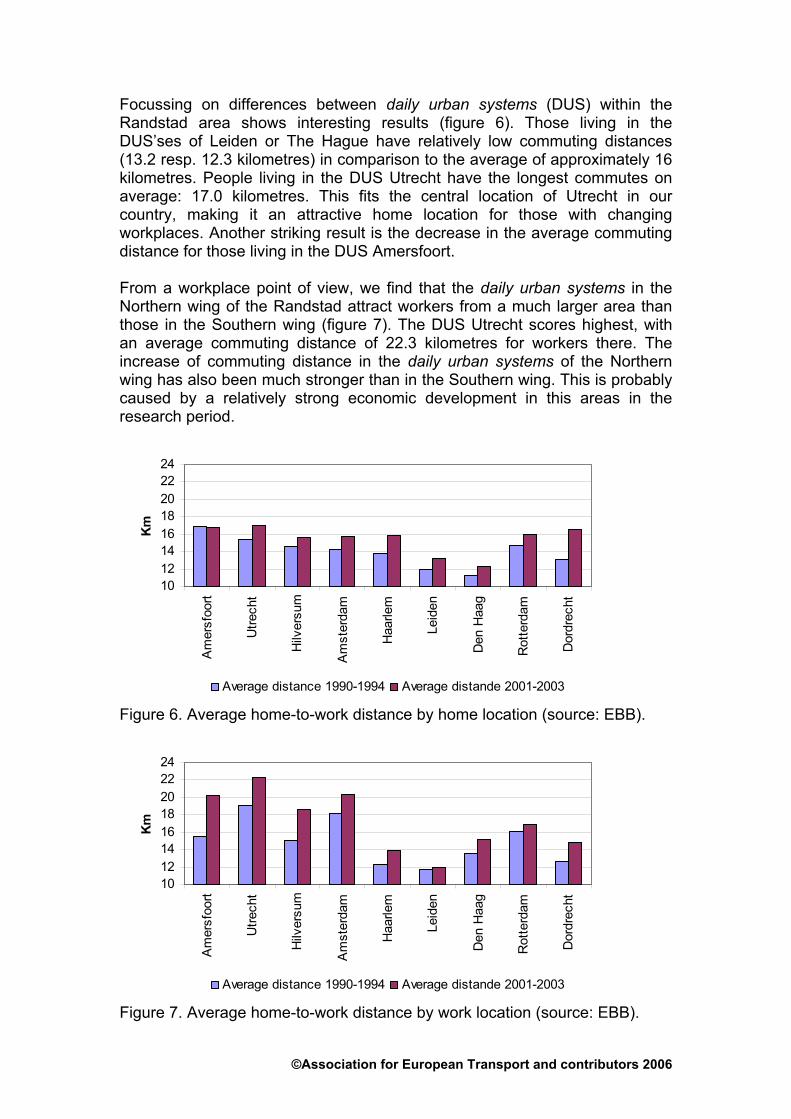
Focussing on differences between daily urban systems (DUS) within the Randstad area shows interesting results (figure 6). Those living in the DUS’ses of Leiden or The Hague have relatively low commuting distances (13.2 resp. 12.3 kilometres) in comparison to the average of approximately 16 kilometres. People living in the DUS Utrecht have the longest commutes on average: 17.0 kilometres. This fits the central location of Utrecht in our country, making it an attractive home location for those with changing workplaces. Another striking result is the decrease in the average commuting distance for those living in the DUS Amersfoort. From a workplace point of view, we find that the daily urban systems in the Northern wing of the Randstad attract workers from a much larger area than those in the Southern wing (figure 7). The DUS Utrecht scores highest, with an average commuting distance of 22.3 kilometres for workers there. The increase of commuting distance in the daily urban systems of the Northern wing has also been much stronger than in the Southern wing. This is probably caused by a relatively strong economic development in this areas in the research period.
1012141618202224
Am
ersf
oort
Utre
cht
Hilv
ersu
m
Am
ster
dam
Haa
rlem
Leid
en
Den
Haa
g
Rot
terd
am
Dor
drec
ht
Km
Average distance 1990-1994 Average distande 2001-2003
Figure 6. Average home-to-work distance by home location (source: EBB).
1012141618202224
Am
ersf
oort
Utre
cht
Hilv
ersu
m
Am
ster
dam
Haa
rlem
Leid
en
Den
Haa
g
Rot
terd
am
Dor
drec
ht
Km
Average distance 1990-1994 Average distande 2001-2003
Figure 7. Average home-to-work distance by work location (source: EBB).
©Association for European Transport and contributors 2006

4. DAILY URBAN SYSTEMS MORE OPEN The increase in commuting distance, as discussed above, appears to indicate more openness of daily urban systems. This is actually the case, however not very strongly and more so outside the Randstad area than within. In the daily urban systems of the Randstad, 23% of the labour force are out-commuters (they have a job outside their residential daily urban system). This share has risen slightly since the early nineties (then 20%). Outside the Randstad this share has risen, in the same period, from 21% to 25%. Please note that daily urban systems in de Randstad area are, on average, larger in size than elsewhere. The share of in-commuters (those working in a specific daily urban system but living in another) is larger than the share of out-commuters. It has risen only slightly since the early nineties, both within the Randstad (from 27% to 28%) as well as outside (from 27% to 29%). A more detailed look reveals rather large differences in the measure of ‘openness’ of daily urban systems within de Randstad (see also table 1). In the three largest cities (Amsterdam, Rotterdam and The Hague) the share of out-commuters is relatively small (ranging from 13% in Amsterdam to 28% in Rotterdam). The labour market appears to be large enough for most people, not to require them to find work elsewhere. In the smaller daily urban systems, the share of out-commuters is much higher (ranging van 36% in Leiden to 41% in Hilversum). Also, contrary to the larger ones, the share of out-commuters has risen over the last 10 years in these daily urban systems (up to 10% in Haarlem). The DUS Utrecht follows a middle course with 29% out-commuters, an increase of 5% in the last decade. Looking at the shares of in-commuters, again we find a striking difference between the Northern en Southern wings of the Randstad. In the DUS’s Amersfoort, Utrecht and Hilversum, in-commuting is very common (39%-40%) and has shown a strong growth since the early nineties (3%-8%). All the other daily urban systems (except for Dordrecht) have a share of in-commuters of less than 30%, with Rotterdam bringing up the rear with only 22%. Furthermore we find that the growth of the share of in-commuters in most of the daily urban systems is low or even negative. This confirms the earlier developed notion that the strong economic development of the Northern wing of the Randstad has lead to a larger labour market from a spatial point of view. However, this does not automatically mean that there is also an increase in the measure to which daily urban systems are interconnected into a network. In theory it could just as well be limited to specific bilateral relationships. We have aggregated the data on in-commuting an out-commuting for the Northern and Southern wing of the Ranstad and for the Randstad area as a whole (see table 1). Then we find that both wings form rather closed labour markets, with approximately 10% out-commuters and 13% (south) to 18% (north) in-commuters. The Randstad area is an almost closed market, with only 3% out-commuting and 5% in-commuting.
©Association for European Transport and contributors 2006

Table 1. Openness of daily urban systems in the Randstad, the Northern and Southern wing and the Randstad as a whole (source: EBB). Out-commuting In-commuting 1992 2002 1992 2002 Amersfoort 33.0% 36.0% 32.7% 39.5%Utrecht 24.2% 28.6% 36.4% 39.1%Hilversum 34.8% 40.9% 31.9% 40.2%Amsterdam 13.8% 13.3% 26.7% 27.5%Haarlem 29.9% 40.1% 28.6% 25.5%Leiden 35.3% 35.7% 22.1% 23.9%Den Haag 11.5% 16.0% 24.1% 24.1%Rotterdam 16.6% 18.3% 22.7% 21.8%Dordrecht 32.3% 39.4% 28.8% 34.2%Northern wing 8.4% 9.3% 18.0% 18.3%Southern wing 7.6% 10.5% 13.0% 12.6%Randstad 2.2% 3.4% 4.1% 4.9%
5. RELATIONSHIPS BETWEEN DAILY URBAN SYSTEMS MORE IMPORTANT In this section, we focus on the orientation of out-commuters and in-commuters in the Randstad. Do they travel to or from the urban centres, the suburban areas, the Green Heart or the outer ring? On average we find that the commuting from the other areas in the Randstad (the Green Heart and the outer ring) to the daily urban systems has been stable over the years at approximately 11%. In comparison, in the same periode, daily urban systems outside the Randstad have seen a slight increase of incomming commuting from 18% to 19%. Commuting from the daily urban systems of the Randstad to the rest of the Randstad has increased slightly from 4% to 5% since the early nineties (outside the Randstad this figure rose from 10% tot 13%). This can all be explained by the fact that the economic development in the Green Heart and the outer ring has been relatively strong in comparison to the development of the daily urban systems themselves. Commuting between the daily urban systems, however, has increased, within the Randstad from 16% to 18% for both incommuting and outcommuting and outside the Randstad from 9% to 10% for incommuting and from 11% to 12% for outcommuting. For individual daily urban systems in the Randstad the picture for commuting between daily urban systems is comparable to total commuting. Outcommuting to other daily urban systems is relatively high in smaller daily urban systems and incommuting is relatively high in the daily urban systems in the Northern wing (mainly the eastside). Overall we find that 90% of the working population of daily urban systems in the Randstad works in their own daily urban system of one of the other ones (see figure 8). A relatively small share works in the Green Heart, the outer ring or outside the Randstad. For those working in the Randstad we find that more than 80% of them actually lives in the same daily urban system or one of the others in the Randstad (see figure 9).
©Association for European Transport and contributors 2006

0%20%40%60%80%
100%
Amersfoo
rt
Utrech
t
Hilvers
um
Amsterda
m
Haarlem
Leiden
Den Haa
g
Rotterdam
Dordrec
ht
elsewhere in the Netherlandsdaily urban system outside Randstadouter ringGreen Heart
other daily urban system Randstadsame daily urban system
Figure 8. Distribution of commuters to destination location type by home location (source: EBB).
0%20%40%60%80%
100%
Amersfoo
rt
Utrech
t
Hilvers
um
Amsterda
m
Haarlem
Leiden
Den Haa
g
Rotterdam
Dordrec
ht
elsewhere in the Netherlandsdaily urban system outside Randstadouter ringGreen Heartother daily urban system Randstadsame daily urban system
Figure 9. Distribution of commuters to origin location type by work location (source: EBB). Finally, we want to get a closer look at the relationships between the daily urban systems in the Randstad, their urban centres, suburban areas and the other location types. The following maps (figure 10a and 10b) show the total amount of commuting (in and out) for all the municipalities in the Randstad for both 1990/1994 and 2000/2003. The four main urban centres (Amsterdam, The Hague, Rotterdam and Utrecht) clearly have the largest number of commuting relationships and the most local home-to-work-trips. The Hague has fewer relationships, yet strong interactions with especially Amsterdam and
©Association for European Transport and contributors 2006

Figure 10a and 10b. Commuting patterns between municipalities in the Randstad 1990/1994 and 2000/2003. (source: EBB)
©Association for European Transport and contributors 2006

Rotterdam. Between 1990/1994 and 2000/2003 we find a decrease in the amount of commuting around Rotterdam. Furthermore, the interaction between Utrecht and The Hague and between Utrecht and Rotterdam has increased notably. Travel to and from Amsterdam has increased with more and stronger relationships. Only the link between Lelystad and Amsterdam has weakend. Travel concerning the Schiphol area has also increased. 6. ASYMMETRICAL COMMUTING PATTERNS Not only the intensity of commuting is interesting, but also the measure to which flows are symmetrical or asymmetrical. The importance of nodes in a network can be determined from that. In a completely equal network of cities all flows should be of a comparable size, maybe only relative to the size of the nodes. A network with some very strong nodes and a set of weaker ones, might not be functioning as a network at all. The asymmetry score is calculated as the (a→b minus b→a) / (a→b plus b→a). A score of 0% indicates complete symmetry (equal amount of in and out commuting) while a score of 100% indicates complete asymmetry (there is only a flow from one side to the other). Asymmetry can be measured for different types of relationships. We have looked at the symmetry of flows between types of areas (urban centres, suburban areas and other areas), between daily urban systems of different sizes and between the sub-areas of the Randstad (see table 2). The classical example of a daily urban systems includes commuting flows from the suburbs to the urban centre. Table 2 (first section) shows that this is still largely the case in the Randstad area. The main flows go from outside inwards. Furthermore, we find that the asymmetry increases with distance, given the fact that the asymmetry of the relationship between the outer ring and the urban centres is largest (65% indicates a inward flow that is 5 times the size of the outward flow). The development figures, however, show that relationships are gaining in symmetry. Furthermore, we find that the smaller daily urban systems (Amersfoort, Hilversum, Haarlem, Leiden and Dordrecht) function to some extent as a part of their neighbouring larger daily urban systems (Amsterdam, Rotterdam, The Hague and Utrecht). The asymmetry in the relationships between the smaller and larger daily urban systems (table 2, second section) is 37% (twice as much commuters to the larger ones), which is of the same size as the asymmetry between suburban areas and urban centres. This asymmetry is rather constant, indicating neither a movement towards a more equal position of the smaller daily urban systems nor a further development into dormitory suburbs. We also find asymmetry between the larger areas of the Randstad. Almost 1,5 times as many people travel from the Southern to the Northern wing for their jobs as in the opposite direction, and this figure has risen notably in the last decade. This indicates that the position of the Northern wing has become
©Association for European Transport and contributors 2006

stronger in the Randstad. Finally, table 2 (last section) shows the asymmetry of relationships between the four major daily urban systems in the Randstad. This substantiates the findings for the Northern wing since Amsterdam is the main attractor of the four and more people travel from Rotterdam to the other three than come inwards. Table 2. (A)symmetry in commuting flows between location types. (a)symmetry 2002 Increase or decrease 1992-2002
Urb
an
cent
res
Sub
urba
n ar
eas
Gre
en
Hea
rt
Out
er
Rin
g
Urb
an
cent
res
Sub
urba
n ar
eas
Gre
en
Hea
rt
Out
er
Rin
g
Urban centres - - Suburban areas 38% - -1% - Green Heart 36% 29% - -12% -10% - Outer Ring 65% 40% 26% - -15% -7% -8% -
Big
4
Sm
all 5
Gre
en
Hea
rt
Out
er
Rin
g
Big
4
Sm
all 5
Gre
en
Hea
rt
Out
er
Rin
g
Big 4 - - Small 5 37% - 0% - Green Heart 36% 23% - -10% -13% - Outer Ring 58% 35% 26% - -12% -14% -8% -
Nor
ther
n W
ing
Sou
ther
n W
ing
Gre
en
Hea
rt
Out
er
Rin
g
Nor
ther
n W
ing
Sou
ther
n W
ing
Gre
en
Hea
rt
Out
er
Rin
g
Northern Wing - - Southern Wing 21% - 13% - Green Heart 36% 30% - -14% -9% - Outer Ring 55% 39% 26% - -7% -32% -8% -
A’d
am
R’d
am
The
Hag
ue
Utre
cht
A’d
am
R’d
am
The
Hag
ue
Utre
cht
Amsterdam - - Rotterdam 32% - 6% - The Hague 22% -22% - 17% -24% - Utrecht 29% -26% 0% - 16% 3% -8% - Figures 11a and 11b the asymmetry of commuting patterns for the relationships between the municipalities in the Randstad for both 1990/1994 and 2000/2003. From figure 11b it is easy to see that the commuting flows between the four cities in the Randstad (Amsterdam, Rotterdam, The Hague and Utrecht) are most symmetrical, yet not very sizable. Also, commutting within the diamond shape of these cities is relatively symmetrical. Flows from outside the diamond, especially north and west of Amsterdam and south of Rotterdam are most asymmetrical. Amsterdam is clearly the dominant node in the Randstad network, with strong, wide reaching, asymmetrical relationships. The other large urban nodes have fewer and less asymmetrical relationships while the smaller centres have more regional relationships. Comparing the
©Association for European Transport and contributors 2006

Figure 11a and 11b. Asymmetry of commuting patterns between municipalities in the Randstad 1990/1994 and 2000/2003. (source: EBB)
©Association for European Transport and contributors 2006

pattern from 2000/2003 with that from 1990/1994 we find that the asymmetry of the relationships with Amsterdam, Haarlem and the Schiphol area have increased in that period. In other areas, the pattern of change is less clear. This seems to confirm our impression from previous analyses that Amsterdam is the dominant node in the system, and increasingly so. 7. CONCLUSIONS In the Randstad we find an increase of scale in commuting patterns. The average commuting distance has grown between 1992 and 2002 and the distances above 20 kilometers have become more important. This indicates commuting across the borders of the daily urban systems. However, roughly about three quarters of the working population in the Randstad works in their home daily urban system, making this the dominant level of scale for the job market. In 2002 almost 20% of the working population of the Randstad commuted between daily urban systems and this share is rising. In-commuting from the Green Heart is decreasing slightly while commuting from outside the Randstad area is very modest. This indicates that the Randstad, as a spatial framework for the labour market, is growing in relevancy. However, for the moment it is best characterised as a network of loosely connected labour markets on the level of the daily urban systems. On the lowest level of scale, we find the classical concentric daily urban system. The suburban areas have relatively little employment and deliver workers to the urban centres. This has changed only slightly between 1992 and 2002, with some increase of jobs in the suburbs. On a higher level, the smaller daily urban systems have, in general, a negative commuting balance, supplying workers to the neighbouring larger daily urban systems. Although internally, they function as a classical daily urban systems, externally they appear to some extent to be a suburb-like part of the larger neighbours. This pattern has hardly changed over the last decade. On the highest level of scale, we find that the Northern Wing of the Randstad has a stronger positive commuting balance than the Southern Wing. This has increased between the early nineties and the beginning of this century, mainly because of the strong economic development of the Northern Wing. Apart from the total amount of commuting, there are more differences between the north and south. The openness of the daily urban systems in the Northern Wing is larger than that of other daily urban systems. Moreover, commuting has increased there stronger than elsewhere. In conclusion: the Northern Wing is more of a network city than the Southern Wing of the Randstad. Overall, we find that Amsterdam has a dominant position in the Randstad. Employment has grown strongest in this daily urban system, the suburbs here have a positive commuting balance (contrary to the others) and commuting towards Amsterdam has increased notably.
©Association for European Transport and contributors 2006
©Association for European Transport and contributors 2006
In conclusion, the Randstad seems to function primarily as a collection of largely self-sufficient urban regions; when viewing it as a network of cities, we find that Amsterdam is its dominant node, leaving the rest of the Randstad as its backyard. REFERENCES Limtanakool, Narisra, Tim Schwanen & Martin Dijst [2005a] Development in Hierarchy in the Dutch Urban System on the Basis of Flows. In: Colloquium Vervoersplanologisch Speurwerk (CVS) Colloquium Vervoersplanologisch Speurwerk 2005: Sustainable transport: hot or not?, Rotterdam, CVS. Limtanakool, Narisra, Tim Schwanen & Martin Dijst [2005b] A Theoretical Framework and Methodology for Characterising Urban Systems Based on Flows of People: Empirical Evidence from France and Germany. Article submitted for publication in Urban Studies. Ministry of Housing, Spatial Planning & the Environment [2004] National Spatial Strategy. The Hague.