is it profitable to develop a large-scale pv plant without
TRANSCRIPT
Is it profitable to develop a large-scale PV plant
without subsidies? Business Plan Analysis for locations
in Spain, Portugal and United Kingdom
Master Thesis
Krzysztof Marek Działo
Escola Tècnica Superior d'Enginyeria Industrial de Barcelona
Universitat Politècnica de Catalunya
Barcelona 2018

Is it profitable to develope a large scale PV project without subsidies?
Business Plan Analysis for locations in Spain, Portugal and United Kingdom Page 2
Programme: InnoEnergy Master SELECT Environomical Pathways for Sustainable Energy Systems
Conducted at:
KTH Royal Institute of Technology, Stockholm
UPC Universitat Politècnica de Catalunya, Barcelona
Master Thesis:
Is it profitable to develop a large-scale PV plant without subsidies?
Business Plan Analysis for locations in Spain, Portugal and United
Kingdom
Supervisors:
Lucas Philippe Van Wunnik – First UPC Supervisor
Fredric Horta – Second UPC Supervisor
Cooperation: João Garrido – Independent Renewable Energy Advisor
Solar Data: Solargis s.r.o.
Mýtna 48
81107 Bratislava, Slovakia
Convocation: October 2018
Is it profitable to develope a large scale PV project without subsidies?
Business Plan Analysis for locations in Spain, Portugal and United Kingdom Page 3
ABSTRACT
A constantly increased amount of the renewable sources of energy has led to growth of its cost
competitiveness on the global energy market. It is supported by the fact that related
technological and infrastructural costs have been decreasing in the recent years leading to the
solar grid and market parity, that have been already achieved in the south regions of the
European Union. Thus, several market movements can be currently observed: phasing out of
the governmental support mechanisms such e.g. Feed-in-Tariffs; investments in the subsidy-free
solar PV projects across the Europe; further movement towards alternative forms of energy
contracts e.g. Power Purchase Agreements (PPAs). The lastly mentioned PPAs can also be present
in the corporate form that can be beneficial for companies aiming for fast decarbonization of
their electricity consumption.
The following work will try to answer the question whether it is possible and profitable to develop
a 50 MW large-scale PV project without any form of the governmental support. Three different
locations: Alcala de Guadaira in Andalusia, Spain, Evora in Alentejo, Portugal and Milton Keynes
in the South East England, United Kingdom have been chosen for the analysis. The selection of
the regions with similar markets and solar conditions (Spain and Portugal) will enables to examine
the non-climate factors influencing the profitability of the PV project, while the United Kingdom
case will show the importance of the proper solar conditions. The technical analysis has been
conducted in order to estimate the yearly energy production while the economic analysis will try
to answer the major research question about the PV project profitability. The profitability of the
has been determined by comparison of the calculated internal rates of return with the return
rates expected by the investors. Eventually, the sensitivity analysis has been accomplished in
order to identify the external factors that influences on the system’s profitability. The impact of
various irradiation levels, different CAPEX and OPEX costs, electricity prices and debt-to-equity
ratio has been checked.
The performed analysis confirmed that the development of the large-scale PV plant without
governmental support is possible in Spain and Portugal. The best economic performance has
been noticed in case of Portugal due to more favourable policy towards renewable sources of
energy. Regarding the United Kingdom, the poor irradiation conditions are the major obstacle for
the profitability target. However, the performed sensitivity analysis indicates that if solar PV costs
continue its decreasing trends, the mentioned profitability can be also expected in the countries
with lower irradiation levels in the nearest future. The ongoing solar markets actions confirms
that the obtained results are credible and that the aforementioned transition towards
unsubsidized solar PV projects is possible.

Is it profitable to develope a large scale PV project without subsidies?
Business Plan Analysis for locations in Spain, Portugal and United Kingdom Page 4
LIST OF CONTENT
1. INTRODUCTION ................................................................................................................... 10
1.1. BACKGROUND OF THE PROJECT .................................................................................. 10
1.2. OBJECTIVE OF THE PROJECT ........................................................................................ 13
1.3. WHY WITHOUT SUBSIDIES? ......................................................................................... 13
1.4. SCOPE OF THE PROJECT ............................................................................................... 15
2. ADDITIONAL INFORMATION ................................................................................................ 17
2.1. EUROPEAN ENERGY SITUATION .................................................................................. 17
2.2. ELECTRICITY MARKET ................................................................................................... 18
2.2.1. POWER PURCHASE AGREEMENTS ....................................................................... 19
2.2.2. PRICES ON THE WHOLESALE MARKET ................................................................. 20
2.3. SOLAR PHOTOVOLTAICS .............................................................................................. 21
2.3.1. SOLAR PV STATISTICS ........................................................................................... 21
2.3.2. LARGE SCALE PV – TECHNICAL DESCRIPTION ...................................................... 23
2.3.3. STORAGE IMPLEMENTATION ............................................................................... 25
3. LITERATURE REVIEW ............................................................................................................ 26
4. FRAMEWORK ....................................................................................................................... 28
4.1. TECHNICAL ANALYSIS ................................................................................................... 28
4.1.1. LOCATION AND CLIMATE DATA ........................................................................... 29
4.1.2. SOFTWARE DESCRIPTION .................................................................................... 29
4.1.3. COMPONENT SELECTION ..................................................................................... 30
4.1.4. PLANT MODELLING .............................................................................................. 31
4.2. ECONOMIC ANALYSIS .................................................................................................. 35
4.2.1. FINANCIAL TOOLS ................................................................................................ 35
4.2.2. MAJOR ASSUMPTIONS ......................................................................................... 37
4.2.3. CASE STUDIES ...................................................................................................... 41
4.2.4. FINANCIAL MODELLING ....................................................................................... 42
4.2.5. SENSITIVITY ANALYSIS .......................................................................................... 43
5. RESULTS ............................................................................................................................... 44
5.1. TECHNICAL RESULTS .................................................................................................... 44
5.2. ECONOMIC RESULTS .................................................................................................... 48
5.2.1. BASE CASE RESULTS ............................................................................................. 48
5.2.2. SENSITIVITY RESULTS ........................................................................................... 53
6. CONCLUSIONS ..................................................................................................................... 59

Is it profitable to develope a large scale PV project without subsidies?
Business Plan Analysis for locations in Spain, Portugal and United Kingdom Page 5
7. BIBLIOGRAPHY ..................................................................................................................... 61
APPENDIX I ................................................................................................................................... 67
APPENDIX: II ................................................................................................................................. 70
APPENDIX: III ................................................................................................................................ 70
APPENDIX: IV ............................................................................................................................... 71
Is it profitable to develope a large scale PV project without subsidies?
Business Plan Analysis for locations in Spain, Portugal and United Kingdom Page 6
LIST OF FIGURES
Figure 1: Solar Pv competitiveness [7]. ........................................................................................ 12
Figure 2: PCR users and members [25] ........................................................................................ 19
Figure 3: PV Price Development considering the Economies of Scale Effect [37] ....................... 22
Figure 4: General layout of a utility-scale PV plant [13] ............................................................... 24
Figure 5: JinkoSolar JKM 370M-72 Specifications [50]................................................................. 30
Figure 6: Orientation of the PV modules ..................................................................................... 32
Figure 7: Module degradation over project lifetime.................................................................... 34
Figure 8: CAPEX division .............................................................................................................. 40
Figure 9: Conversion process ....................................................................................................... 45
Figure 10: Selected inverter topology [13] .................................................................................. 47
Figure 11: Cumulative FCFF for all the examined locations ......................................................... 49
Figure 12: The cost division during the lifetime of the project .................................................... 50
Figure 13: Revenues vs Expenditures in all the examined locations ............................................ 51
Figure 14: Cumulative FCFE for all the examined locations ......................................................... 52
Figure 15: Price Sensitivity Analysis – post-tax IRR and payback time ......................................... 57
Figure 16: Sensitivity Analysis – Debt-to-Equity Ratio ................................................................. 58
Is it profitable to develope a large scale PV project without subsidies?
Business Plan Analysis for locations in Spain, Portugal and United Kingdom Page 7
LIST OF TABLES
Table 1:Framework of the Analysis .............................................................................................. 28
Table 2: Climate and location data .............................................................................................. 29
Table 3: Major Project Settings [54] ............................................................................................ 31
Table 4: Losses Description .......................................................................................................... 32
Table 5: OPEX Components ......................................................................................................... 38
Table 6: Detailed case studies assumptions – base case scenario ............................................... 41
Table 7: Sensitivity Analysis Components .................................................................................... 43
Table 8: Results of the simulation: Generated Electricity and Plant Performance Indicators...... 46
Table 9: Solar PV plant parameters ............................................................................................. 47
Table 10: Free cashflow to firm - Results ..................................................................................... 48
Table 11: Free cashflow to equity - Results ................................................................................. 52
Table 12: Location comparison .................................................................................................... 53
Table 13: CAPEX & OPEX Sensitivity Analysis – post tax IRR ........................................................ 55
Table 14: CAPEX & OPEX Sensitivity Analysis – payback time ...................................................... 56

Is it profitable to develope a large scale PV project without subsidies?
Business Plan Analysis for locations in Spain, Portugal and United Kingdom Page 8
LIST OF ACRONYMS
ACER – Agency for the Cooperation of Energy Regulators
ASP – Average Selling Price
BDEW – Bundesverband der Energie
BoS – Balance of the System
CAPEX – Capital Expenditures
CEER – Council of European Energy Regulators
CfD – Contract for Difference
CF – Capacity Factor
DC/AC – Direct/Alternate Current
DIF – Diffuse Horizontal Irradiation
EBITDA – Earnings Before Interests, Tax and Depreciation
EBIT – Earnings Before Interests and Tax
EBT – Earnings Before Tax
EES – Electrical Energy Storage
ENTSOE – European Networks for Transmission System Operators
EPC – Engineering, Procurement and Construction
FCFE – Free Cashflow to Equity
FCFF – Free Cashflow to the Firm
Fit – Feed-in-Tariff
GHI – Global Horizontal Irradiation
IFRS – International Financial Reporting Standards
IPP – Independent Power Producer
IRR – Internal Rate of Return
LCoE – Levelized Cost of Electricity
MCO – Market Coupling Operator
NPV – Net Present Value
NRA – National Regulatory Authority
OPEX – Operational Expenditures
O&M – Operation and Maintenance
PCR – Price Coupling Regions

Is it profitable to develope a large scale PV project without subsidies?
Business Plan Analysis for locations in Spain, Portugal and United Kingdom Page 9
PPA – Power Purchas Agreement
PR – Performance Ratio
PTC/ITC – Production/Investment Tax Credits
RPS – Renewable Portfolio Standards
STC – Standard Thermal Conditions
TMY – Typical Meteorological Year
WACC – Weighted Average Cost of Capital
XBID – Intraday Cross Border Solution

Is it profitable to develope a large scale PV project without subsidies?
Business Plan Analysis for locations in Spain, Portugal and United Kingdom Page 10
1. INTRODUCTION
The major purpose of the introduction chapter is to familiarize readers with all the necessary
information about the given dissertation. This chapter has been divided into four major parts.
Firstly, the background information will try to introduce the reader into the selected topic. Then,
the objective of the project will be formulated, following by the discussion about the research
topic. Eventually, the scope of the project, including the justification of all the major decisions will
be described.
1.1. BACKGROUND OF THE PROJECT
Due to international agreements and general movement towards sustainable solutions,
renewable sources of the energy have always been helped by different forms of the governmental
incentives, usually described in the literature as subsidies or support mechanisms. According to
the information presented in [1] six major support mechanisms can be distinguished:
• Direct payments to developers for supplying renewable electricity to the grid in the form
of Feed-in Tariffs or payments of the difference between previously decided strike price
and present wholesale market price – Contracts for Difference.
• Reverse Auctions and Tenders – usually for independent power producers that bid
competitively for the possibility to construct the project according to previously
determined conditions. The conditions are usually set by off-takers or policy makers
considering the specific energy needs and the winner is the developer that presents the
lowest tariff bid.
• Market-based instruments – quantity-based mechanisms such as: Renewable Portfolio
Standards or Quota Obligations that required from the utility that a certain amount
electricity will be coming from the renewable sources of energy. The quantities are
usually confirmed in forms of renewable certificates or carbon certificates.
• Tax incentives – mechanisms that incentivise the investment in renewables by special
tax reductions. As an example: Production or Investment Tax Credits.
• Soft Loans – loans with a special rate conditions, usually much more attractive that the
majority offered by the market. These mechanisms are mostly used in the early stage of
a technology deployment.
• Capital Grants – grants coming from public sources, that help to decrease the up-front
financial costs. This option was mostly used in the earliest stages of the PV development.
All of the mechanisms aimed to both, help developers to improve their cashflows and for the
entrepreneurs to competitively enter the market. The introduction of subsidies helped to
increase the share of renewables in the European power mix and consequently enabled the
renewable technologies to mature [2]. It was correctly believed that through development of the
industries, production and supply chains, the overall cost of the technology will decrease in the
Is it profitable to develope a large scale PV project without subsidies?
Business Plan Analysis for locations in Spain, Portugal and United Kingdom Page 11
future. Described process can be assign to the “Learning Curve1” and “Economies of scale2”
concept that may eventually result in withdrawal of the subsidy policies.
Despite huge increment in renewable generation and further steps towards sustainable
development, the path of managing and organising subsidies was far away from being perfect. In
Spain, limiting the previously negotiated subsidy contracts has led to many difficulties for projects
development influencing disadvantages for all the related business such solar PV factories and
shops. Additionally, common rush in order to receive higher levels of subsidies has led to the
emergence of many falsely registered installations that are currently being investigated on the
suspicion of financial frauds [3]. Nowadays Spanish government has to face many arbitration
processes over cuts to the renewable energy subsidies that may yield in millions of Euros of
compensation to the developer companies [4]. As it can be noticed, the support mechanisms
have brought many advantages to the solar industry, however, the way of its implementation
resulted also in many disadvantages. Thus, it is believed, that there is a still need for new solutions
regarding market mechanisms that may improve present situation.
Currently, the moment of transition in the renewable energy industry can be observed. It is
especially visible in the solar and wind energy technologies. Constantly increased amount of the
renewable sources of energy has led to increment of their cost competitiveness versus
conventional energy sources. This phenomenon can be widely observed across the world and
influences many specialists and scientists. During a webinar regarding the solar market parity in
Europe [5], Mr. Tomas Garcia, claimed that the Southern countries such as: Spain, Portugal or
Italy has already reached the solar market parity. Market parity can be defined as the moment,
when generation costs expressed in the form of LCoE3, considering the wholesale market prices,
can be competitive with the conventional energy sources such as coal or gas power plants.
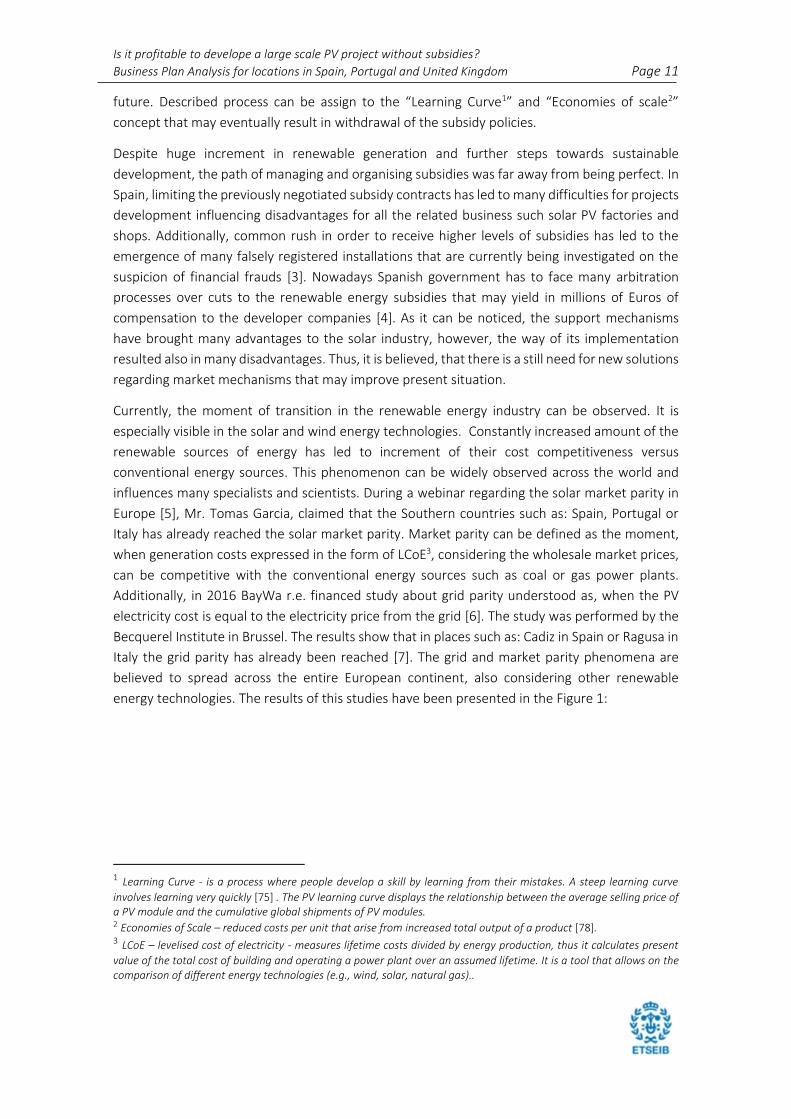
Additionally, in 2016 BayWa r.e. financed study about grid parity understood as, when the PV
electricity cost is equal to the electricity price from the grid [6]. The study was performed by the
Becquerel Institute in Brussel. The results show that in places such as: Cadiz in Spain or Ragusa in
Italy the grid parity has already been reached [7]. The grid and market parity phenomena are
believed to spread across the entire European continent, also considering other renewable
energy technologies. The results of this studies have been presented in the Figure 1:
1 Learning Curve - is a process where people develop a skill by learning from their mistakes. A steep learning curve
involves learning very quickly [75] . The PV learning curve displays the relationship between the average selling price of a PV module and the cumulative global shipments of PV modules. 2 Economies of Scale – reduced costs per unit that arise from increased total output of a product [78]. 3 LCoE – levelised cost of electricity - measures lifetime costs divided by energy production, thus it calculates present
value of the total cost of building and operating a power plant over an assumed lifetime. It is a tool that allows on the comparison of different energy technologies (e.g., wind, solar, natural gas)..

Is it profitable to develope a large scale PV project without subsidies?
Business Plan Analysis for locations in Spain, Portugal and United Kingdom Page 12
Figure 1: Solar Pv competitiveness [7].
Solar grid parity is additionally supported by the report presented during Aurora Spring Forum
2018 [8]. It claims that, if solar continues its historical trend of cost decrease, solar grid parity
might be also reached in countries with significantly lower values of solar irradiation such as Great
Britain. That information creates a huge opportunity for development and deployment of the new
subsidy-free PV projects. Aurora Energy Research in its report [9] has estimated, including the
cannibalization effect, that almost 40% of all the planned renewable projects could be deployed
as a subsidy-free by 2030. This percentage corresponds to around 60 GW that could be installed
in North-West Europe countries. Almost half of this value is represented by the new solar PV
projects.
The introduced market and grid parity concepts will allow developers on building PV plants
without relying on support mechanisms, because they will be able to compete on the wholesale
markets or sell energy directly to large consumers through commercial power purchase
agreements [10]. This topic is currently widely discussed by many specialists and business
developers during many different meetings and events [11], [12]. The general outcome from the
events was very positive regarding further development of the unsubsidized solar PV projects. It
might be an opportunity to introduce changes to the current power markets such as: further
cost`s reduction or increment in the number of investors and new PV business models.
As it can be seen, the changing situation in the PV industry attracts many scientists and solar
developers as well as implies positively on their willingness towards further changes. It is believed
that the subsidy-free renewable energy models may play an important role in the further
development and shaping of the European Energy System, thus more detailed analysis of this
issue is very interesting and might be very useful in the future. It is believed that this work will
serve as a useful, approximate tool to assess the profitability of the utility scale PV projects,
considering different technical, economical and geographical factors.

Is it profitable to develope a large scale PV project without subsidies?
Business Plan Analysis for locations in Spain, Portugal and United Kingdom Page 13
1.2. OBJECTIVE OF THE PROJECT
The following work will try to answer the question whether it is possible and profitable, as for
year 2018, to develop a large-scale PV project (50 MW), without subsidies. As well as what are
the major factors that influences the profitability of the project. The term ‘without subsidies’
means deployment without any forms of government-mandated support that have been mention
previously. The analysis will be performed using particular locations in Spain, Portugal and UK.
The obtained results will be used to compare the profitability of the large-scale PV project
between Spain, Portugal and UK.
1.3. WHY WITHOUT SUBSIDIES?
Since the concept of subsidy-free projects is reasonably young, there is a huge debate among
specialists whether such model has a right to succeed and positively influence on the market of
renewables and their further development. Similar to the subsidized installations, the new
models will have to face with the challenges related to:
• Technology and Grid Integration
• Finance
• Legal Framework
Concerns regarding technology and grid integration might be expressed by the question whether
grid can maintain stability with constantly increased number of renewables. Moreover, there are
opinions questioning the quality and execution of the new projects under further cost pressure.
As an example: leaving cables on the ground instead of burying them or using the worse quality
materials that may result in more frequent failures.
One of the major questions related to the financial aspect is: Considering the constant increment
of the production efficiency, is it possible that costs of renewable technologies will be constantly
decreasing? It is believed that due to the increase of the renewables share, the overall price of
electricity might become more dependent on additional factors such as weather conditions. That
may influence and handicap precise price estimation [2]. Moreover, there is an important issue
whether investors can manage the merchant risk4? Another concern is related to the
‘cannibalization effect’, that describes the situation when more solar PV is injected to the grid
during the central hours of the day. It increases the electricity supply, resulting in the wholesale
price reduction that influences the developer’s income and profitability of the project. Eventually,
there is a group believing that nowadays it is impossible to deliver a large-scale project that has
been left completely without any form of support [8]. Since the costs of providing constant and
stable electricity 24h/7 through the whole year are always spread between consumers, suppliers
and government, thus being precise there always exist a form of support.
4 Merchant Risk – the risk related to thee fact that the developers can earn only what the wholesale market will pay
rather than having secured earnings by the governmental contract [2].
Is it profitable to develope a large scale PV project without subsidies?
Business Plan Analysis for locations in Spain, Portugal and United Kingdom Page 14
In terms of legal objections, there are comments whether national governments together with
the European Organisations will be able to provide appropriate legal framework that will enable
and ease further development and functioning of the project without supporting schemes.
On the contrary, the issues addressed to the technological challenges and integration of
renewables to the grid, will emerge despite the fact whether the new renewable projects are
being subsidized or not. Increased share of renewables forced further development of new
technologies being able to improve and support the major concerns of grid stability such as
frequency and voltage control. Already existing wind and solar power plants are being forced to
follow the requirements described as by grid codes thus the subsequent technological
improvement, including storage technologies, will be unavoidable [13]. Additionally, it may foster
further development of new concepts such as flexible smart grids or business model such as
provision of an ancillary services.
Considering the financial aspect, vision of the energy market that is fully independent from the
policy and government decisions but instead is driven only by the pure market powers might
attract investors. Even though the merchant risk still might be an issue, the risk related to the
retroactive revision of already approved projects disappears thus investors may feel more
comfortable about their investments. Lack of the binding agreements with the government might
incentivise investors to generate electricity when it is mostly needed in order to increase their
incomes [2]. Moreover, the higher income can be also achieved by decreasing capital and
operational expenditures of the PV installations across the whole Europe. Financial costs related
to the investment in the PV projects are also decreasing due to higher investors’ attention
towards solar photovoltaics, that increases the competitiveness on the market [5]. Many experts
additionally believe that long term contracts – power purchase agreements - between suppliers
and large scale industrial or commercial consumers could be a solution to the decrease in the risk
related with estimation of the wholesale market prices. Development of PPAs is not only
beneficial for the project developers but also for the large-scale consumers (e.g. Google or Apple),
aiming in fast decarbonisation of their electricity consumption. The confirmation, that they are
purchasing a green energy will accelerate fulfilling their sustainability targets. According to the
information presented in the report [9], development of the unsubsidized renewable energy
projects will contribute to the positive influence on the environment by further decreasing of the
carbon intensity.
Regarding the financial support it is believed that overall trend towards energy transition will
influence on national governments towards development of legal frameworks favouring and
facilitating appearance of further non-subsidy projects. Since the beginning of the renewables in
Europe we can observe many different political mechanisms that have been trying to adapt the
new technology to the market. Projects without subsidies model can be considered as a new step
forward. It is believed that unsubsidized models will help to re-create the energy market and
additionally enables entering new business models.
Despite negative opinions and concerns, both from the scientific and business environments,
many investors see the reasons to push ahead with unsubsidized models, even though, at
present, they are going beyond pure financial considerations. They believed that it might be
Is it profitable to develope a large scale PV project without subsidies?
Business Plan Analysis for locations in Spain, Portugal and United Kingdom Page 15
a valuable investment for securing future businesses, or for accessing and booking the most
favourable locations or grid connection points, that considering current renewables development
might be an issue in the future. The number of approved or waiting in the pipeline projects can
be taken as a confirmation to this statement [14]. According to Mr Pietro Radoia [15], the amount
of subsidy-free PV projects that have been built or are currently under construction, only within
European Union, is around 676 MW. This number shows the potential behind the new subsidy-
free projects.
1.4. SCOPE OF THE PROJECT
In order to fulfil the objective that has been set for this work, a separate framework will be
developed. The proposed structure will include all the necessary steps and tools that will be used
for the analysis. The major parts of the framework will represent a technical analysis followed by
an economic evaluation and sensitivity analysis. Considering the function of this sub-chapter, it
will serve as the justification of the most important decisions taken during the project
development.
Development of the large-scale PV project is a very complex process that involves many specialists
from different fields. According to the document [16] every solar PV project can be described by
three major variables: application segment, financing scheme and financial business model.
Regarding the first variable, project has to be defined according to one of the following
application segments:
• Single Family
• Multifamily Residential
• Commercial/Public/Industrial Buildings
• Solar Farms
The same large, utility-scale solar PV farm will be analysed for every location. According to the
article [17], it is difficult to define the exact size from which the PV plant can be named large-
scale, however all the research institutes agree that it has to be a megawatt-scale project.
Additionally, the utility-scale plants are selling the produced electricity to the wholesale utility
buyers, usually by signing the different forms of power purchase agreement [18]. The size of the
plant – 50 MW has been selected based on the real-life project information that have been
provided by Global PV Consulting Company. The project is being used as a source of comparison
for the obtained results.
Secondly, the project has to be financed using one or combination of different financing schemes.
Considering this analysis, the project will be financed by the combination of debt in the form of
bank loan and equity, where the investors have a stake in the project or ownership of the assets.
These two financial schemes are often combined together. It is mainly due to better risk
management and funds allocation during the project lifetime. Since the equity investors,
expecting huge returns, can tolerate higher risk operations, they will be more involved in the
initial phase of the project, where the risk of project failure is higher because of uncertainties.
The debt funding will occur during later phases of the project that provides stable returns from
Is it profitable to develope a large scale PV project without subsidies?
Business Plan Analysis for locations in Spain, Portugal and United Kingdom Page 16
the investment [16]. For the simplicity reasons, in this work, both financial schemes will be
allocated equally during the construction and operations phases of the project.
Considering the last variable, the financing scheme, operating strategy and all the involved parties
have to be connected by the particular financial business models e.g. self-consumptions, selling
electricity on the whole-sale market or power purchase agreement. The wholesale long-term
power purchase contract with a stable floor price will be used in this work. This decision has been
made due to ongoing popularity of the PPA in solar PV projects as well as difficulties in estimation
of the future whole-sale electricity prices.
Once the three major variables have been decided the project can proceed to the development
stage. It is a very complex process that involves many specialists from different fields. It can be
divided into the following phases [1]:
• Concept and site selection
• Prefeasibility study
• Feasibility study
• Financing and contracts
• Engineering, construction and commercial operation
• Decommissioning
The more advanced phase of the project, the more detailed technical and financial assessment
needs to be performed, thus it is necessary to use information from already achieved steps for
further actions. This dissertation will be mostly focused on the concept analysis, supported by
prefeasibility and feasibility study that includes technical and financial evaluation of the preferred
option.
To properly examine the objective question, three different locations have been chosen for the
analysis: Alcala de Guadaira in Andalusia, Spain, Evora in Alentejo, Portugal and Milton Keynes in
the South East England, United Kingdom. The selection of the exact locations can be justified
based on the currently existing solar projects that have been commissioned or are presently
under construction. Most recently, the renewable energy company BayWa r.e. and the
Norwegian energy supplier Statkraft has signed the a 15-years Power purchase agreement for a
subsidy-free, 170MW solar plant that will be placed near to Alcala de Guadaira [7]. In Portugal,
the 28.8 MW solar facility is being planned next to Evora city based on the 10-years PPA with local
power distributor Axpo Iberia [19]. Lastly, there is already existing Anesco 10 MW – first fully
subsidy-free project in Great Britain located near to the Milton Keynes town [20]. By choosing
places with already confirmed plans or existing installations, there is a certainty that these venues
have been previously checked in terms of solar conditions as well as restrictions related to the
land availability and grid connection.
Most recently Spain, Portugal and UK have presented high activity in terms of signing new
subsidy-free PV contracts thus analysis of these particular energy markets seems to be the most
reasonable [15]. Introduction of 2 different locations with similar irradiation levels (Alcala de
Guadaira and Evora enables identification of key non-climate factors while the United Kingdom
case will show the importance of proper level of insolation.

Is it profitable to develope a large scale PV project without subsidies?
Business Plan Analysis for locations in Spain, Portugal and United Kingdom Page 17
2. ADDITIONAL INFORMATION
This chapter will provide the most up to date information related to the topic of this dissertation.
The chapter is divided into three main sections. First two sections focus on the European
electricity situation including introduced policies and power market description. Third section
will describe the current status of the Solar Energy and PV technologies.
2.1. EUROPEAN ENERGY SITUATION
The European Union is putting a lot of efforts to make energy more secure, affordable and
sustainable for all its inhabitants. New legislation and rules enable energy transition on many
different layers: implementation of new technologies and renewed infrastructure, free flow of
energy across the borders by implementation of a fully integrated energy market, energy
efficiency or decarbonising the economy. All the ongoing changes related to every layer follow
the general strategy framework that describes the long-term goals for the nearest decades.
Three energy packages have already been introduced in 1990s, 2003 and 2009 containing
legislative proposals for renewable energy generation, energy efficiency, energy performance in
buildings and electricity market design including electricity regulations, electricity directive and
risk preparation. The Third Package from 2009 had a huge impact on the electricity market
operation. As stated in [21], it included the following aspects:
• Separation of the energy supply and generation from the operation of transmission
networks – unbundling
• Strengthening the independence of regulators from industry interests and government.
Additionally, the regulators from different European countries should collaborate in
order to promote the further opening of the internal European market
• Increasing the transparency on the retail markets favouring energy consumers and
securing their rights
• Creation of the European Networks for Transmission System Operators (ENTSOE) and
Agency for the Cooperation of Energy Regulators (ACER)
The establishment of the both ENTSOE and ACER aims to improve and smooth the further
transition towards single, unify, European electricity market. ACER as a fully independent agency
should control and guide in operation such as: cross-border electricity regulations, review of the
network development plans, coordination of the National Regulatory Authorities, monitoring the
functioning of the internal markets and protection of the consumer rights. ACER is additionally
supported by the non-for-profit agency: Council of European Energy Regulators. Both agencies
sharing common targets thus their work is complementary, CEER is more responsible for sharing
the experience and information with similar agencies around the globe. While the mentioned
agencies are mostly focused on the regulatory and legislative parts, the major task for the ENTSOE
is to check and control all of the planned changes regarding the technical and practical aspect
[21]. The major task are as follows: standard and network codes development, monitoring and
inspection of the new network investments and new transmission capabilities.
Is it profitable to develope a large scale PV project without subsidies?
Business Plan Analysis for locations in Spain, Portugal and United Kingdom Page 18
On the 30 of November 2016, the European Commission presented the newest package of
measures – “The Winter Package” [22]. The framework covers all the aforementioned issues,
however, in a more detailed and regulated version. The package adapts to the current status of
the energy transition, considering the level of development in all of the EU member countries.
The ACER position has been strengthened and new targets for the energy efficiencies and
renewable sources penetration have been set. The package has not yet been implemented,
presently it is discussed and consulted by the European Parliament and Council of the European
Union.
2.2. ELECTRICITY MARKET
Power plants generate its revenues by selling power. The way of selling this power depends on
both the power sector structure and the regulations that govern certain electricity market.
European electricity market is a very complex and rapidly changing market. It has to manage
issues, related to different type of the customer, length of energy contracts and distances. In
order to provide electricity to its final destination, several market’s divisions have been
introduced. Regarding the type of customers the retail and wholesale energy markets can be
distinguished [23].
The retail energy market mostly caters local offers between suppliers and consumers. The
consumer has a right to choose between different suppliers while the supplier is invoicing the
customer for the provided electricity.
The wholesale electricity markets gather generators, electricity suppliers and large industrial
consumers. The transaction holding on the wholesale markets are on a much bigger scale and
have a strong influence on the price of electricity, maintaining the grid stability and risk
management.
Currently, wholesale markets are being integrated on the European level - market coupling. It is
a gradual evolution towards a single wholesale market with the wholesale prices getting more
similar in every region. It bases on the fact that the high price locations will try to import the
electricity from the low-price ones thus resulting in overall price reduction. This phenomenon is
strongly related to the transmission capacities, lack of cross border connections may influence
the price differences between different market regions leading to the market splitting [23]. Thus,
improvement of the interconnection between the member countries will significantly accelerate
the achievement of the common European electricity market.
The Market Coupling Operator Plan has been introduced by European Commission and accepted
by all the NRAs in order to develop a strategy for a smooth integration of all European day-ahed
and intraday markets [24]. The plan consists from the following resolutions:
• Adoption of the Price Coupling Regions solution as the base for coupling all European
day-ahed markets
• Adoption of the intraday cross-border solution as the base for coupling all European
Intraday markets
Is it profitable to develope a large scale PV project without subsidies?
Business Plan Analysis for locations in Spain, Portugal and United Kingdom Page 19
• The NEMO Committee will be controlling the implementation of the aforementioned
plans
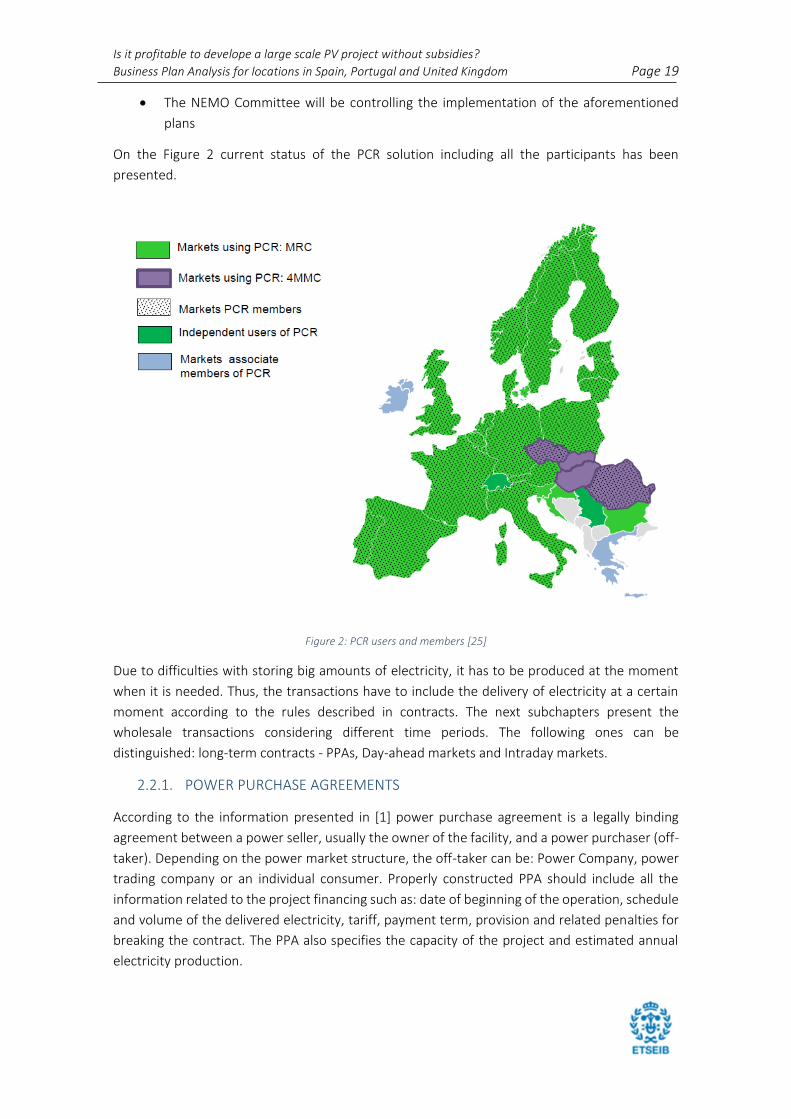
On the Figure 2 current status of the PCR solution including all the participants has been
presented.
Figure 2: PCR users and members [25]
Due to difficulties with storing big amounts of electricity, it has to be produced at the moment
when it is needed. Thus, the transactions have to include the delivery of electricity at a certain
moment according to the rules described in contracts. The next subchapters present the
wholesale transactions considering different time periods. The following ones can be
distinguished: long-term contracts - PPAs, Day-ahead markets and Intraday markets.
2.2.1. POWER PURCHASE AGREEMENTS
According to the information presented in [1] power purchase agreement is a legally binding
agreement between a power seller, usually the owner of the facility, and a power purchaser (off-
taker). Depending on the power market structure, the off-taker can be: Power Company, power
trading company or an individual consumer. Properly constructed PPA should include all the
information related to the project financing such as: date of beginning of the operation, schedule
and volume of the delivered electricity, tariff, payment term, provision and related penalties for
breaking the contract. The PPA also specifies the capacity of the project and estimated annual
electricity production.
Is it profitable to develope a large scale PV project without subsidies?
Business Plan Analysis for locations in Spain, Portugal and United Kingdom Page 20
The PPA tariff can be set in various ways [16]:
• Fixed PPA price for the duration of the contract
• Tracker PPA that set discounts basing on the wholesale or retail electricity price situation
• PPA with more dynamic discounts, especially on the retail electricity price
Solar PV market is a good technology for the first way due to the fact that most of the PV system
costs are mostly at the beginning of the project. Compared to tracker PPAs, the fixed price
contract decreased the risk of sudden price drop to the investors.
Presently, due to transition towards distributed generation, where the power is sold directly to
the end user, emergence of new financial business models can be observed. Such models also
require purchasing agreements, usually named as commercial (corporate) PPAs that bind the off-
taker (either individual residence or a huge industrial facility) to purchase power for a previously
defined period [26]. The major advantages for off-takers are as follows: long-term cost
affordability and recognition in carbon emission (if the PPA concerns renewable sources), while
for the suppliers: easier bankability with secured revenues and business development. Huge
popularity of corporate PPAs is caused by the fact that organisations and companies are looking
for ways to reduce their carbon footprint and increase the energy efficiency resulting in fulfilling
their sustainability targets. Thus, they decide to purchase power from high quality renewables
suppliers as a part of their energy management strategy.
Only in 2017, the 5.5 GW of corporate PPA agreements have been signed worldwide, more than
half of this value is coming from the USA. However, new activity can be observed in sub-Saharan
countries or Mexico. Compared to the previous years, in Europe, the development of the PPA
activity remains on the same level - around 1 GW, mostly focusing on Nordic countries,
Netherlands and United Kingdom. It was mostly due to stable subsidy policy and integrated
energy market [27].
2.2.2. PRICES ON THE WHOLESALE MARKET
It is a very important type of market that is responsible for the for the delivery of the electricity
for the next day. The prices of the electricity are being set every day at noon for the following
24 hours. Market agents participate by proposing electricity transactions through presentation of
electricity sales and purchase bids. While talking about electricity, the auctioneer wants to
purchase electricity with the lowest possible price thus the participants try to offer the lowest
fare [28]. Once the market is closed, all the bids and sales are gathered together. Then,
considering the priorities between different sources of energy - merit order criterium, the general
curves of supply and demand are obtained. The intersection of the curves indicates the clearing
price – the most expensive price accepted by the demand, and the corresponding clearing volume
[29]. For all the European electricity markets, the EUPHEMIA algorithm has been adopted for this
task [30]. The algorithm has been programmed to optimise the overall income additionally
including the congestion charge. Once, the prices are being set, the process has to be also
checked in terms of physical feasibility. The algorithm results are being sent to the system
operators in order to check their technical viability, thus it can be assured that the market results

Is it profitable to develope a large scale PV project without subsidies?
Business Plan Analysis for locations in Spain, Portugal and United Kingdom Page 21
can be technically accomplished. The technical check can influence the initial market results;
however, it is necessary for the proper functioning of the whole system.
Once the results of the day-ahead market are being set, the market agents can again participate
in the power auctions on the intraday markets that deal with the sale and purchase of energy
during the day of delivery. This practise is used to adjust the generation schedules obtained from
the day-ahead market before the real time operations [29]. The auctions sessions are being
scheduled during the day. The principles of the market operation are the same as for the
wholesale market, however, the intraday market allows on readjusting the schedule of the market
agents more closely to the real time. It supports market agents and enables their smoother and
more flexible operation.
Historically speaking, vast majority of the PV projects relied on the power purchase agreements
[31]. However, the reduction of solar costs as well as constant technological advancement foster
the growth of the solar merchant power plants. These power plants can compete directly on the
whole-sale markets without any long-term agreement. It is becoming a popular practice
especially in the regions with high solar irradiation. Latin America countries such as Mexico and
Chile, due to low-cost utility PV systems, are the major players in the field of merchant market PV
plants. 14 out of 15 top merchant solar projects is located or planning to be located in those two
countries [31]. Regarding European market, countries like Spain, Portugal or Italy have also
announced ongoing merchant solar projects. Thus, it is believed that if the solar development
costs will continue to decline, in the next years transition towards merchant projects can be
observed.
2.3. SOLAR PHOTOVOLTAICS
According to the website [32], European Union aims to become the major actor in the field of
sustainable, low carbon and environmentally friendly economy that will be setting the standards
for renewable energy production, clean technologies and fight against global warming. The
development of solar PV technologies is a huge contributor to the overall success of this strategy.
The sub-chapters 2.3.1 - 2.3.3 will provide information regarding the current status of the
development of the photovoltaic industry as well as basic technical description.
2.3.1. SOLAR PV STATISTICS
Based on the information presented in the recent report about renewable sources of energy [33],
it can be noticed that solar photovoltaics is the fastest growing source of renewable energy. It is
represented as the average annual growth rate of world renewables supply. In the period
between 1990 and 2015 solar photovoltaics has noted annual growth of 45,5% which is almost
twice bigger than the second in line wind energy. Such increment is influenced by big investments
in the PV sector in EU, China and USA. In 2016, the total installed capacity of solar PV within the
European Union has exceeded 100 GW, that corresponds to more than 48 million of m2 of total
collector surface. Additionally, such capacity enables on more than 108 TWh of energy produced
in one year. Germany, United Kingdom and Italy together represent almost 70% of this value [34].
Is it profitable to develope a large scale PV project without subsidies?
Business Plan Analysis for locations in Spain, Portugal and United Kingdom Page 22
Rapid growth of the PV industry is strongly related with its increasing cost competitiveness on the
energy market. As it was mentioned in the introduction chapter, the LCOE of the PV application
can compete with conventional energy on some power markets. It is mostly due to the fact, that
in the last years, solar generation costs have decreased significantly, mostly driven by the huge
Chinese production of solar cells [35]. According to the document [36] China together with Japan
are accounted for almost 70% of the global module production between 2015 and 2016.
Currently the dominant module technology is Crystalline silicon accounted for 94% of total
production in 2016 with the average module efficiencies around 17-18%. However, recent
laboratory tests show that by 2024 the efficiencies of mass-produced Crystalline silicon modules
can rise up to 20-25%. The efficiency improvement together with increased usage of tracking
systems and deployment of the PV projects in regions with great solar conditions strongly
influence on the overall increment of the capacity factor of the PV project, that additionally
decrease the LCOE of the PV technologies.
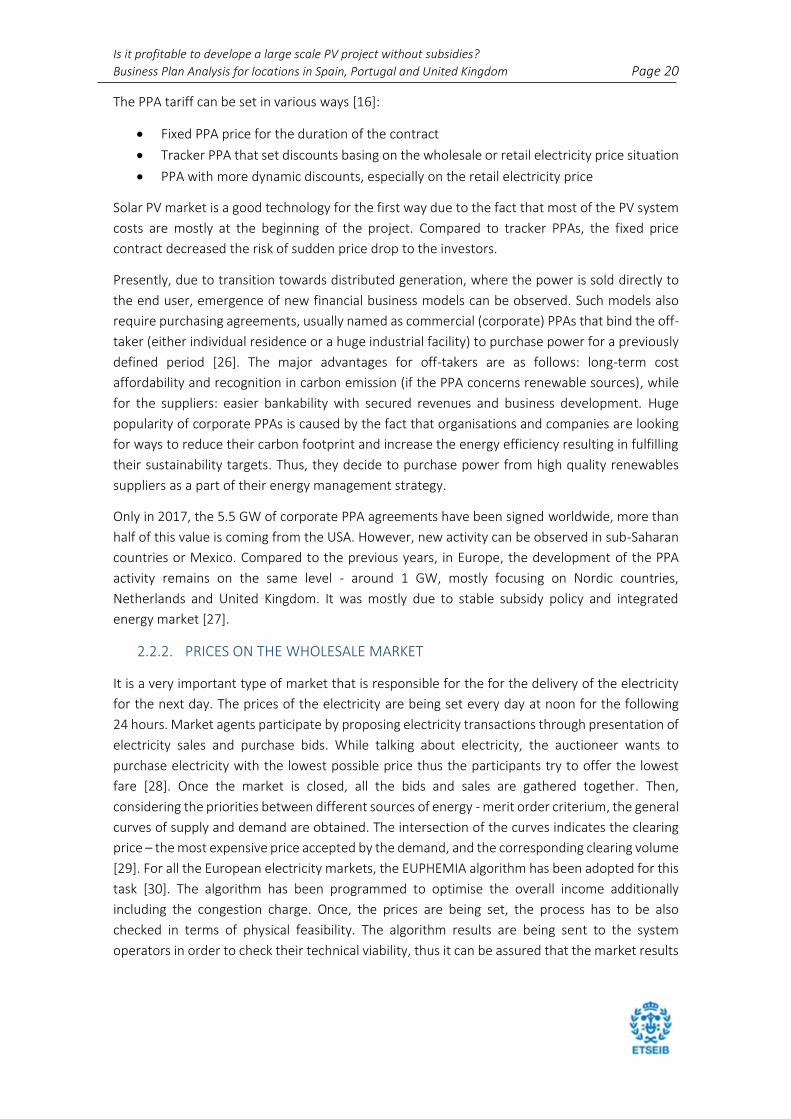
Considering the economic aspect, in the period between 2010 and 2017, the solar PV module
prices have decreased by 83%. The price reduction was primarily driven by the economies of
scale, but most recently it is also connected with the improvements of the technological
processes and efficiency gains – learning curve [36]. PV price decrease due to the economies of
scale can be seen on the Figure 3. For every doubling of the cumulative PV delivery, there is an
approximate 22% of average sailing price reduction [37]. The recent PV prices, as for 2018,
achieved by almost all major PV manufacturers are around 0,32 USD/W and the further cost drop
is expected. It is predicted that the PV price might be around 0,25 USD/W in 2021. The costs of
other components are also going down, most recent central inverter costs are around
0,06 USD/W [38].
Figure 3: PV Price Development considering the Economies of Scale Effect [37]
Is it profitable to develope a large scale PV project without subsidies?
Business Plan Analysis for locations in Spain, Portugal and United Kingdom Page 23
The overall module costs reduction could be observed almost on every market however with
different scale. The differences between regions are mostly caused by the market preferences
regarding the module type as well as the costs connected with the module import. The decreased
technology cost influences the overall total installed cost of the PV technologies, however
providing different values between regions. It can be explained by differences in the maturity
level of the local PV markets supported by experience of the investors and political situation. In
general, in the period of 2010-2017, many countries have experienced total cost reduction of
almost 70%. This decrease has additionally influenced on the significance of the Operational and
Maintenance cost, that now in some location can account for almost 25% of the total LCoE value
[36].
The decreased costs and increased capacity factors of the PV projects strongly influenced the
LCoE of the large-scale PV installations. It is estimated that, in the period between 2010 and 2017,
the LCoE value for the large-scale PV has decreased by 40-75% depending on the country. The
decrement is mostly driven by the technological improvement as well as the increased capacity
factors. The LCoE values are expecting to still decrease in the nearest future, thus making space
for development of new PV projects [36].
2.3.2. LARGE SCALE PV – TECHNICAL DESCRIPTION
The major task of the PV plant is to produce electricity out the incoming solar irradiation. This
process is done due to the use of the electrical components. According to [13] these devices have
three major tasks:
• Convert solar energy into electricity
• Connect large-scale PV plant to the grid
• Assure the proper performance of the PV plant
The typical large-scale PV plant is a very complex installation; however the following major
components can be distinguished as: PV module; inverter; mounting structure; connection and
distribution boxes; cabling, potential equalization and grounding; lightning protection system;
weather station, communication and monitoring; transformer station; infrastructure and
environmental influence; miscellaneous. Most recently, the storage implementation has become
a huge topic, while talking about the improvement of the PV plants performance, therefore the
usefulness of this components is being discussed in the next sub-chapter. In this sub-chapter the
major focus is put on the: PV panels, PV inverters and transformers as for their involvement in
the large-scale PV plant operation:
PV modules as the devices responsible for the energy conversion processes are the crucial
components of every power plant. Their efficiency is one of the most important aspect during
sizing phase of the project thus the efficiency strongly affects the occupied area. It additionally
influences all the secondary operations such as transportation, installation and maintenance.
Most recently, strong focus is being put on the manufacturing and future recycling of the PV
panels, the overall goal is to maximise the reduction of the related CO2 emission.

Is it profitable to develope a large scale PV project without subsidies?
Business Plan Analysis for locations in Spain, Portugal and United Kingdom Page 24
PV inverters as a device that converts the DC to AC power is a necessary step to connect the PV
plant to the grid. The inverters are responsible to cover all the electrical requirements set to the
PV plant such as: galvanic isolation to protect form the leakage current from the PV
interconnections; maximum power point tracker; power quality and operational characteristics
required by the particular country. Moreover the large-scale PV plants are asked to provide the
grid support issues e.g. voltage and frequency control.
Regarding the large-scale PV installations, two types of transformers are being installed. First one
that increase the voltage to the medium voltage values, and the second one that provides the
galvanic isolation from the grid and additionally increase the voltage to the high voltage values.
Once, the major components have been described, the connection between them can be
explained. Considering the large-scale installation, three different configurations can be
distinguished: central, string and multi-string. According to [13] for the large-scale installations,
the central configuration is preferable. It is mostly due to the low installation and maintenance
costs, that are the crucial factor during the decision process. The next step is selection of the most
appealing AC grid topology. The most popular are: radial, ring and star topologies. Due to its
cheapness and simplicity, the radial one is the most suitable for large-scale applications. Typical
large-scale installation has been presented on the Figure 4.
Figure 4: General layout of a utility-scale PV plant [13]

Is it profitable to develope a large scale PV project without subsidies?
Business Plan Analysis for locations in Spain, Portugal and United Kingdom Page 25
2.3.3. STORAGE IMPLEMENTATION
Solar PV project is an investment that lasts more than 25 years, thus it should include the
possibility of further development in order to remain competitive on the power market in the
nearest years. One of the possibilities to increase the flexibility of the system that will succeed in
higher credibility, is implementation of the electrical energy storage systems. Such modification
enables to store the generated electricity and inject it into the grid during the periods when
energy is mostly needed or when electricity cannot be generated due to poor weather conditions.
Deployment of EES increased the efficiency of the system due to higher amount of produced
energy, that directly contributes to increased revenues. Additionally, it supports the emission
reduction and lower the PV output curtailments.
Installed on a large scale, EES could also bring revenues by providing ancillary grid services such
as frequency and voltage control that will succeed in higher power quality. According to the article
[39] only in the US market, the economy loses from 15 to 24 billion of US dollars due to power
quality. This cost could be partially decreased by deployment of the storage technologies.
Currently, the EES are still expensive and not legally regulated thus their implementation to the
PV projects is small, however, many already existing installations consider future deployment of
the EES technologies [40]. They may serve as a perfect complement to the current projects that
will make them even more cost and quality competitive in the nearest future. For the sake of
simplicity during system modelling, storage technologies will not be included in this analysis.
Is it profitable to develope a large scale PV project without subsidies?
Business Plan Analysis for locations in Spain, Portugal and United Kingdom Page 26
3. LITERATURE REVIEW
Profitability assessment is a crucial issue while talking about new PV investments thus many
studies have been performed in order to examine different methods of assessing profitability of
a certain project as well as detailed factors that mostly influenced the obtained results. These
analyses have been performed considering both subsidized and unsubsidized PV projects
implemented to different European electricity markets. Moreover, since deployment of the PV
project is a very complex process that involves many different fields, there exist many works that
examine this issue.
As it was mentioned in the previous chapters, initially, deployment of the solar PV projects
expected very rapid growth, mostly caused by favourable policy. Thus, there exist many articles
that widely describes different national support schemes and ways of their implementation. In
the article [41] there is a wide description of French, German, Greek, Italian and British position
regarding development of PV systems including implementation of different supporting policies.
In order to estimate the impact of particular support schemes and predict future energy policies,
comparative profitability analysis based on major economic indexes such as net present value
and internal rate of return, is performed considering these five locations. Similar analysis was
performed by the same authors in [42], expending the level of research to all western European
Union countries, while information in the [43] provides some additional explanation to the
Spanish PV legal framework during the highest expansion of the Spanish PV sector.
Once the solar photovoltaic sector started questioning the policy towards renewable energy
subsidies, this issue has been also addressed in many researches. In article [44] there is a
discussion about the relevance of the feed-in tariffs in the near and post-grid parity world. It
examines the willingness for PV investments considering investors and business models
diversification. German, Italian and Swiss electricity markets are being analysed. The results show
the dependence of market trends on the policy and revenue-based risks. In [45] the negative
impact of the several cost-containment mechanisms on the profitability of Solar PV plants on the
Spanish market has been discussed. It is mostly focused on the governmental actions after huge
expansion of the photovoltaic installations in Spain.
Regarding unsubsidized projects, very broad profitability analysis of small-scale, residential PV
systems (3 kW, 6kW and 20 kW) in an Italian electricity market, additionally supported by
sensitivity analysis of critical variables such as: investment cost, electricity price, insolation level,
has been performed in the article [46]. The only difference to this work is, that the authors
additionally included revenues from self-consumption. The obtained NPV and discounted
payback time show that small-scale photovoltaic systems can adapt to the ongoing market
transition towards unsubsidized electricity market. Additionally, conducted environmental
analysis presents huge reduction of CO2 emission compared to conventional sources of energy.
Similar research, including the same economic indexes, however for bigger-scale PV power plants
(200 kW, 400 kW, 1 MW and 5 MW) has been performed by the same authors in [47]. The analysis
results show perspectives for investments in bigger-scale PV systems in the nearest future. Strong
impact is put on the gains from self-consumption, thus opportunities especially for the industrial

Is it profitable to develope a large scale PV project without subsidies?
Business Plan Analysis for locations in Spain, Portugal and United Kingdom Page 27
and commercial sector. Another feasibility study that checked the profitability of the large-scale
PV project (1MW) has been performed in the [48]. It is a very detailed investigation of the Cyprus
island, strongly focused on the legislative framework and sensitivity analysis of critical parameters
for the viability of the project. The results show the importance of capital expenditures while
talking about the unsubsidized.
Considering project development, the information contained in [1] provide a very consistent
guidelines for project developers about utility-scale solar photovoltaic power plants. It focuses on
the entire project life-time from site selection to final financial analysis, while [16] precisely
described different solar PV business models currently used within European Union. Technical
aspects of large-scale PV plants are being presented in [13]. This article deeply examines the
internal layout of the PV installation, including electrical components, plant configuration and
collection grid topologies in order to obtain the best design, operation and control of the PV
power plant.

Is it profitable to develope a large scale PV project without subsidies?
Business Plan Analysis for locations in Spain, Portugal and United Kingdom Page 28
4. FRAMEWORK
In this chapter, all the information regarding the methodology as well as used tools and
assumptions will be provided. The chosen framework will consist from two major parts. The
technical analysis, that will lead to estimation of the energy produced during lifetime of the
project. The economic analysis that will try to answer the research question whether it is
profitable to develop such a project in every of the chosen locations. The research will be closed
by sensitivity analysis that will indicate the key factors that influences the profitability of the large-
scale PV project. Table 1 presents all the framework components that will be included in this
analysis.
Table 1:Framework of the Analysis
Type of Analysis Components of the analysis
Technical
Research Data
Modelling Tool
Solar PV Plant Components
Plant Simulation
Economic
Financial Tools
General Assumptions
Case Studies
Financial Modelisation
Sensitivity Analysis:
• Energy dependence
• Cost/Price dependence
• Financial dependence
4.1. TECHNICAL ANALYSIS
With the use of the PVSyst software and solar irradiation data provided by the Solargis, the power
output from the 50 MW solar photovoltaic plant will be estimated for every of the selected
location. The analysis will include design of the plant layout together with selection of the major
components that will be used for the simulation.
Is it profitable to develope a large scale PV project without subsidies?
Business Plan Analysis for locations in Spain, Portugal and United Kingdom Page 29
4.1.1. LOCATION AND CLIMATE DATA
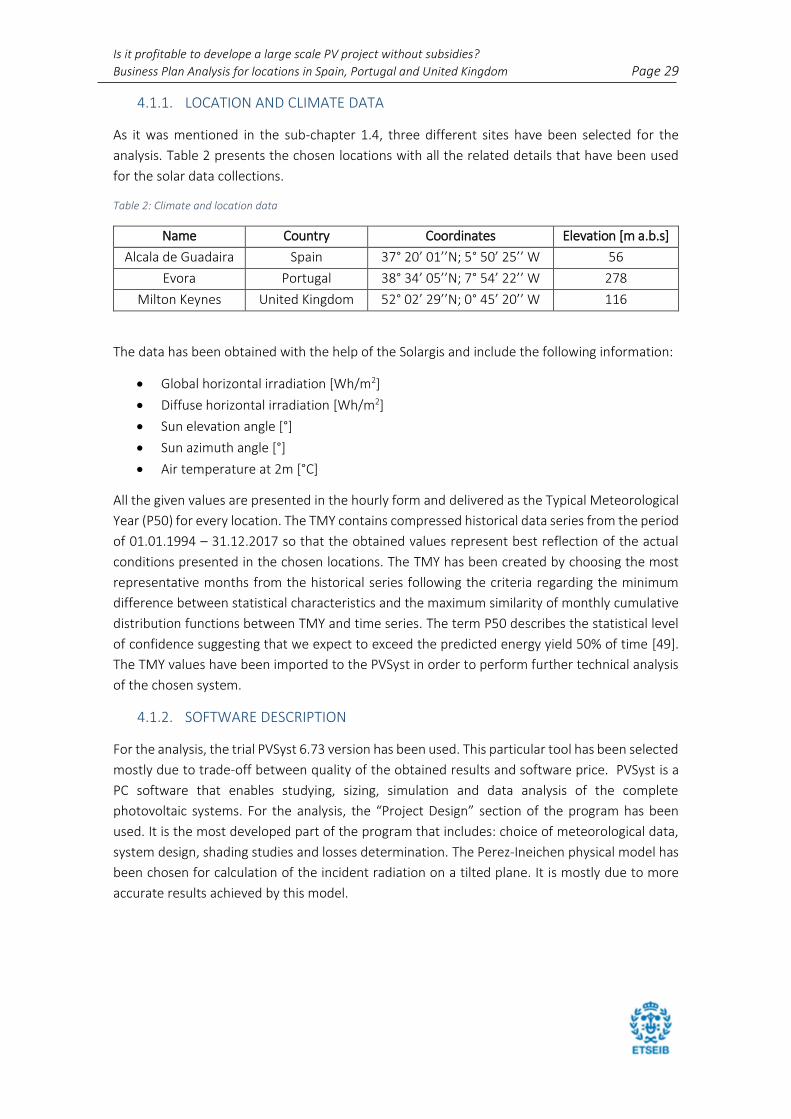
As it was mentioned in the sub-chapter 1.4, three different sites have been selected for the
analysis. Table 2 presents the chosen locations with all the related details that have been used
for the solar data collections.
Table 2: Climate and location data
Name Country Coordinates Elevation [m a.b.s]
Alcala de Guadaira Spain 37° 20’ 01’’N; 5° 50’ 25’’ W 56
Evora Portugal 38° 34’ 05’’N; 7° 54’ 22’’ W 278
Milton Keynes United Kingdom 52° 02’ 29’’N; 0° 45’ 20’’ W 116
The data has been obtained with the help of the Solargis and include the following information:
• Global horizontal irradiation [Wh/m2]
• Diffuse horizontal irradiation [Wh/m2]
• Sun elevation angle [°]
• Sun azimuth angle [°]
• Air temperature at 2m [°C]
All the given values are presented in the hourly form and delivered as the Typical Meteorological
Year (P50) for every location. The TMY contains compressed historical data series from the period
of 01.01.1994 – 31.12.2017 so that the obtained values represent best reflection of the actual
conditions presented in the chosen locations. The TMY has been created by choosing the most
representative months from the historical series following the criteria regarding the minimum
difference between statistical characteristics and the maximum similarity of monthly cumulative
distribution functions between TMY and time series. The term P50 describes the statistical level
of confidence suggesting that we expect to exceed the predicted energy yield 50% of time [49].
The TMY values have been imported to the PVSyst in order to perform further technical analysis
of the chosen system.
4.1.2. SOFTWARE DESCRIPTION
For the analysis, the trial PVSyst 6.73 version has been used. This particular tool has been selected
mostly due to trade-off between quality of the obtained results and software price. PVSyst is a
PC software that enables studying, sizing, simulation and data analysis of the complete
photovoltaic systems. For the analysis, the “Project Design” section of the program has been
used. It is the most developed part of the program that includes: choice of meteorological data,
system design, shading studies and losses determination. The Perez-Ineichen physical model has
been chosen for calculation of the incident radiation on a tilted plane. It is mostly due to more
accurate results achieved by this model.
Is it profitable to develope a large scale PV project without subsidies?
Business Plan Analysis for locations in Spain, Portugal and United Kingdom Page 30
4.1.3. COMPONENT SELECTION
PVSyst analysis enables on selection of two major components that will influence the
performance of the PV plant: PV module and Inverter, thus the major focus of this subchapter is
put in those two devices.
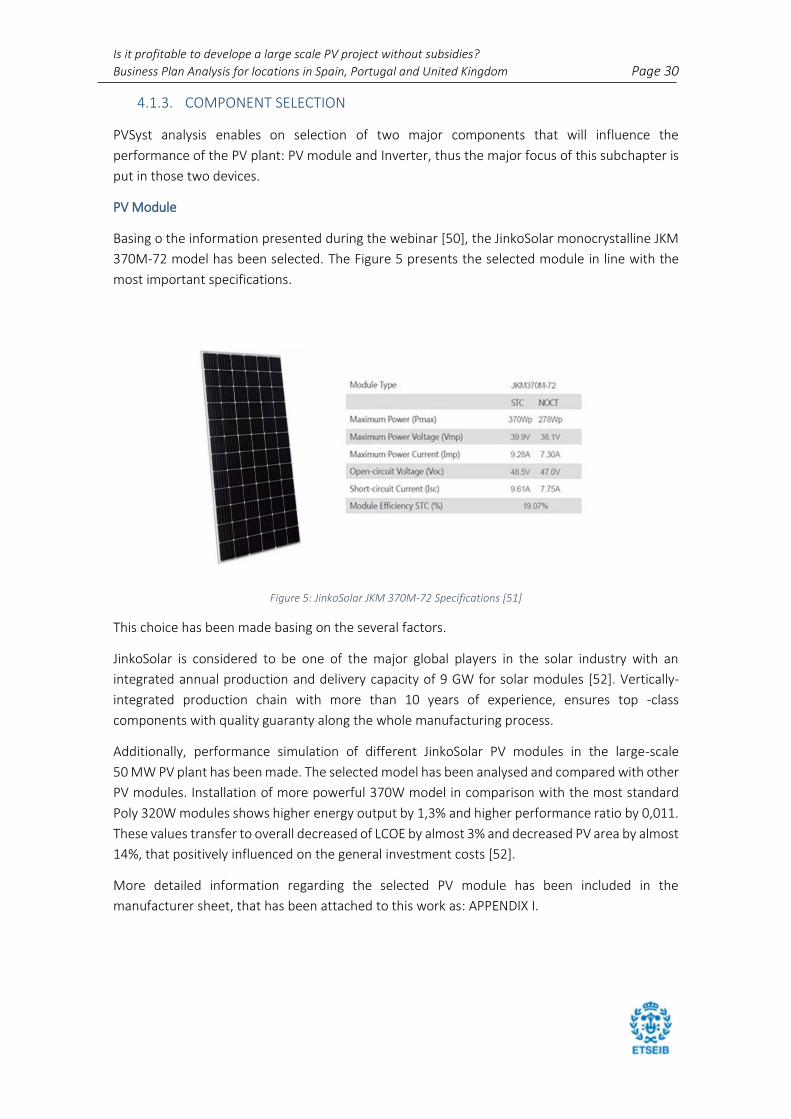
PV Module
Basing o the information presented during the webinar [50], the JinkoSolar monocrystalline JKM
370M-72 model has been selected. The Figure 5 presents the selected module in line with the
most important specifications.
Figure 5: JinkoSolar JKM 370M-72 Specifications [51]
This choice has been made basing on the several factors.
JinkoSolar is considered to be one of the major global players in the solar industry with an
integrated annual production and delivery capacity of 9 GW for solar modules [52]. Vertically-
integrated production chain with more than 10 years of experience, ensures top -class
components with quality guaranty along the whole manufacturing process.
Additionally, performance simulation of different JinkoSolar PV modules in the large-scale
50 MW PV plant has been made. The selected model has been analysed and compared with other
PV modules. Installation of more powerful 370W model in comparison with the most standard
Poly 320W modules shows higher energy output by 1,3% and higher performance ratio by 0,011.
These values transfer to overall decreased of LCOE by almost 3% and decreased PV area by almost
14%, that positively influenced on the general investment costs [52].
More detailed information regarding the selected PV module has been included in the
manufacturer sheet, that has been attached to this work as: APPENDIX I.
Is it profitable to develope a large scale PV project without subsidies?
Business Plan Analysis for locations in Spain, Portugal and United Kingdom Page 31
INVERTER
The inverter model has been selected basing on the discussion with [53]. The SMA Sunny Central
1000CP XT model with a 1 MW of nominal power has been chosen. The size of the inverter has
been chosen base on the optimal trade-off between the reliability of entire PV system and
number of inverters. It is a central type inverter for outdoor use with a maximum efficiency of
98,71% and maximum DC voltage of 1000V. At the temperature up to 25°C, the inverter can work
at 110% of its nominal power, while at temperatures 25-40°C, the AC power output decreases to
100% [54]. Additionally, the chosen model as well as all SMA inverters renown grid-integration
issues and PV power plants control. The selected model provides all necessary grid services to
fulfil the requirements specific for every country of installation [54]. Moreover, according to
standards presented in Germany - BDEW [13], all the utility-scale PV plants must provide grid
support functions. All the additional features of the selected model have been included in
APPENDIX I.
4.1.4. PLANT MODELLING
The aim of the modelling part is to obtain the energy output in the form of electricity that is
injected directly to the grid. Technical parameters of the PV plant have been set as identical for
all the locations in order to obtain the most similar plant design, thus the profitability comparison
between plant locations will be focused mostly on the economical and solar irradiation factors.
The same procedure, already implemented to the PVSyst software, has been used for every
location:
i. PV plant site has been determined and all the geographical and climate parameters
(paragraph 0 ) have been imported to the software.
ii. Major project settings have been defined. All the modified variables have been presented
in the Table 3, while other such as: reference temperatures and shading limitations have
been set as according to software recommendation and can be seen in the APPENDIX: II.
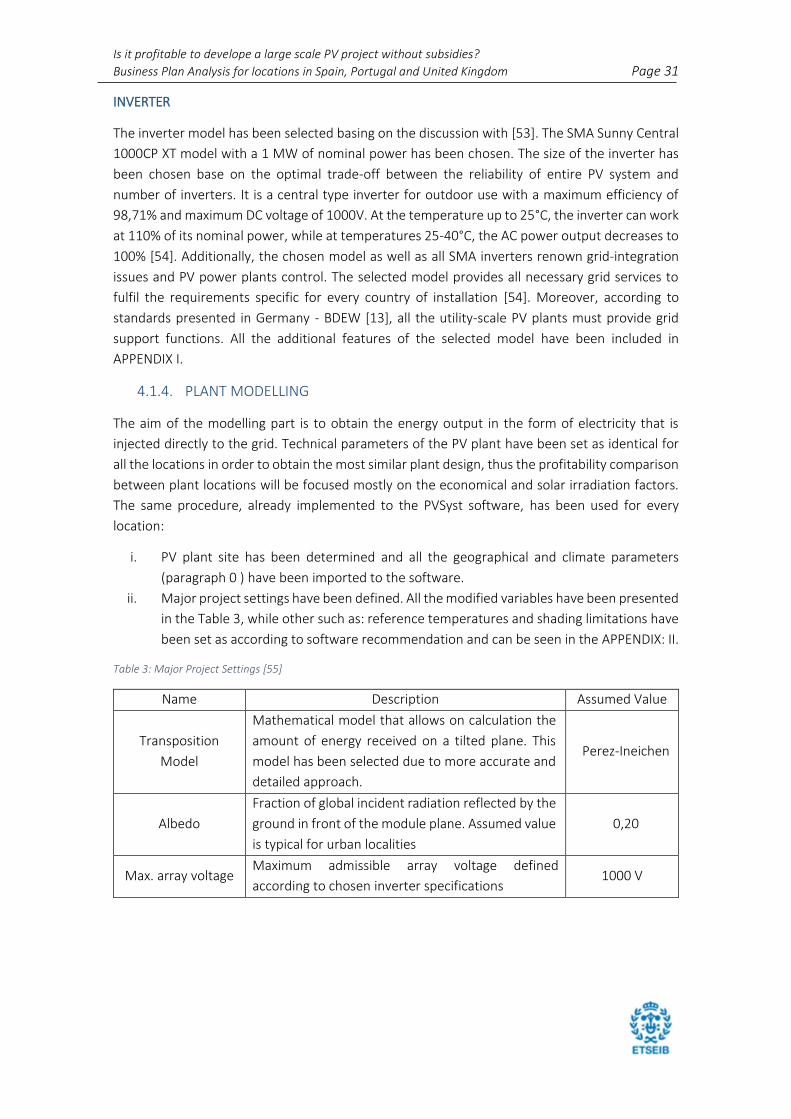
Table 3: Major Project Settings [55]
Name Description Assumed Value
Transposition
Model
Mathematical model that allows on calculation the
amount of energy received on a tilted plane. This
model has been selected due to more accurate and
detailed approach.
Perez-Ineichen
Albedo
Fraction of global incident radiation reflected by the
ground in front of the module plane. Assumed value
is typical for urban localities
0,20
Max. array voltage Maximum admissible array voltage defined
according to chosen inverter specifications 1000 V

Is it profitable to develope a large scale PV project without subsidies?
Business Plan Analysis for locations in Spain, Portugal and United Kingdom Page 32
iii. Due to easier maintenance and less space demand orientation of the PV panels has been
set due south with one-axis horizontal East-West tracking system. The range of tilt angle
is 10-80°. The geographical visualisation can be seen in the Figure 6.
Figure 6: Orientation of the PV modules
iv. The plant size has been defined as 50 MWp. Additionally, described in paragraph 4.1.3
models of PV modules and inverters have been selected. All the working parameters of
the selected devices have been imported automatically from the software database.
v. Major project losses have been determined. Assumed values together with the
description has been based on information presented in [55] and [1], are given in
Table 4:
Table 4: Losses Description
Type of Losses Description Assumed Value
Irradiance level
Conversion efficiency of a PV module decreases at low
light intensities that influences the module energy
output at STC. Calculated specifically for the chosen
collector model and climate data. Expressed as the ratio
to the STC power [56].
< 1,9%
Thermal
Decrement of the PV module efficiency due to increased
ambient temperatures (above STC). It is determined by
the thermal loss factor, that describes heat transfer
processes around the modules considering the type of
installation (free-standing, facades, roofing etc.)
U=29 W/m2K
Ohmic
Caused by ohmic resistance of the wiring circuit
between the power from PV module and the power at
the end of the array. Optimised as the percentage ratio
with respect to STC power.
< 1,5%
Module Quality
Represent the real module performance with respect to
the PV module manufacturer specifications. Defined as
the ratio to the STC power.
1,5%
LID
Light induced degradation losses that arise during the
first hours of exposition to the sun by respect to the flash
tests of STC. They are related to the quality of the wafer
manufacturing process. Similarly to the previous ones,
expressed as the ratio to the STC power.
1%
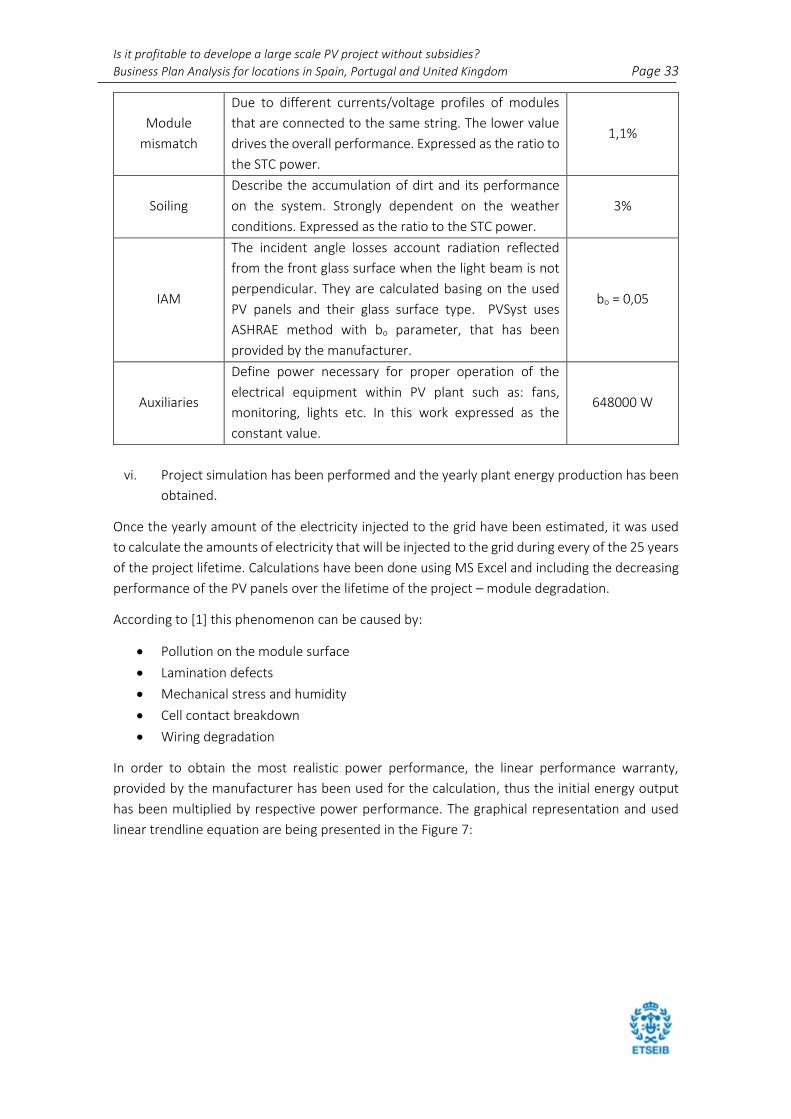
Is it profitable to develope a large scale PV project without subsidies?
Business Plan Analysis for locations in Spain, Portugal and United Kingdom Page 33
Module
mismatch
Due to different currents/voltage profiles of modules
that are connected to the same string. The lower value
drives the overall performance. Expressed as the ratio to
the STC power.
1,1%
Soiling
Describe the accumulation of dirt and its performance
on the system. Strongly dependent on the weather
conditions. Expressed as the ratio to the STC power.
3%
IAM
The incident angle losses account radiation reflected
from the front glass surface when the light beam is not
perpendicular. They are calculated basing on the used
PV panels and their glass surface type. PVSyst uses
ASHRAE method with bo parameter, that has been
provided by the manufacturer.
bo = 0,05
Auxiliaries
Define power necessary for proper operation of the
electrical equipment within PV plant such as: fans,
monitoring, lights etc. In this work expressed as the
constant value.
648000 W
vi. Project simulation has been performed and the yearly plant energy production has been
obtained.
Once the yearly amount of the electricity injected to the grid have been estimated, it was used
to calculate the amounts of electricity that will be injected to the grid during every of the 25 years
of the project lifetime. Calculations have been done using MS Excel and including the decreasing
performance of the PV panels over the lifetime of the project – module degradation.
According to [1] this phenomenon can be caused by:
• Pollution on the module surface
• Lamination defects
• Mechanical stress and humidity
• Cell contact breakdown
• Wiring degradation
In order to obtain the most realistic power performance, the linear performance warranty,
provided by the manufacturer has been used for the calculation, thus the initial energy output
has been multiplied by respective power performance. The graphical representation and used
linear trendline equation are being presented in the Figure 7:
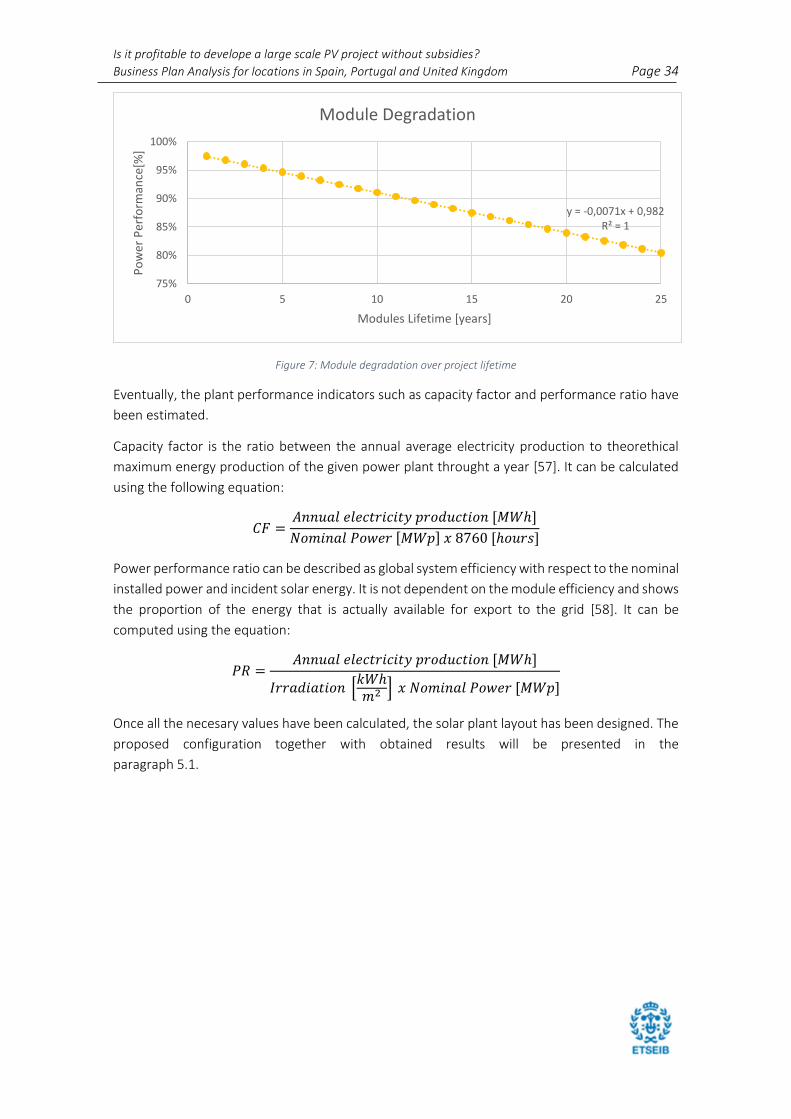
Is it profitable to develope a large scale PV project without subsidies?
Business Plan Analysis for locations in Spain, Portugal and United Kingdom Page 34
Figure 7: Module degradation over project lifetime
Eventually, the plant performance indicators such as capacity factor and performance ratio have
been estimated.
Capacity factor is the ratio between the annual average electricity production to theorethical
maximum energy production of the given power plant throught a year [57]. It can be calculated
using the following equation:
𝐶𝐹 =𝐴𝑛𝑛𝑢𝑎𝑙 𝑒𝑙𝑒𝑐𝑡𝑟𝑖𝑐𝑖𝑡𝑦 𝑝𝑟𝑜𝑑𝑢𝑐𝑡𝑖𝑜𝑛 [𝑀𝑊ℎ]
𝑁𝑜𝑚𝑖𝑛𝑎𝑙 𝑃𝑜𝑤𝑒𝑟 [𝑀𝑊𝑝] 𝑥 8760 [ℎ𝑜𝑢𝑟𝑠]
Power performance ratio can be described as global system efficiency with respect to the nominal
installed power and incident solar energy. It is not dependent on the module efficiency and shows
the proportion of the energy that is actually available for export to the grid [58]. It can be
computed using the equation:
𝑃𝑅 =𝐴𝑛𝑛𝑢𝑎𝑙 𝑒𝑙𝑒𝑐𝑡𝑟𝑖𝑐𝑖𝑡𝑦 𝑝𝑟𝑜𝑑𝑢𝑐𝑡𝑖𝑜𝑛 [𝑀𝑊ℎ]
𝐼𝑟𝑟𝑎𝑑𝑖𝑎𝑡𝑖𝑜𝑛 [𝑘𝑊ℎ𝑚2 ] 𝑥 𝑁𝑜𝑚𝑖𝑛𝑎𝑙 𝑃𝑜𝑤𝑒𝑟 [𝑀𝑊𝑝]
Once all the necesary values have been calculated, the solar plant layout has been designed. The
proposed configuration together with obtained results will be presented in the
paragraph 5.1.
y = -0,0071x + 0,982R² = 1
75%
80%
85%
90%
95%
100%
0 5 10 15 20 25
Po
wer
Per
form
ance
[%]
Modules Lifetime [years]
Module Degradation

Is it profitable to develope a large scale PV project without subsidies?
Business Plan Analysis for locations in Spain, Portugal and United Kingdom Page 35
4.2. ECONOMIC ANALYSIS
Profitability of the system will be estimated using the post-tax internal rate of return, that will be
compared with set discount rates. In order to obtain IRR, the financial analysis focusing on
discounted cash-flows to firm and equity will be performed. Additionally, the net present value
and payback time of the project will be calculated. Eventually, the dependence of the estimated
IRR, NPV and payback time on external factors will be check by the sensitivity analysis.
4.2.1. FINANCIAL TOOLS
The major aim of this part of the document is to familiarize readers with the financial tools and
indicators that will be used in the following analysis. Similar to the [41], [42], [46] and [47] the
discounted cashflow analysis has been performed in order to determine the profitability of the
project. The profitability of the project will be confirmed if the calculated post-tax IRR will be
higher than the used discount rate. Regarding this work, two discounted cashflows have been
used: FCFF with the WACC discount rate and FCFE with cost of equity as discount rate.
Free cash flow for the firm
Free cash flow is one of the most important financial indicator of project value. It presents the
amount of cash flow from operations available for distribution considering depreciation
expenses, taxes, working capital, and investments. FCFF is essentially a measurement of a project
profitability after all expenses and reinvestments, it is a good representation of a project
operations and its performance [59].
A positive FCFF value indicates that the firm has cash remaining after expenses. A negative value
indicates that the firm has not generated enough revenue to cover its costs and investment
activities.
In this work, the FCFF has been calculating using the following formula:
𝐹𝐶𝐹𝐹 = 𝐸𝐵𝐼𝑇𝐷𝐴 ∙ (1 − 𝑇𝐶 ) + (𝐷𝑒𝑝. ∙ 𝑇𝐶 ) − 𝐿𝑜𝑛𝑔 𝑖𝑛𝑣. −𝑊𝐶
Where: EBITDA – earnings before interest, tax and depreciation, TC – corporate tax rate,
Dep. – depreciation, Long inv. – long term investments (devices), WC – investment in working
capital
Free cash flow to equity
FCFE is often used by analysts in an attempt to determine the value of a project. It is a measure
of how much cash is available to the equity shareholders of a project after all expenses,
reinvestment, and debt are paid. FCFE is a measure of equity capital usage. Can be used to
determine the project return that is going directly to the owners. Additionally, it checks the
project ability to pay dividends [60].
Is it profitable to develope a large scale PV project without subsidies?
Business Plan Analysis for locations in Spain, Portugal and United Kingdom Page 36
In this work, the FCFE has been calculating using the following formula:
𝐹𝐶𝐹𝐸 = 𝐹𝐶𝐹𝐹 − 𝑇𝑜𝑡. 𝐹. 𝐶𝑜𝑠𝑡 ∙ (1 − 𝑇𝐶) + 𝑁𝑒𝑡 𝐵𝑜𝑟𝑟𝑜𝑤𝑖𝑛𝑔
Where: FCFF – free cashflow for the firm, Tot. F. Cost – total financing costs (Interests, Cost of
raising Capital and Cost of issuing debt), TC – corporate tax rate, Net Borrowing – used to express
difference between New Debt and Debt Re-payment
Weighted average cost of capital
It is a way to calculate project cost of capital in which each category of capital is proportionately
weighted. In a broad sense, project can be financed either through debt or with equity. WACC is
the average of the costs of these types of financing, each of which is weighted by its proportionate
use in a given situation. Project WACC increases as the rate of return on equity increase, because
an increase in WACC denotes a decrease in valuation and an increase in risk. WACC is the overall
required return from a project, thus it is the discount rate that should be used to actualize cash
flows with risk that is similar to that of the project [61].
To calculate WACC, multiply the cost of each capital component by its proportional weight and
take the sum of the results. It can be done using the following equation:
𝑊𝐴𝐶𝐶 = 𝐸
𝑉 ∙ 𝐶𝐸 +
𝐷
𝑉 ∙ 𝐶𝐷 ∙ (1 − 𝑇𝐶)
Where:
CE = cost of equity – rate that express the expected investor’s return from the project. It has been
used as a discount rate for FCFE.
CD = cost of debt – credit interest rate used to calculate credit rates throughout the total credit
period.
E = value of used equity in the project, D = value of used debt in the project, V = E + D = total value
of project financing, E/V = percentage of financing that is equity, D/V = percentage of financing
that is debt, TC = corporate tax rate.
Based on the cashflow results the following financial indicators have been used in order to attest
the profitability of the analysed project:
Net Present Value
Net present value is the difference between the present value of cash inflows and the present
value of cash outflows over a period of time. NPV is used in capital budgeting to analyse the
profitability of a projected investment or project.
A positive net present value indicates that the projected earnings generated by a project or
investment (in present money) exceeds the anticipated costs (also in present money). Generally,
an investment with a positive NPV will be profitable, and an investment with a negative NPV will
result in a net loss. This concept is the basis for the Net Present Value Rule, which dictates that
Is it profitable to develope a large scale PV project without subsidies?
Business Plan Analysis for locations in Spain, Portugal and United Kingdom Page 37
the only investments that should be made are those with positive NPV values [62]. The NPV is
calculated using the following equation:
NPV = ∑𝐶𝑡
(1 + 𝑟)𝑡
𝑇
𝑡=1
−𝐶0
With: 𝐶𝑡 the net cash inflow during period t, 𝐶0 the total initial investment cost, 𝑟 the discount
rate, and 𝑡 the number of time periods.
Internal Rate of Return
Internal rate of return is a metric used in capital budgeting to estimate the profitability of
potential investments. Internal rate of return is a discount rate that makes the net present value
of all cash flows from a particular project equal to zero. IRR calculations rely on the same formula
as NPV.
To calculate IRR using the formula, one would set NPV equal to zero and solve for the discount
rate (r), which is the IRR. Because of the nature of the formula, however, IRR cannot be calculated
analytically and must instead be calculated either through trial-and-error or using software
programmed to calculate IRR [63].
Payback Time
The payback period is the length of time required to recover the cost of an investment. The
payback period of a given project is an important determinant of whether to undertake the
action. Longer payback periods are typically not desirable for investment action due to higher
possibility of risk occurring. The payback period ignores the time value of money, unlike other
methods of capital budgeting such as net present value or internal rate of return cash flow [64].
4.2.2. MAJOR ASSUMPTIONS
Every large-scale PV project is a unique enterprise that depends on many internal and external
factors, thus assumptions have to be taken in order to properly introduce the ongoing situation
as well as provide all the details that will be used during the modelisation process. The aim of this
part of the document is to introduce readers to the main assumptions that are equal for every of
the examined location.
General information
As it was mentioned in the sub-chapter 1.4 the large-scale 50 MWP PV plant with one-axis
horizontal East-West tracking system has been selected due to possibility of comparison with the
existing real-life PV project. Regarding the project lifetime similarly to the assumptions made in
works [1] and [2] it has been set as 25 years. It can be additionally supported by the 25 years
power guarantee for the chosen PV panels model, that is ensured by the manufacturer. The
power plant is owned by the independent power producer, while all the O&M activities will be
outsourced to a third-party company. Additionally, the dividends will be paid to the investors
basing on the net profit financial status of the project. Initially, all the profit will be collected until
the value of 3 million euros in order to finance the further investments (inverter or spare parts).
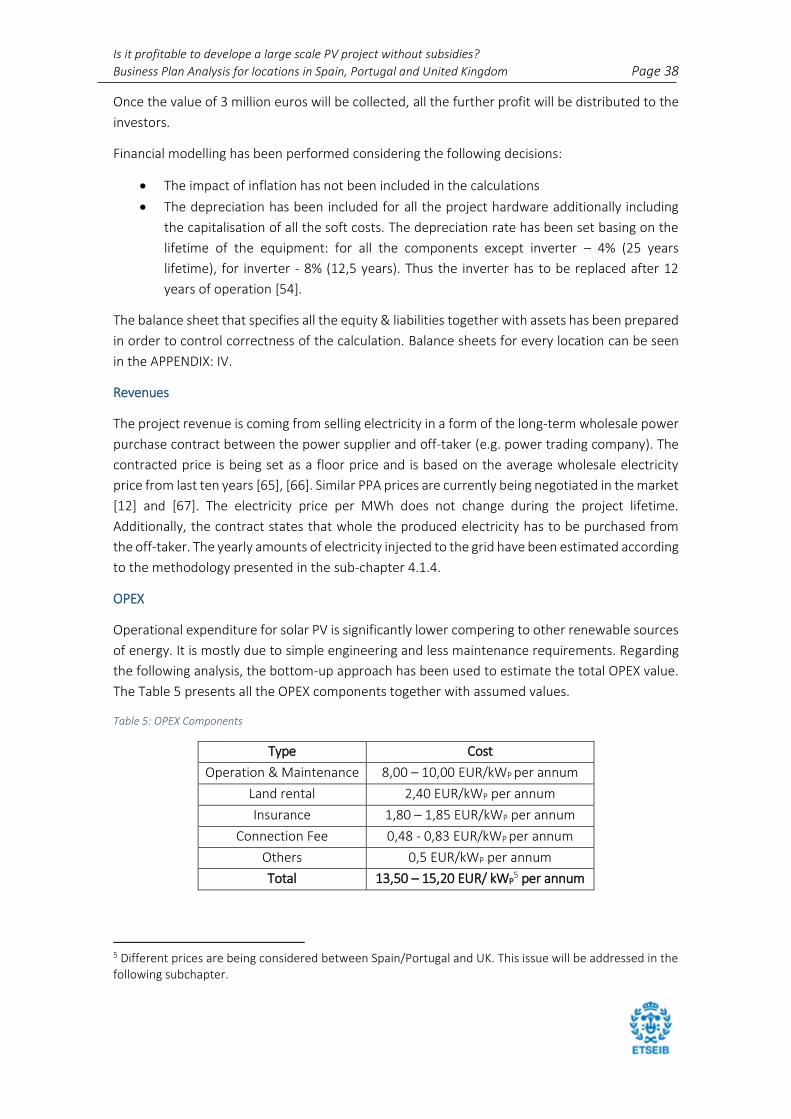
Is it profitable to develope a large scale PV project without subsidies?
Business Plan Analysis for locations in Spain, Portugal and United Kingdom Page 38
Once the value of 3 million euros will be collected, all the further profit will be distributed to the
investors.
Financial modelling has been performed considering the following decisions:
• The impact of inflation has not been included in the calculations
• The depreciation has been included for all the project hardware additionally including
the capitalisation of all the soft costs. The depreciation rate has been set basing on the
lifetime of the equipment: for all the components except inverter – 4% (25 years
lifetime), for inverter - 8% (12,5 years). Thus the inverter has to be replaced after 12
years of operation [54].
The balance sheet that specifies all the equity & liabilities together with assets has been prepared
in order to control correctness of the calculation. Balance sheets for every location can be seen
in the APPENDIX: IV.
Revenues
The project revenue is coming from selling electricity in a form of the long-term wholesale power
purchase contract between the power supplier and off-taker (e.g. power trading company). The
contracted price is being set as a floor price and is based on the average wholesale electricity
price from last ten years [65], [66]. Similar PPA prices are currently being negotiated in the market
[12] and [67]. The electricity price per MWh does not change during the project lifetime.
Additionally, the contract states that whole the produced electricity has to be purchased from
the off-taker. The yearly amounts of electricity injected to the grid have been estimated according
to the methodology presented in the sub-chapter 4.1.4.
OPEX
Operational expenditure for solar PV is significantly lower compering to other renewable sources
of energy. It is mostly due to simple engineering and less maintenance requirements. Regarding
the following analysis, the bottom-up approach has been used to estimate the total OPEX value.
The Table 5 presents all the OPEX components together with assumed values.
Table 5: OPEX Components
Type Cost
Operation & Maintenance 8,00 – 10,00 EUR/kWP per annum
Land rental 2,40 EUR/kWP per annum
Insurance 1,80 – 1,85 EUR/kWP per annum
Connection Fee 0,48 - 0,83 EUR/kWP per annum
Others 0,5 EUR/kWP per annum
Total 13,50 – 15,20 EUR/ kWP5 per annum
5 Different prices are being considered between Spain/Portugal and UK. This issue will be addressed in the following subchapter.

Is it profitable to develope a large scale PV project without subsidies?
Business Plan Analysis for locations in Spain, Portugal and United Kingdom Page 39
The value for O&M and others (internet connection, administration, etc.) has been assumed
based on the recent information presented in [12]. Additionally, it is consistent with the values
presented in [1].
Considering the land issue, it has been assumed that the land will be rented, and the charge will
be paid every year. Land rental cost has been calculated using the price of 1200 EUR/ha [68]. The
needed area has been estimated considering that for 1 MWP of installed power 2ha are
necessary [1].
Insurance cost has been estimated as 0,3% of CAPEX paid every year. The rate value has been
provided by [68] and additionally confirmed by [1].
As for the grid connection costs, this include the charge for using the grid as well as the
expenditures necessary to maintain the electric substation that is responsible for the analysed
plant. The value of 0,5 EUR/MWh of produced electricity has been assumed using information
from [45].
CAPEX
Each project has different capital expenditure. It is due to the strong CAPEX dependence on the
selected site for the project, commissioning costs or moment of construction start. The final cost
is known once the EPC contract is signed. The EPC contract defines the project investment costs
and contractor responsibilities basing on the whole construction process starting from the
designing phase until final commissioning. According to [1], the EPC contractors’ scope of work
includes: management and supervision, labour, plant equipment, works and materials necessary
to complete the project. To the lastly mentioned can be listed: PV modules, inverters, mounting
structure, DC/AC cabling, transformers, grid connection facilities, security and monitoring, plant
commissioning and many others.
Considering this analysis, the CAPEX value after signing the EPC has been estimated as
600 EUR/kWP of installed power. The chosen value has been assumed based on the information
presented during the conferences [7] and [67]. The low CAPEX can be explained by constant
decrease of module prices as well as huge competition between project developers in order to
obtain permission to install the PV plant. Additionally, in the [47], the value of 700 EUR/kW for 5
MW PV plant has been used, thus considering the economies of scale phenomenon it can be said
that the value of 600 EUR/kWP is assumed correctly.
The Figure 8 presents distinguished CAPEX components that have been developed for the
purpose of the analysis.

Is it profitable to develope a large scale PV project without subsidies?
Business Plan Analysis for locations in Spain, Portugal and United Kingdom Page 40
Figure 8: CAPEX division
Presented division has been applied using the top-down approach and basing on the information
presented in [38] and [37]. The electrical balance of the system refers to all electrical equipment
necessary to connect the plant to the grid. It is assumed, that the substation and transmission
lines are already installed. The structural balance of the system is mostly composed of the
mounting structure for the collectors. Additionally, the land rental and the insurance costs have
also been added to the up-front costs as well as the wages for installation of the power plant. On
the graph they are presented as the soft costs.
Financing Schemes
According to the information in [16], there are many financing schemes that can be used for the
large-scale PV projects. As it was mentioned in the sub-chapter 1.4, this analysis considers the
combination of debt (bank loan) and equity. The ratio debt-to-equity has been set as: 60:40 of
the total investment cost. Basing on the information presented in [16] and [67] it is a widely used
share considering the solar photovoltaic projects.
The bank loan has been taken for a period of 20 years. The distribution of principal rates and
interests has been calculated using the French method. The already made Excel tool has been
used for this purpose. Additionally, cost of issuing debt has also been included with a 2% rate of
the overall debt value [69]. The interest rate is equal to the cost of debt.
The cost of debt has been assumed using the Excel tool provided by [70]. The values have been
calculated particularly for the European renewable energy sector and considering every of the
examined location. Differences between countries has been expressed by the economic ratings
of the chosen locations taken from [71]. Corporate tax rate has also been included in the
calculation.
The equity value has been estimated as a difference between the total investments’ costs and
the bank loan. The values have been chosen considering the mentioned debt-to-equity ratio.
Additionally, the cost of raising capital has been included with a 2% rate of the overall equity
value [69].
42%
9%13%
19%
1%16%
CAPEX Components
PV Modules
Inverters
Electrical BOS
Structural BOS
Monitoring &Security

Is it profitable to develope a large scale PV project without subsidies?
Business Plan Analysis for locations in Spain, Portugal and United Kingdom Page 41
Cost of equity is more difficult to estimate because it depends mostly on the investors approach
and attitude towards certain project. Thus, for this analysis, the interview with the PV field
specialist has been performed in order to obtain the cost of equity rates for every location [67]
and [12]. Additionally, the cost of equity has been used as a discount rate for the FCFE to calculate
the NPV value of the project.
Eventually, the value of the WACC has been calculated for every location using the equation that
has been introduced in the chapter 4.2.1. The obtain value has been used as a discount rate for
the FCFF to estimate the NPV of the project.
Taxes
Due to lack of data only two type of taxes have been included in the analysis. The corporate tax,
that is calculated for every year basing on the EBT value and the given tax rate [72] for every
location. The calculation additionally includes the tax credit which has been accumulated during
the previous period when the EBT value was negative.
Second tax considered in this work is the tax on the energy injected to the grid. The cost is
estimated by multiplying the given tax rate by the amount of electricity injected to the grid.
Different tax rates for every location will be presented in the chapter 4.2.3.
4.2.3. CASE STUDIES
Three different countries are being analysed to properly assess the research question. This part
of the document provides all the assumptions, that have been already described in the
sub-chapter 4.2.2, for every location. They have been summarized in Table 6. As it can be noticed,
there are several major differences.
Table 6: Detailed case studies assumptions – base case scenario
Parameters Spain Portugal UK
Capital Expenditures [EUR/kWP] 600,00 600,00 615,00
Operational Costs [EUR/kWP] 13,53 13,50 15,22
Price of PPA [EUR/MWh] 45,35 45,46 53,90
Cost of Equity [%] 8,00% 8,00% 7,00%
Cost of Debt [%] 5,56% 6,17% 4,12%
Equity to Debt Ration [%] 40,00% 40,00% 40,00%
WACC [%] 5,72% 6,14% 4,80%
Corporate Tax [%] 25% 21% 19%
Tax on the energy to the grid [%] 7% 0% 0%
The higher CAPEX value in UK might come from the higher module trnasportation costs as it was
already mentioned in the chapter 2.3.1. Regarding the higher OPEX, it can be explained by higher
labour costs.
As it was mention previously, the PPA price has been estimated on the yearly average wholesale
price (see APPENDIX: III). The price in Spain and Portugal is almost the same due to the significant
Is it profitable to develope a large scale PV project without subsidies?
Business Plan Analysis for locations in Spain, Portugal and United Kingdom Page 42
integration of the Iberian electricity market – OMIE. The higher average electricity prices in UK
can be explained by lower interconnection with the European continetnt that influences the
possibilities of cross-border trading and long-term supply contracts [73].
Regarding the financing schemes, the obtained WACC values are similar to the ones assumed in
[46], [47] and [48] as well as follow current market trends [12]. The lower WACC in UK can be a
result of a stronger, more secure economy. Similarly as for the equity rate, the lower rate for UK
can represents investors attitude towards PV projects.
Eventually, the 7% tax rate in Spain is a consequence of the previous policy towards renewable
sources of energy, described in [42] and [45]. Basing on the interviews [67] and [74], similar taxes
does not appear in United Kingdom and Portugal.
4.2.4. FINANCIAL MODELLING
This subchapter will focus on description of the financial modelisation that has been applied to
this work. The modelisation has been done using MS Excel and following the International
Financial Reporting Standards. The same modelling procedure has been used for every location:
i. Major project assumptions as well as found differences between locations (already
described in paragraph 4.2.2 and paragraph 4.2.3) have been defined.
ii. Profit and loss of the project that include total yearly revenues and yearly operational
costs have been calculated. Additionally, the cashflow of investment has been obtained.
iii. Basing on the obtained information and provided assumption, the indicators of project
financial performance such as: EBITDA, EBIT, EBT Net Profit6 and Retained Earingns7 have
been estimated.
iv. Balance sheet that specifies all the equity & liabilities together with assets has been
prepared. Fragment of the balance sheet for first years of project operation can be seen
in the APPENDIX: IV.
v. The final Free Cash Flow to the Firm has been calculated using equation presented in
paragraph 4.2.1.
vi. Basing on the FCFF the final value of FCFE using the equation presented in the
paragraph 4.2.1.
vii. Final values of post-tax IRR and NPV has been obtained using information from both FCFF
and FCFE. The NPV indicators have been calculated using the in-built MS Excel function
and considering the WACC as discount rate for FCFF and CE as discount rate for FCFE.
Similarly for the IRR indicator, the in-built MS Excel function has been used.
viii. Payback time has been estimated using the cumulative values of FCFF and FCFE
6 Net Profit – sales income less the total cost of sold goods [76] 7 Retained earnings - cumulative net earnings or profit of a firm after accounting for dividends [77]
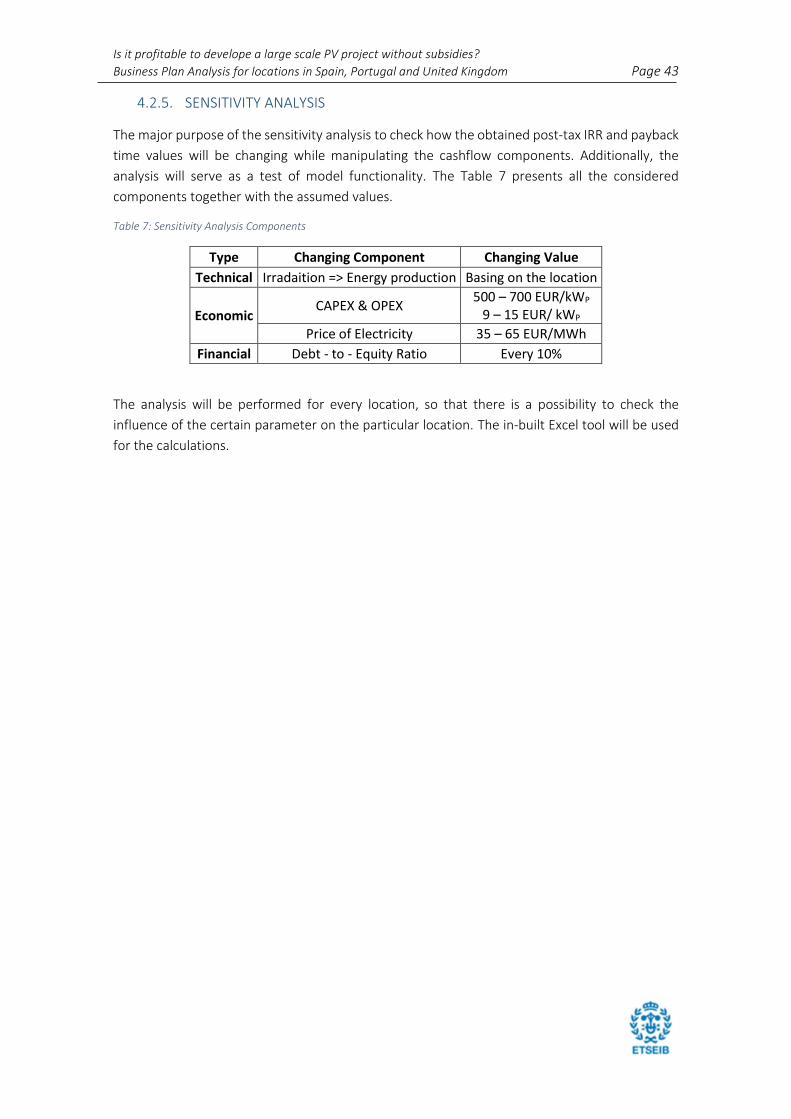
Is it profitable to develope a large scale PV project without subsidies?
Business Plan Analysis for locations in Spain, Portugal and United Kingdom Page 43
4.2.5. SENSITIVITY ANALYSIS
The major purpose of the sensitivity analysis to check how the obtained post-tax IRR and payback
time values will be changing while manipulating the cashflow components. Additionally, the
analysis will serve as a test of model functionality. The Table 7 presents all the considered
components together with the assumed values.
Table 7: Sensitivity Analysis Components
Type Changing Component Changing Value
Technical Irradaition => Energy production Basing on the location
Economic CAPEX & OPEX
500 – 700 EUR/kWP
9 – 15 EUR/ kWP
Price of Electricity 35 – 65 EUR/MWh
Financial Debt - to - Equity Ratio Every 10%
The analysis will be performed for every location, so that there is a possibility to check the
influence of the certain parameter on the particular location. The in-built Excel tool will be used
for the calculations.

Is it profitable to develope a large scale PV project without subsidies?
Business Plan Analysis for locations in Spain, Portugal and United Kingdom Page 44
5. RESULTS
This chapter will describe all the obtain results during the simulation process. Firstly, the technical
viability of the project will be presented together with the proposed plant structure. Economic
evaluation of the project will be presented afterwards together with the discussion of the results.
5.1. TECHNICAL RESULTS
Following the general structure of this document, firstly all the calculated technical parameters
will be presented.
The graphical representation of the energy transformation process has been generated for the
first year of plant operation. The diagram includes all the losses described in the Table 4 as well
as provides detailed information about amount of energy throughout the whole process. All the
information can be seen on the Figure 9. Regarding Spain and Portugal, the losses with the highest
share are related to the temperature. As for UK, the soiling losses represents the highest value.
Since in all the location the same plant design and the same components have been used, the
differences in produced electricity are mostly related to the irradiation levels.
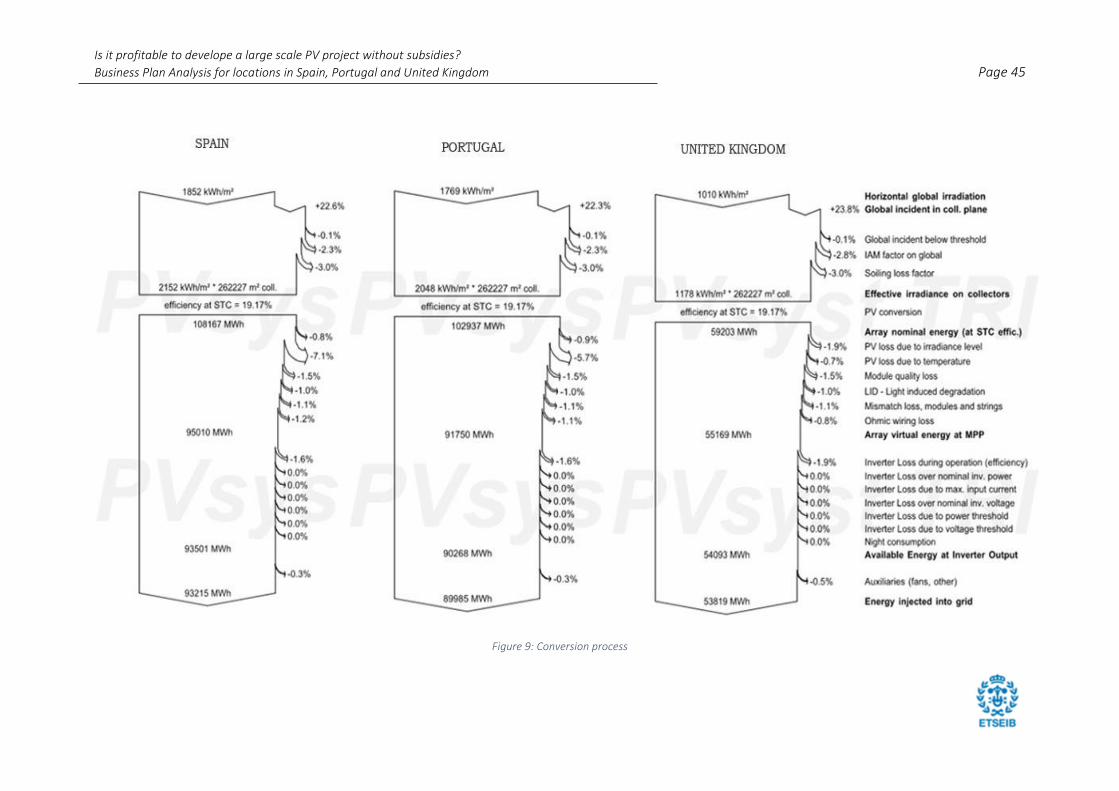
Is it profitable to develope a large scale PV project without subsidies?
Business Plan Analysis for locations in Spain, Portugal and United Kingdom Page 45
Figure 9: Conversion process

Is it profitable to develope a large scale PV project without subsidies?
Business Plan Analysis for locations in Spain, Portugal and United Kingdom Page 46
Presented values describe the energy transformation process during only the first year of
operation, thus using the final values of energy injected to the grid, the further results have
been obtained. Table 8 contains yearly values of electricity injected to the grid as well as capacity
factor and performance ratio of the modelled solar PV plant. Additionally, the average values
for the project lifetime have been calculated.
Table 8: Results of the simulation: Generated Electricity and Plant Performance Indicators
Year Alcala de Guadaira (Spain) Evora (Portugal) Milton Keynes (UK)
Electricity [MWh] Cf PR Electricity [MWh] CF PR Electricity [MWh] CF PR
1 93215,00 21% 82% 89985,00 21% 83% 53819,00 12% 86%
2 90213,48 21% 79% 87087,48 20% 81% 52086,03 12% 83%
3 89551,65 20% 79% 86448,59 20% 80% 51703,91 12% 83%
4 88889,82 20% 78% 85809,70 20% 79% 51321,80 12% 82%
5 88228,00 20% 78% 85170,80 19% 79% 50939,68 12% 81%
6 87566,17 20% 77% 84531,91 19% 78% 50557,57 12% 81%
7 86904,34 20% 77% 83893,02 19% 78% 50175,45 11% 80%
8 86242,52 20% 76% 83254,12 19% 77% 49793,34 11% 80%
9 85580,69 20% 75% 82615,23 19% 76% 49411,22 11% 79%
10 84918,87 19% 75% 81976,34 19% 76% 49029,11 11% 78%
11 84257,04 19% 74% 81337,44 19% 75% 48646,99 11% 78%
12 83595,21 19% 74% 80698,55 18% 75% 48264,88 11% 77%
13 82933,39 19% 73% 80059,65 18% 74% 47882,76 11% 77%
14 82271,56 19% 72% 79420,76 18% 73% 47500,65 11% 76%
15 81609,73 19% 72% 78781,87 18% 73% 47118,53 11% 75%
16 80947,91 18% 71% 78142,97 18% 72% 46736,42 11% 75%
17 80286,08 18% 71% 77504,08 18% 72% 46354,30 11% 74%
18 79624,25 18% 70% 76865,19 18% 71% 45972,19 10% 74%
19 78962,43 18% 70% 76226,29 17% 70% 45590,07 10% 73%
20 78300,60 18% 69% 75587,40 17% 70% 45207,96 10% 72%
21 77638,77 18% 68% 74948,51 17% 69% 44825,85 10% 72%
22 76976,95 18% 68% 74309,61 17% 69% 44443,73 10% 71%
23 76315,12 17% 67% 73670,72 17% 68% 44061,62 10% 70%
24 75653,29 17% 67% 73031,83 17% 68% 43679,50 10% 70%
25 74991,47 17% 66% 72392,93 17% 67% 43297,39 10% 69%
∑ 2075674,33 19% 73% 2003749,99 18% 74% 1198419,96 11% 77%
According to the information presented in [1] the typical values of capacity factor are between
12-24%. Similar results have been obtained for the Cyprus island in [48], that has similar
irradiation values, thus it can be said that the power plant has been modelled correctly. Similarly
regarding the power ratio indicator; the yearly average values of high-performance PV power
plant are around 82%. The highest value can be observed in the UK installation, up to 86%. It is
due to low average, ambient temperatures and the lowest values of thermal losses. Energy
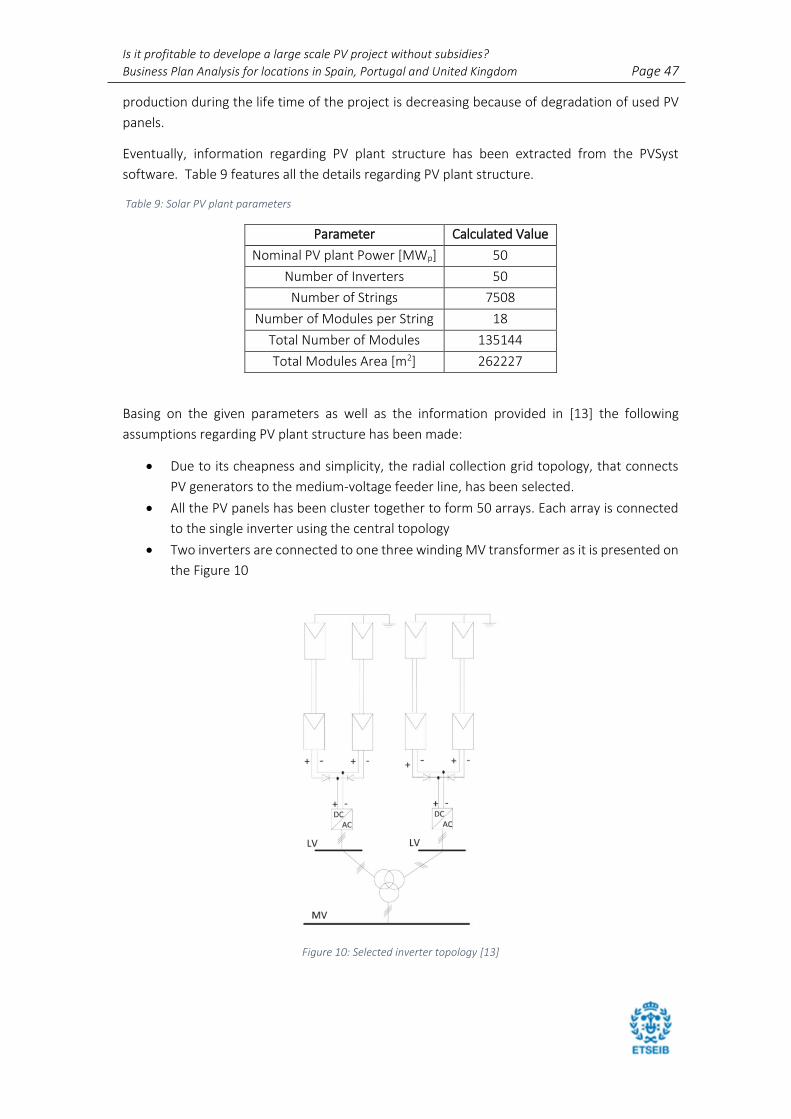
Is it profitable to develope a large scale PV project without subsidies?
Business Plan Analysis for locations in Spain, Portugal and United Kingdom Page 47
production during the life time of the project is decreasing because of degradation of used PV
panels.
Eventually, information regarding PV plant structure has been extracted from the PVSyst
software. Table 9 features all the details regarding PV plant structure.
Table 9: Solar PV plant parameters
Parameter Calculated Value
Nominal PV plant Power [MWp] 50
Number of Inverters 50
Number of Strings 7508
Number of Modules per String 18
Total Number of Modules 135144
Total Modules Area [m2] 262227
Basing on the given parameters as well as the information provided in [13] the following
assumptions regarding PV plant structure has been made:
• Due to its cheapness and simplicity, the radial collection grid topology, that connects
PV generators to the medium-voltage feeder line, has been selected.
• All the PV panels has been cluster together to form 50 arrays. Each array is connected
to the single inverter using the central topology
• Two inverters are connected to one three winding MV transformer as it is presented on
the Figure 10
Figure 10: Selected inverter topology [13]
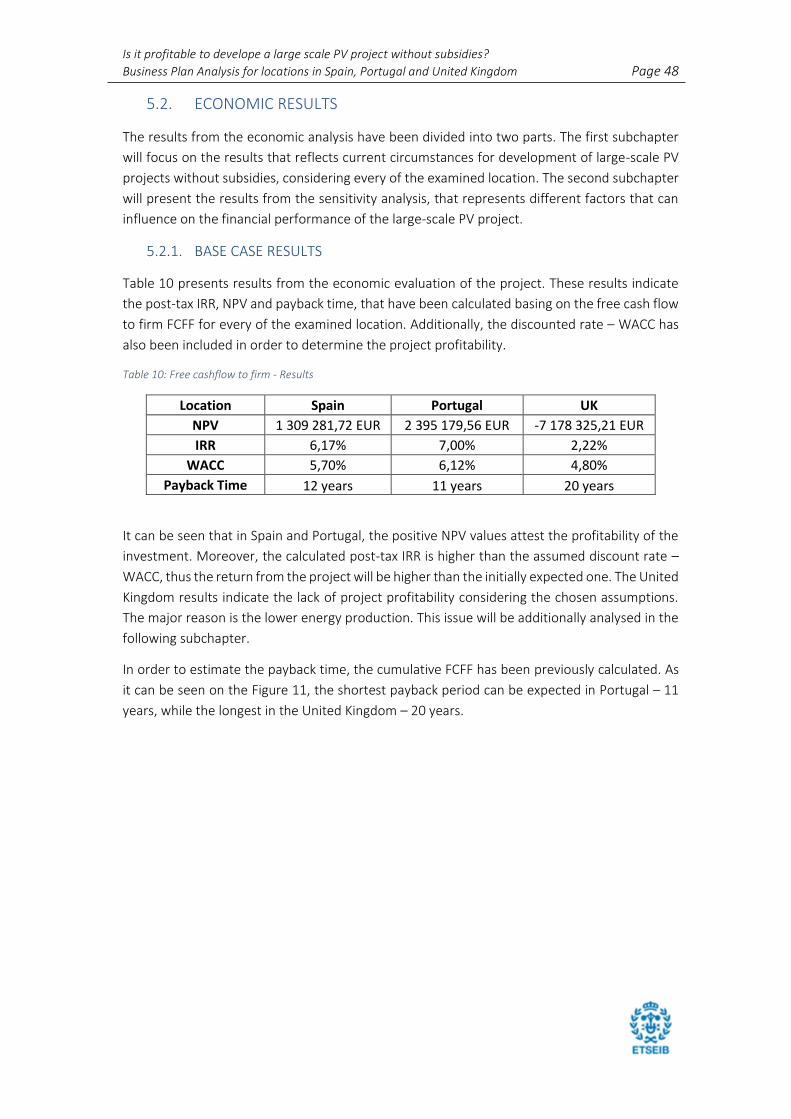
Is it profitable to develope a large scale PV project without subsidies?
Business Plan Analysis for locations in Spain, Portugal and United Kingdom Page 48
5.2. ECONOMIC RESULTS
The results from the economic analysis have been divided into two parts. The first subchapter
will focus on the results that reflects current circumstances for development of large-scale PV
projects without subsidies, considering every of the examined location. The second subchapter
will present the results from the sensitivity analysis, that represents different factors that can
influence on the financial performance of the large-scale PV project.
5.2.1. BASE CASE RESULTS
Table 10 presents results from the economic evaluation of the project. These results indicate
the post-tax IRR, NPV and payback time, that have been calculated basing on the free cash flow
to firm FCFF for every of the examined location. Additionally, the discounted rate – WACC has
also been included in order to determine the project profitability.
Table 10: Free cashflow to firm - Results
Location Spain Portugal UK
NPV 1 309 281,72 EUR 2 395 179,56 EUR -7 178 325,21 EUR
IRR 6,17% 7,00% 2,22%
WACC 5,70% 6,12% 4,80%
Payback Time 12 years 11 years 20 years
It can be seen that in Spain and Portugal, the positive NPV values attest the profitability of the
investment. Moreover, the calculated post-tax IRR is higher than the assumed discount rate –
WACC, thus the return from the project will be higher than the initially expected one. The United
Kingdom results indicate the lack of project profitability considering the chosen assumptions.
The major reason is the lower energy production. This issue will be additionally analysed in the
following subchapter.
In order to estimate the payback time, the cumulative FCFF has been previously calculated. As
it can be seen on the Figure 11, the shortest payback period can be expected in Portugal – 11
years, while the longest in the United Kingdom – 20 years.

Is it profitable to develope a large scale PV project without subsidies?
Business Plan Analysis for locations in Spain, Portugal and United Kingdom Page 49
Figure 11: Cumulative FCFF for all the examined locations
The bend on the graph after 2030th is caused by the inverter replacement as it has been
assumed in the chapter 4.2.2.
Among the analysed locations, the best financial performance occurs in the Portuguese case,
even though the amount of energy injected to the grid in Spain is higher and the total value of
all the financial costs is lower. It is due to the highest overall costs during the lifetime of the
project compared with other locations. The high costs can be explained by the 7% tax on the
electricity that is injected to the grid. Considering the whole lifetime of the project this value is
equal to more than 6,5 million euros. The breakdown of the combined costs has been presented
on the Figure 12.
-€ 36
-€ 32
-€ 28
-€ 24
-€ 20
-€ 16
-€ 12
-€ 8
-€ 4
€ -
€ 4
€ 8
€ 12
€ 16
€ 20
€ 24
€ 28
€ 32
€ 36
2018 2020 2022 2024 2026 2028 2030 2032 2034 2036 2038 2040 2042
Cu
mu
lati
ve F
CFF
Mill
ion
s
Project Lifetime
Cumulative FCFF over Project Lifetime
Spain
Portugal
UK
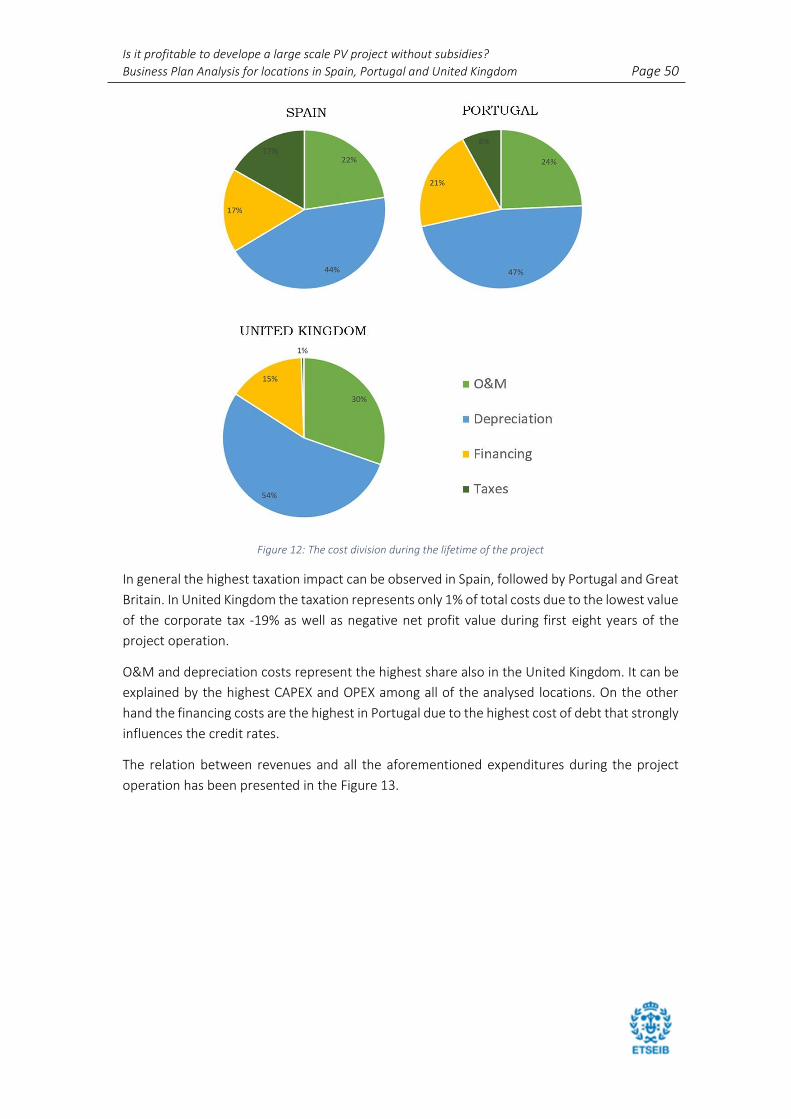
Is it profitable to develope a large scale PV project without subsidies?
Business Plan Analysis for locations in Spain, Portugal and United Kingdom Page 50
Figure 12: The cost division during the lifetime of the project
In general the highest taxation impact can be observed in Spain, followed by Portugal and Great
Britain. In United Kingdom the taxation represents only 1% of total costs due to the lowest value
of the corporate tax -19% as well as negative net profit value during first eight years of the
project operation.
O&M and depreciation costs represent the highest share also in the United Kingdom. It can be
explained by the highest CAPEX and OPEX among all of the analysed locations. On the other
hand the financing costs are the highest in Portugal due to the highest cost of debt that strongly
influences the credit rates.
The relation between revenues and all the aforementioned expenditures during the project
operation has been presented in the Figure 13.
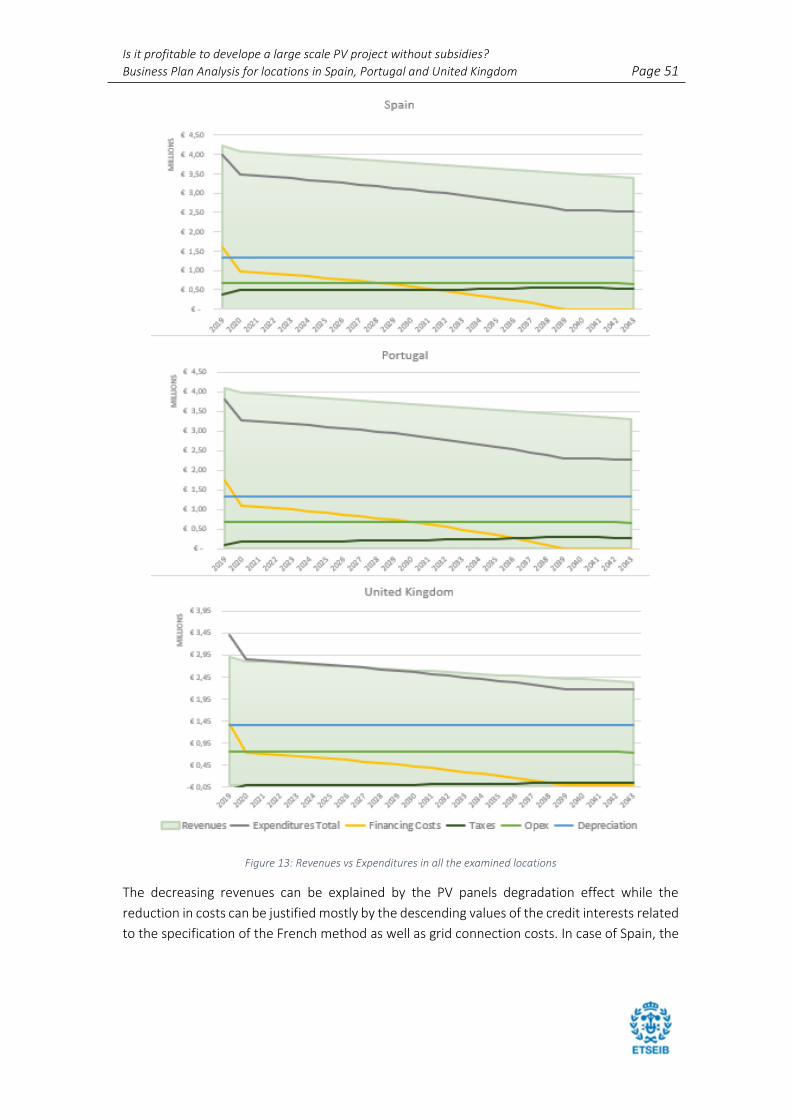
Is it profitable to develope a large scale PV project without subsidies?
Business Plan Analysis for locations in Spain, Portugal and United Kingdom Page 51
Figure 13: Revenues vs Expenditures in all the examined locations
The decreasing revenues can be explained by the PV panels degradation effect while the
reduction in costs can be justified mostly by the descending values of the credit interests related
to the specification of the French method as well as grid connection costs. In case of Spain, the
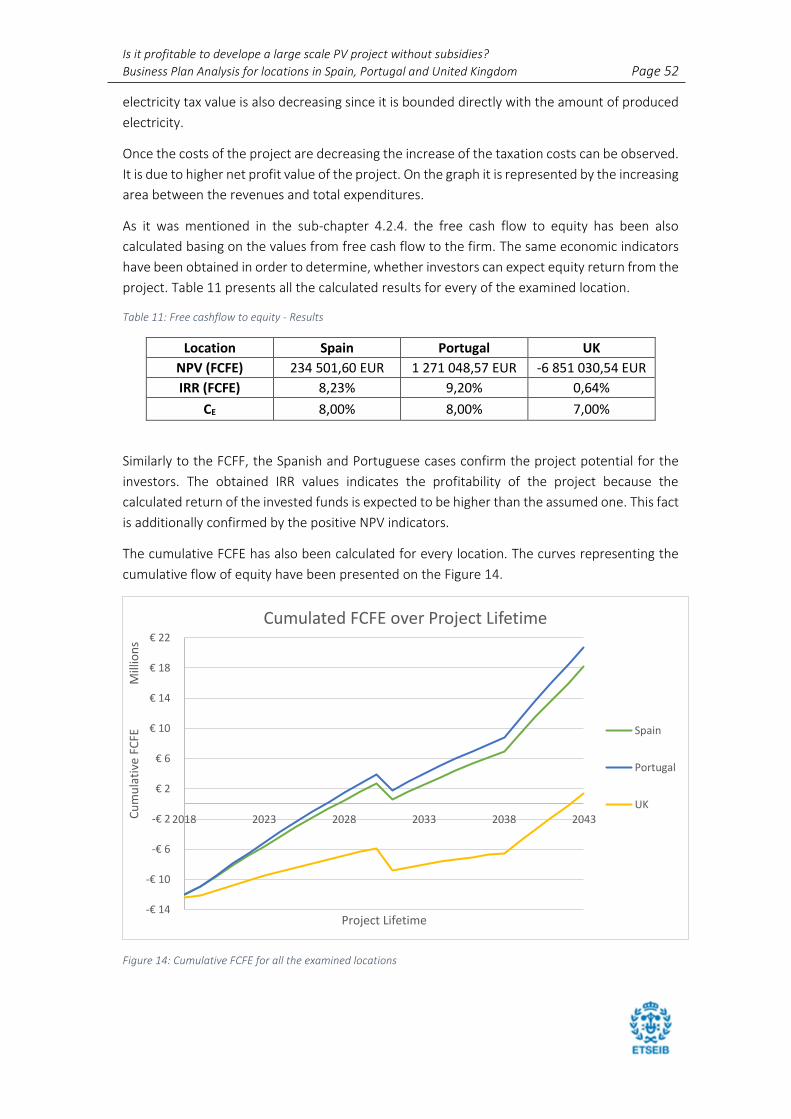
Is it profitable to develope a large scale PV project without subsidies?
Business Plan Analysis for locations in Spain, Portugal and United Kingdom Page 52
electricity tax value is also decreasing since it is bounded directly with the amount of produced
electricity.
Once the costs of the project are decreasing the increase of the taxation costs can be observed.
It is due to higher net profit value of the project. On the graph it is represented by the increasing
area between the revenues and total expenditures.
As it was mentioned in the sub-chapter 4.2.4. the free cash flow to equity has been also
calculated basing on the values from free cash flow to the firm. The same economic indicators
have been obtained in order to determine, whether investors can expect equity return from the
project. Table 11 presents all the calculated results for every of the examined location.
Table 11: Free cashflow to equity - Results
Location Spain Portugal UK
NPV (FCFE) 234 501,60 EUR 1 271 048,57 EUR -6 851 030,54 EUR
IRR (FCFE) 8,23% 9,20% 0,64%
CE 8,00% 8,00% 7,00%
Similarly to the FCFF, the Spanish and Portuguese cases confirm the project potential for the
investors. The obtained IRR values indicates the profitability of the project because the
calculated return of the invested funds is expected to be higher than the assumed one. This fact
is additionally confirmed by the positive NPV indicators.
The cumulative FCFE has also been calculated for every location. The curves representing the
cumulative flow of equity have been presented on the Figure 14.
Figure 14: Cumulative FCFE for all the examined locations
-€ 14
-€ 10
-€ 6
-€ 2
€ 2
€ 6
€ 10
€ 14
€ 18
€ 22
2018 2023 2028 2033 2038 2043Cu
mu
lati
ve F
CFE
Mill
ion
s
Project Lifetime
Cumulated FCFE over Project Lifetime
Spain
Portugal
UK

Is it profitable to develope a large scale PV project without subsidies?
Business Plan Analysis for locations in Spain, Portugal and United Kingdom Page 53
The same as in case of FCFF, the best financial performance can be noticed in Portugal, closely
followed by Spain and then UK. Since, the FCFE values has been calculated basing on the results
from FCFF (see sub-chapter 4.2.1) the difference between Spain and Portugal are mostly due to
higher overal costs. Low financial performance of UK is caused by lower energy production.
Smaller differences between locations are reasoned by different values of principal credit rates
and interest, that has beem calculated according to the given assumptions.
Unlike in FCFF graph, the FCFE focuses mostly on the equity performance, thus two major cruves
bends can be observed. While the first one, around 2030th , represents the inverter
repleacement, the second one in 2038th indicates the moment of the full bank loan repay
(20-years loan period) . After this year, very sharp equity increase can be noticed in all of the
examined locations.
The dividends payment possibility has been checked according to the dividend policy described
in the sub-chapter 4.2.2. In case of Spain and Portugal, the overall amount paid to the investors
will be equal respectedly: 15 178 685,19 EUR and 17 757 173,90 EUR. Regarding the United
Kingdom the combined project net profit is lower than the proposed amounts of dividends, thus
the investors will not receive the expect equity return.
5.2.2. SENSITIVITY RESULTS
Once the profitability of the examined PV project has been determined in all of the locations,
the closer look will be made to the particular cashflow components that might affect the results.
Different components that influence different fields of PV project development have been
analysed. The description of all the components has been introduced in the chapter 4.2.5.
Technical Influence
The solar irradiation parameter has been checked. It is a very important parameter that has a
huge impact on the PV project site selection. It directly influences the amount of produced
energy and eventually the project incomes. The presents the location comparison considering
the irradiation factor and its effects.
Table 12: Location comparison
Location GHI [kWh/m2] Energy to the grid [MWh] Incomes [EUR]
Alcala de Guadaira 1852 2075674,33 € 94 129 236,45
Evora 1769 2003749,99 € 91 097 988,43
Milton Keynes 1010 1198419,96 € 64 594 836,08
As it can be seen, the GHI is around 1,75 times higher in Spain and Portugal than in United
Kingdom. It has a direct impact on the energy production and most importantly from the
developer point of view, on the plant incomes. Despite the fact, that the estimated in the
contract electricity prices in United Kingdom is higher by 18%, the overall incomes considering
the 25-years project lifetime are lower by approximately 30% compering to Spain and Portugal.
Is it profitable to develope a large scale PV project without subsidies?
Business Plan Analysis for locations in Spain, Portugal and United Kingdom Page 54
Assuming the scenario, that the contracted price of electricity is equal in every of the analysed
locations, the differences between less sun-filled Milton Keynes versus Alcala de Guadaira and
Evora would be even higher. The overall incomes in Spain and Portugal would be higher by more
than 40%. The calculated numbers indicate strong influence of solar irradiation on the incomes
and profitability of the PV project. Thus, proper site selection and solar resources measurement
is essential to have a thriving solar PV project.
Economic Influence
The impact of changing economic parameters such as costs and contracted electricity price has
also been examined. Firstly, the CAPEX and OPEX influence on the post-tax IRR has been
checked. The calculation has been performed, according to the values given in the Table 7,
considering both free cashflow to firm and equity. The obtained results for FCFF and FCFE have
been presented in the Table 13. The green colour represents the best financial performance
while the red one the worst. The marked values represent the results obtained from the base
case scenario, already described in the sub-chapter 5.2.1, while the slightly different first OPEX
value is due to different OPEX cost for UK. It is because of lower grid connection fee, explained
in chapter 4.2.2

Is it profitable to develope a large scale PV project without subsidies?
Business Plan Analysis for locations in Spain, Portugal and United Kingdom Page 55
Table 13: CAPEX & OPEX Sensitivity Analysis – post tax IRR
CAPEX\OPEX FCFF Spain FCFE Spain
[EUR/kWp] 15,22 14,50 13,50 12,50 11,50 10,50 9,50 15,50 14,50 13,50 12,50 11,50 10,50 9,50
500,00 7,87% 8,02% 8,21% 8,41% 8,60% 8,80% 8,99% 14,86% 15,29% 15,90% 16,50% 17,10% 17,70% 18,29%
525,00 7,31% 7,45% 7,64% 7,83% 8,02% 8,21% 8,40% 12,26% 12,64% 13,16% 13,68% 14,20% 14,72% 15,23%
550,00 6,80% 6,93% 7,12% 7,30% 7,49% 7,67% 7,85% 10,32% 10,66% 11,12% 11,58% 12,04% 12,50% 12,95%
575,00 6,32% 6,45% 6,63% 6,81% 6,99% 7,16% 7,34% 8,80% 9,10% 9,52% 9,94% 10,35% 10,76% 11,17%
600,00 5,87% 6,00% 6,17% 6,35% 6,52% 6,70% 6,87% 7,56% 7,84% 8,23% 8,61% 8,99% 9,36% 9,74%
615,00 5,62% 5,74% 5,92% 6,09% 6,26% 6,43% 6,60% 6,92% 7,19% 7,56% 7,92% 8,28% 8,64% 9,00%
650,00 5,06% 5,18% 5,35% 5,52% 5,69% 5,85% 6,01% 5,65% 5,90% 6,23% 6,56% 6,89% 7,22% 7,54%
675,00 4,69% 4,81% 4,98% 5,14% 5,30% 5,47% 5,63% 4,89% 5,12% 5,44% 5,75% 6,06% 6,37% 6,68%
700,00 4,34% 4,46% 4,62% 4,79% 4,94% 5,10% 5,26% 4,23% 4,44% 4,74% 5,04% 5,34% 5,63% 5,92%
CAPEX\OPEX FCFF Portugal FCFE Portugal
[EUR/kWp] 15,22 14,50 13,50 12,50 11,50 10,50 9,50 15,50 14,50 13,50 12,50 11,50 10,50 9,50
500,00 8,85% 9,00% 9,20% 9,40% 9,60% 9,80% 9,99% 16,49% 16,94% 17,57% 18,19% 18,82% 19,44% 20,05%
525,00 8,25% 8,39% 8,59% 8,78% 8,97% 9,17% 9,36% 13,65% 14,04% 14,58% 15,12% 15,66% 16,19% 16,72%
550,00 7,69% 7,83% 8,02% 8,21% 8,40% 8,58% 8,77% 11,52% 11,87% 12,35% 12,83% 13,30% 13,77% 14,24%
575,00 7,17% 7,31% 7,49% 7,68% 7,86% 8,04% 8,22% 9,86% 10,18% 10,61% 11,04% 11,47% 11,89% 12,32%
600,00 6,69% 6,82% 7,00% 7,18% 7,36% 7,54% 7,71% 8,52% 8,81% 9,20% 9,60% 9,99% 10,38% 10,77%
615,00 6,42% 6,55% 6,73% 6,90% 7,08% 7,25% 7,43% 7,83% 8,10% 8,48% 8,86% 9,23% 9,60% 9,97%
650,00 5,82% 5,95% 6,12% 6,29% 6,46% 6,63% 6,80% 6,45% 6,70% 7,05% 7,39% 7,73% 8,06% 8,40%
675,00 5,43% 5,55% 5,72% 5,88% 6,05% 6,22% 6,38% 5,63% 5,87% 6,19% 6,51% 6,83% 7,15% 7,46%
700,00 5,05% 5,17% 5,34% 5,50% 5,66% 5,83% 5,99% 4,91% 5,14% 5,44% 5,75% 6,05% 6,35% 6,65%
CAPEX\OPEX FCFF UK FCFE UK
[EUR/kWp] 15,22 14,50 13,50 12,50 11,50 10,50 9,50 15,50 14,50 13,50 12,50 11,50 10,50 9,50
500,00 4,13% 4,31% 4,56% 4,81% 5,05% 5,29% 5,52% 5,22% 5,75% 6,49% 7,21% 7,94% 8,65% 9,37%
525,00 3,66% 3,84% 4,08% 4,32% 4,55% 4,78% 5,01% 3,80% 4,26% 4,91% 5,54% 6,17% 6,79% 7,41%
550,00 3,22% 3,40% 3,63% 3,86% 4,09% 4,32% 4,54% 2,69% 3,11% 3,69% 4,26% 4,82% 5,38% 5,93%
575,00 2,82% 2,98% 3,21% 3,44% 3,67% 3,89% 4,11% 1,79% 2,18% 2,71% 3,23% 3,75% 4,25% 4,76%
600,00 2,43% 2,60% 2,82% 3,05% 3,27% 3,48% 3,70% 1,04% 1,40% 1,89% 2,38% 2,85% 3,33% 3,79%
615,00 2,22% 2,38% 2,60% 2,82% 3,04% 3,25% 3,46% 0,64% 0,99% 1,46% 1,93% 2,39% 2,84% 3,29%
650,00 1,74% 1,90% 2,11% 2,33% 2,54% 2,75% 2,95% -0,17% 0,15% 0,59% 1,02% 1,44% 1,86% 2,27%
675,00 1,42% 1,57% 1,79% 2,00% 2,21% 2,41% 2,61% -0,67% -0,36% 0,06% 0,47% 0,87% 1,27% 1,66%
700,00 1,12% 1,27% 1,48% 1,69% 1,89% 2,09% 2,29% -1,11% -0,82% -0,42% -0,03% 0,36% 0,74% 1,11%
As it has been expected, in all the locations, the post-tax IRR is increasing while the total CAPEX
and OPEX costs are decreasing. However, the IRR values calculated based on the free cashflow
to equity are more subjected to the changing costs. Additionally, it can be observed that the
change of CAPEX value influences the IRR more significantly than change in OPEX costs. It is
mostly due to higher share of capital costs in the overall project expenditures.
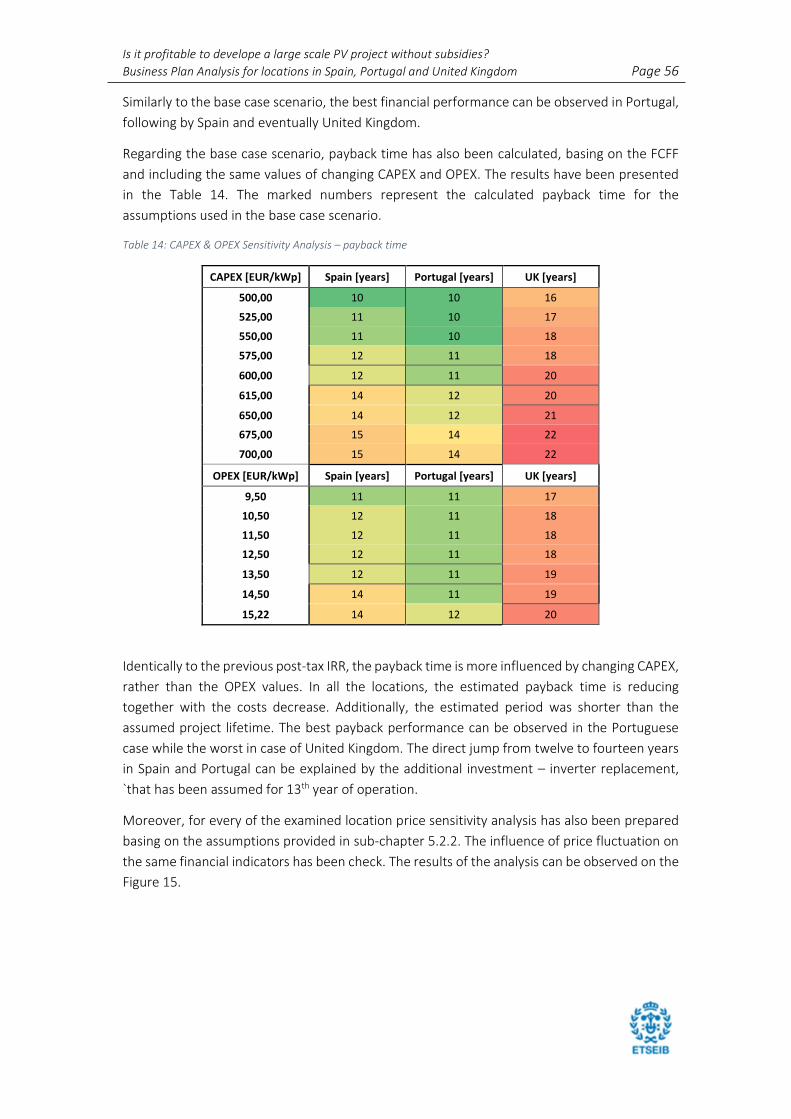
Is it profitable to develope a large scale PV project without subsidies?
Business Plan Analysis for locations in Spain, Portugal and United Kingdom Page 56
Similarly to the base case scenario, the best financial performance can be observed in Portugal,
following by Spain and eventually United Kingdom.
Regarding the base case scenario, payback time has also been calculated, basing on the FCFF
and including the same values of changing CAPEX and OPEX. The results have been presented
in the Table 14. The marked numbers represent the calculated payback time for the
assumptions used in the base case scenario.
Table 14: CAPEX & OPEX Sensitivity Analysis – payback time
CAPEX [EUR/kWp] Spain [years] Portugal [years] UK [years]
500,00 10 10 16
525,00 11 10 17
550,00 11 10 18
575,00 12 11 18
600,00 12 11 20
615,00 14 12 20
650,00 14 12 21
675,00 15 14 22
700,00 15 14 22
OPEX [EUR/kWp] Spain [years] Portugal [years] UK [years]
9,50 11 11 17
10,50 12 11 18
11,50 12 11 18
12,50 12 11 18
13,50 12 11 19
14,50 14 11 19
15,22 14 12 20
Identically to the previous post-tax IRR, the payback time is more influenced by changing CAPEX,
rather than the OPEX values. In all the locations, the estimated payback time is reducing
together with the costs decrease. Additionally, the estimated period was shorter than the
assumed project lifetime. The best payback performance can be observed in the Portuguese
case while the worst in case of United Kingdom. The direct jump from twelve to fourteen years
in Spain and Portugal can be explained by the additional investment – inverter replacement,
`that has been assumed for 13th year of operation.
Moreover, for every of the examined location price sensitivity analysis has also been prepared
basing on the assumptions provided in sub-chapter 5.2.2. The influence of price fluctuation on
the same financial indicators has been check. The results of the analysis can be observed on the
Figure 15.
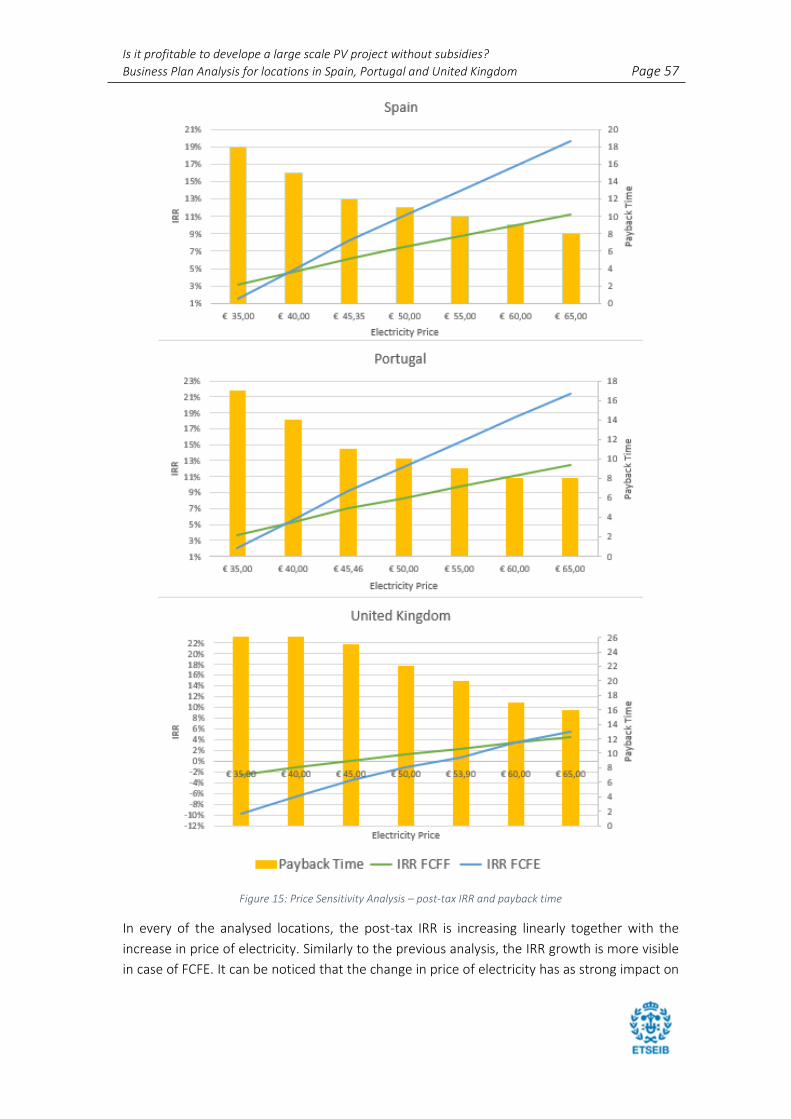
Is it profitable to develope a large scale PV project without subsidies?
Business Plan Analysis for locations in Spain, Portugal and United Kingdom Page 57
Figure 15: Price Sensitivity Analysis – post-tax IRR and payback time
In every of the analysed locations, the post-tax IRR is increasing linearly together with the
increase in price of electricity. Similarly to the previous analysis, the IRR growth is more visible
in case of FCFE. It can be noticed that the change in price of electricity has as strong impact on
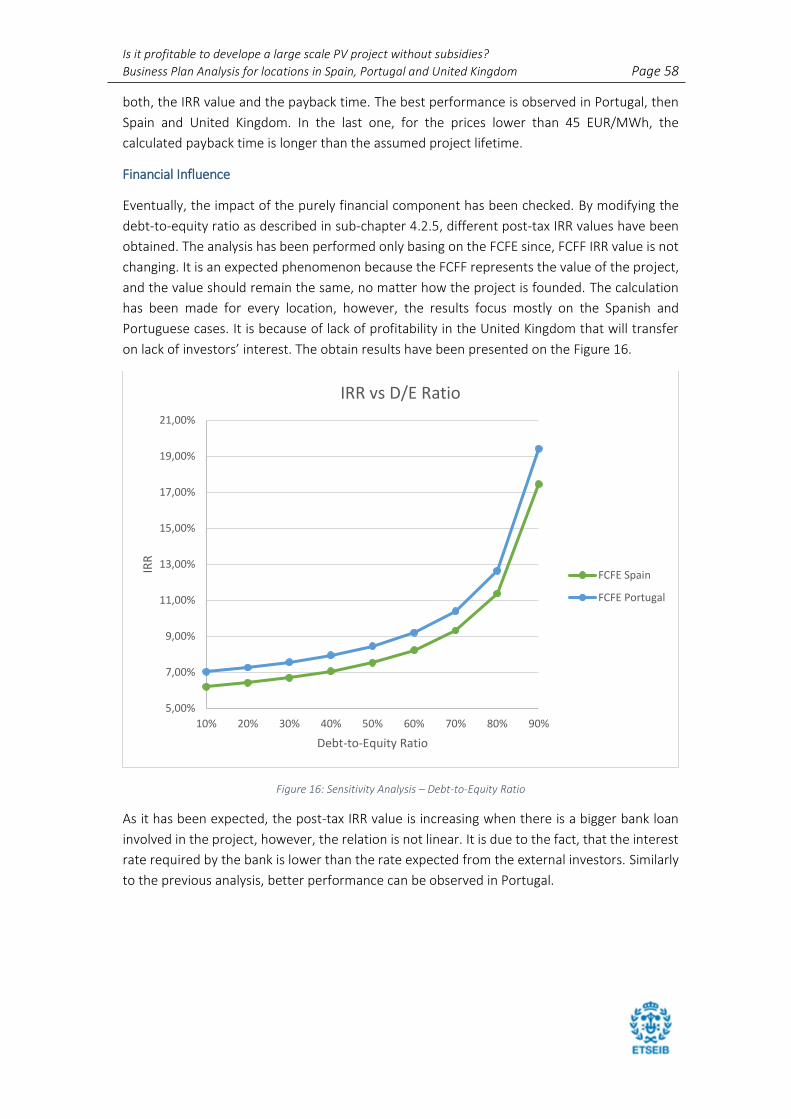
Is it profitable to develope a large scale PV project without subsidies?
Business Plan Analysis for locations in Spain, Portugal and United Kingdom Page 58
both, the IRR value and the payback time. The best performance is observed in Portugal, then
Spain and United Kingdom. In the last one, for the prices lower than 45 EUR/MWh, the
calculated payback time is longer than the assumed project lifetime.
Financial Influence
Eventually, the impact of the purely financial component has been checked. By modifying the
debt-to-equity ratio as described in sub-chapter 4.2.5, different post-tax IRR values have been
obtained. The analysis has been performed only basing on the FCFE since, FCFF IRR value is not
changing. It is an expected phenomenon because the FCFF represents the value of the project,
and the value should remain the same, no matter how the project is founded. The calculation
has been made for every location, however, the results focus mostly on the Spanish and
Portuguese cases. It is because of lack of profitability in the United Kingdom that will transfer
on lack of investors’ interest. The obtain results have been presented on the Figure 16.
Figure 16: Sensitivity Analysis – Debt-to-Equity Ratio
As it has been expected, the post-tax IRR value is increasing when there is a bigger bank loan
involved in the project, however, the relation is not linear. It is due to the fact, that the interest
rate required by the bank is lower than the rate expected from the external investors. Similarly
to the previous analysis, better performance can be observed in Portugal.
5,00%
7,00%
9,00%
11,00%
13,00%
15,00%
17,00%
19,00%
21,00%
10% 20% 30% 40% 50% 60% 70% 80% 90%
IRR
Debt-to-Equity Ratio
IRR vs D/E Ratio
FCFE Spain
FCFE Portugal
Is it profitable to develope a large scale PV project without subsidies?
Business Plan Analysis for locations in Spain, Portugal and United Kingdom Page 59
6. CONCLUSIONS
The major question of this dissertation was: Whether it is profitable to develop a large-scale PV
project without any form of governmental support? Basing on the performed analysis and
assumed conditions, it can be stated that in the selected locations in Spain and Portugal, the
large-scale photovoltaic installations can bring benefits to the investors. The obtain results
corresponds to the one from the real-life project already introduced in the sub-chapter 1.4.
Additionally, the results reflect the current solar market situation that according to the
information provided on the conference [12], is strongly focused on the transition towards the
subsidy-free PV projects. Only in Spain and Portugal, there is in total 479 MW of subsidy-free
PV projects that are currently built or under construction [15].
The final results obtained for the selected location in United Kingdom present lack of
profitability, however performed sensitivity analysis shows that if PV CAPEX and OPEX will
continue their current decreasing trend, the profitability can be reached within few years. This
information has been additionally confirmed during the aforementioned conference [12].
Moreover, there are already subsidy-free PV projects under construction in the United
Kingdom. The 10 MW Clayhill solar farm in Milton Keynes is already operating without any form
of subsidies. The plant, however, is co-located with 5 energy storage units of total capacity of
6 MW [20]. The EES implementation is fully understandable considering the insolation
conditions present in the United Kingdom. It is believed that the storage implementation will
significantly increase the profitability of the solar PV projects in the nearest future.
Besides the storage implementation, the profitability of the solar PV plant can be also increased
by the favourable policy towards solar power installation. This fact could be observed by the
differences between the results obtained for locations in Portugal and Spain. Despite similar
solar conditions as well as set electricity price, the obtained IRR values were higher in the
Portuguese case. It is mostly due to higher tax rates present in Spain. Considering purely
financial aspect, the results of the sensitivity analysis show that the IRR values are increasing
significantly together with higher share of debt in the project financing.
It can be noticed that the obtain results additionally supplement the described in the
introduction chapter solar grid and market parity. It shows that the solar energy is becoming
more and more competitive on the wholesale electricity market and that this trend is slowly
going to the north of Europe. According to [67] if the carbon prices get higher, the solar plants
might advantage even more over the conventional energy sources. This phenomenon is
additionally supported by the environmental aspect. According to the information contained in
[47], the comparison of PV plants with conventional sources of energy, that uses fossil fuels,
estimates the environmental savings at 690 gCO2/kWh of produced electricity. Considering the
assumed project lifetime (25-years), the environmental benefits can be equal to approximately:
• 28,64 tons of CO2 eq. per kW installed in Spain
• 27,65 tons of CO2 eq. per kW installed in Portugal
• 16,54 tons of CO2 eq. per kW installed in United Kingdom
Is it profitable to develope a large scale PV project without subsidies?
Business Plan Analysis for locations in Spain, Portugal and United Kingdom Page 60
These values could increase if the recycling process of the PV modules would be included in the
calculations. However, the recycling also increases the overall costs of the PV project thus, it
has not been included in the analysis in any form.
Despite many advantages of further implementation of PV technologies, there are several issues
that have to be addressed in order to prevent from the unexpected situations in the future. The
grid stability, that concerns not only further increase of the PV installations in the system, but
almost whole renewable sources of energy has to be control and constantly improved in order
to avoid power blackouts. Another issue that has to be monitored is the huge boom towards
further development of the solar PV project mostly caused by constantly decreasing PV prices.
Such phenomenon, if not controlled properly, can lead to the price cannibalisation effect, that
describe the situation when the large volumes of energy will lead to reduction of the wholesale
electricity prices, that may eventually result in decrease of the PV projects profitability.
The conducted analysis has been performed in a detailed way with the observance of due
diligence. The obtained results are credible and confirmed the current solar market activities as
well as are coherent with similar projects. However, considering further work on the following
topic, several improvements could be made:
• Since every PV project consist of different internal conditions, it is difficult to perform
a general comparison between different locations in different countries. In order to do
so, several assumptions have been made identical for every of the examined location
such e.g. the land rental cost. Access to the real-life, more specific data regarding
project implementation would be recommended in order to improve the quality and
credibility of this analysis.
• Due to lack of specific information, the taxation calculations have been performed using
the same method for every of the examined location. More detailed research of this
aspect should be performed in order to increase the credibility of this analysis. Country
related taxation process, additionally including the regional and municipal taxation
rates, should be applied for every of the examined location.
• The performed technical analysis have been made using the PVSyst software that is
considered to be a very respectful tool. The obtained technical parameters such as PR
and CF confirm proper plant modelisation, however the values of the project losses
presented in the Table 4 have been assumed using quite conservative approach. It
directly influences the amount of produced electricity, that is slightly lower in
comparison with another real-life PV project with similar parameters. Less conservative
approach could additionally increase the profitability of the examined project.
Despite the aforementioned possibilities of improvement, the performed work presents wide
analysis of the research topic and can serve as a valuable source of information regarding the
profitability assessment of the large-scale PV projects, considering different technical,
economical and geographical factors. It can be additionally used as a base for other analysis of
the given research question, that considering current movement towards unsubsidized PV
projects can become more popular in the nearest future.
Is it profitable to develope a large scale PV project without subsidies?
Business Plan Analysis for locations in Spain, Portugal and United Kingdom Page 61
7. BIBLIOGRAPHY
[1] Sgurr Energy, Utility-Scale Solar Photovoltaic Power Plants, A Project Developer's Guide,
Washington: International Finance Corporation, World Bank Group, 2015.
[2] S. Evans, “Eco-Business,” 28 March 2018. [Online]. Available: http://www.eco-
business.com/news/what-does-subsidy-free-renewables-actually-mean/. [Accessed 3
September 2018].
[3] L. Abend, “nature - International weekly journal of science,” 19 December 2008.
[Online]. Available: https://www-nature-
com.focus.lib.kth.se/news/2008/081219/full/news.2008.1326.html. [Accessed 3
September 2018].
[4] M. A. Noceda, “El Pais In English,” 5 May 2017. [Online]. Available:
https://elpais.com/elpais/2017/05/05/inenglish/1493988308_857826.html. [Accessed
3 September 2018].
[5] “Solar Market Parity,” Solarplaza, 4 April 2018. [Online]. Available:
https://solarmarketparity.com/webinar/. [Accessed 3 September 2018].
[6] J. D. Mondol and S. K. Hillenbrand, “Grid parity analysis of solar photovoltaic systems in
Europe,” International Journal of Ambient Energy, vol. 35, no. 4, pp. 200-210, 2013.
[7] BayWa r.e., “Case study: a utility-scale subsidy-free plant in Spain,” Benedikt Ortmann,
Milan, 2018.
[8] Aurora Energy Research , “Aurora Energy Research,” April 2018. [Online]. Available:
https://www.auroraer.com/insight/subsidy-free-revolution/. [Accessed 3 September
2018].
[9] Aurora Energy Research , “Aurora Energy Research,” March 2018. [Online]. Available:
https://www.auroraer.com/insight/managing-merchant-risk-in-renewables/. [Accessed
3 September 2018].
[10] J. Deign, “Solarplaza,” Solarplaza, 4 April 2018. [Online]. Available:
https://www.solarplaza.com/channels/finance/11813/who-needs-subsidies-when-
there-solar-market-parity/. [Accessed 3 September 2018].
[11] S. Media, “Large Scale Solar Europe The Transition To Subsidy Free,” Dublin, 2018.
[12] Solarplaza, “Solar Market Parity Conference,” Milan, 2018.

Is it profitable to develope a large scale PV project without subsidies?
Business Plan Analysis for locations in Spain, Portugal and United Kingdom Page 62
[13] A. Cabrera-Tobar, E. Bullich-Massague, M. Aragues-Penalba and O. Gomis-Bellmunt,
“Topologies for large scale photovoltaic power plants,” Renewable and Sustainable
Energy Reviews, no. 59, pp. 309-319, 2015.
[14] EDIFICIO GRUPO ENERPRO, “Grupo Enerpro,” [Online]. Available:
http://www.grupoenerpro.es/unsubsidized-solar-power-gives-it-a-go-in-spain-2/.
[Accessed 3 September 2018].
[15] Bloomberg New Energy Finance, “Europe's new era of subsidy-free PV,” Pietro Radoia,
Milan, 2018.
[16] S. Dunlop and A. Roesch, “EU-Wide Solar PV Business Models,” Solar Power Europe,
2016.
[17] P. Donnelly-Shores, 30 July 2013. [Online]. Available:
https://www.greentechmedia.com/articles/read/what-does-utility-scale-solar-really-
mean#gs.pmCTw_U. [Accessed 3 September 2018].
[18] Solar Energy Industries Association, “SEIA,” [Online]. Available:
https://www.seia.org/initiatives/utility-scale-solar-power. [Accessed 3 September
2018].
[19] E. Bellini, “Pv Magazine,” 12 January 2018. [Online]. Available: https://www.pv-
magazine.com/2018/01/12/portugal-unsubsidized-approved-large-scale-pv-projects-
top-756-mw-first-solar-private-ppa-signed/. [Accessed 3 September 2018].
[20] Anesco, Anesco, [Online]. Available: https://anesco.co.uk/clayhill-uks-first-subsidy-free-
solar-farm/. [Accessed 3 September 2018].
[21] European Comission, [Online]. Available:
https://ec.europa.eu/energy/en/topics/markets-and-consumers/market-legislation.
[Accessed 3 September 2018].
[22] European Comission, [Online]. Available:
https://ec.europa.eu/energy/en/topics/energy-strategy-and-energy-union/clean-
energy-all-europeans. [Accessed 3 September 2018].
[23] G. Erbach, “Understanding electricity markets in the EU,” European Parliment, 2016.
[24] OMiE, [Online]. Available: http://www.omie.es/en/home/markets-and-
products/european-market/market-coupling-operator-mco-plan. [Accessed 3
September 2018].
[25] OMiE, “PCR Project,” [Online]. Available: http://www.omie.es/en/home/markets-and-
products/european-market/pcr/presentations. [Accessed 3 September 2018].
Is it profitable to develope a large scale PV project without subsidies?
Business Plan Analysis for locations in Spain, Portugal and United Kingdom Page 63
[26] World Business Council for Sustainable Development, “Corporate Renewable Power
Purchase Agreements,” Geneva, 2015.
[27] Solar Power Europe, “Corporate Renewable Energy Sourcing - The future of PPAs in
Europe,” 5 March 2018. [Online]. Available:
https://register.gotowebinar.com/recording/viewRecording/6027938747205066497/3
490106481958770178/[email protected]?registrantKey=511069866012921652
3&type=ABSENTEEEMAILRECORDINGLINK. [Accessed 3 September 2018].
[28] L. T. Maurer and L. A. Barroso, Electricity Auctions: An Overview of Efficient Practices,
Washington: The World Bank, 2011.
[29] N. Mazzi, A. Lorenzoni, S. Rech and A. Lazzaretto, “Electricity auctions: an European view
on merkets and practices,” IEEE, 2015.
[30] OMiE, [Online]. Available: http://www.omie.es/en/home/markets-and-
products/electricity-market/our-electricity-markets/daily-and-intradaily. [Accessed 3
September 2018].
[31] M. Dorothal, Solarplaza, [Online]. Available: https://solarmarketparity.com/market-
parity-watch-source/2018/5/1/top-15-merchant-solar-
plants?utm_source=solarplaza&utm_medium=email&utm_campaign=top-15-
merchant-solar. [Accessed 3 September 2018].
[32] European Comisson, [Online]. Available: https://ec.europa.eu/energy/en/topics/energy-
strategy-and-energy-union/building-energy-union. [Accessed 3 September 2018].
[33] International Energy Agency, “Renewables information: Overview,” IEA, 2017.
[34] European Comission, “EU Energy in Figures: Statistical Pocketbook,” Luxembourg, 2017.
[35] EY, “Capturing the sun. The economics of solar investment,” 2016.
[36] IRENA, “Renewable Power Generation Costs in 2017,” Internation Renewable Energy
Agency, Abu Dhabi, 2018.
[37] D. Feldman, J. Hoskins and R. Margolis, “Q4 2017/Q1 2018 Solar Industry Update,”
National Renewable Energy Laboratory, Denver, 2018.
[38] R. Fu, D. Feldman, R. Margolis, M. Woodhouse and K. Ardani, “U.S. Solar Photovoltaic
System Cost Benchmark: Q1 2017,” National Renewable Energy Laboratory, Denver,
2017.
[39] C. S. Lai and M. D. McCulloch, “Levelized cost of electricity for solar photovoltaic and
electrical energy storage,” Applied Energy, no. 190, pp. 191-203, 2017.
Is it profitable to develope a large scale PV project without subsidies?
Business Plan Analysis for locations in Spain, Portugal and United Kingdom Page 64
[40] F. Díaz-González, Interviewee, [Interview]. 15 July 2018.
[41] L. Dusonchet and E. Telaretti, “Comparative economic analysis of support policies for
solar PV in the most representative EU countries,” Renewable and Sustainable Energy
Reviews, no. 42, pp. 986-998, 2015.
[42] L. Dusonchet and E. Telaretti, “Economic analysis of different supporting policies for the
production of electrical energy by solar photovoltaics in western European Unione
countries,” Energy Policy, no. 38, pp. 3297-3308, 2010.
[43] J. d. l. Hoz, H. Martin, B. Martins, J. Matas and J. M. Guerrero, “Comments on‘‘Economic
analysis of different supporting policies for the production of electrical energy by solar
photovoltaics in western European Union countries",” Energy Policy, no. 48, pp. 846-
849, 2012.
[44] Y. Karneyeva and R. Wustenhagen, “Solar feed-in tariffs in a post-grid parity world: The
role of risk, investor diversity and business models,” Energy Policy, no. 106, pp. 445-456,
2017.
[45] P. Mir-Artigues, E. Cerda and P. d. Rio, “Analyzing the impact of cost-containment
mechanisms on the profitability of solar PV plants in Spain,” Renewable and Sustainable
Energy Reviews, no. 46, pp. 166-177, 2015.
[46] F. Cucchiella, I. D'Adamo and M. Gastaldi, “A profitability assessment of small-scale
photovoltaic systems in an electricicty market without subsidies,” Energy Conversion and
Management, no. 129, pp. 62-74, 2016.
[47] F. Cuchiella, I. D'Adamo and P. Rosa, “Industrial Photovoltaic Systems: An Economic
Analysis in Non-Subsidized Electricity Markets,” Energies, 2015.
[48] A. Poullikkas, “Parametric cost-benefit analysis for the installation of photovoltaic parks
in the island of Cyprus,” Energy Policy, no. 37, pp. 3673-3680, 2009.
[49] P. Caballero, G. Srinivasan and M. Suri, “Solargis,” 26 July 2018. [Online]. Available:
https://solargis.com/blog/best-practices/how-to-calculate-p90-or-other-pxx-pv-
energy-yield-estimates/. [Accessed 3 September 2018].
[50] PVTech, “Levelized Cost of Electricity of PV- Large Scale Plants with JinkoModules
Technologies,” 30 May 2018. [Online]. Available: https://www.pv-
tech.org/webinars/webinar-levelized-cost-of-electricity-of-pv-large-scale-plants-with-
jinkomo. [Accessed 3 September 2018].
[51] JinkoSolar, “JinkoSolar Datasheets,” [Online]. Available:
https://www.jinkosolar.com/download_356.html. [Accessed 3 September 2018].
Is it profitable to develope a large scale PV project without subsidies?
Business Plan Analysis for locations in Spain, Portugal and United Kingdom Page 65
[52] JinkoSolar, [Online]. Available: https://www.jinkosolar.com/about_1.html?lan=en.
[Accessed 3 September 2018].
[53] E. Bullich-Massague, Interviewee, [Interview]. 2 July 2018.
[54] SMA, “Sunny Central 1000 CP XT,” [Online]. Available:
https://www.sma.de/en/products/solarinverters/sunny-central-1000cp-xt.html.
[Accessed 3 September 2018].
[55] A. Mermoud and B. Wittmer, “Tutorial PVSyst SA - PVSyst 6,” Satigny, 2017.
[56] PVSyst, “Irradiance Loss,” [Online]. Available:
http://files.pvsyst.com/help/irradiance_loss.htm. [Accessed 4 September 2018].
[57] National Renewable Energy Laboratory, “Solar PV AC-DC Translation,” [Online].
Available: https://atb.nrel.gov/electricity/2017/pv-ac-dc.html. [Accessed 4 September
2018].
[58] SMA Solar Technology AG, “Performance ratio - Oulity factor for the PV plant,” SMA.
[59] Investopedia, “Free Cash Flow for the Firm,” [Online]. Available:
https://www.investopedia.com/terms/f/freecashflowfirm.asp. [Accessed 4 September
2018].
[60] Investopedia, “Free Cash Flow to Equity - FCFE,” [Online]. Available:
https://www.investopedia.com/terms/f/freecashflowtoequity.asp. [Accessed 4
September 2018].
[61] Investopedia , “Weighted Average Cost of Capital (WACC),” [Online]. Available:
https://www.investopedia.com/terms/w/wacc.asp. [Accessed 4 September 2018].
[62] Investopedia, “Net Present Value - NPV,” [Online]. Available:
https://www.investopedia.com/terms/n/npv.asp. [Accessed 4 Septemebr 2018].
[63] Investopedia, “Internal Rate of Return - IRR,” [Online]. Available:
https://www.investopedia.com/terms/i/irr.asp. [Accessed 4 September 2018].
[64] Investopedi, “Payback Period,” [Online]. Available:
https://www.investopedia.com/terms/p/paybackperiod.asp. [Accessed 4 September
2018].
[65] OMiE, “Price Report,” 2017.
[66] OFGEM, “Wholesale Market Indicators,” [Online]. Available:
https://www.ofgem.gov.uk/data-portal/wholesale-market-indicators. [Accessed 4
September 2018].

Is it profitable to develope a large scale PV project without subsidies?
Business Plan Analysis for locations in Spain, Portugal and United Kingdom Page 66
[67] J. Garrido, Interviewee, [Interview]. 28 August 2018.
[68] J. Beese, Interviewee, [Interview]. 10 August 2018.
[69] F. Horta, Interviewee, [Interview]. 10 July 2018.
[70] A. Damodaran, “Data: Current,” [Online]. Available:
http://pages.stern.nyu.edu/~adamodar/New_Home_Page/datacurrent.html. [Accessed
4 September 2018].
[71] A. Damodaran, “Country Default Speads and Risk Premiums,” [Online]. Available:
http://pages.stern.nyu.edu/~adamodar/New_Home_Page/datafile/ctryprem.html.
[Accessed 4 September 2018].
[72] KPMG, “Corporate Marginal Tax Rates - By country,” [Online]. Available:
http://pages.stern.nyu.edu/~adamodar/New_Home_Page/datafile/countrytaxrate.htm
. [Accessed 4 September 2018].
[73] S. Pfeifer and M. Pooler, “UK industry pays 33% more for electricity than rest of Europe,”
Financial Times, 5 February 2018. [Online]. Available:
https://www.ft.com/content/2ffd8d62-0828-11e8-9650-9c0ad2d7c5b5. [Accessed 5
September 2018].
[74] A. E. Specialist, Interviewee, [Interview]. 27 August 2018.
[75] “Collins,” [Online]. Available:
https://www.collinsdictionary.com/dictionary/english/learning-curve. [Accessed 3
September 2018].
[76] Investopedia, “Net Income,” [Online]. Available:
https://www.investopedia.com/terms/n/netincome.asp. [Accessed 4 September 2018].
[77] Investopedia, “Retained Earnings,” [Online]. Available:
https://www.investopedia.com/terms/r/retainedearnings.asp. [Accessed 4 September
2018].
[78] Investopedia, [Online]. Available:
https://www.investopedia.com/terms/e/economiesofscale.asp. [Accessed 8 September
2018].

Is it profitable to develope a large scale PV project without subsidies?
Business Plan Analysis for locations in Spain, Portugal and United Kingdom Page 67
APPENDIX I The follwoing appendix will provide detailed information regarding the selected components:
PV Pannel - Eagle PERC 72M

Is it profitable to develope a large scale PV project without subsidies?
Business Plan Analysis for locations in Spain, Portugal and United Kingdom Page 68

Is it profitable to develope a large scale PV project without subsidies?
Business Plan Analysis for locations in Spain, Portugal and United Kingdom Page 69
Inverter - Sunny Central 1000CP XT

Is it profitable to develope a large scale PV project without subsidies?
Business Plan Analysis for locations in Spain, Portugal and United Kingdom Page 70
APPENDIX: II The following appendix will provide information regarding the major project settings selected
in the PVSyst software for the analysis.
APPENDIX: III The following table contains the average wholesale electricity prices from last 8 years for every
of the examined location. The prices have been given in EUR/MWh.
2010 2011 2012 2013 2014 2015 2016 2017 Average
Spain 37,01 49,93 47,23 44,26 42,13 50,32 39,67 52,24 45,35
Portugal 37,33 50,45 48,07 43,65 41,86 50,43 39,44 52,48 45,46
UK 50,40 56,00 51,52 60,48 47,04 45,92 67,20 52,64 53,90

Is it profitable to develope a large scale PV project without subsidies?
Business Plan Analysis for locations in Spain, Portugal and United Kingdom Page 71
APPENDIX: IV The following figure presents the equities/liabilities and assets included in the balance sheet.
SPAIN
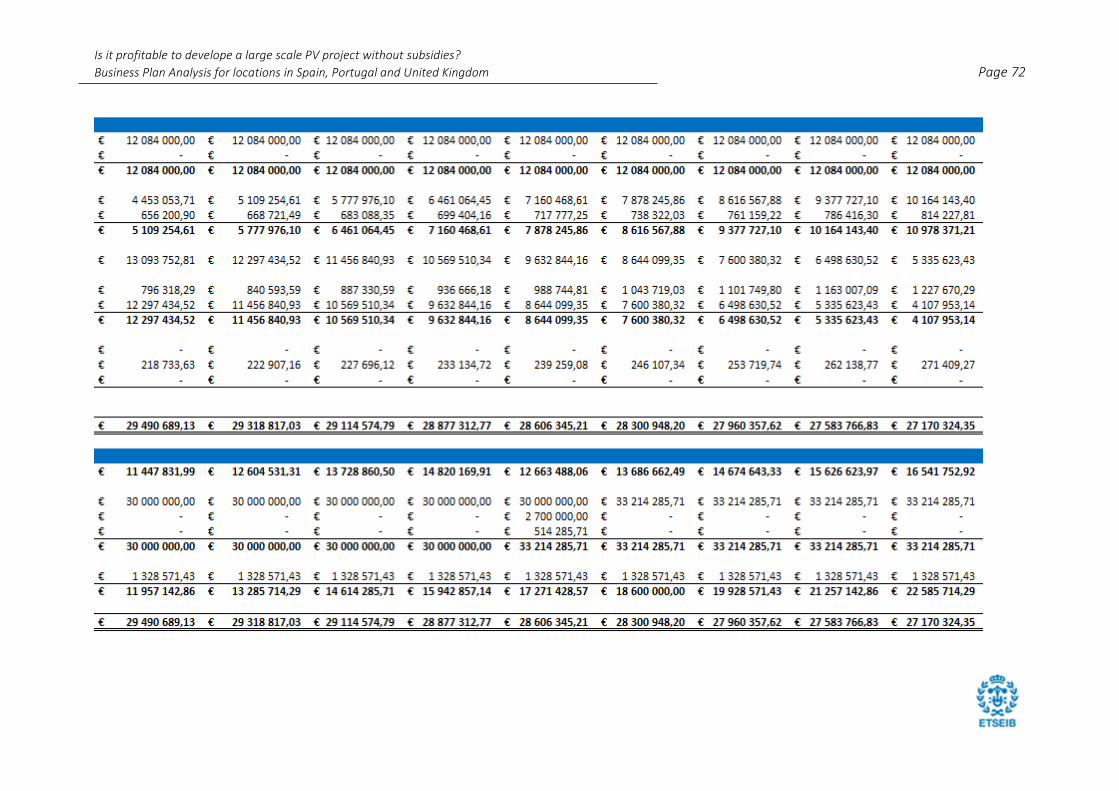
Is it profitable to develope a large scale PV project without subsidies?
Business Plan Analysis for locations in Spain, Portugal and United Kingdom Page 72

Is it profitable to develope a large scale PV project without subsidies?
Business Plan Analysis for locations in Spain, Portugal and United Kingdom Page 73
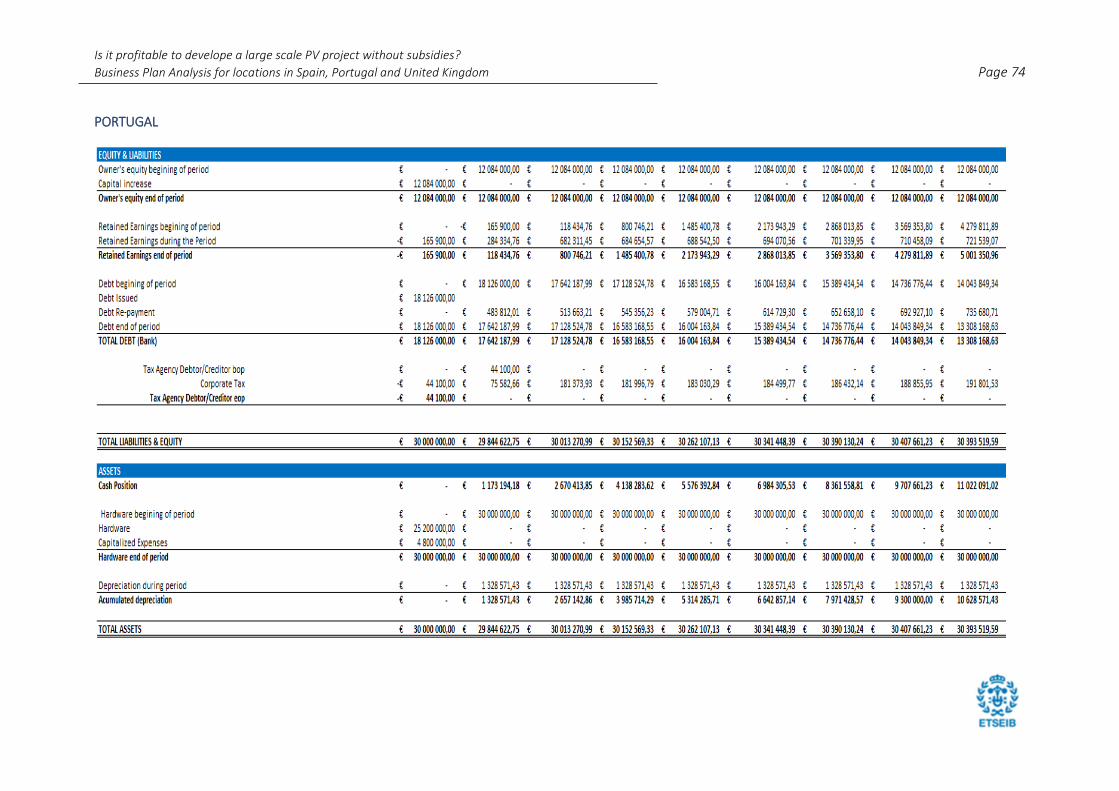
Is it profitable to develope a large scale PV project without subsidies?
Business Plan Analysis for locations in Spain, Portugal and United Kingdom Page 74
PORTUGAL
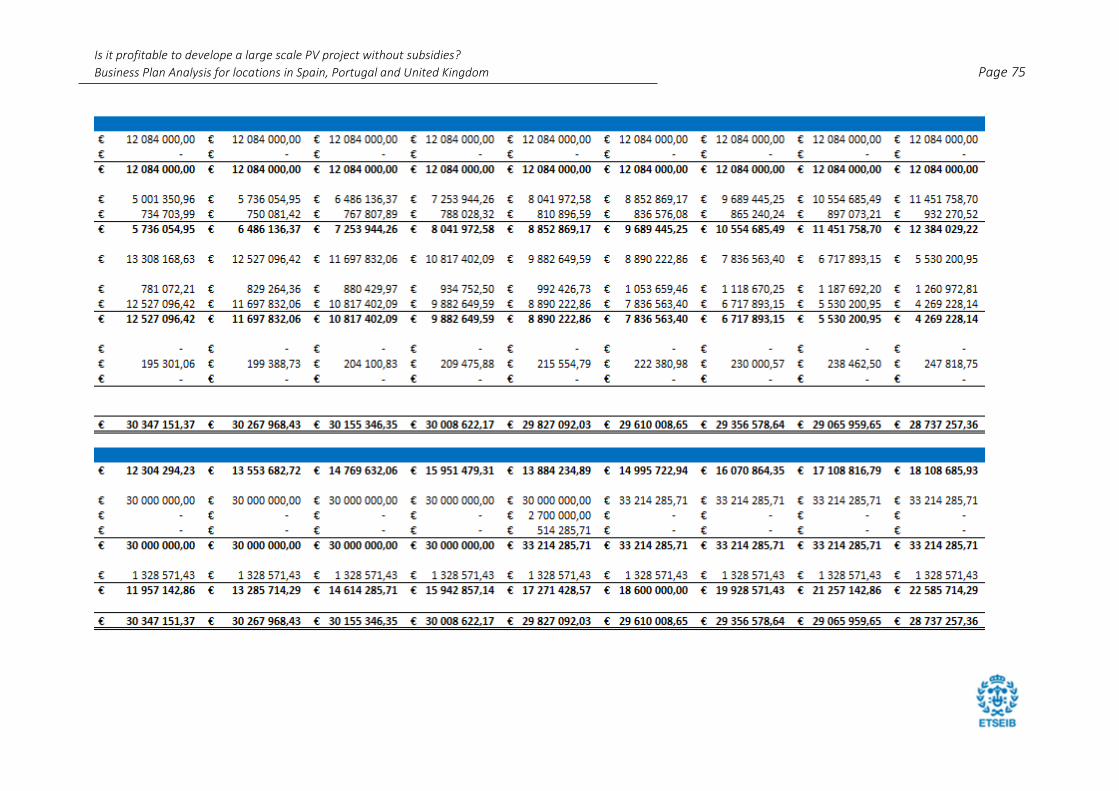
Is it profitable to develope a large scale PV project without subsidies?
Business Plan Analysis for locations in Spain, Portugal and United Kingdom Page 75
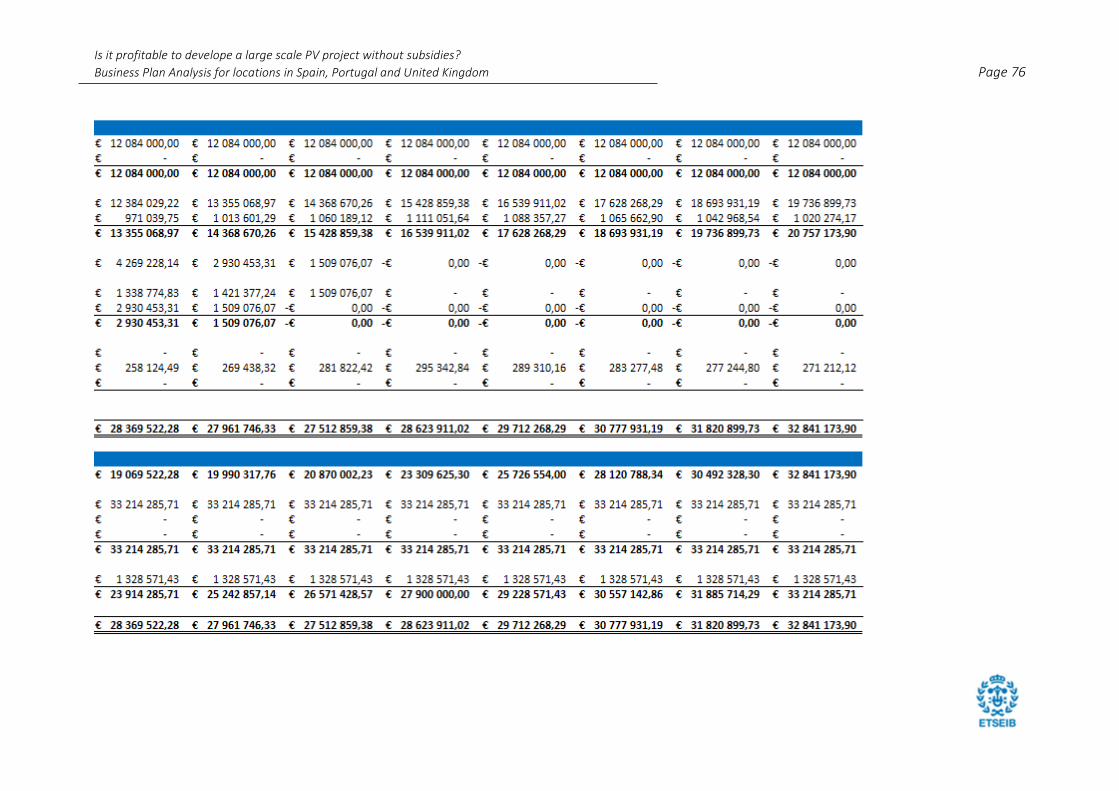
Is it profitable to develope a large scale PV project without subsidies?
Business Plan Analysis for locations in Spain, Portugal and United Kingdom Page 76
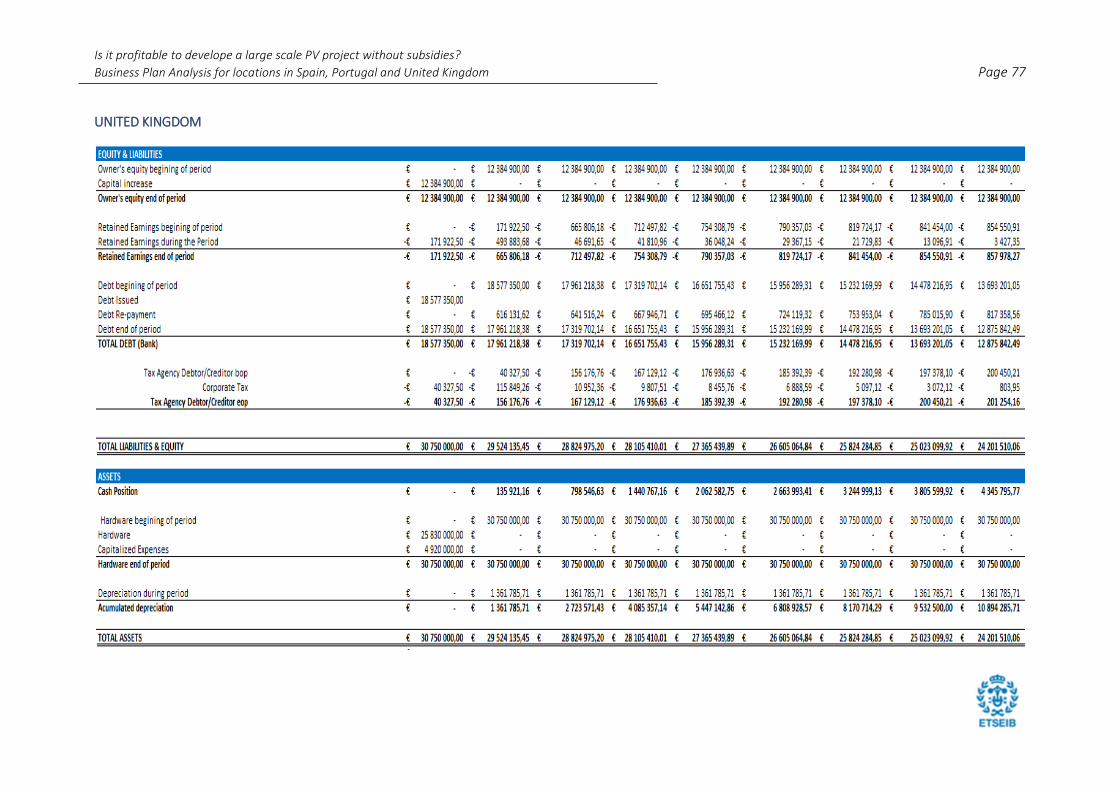
Is it profitable to develope a large scale PV project without subsidies?
Business Plan Analysis for locations in Spain, Portugal and United Kingdom Page 77
UNITED KINGDOM

Is it profitable to develope a large scale PV project without subsidies?
Business Plan Analysis for locations in Spain, Portugal and United Kingdom Page 78

Is it profitable to develope a large scale PV project without subsidies?
Business Plan Analysis for locations in Spain, Portugal and United Kingdom Page 79
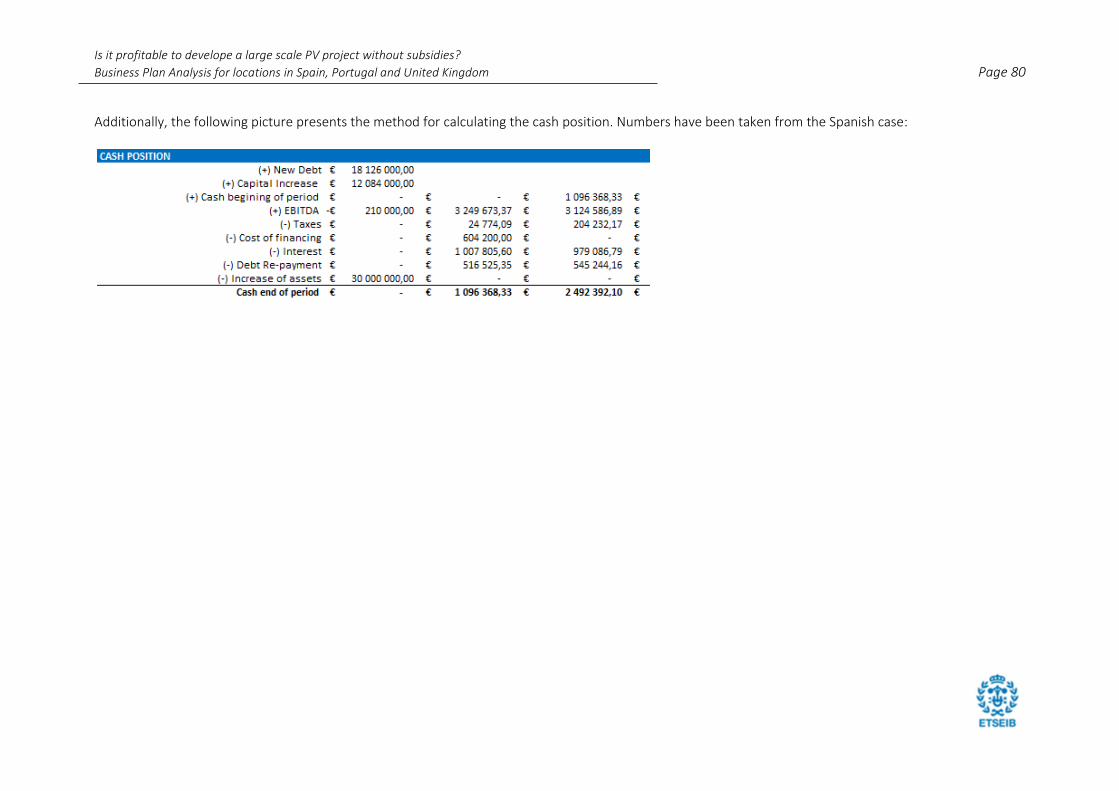
Is it profitable to develope a large scale PV project without subsidies?
Business Plan Analysis for locations in Spain, Portugal and United Kingdom Page 80
Additionally, the following picture presents the method for calculating the cash position. Numbers have been taken from the Spanish case: