is gifted education a bright idea? assessing the impact of ... · is gifted education a bright...
TRANSCRIPT
NBER WORKING PAPER SERIES
IS GIFTED EDUCATION A BRIGHT IDEA? ASSESSING THE IMPACT OF GIFTEDAND TALENTED PROGRAMS ON ACHIEVEMENT
Sa A. BuiSteven G. Craig
Scott A. Imberman
Working Paper 17089http://www.nber.org/papers/w17089
NATIONAL BUREAU OF ECONOMIC RESEARCH1050 Massachusetts Avenue
Cambridge, MA 02138May 2011
We would like to thank Aimee Chin, Dennis Epple, Jason Imbrogno, Chinhui Juhn, Brian Kovak,Jacob Vigdor and seminar participants at APPAM, AEFP, SOLE, Carnegie Mellon University, GeorgetownUniversity, University of Houston, and University of Maryland, and the employees of an anonymousschool district for all of their guidance and assistance in this project. Financial support from the Universityof Houston Small Grants program is gratefully appreciated. The views expressed herein are those ofthe authors and do not necessarily reflect the views of the National Bureau of Economic Research.
NBER working papers are circulated for discussion and comment purposes. They have not been peer-reviewed or been subject to the review by the NBER Board of Directors that accompanies officialNBER publications.
© 2011 by Sa A. Bui, Steven G. Craig, and Scott A. Imberman. All rights reserved. Short sectionsof text, not to exceed two paragraphs, may be quoted without explicit permission provided that fullcredit, including © notice, is given to the source.

Is Gifted Education a Bright Idea? Assessing the Impact of Gifted and Talented Programson AchievementSa A. Bui, Steven G. Craig, and Scott A. ImbermanNBER Working Paper No. 17089May 2011JEL No. H75,I2
ABSTRACT
In this paper we determine how the receipt of gifted and talented (GT) services affects student outcomes.We identify the causal relationship by exploiting a discontinuity in eligibility requirements and findthat for students on the margin there is no discernable impact on achievement even though peers improvesubstantially. We then use randomized lotteries to examine the impact of attending a GT magnet programrelative to GT programs in other schools and find that, despite being exposed to higher quality teachersand peers that are one standard deviation higher achieving, only science achievement improves. Weargue that these results are consistent with an invidious comparison model of peer effects offsettingother benefits. Evidence of large reductions in course grades and rank relative to peers in both regressiondiscontinuity and lottery models are consistent with this explanation.
Sa A. BuiUniversity of Houston204 McElhinney HallHouston, TX [email protected]
Steven G. CraigUniversity of HoustonDepartment of Economics204 McElhinney HallHouston, TX [email protected]
Scott A. ImbermanDepartment of EconomicsUniversity of Houston204 McElhinney HallHouston, TX 77204and [email protected]
An online appendix is available at:http://www.nber.org/data-appendix/w17089
2
I. Introduction The pending reauthorization of the No Child Left Behind Act (NCLB) has renewed
interest in gifted education, in part due to research suggesting that NCLB may have been less
effective at helping high achieving than low achieving students (Neal and Schanzenbach, 2010;
Rebeck, 2008). One possible channel for these findings is the shifting of resources from gifted to
low-achieving students as the incentives in NLCB are to help the latter and not the former. The
opportunity costs of such a resource diversion are difficult to discern, however, because little is
known about the effectiveness of gifted and talented (GT) programs for the three million students
in the US who are classified as gifted. GT programs might help high achieving students because
they group them with other high-achievers, and offer a variety of additional resources including
specially trained teachers and a more advanced curriculum. While early research finds that
ability grouping is correlated with higher achievement, many of these studies are likely biased
due to unobserved characteristics of students, such as motivation, that simultaneously lead
students to be successful and to be grouped in high ability classrooms.2 Recently, some
researchers have tried to address the bias issue in ability grouping, but with mixed results (Argys,
Rees and Brewer, 1996; Betts and Shkolnik, 2000; Epple, Newlon and Romano, 2002; Figlio and
Page, 2002; Duflo, Dupas and Kremer, forthcoming). Our analysis goes beyond these studies as
it focuses on a group of students who are not well studied – high achievers – and the
effectiveness of the services provided to them. As such, our work significantly expands our
understanding of gifted and talented programs, as we explicitly address their effectiveness using
two unique strategies for overcoming bias - a regression discontinuity design embedded within
the eligibility requirements and an analysis of lotteries to attend premier GT magnet programs.
2 See Kulik and Kulik (1997) for a review.

3
Specifically, we utilize the case of a universal GT evaluation in a large urban school
district in the Southwest (LUSD) where, since 2007, all fifth grade students have been evaluated
to determine eligibility for gifted and talented services starting in sixth grade. Eligibility is
identified by two well-defined cutoffs on an index score that is based on achievement tests, a
non-verbal ability test, grades, teacher recommendations, and socio-economic status. We exploit
these cutoffs to set up a regression discontinuity (RD) design whereby students who score just
above the cutoffs are compared to those who score just below. Under certain conditions, for
which we provide evidence that this analysis meets, our estimates provide the causal impact of
enrolling in a GT program on achievement for students on the margin of eligibility.
The second research strategy we employ uses randomized lotteries that determine
admission to two middle schools with over-subscribed magnet GT programs. Conditional on
meeting the district-wide GT eligibility requirements and completing an application, students are
randomly offered admission to the district’s premier magnet schools. This allows us to examine
achievement and attendance differences between students who win the lottery and attend the
magnet GT schools, and those who lose the lottery and attend other “neighborhood” programs.3
We also provide evidence that these premier GT schools generate a more intensive treatment
along observable measures than the neighborhood GT programs.
To our knowledge, only Bhatt (2009) specifically studies the effect of GT programs on
achievement, although Davis, Engberg, Epple, Sieg and Zimmer (2010) find that higher income
parents are more likely to stay in public schools when their children are eligible for GT
programs. While Bhatt finds significant improvements in math achievement, her instrumental
3 Students that lose the lottery can attend GT programs in their local school, other magnet schools (based on other specializations), or charter schools. The GT programs in these other schools are called neighborhood programs, because they are not designed to attract GT students from other attendance zones.

4
variables methodology suffers from weak instruments, leaving open the potential that her
estimates are biased. Our work offers a wider scope of inquiry, and further offers the two distinct
identification strategies. Thus, our study will be the first to establish credibly causal estimates of
the impacts of GT programs on student achievement.
Our RD analysis shows that students exposed to GT curriculum for the entirety of 6th
grade plus half of 7th grade exhibit no significant improvement in achievement. This is despite
substantial increases in average peer achievement on the order of one-fourth to one-third of a
standard deviation, an increased likelihood of being placed in advanced classes, and the
opportunity to attend a GT magnet program. We also find no improvements within student
subgroups. While our estimates are local to the RD margin we note that, due to the multiple
factors that go into the eligibility index, students near the discontinuity show wide variation in
achievement levels, leading to a more generalizable interpretation than most RD designs. For
example, students who score precisely at the eligibility threshold range from 45 to 97 national
percentile rankings in reading and between 55 and 98 percentiles in math.4
The lottery results, comparing students in the two premier GT magnet schools to other
GT students, also show little improvement in overall 7th grade achievement with the exception of
science scores. This is despite improvements in mean peer achievement on the order of one
standard deviation, and higher quality teachers as measured by teacher fixed effects. We also
note that, although the lottery analysis answers a different question than the RD, it has the
advantage of evaluating the impact of receiving a more intense treatment for students who would
4 The inter-quartile ranges are 78 to 92 for reading and 83 to 94 for math.

5
be infra-marginal in the RD framework, as lottery participants tend to be from the upper part of
the GT distribution.5
There are several pathways through which exposure to GT programs might increase
student achievement. We demonstrate below that teachers in the premier schools with lotteries
have larger fixed effects on achievement than teachers who instruct lottery losers, and that
marginal students in the GT program take more advanced courses than marginal students not in a
GT program.6 Additionally, while we cannot directly assess these mechanisms, GT may induce
parents to become more involved in their children’s schooling or the additional schooling options
available to GT students may generate a better match between students and their schools.
Nonetheless, we find that peer effects amongst GT students are especially interesting in
this context given the large improvements in peer quality from enrolling in GT. If peer effects
follow a monotonic model whereby being surrounded by higher achieving students improves
one’s own achievement, as found in Imberman, Kugler and Sacerdote (2009), better peers should
be helpful. For a marginal GT student, however, the peer effect may not necessarily be positive.
That is, a marginal GT student is likely to go from being near the top of the regular class to being
near the bottom of the GT class. Further, even students in the middle of the GT distribution may
experience a similar loss of ranking in the magnet GT schools compared to neighborhood
schools. In this context it is possible that an invidious comparison (IC) model proposed by
Hoxby and Weingarth (2006), whereby students are demoralized by reductions in their relative
ranking or teachers provide more resources to students at the top of the classroom distribution,
5 While the average GT student in 7th grade scores 1 standard deviation above the mean 7th grade student, the lottery participants score 1.6 standard deviations above the mean. 6 Conversations with school district officials suggests that the GT curriculum is more likely to include more detail and go more in-depth into topics, rather than cover the regular curriculum more quickly and add additional topics (increase breadth).
6
applies. We present suggestive evidence using both course grades and the ranking of students
within each class that indicates invidious comparison may be sufficiently important to balance
out the other characteristics of GT programs that would be expected to increase achievement.
II. The Gifted and Talented Program in LUSD
LUSD is a very large school district in the Southwestern US with over 200,000 students.
The district is heavily minority and very low income, although the minority population is more
heavily Hispanic rather than African-American. Panel A of Table 1 show that gifted students are
less likely to be economically disadvantaged, more likely to be white, less likely to have limited
English proficiency, and perform better on both cognitive and non-cognitive measures of output
than non-GT. Schools in LUSD also have a monetary incentive for attracting gifted students as
LUSD provides a funding boost of 12% over the average daily allotment for a regular student.
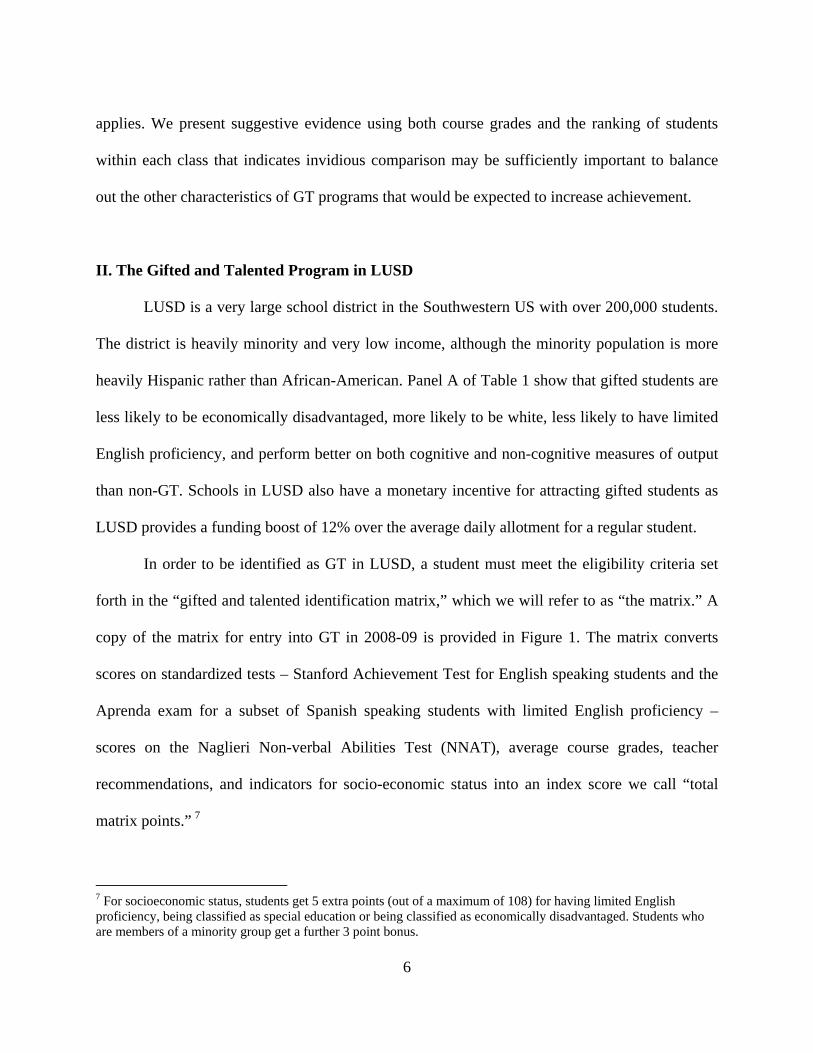
In order to be identified as GT in LUSD, a student must meet the eligibility criteria set
forth in the “gifted and talented identification matrix,” which we will refer to as “the matrix.” A
copy of the matrix for entry into GT in 2008-09 is provided in Figure 1. The matrix converts
scores on standardized tests – Stanford Achievement Test for English speaking students and the
Aprenda exam for a subset of Spanish speaking students with limited English proficiency –
scores on the Naglieri Non-verbal Abilities Test (NNAT), average course grades, teacher
recommendations, and indicators for socio-economic status into an index score we call “total
matrix points.” 7
7 For socioeconomic status, students get 5 extra points (out of a maximum of 108) for having limited English proficiency, being classified as special education or being classified as economically disadvantaged. Students who are members of a minority group get a further 3 point bonus.

7
Students can meet eligibility requirements in one of two ways. The first is having 56 total
matrix points, including at least 16 points from the Stanford Achievement Test or Aprenda and
10 points from the NNAT.8 Alternatively, students can qualify by having 62 total matrix points
regardless of Stanford, Aprenda and NNAT scores. During 5th grade all students are evaluated
for GT, including those who participated in the GT program in elementary school.9 This
selection framework allows us to model qualification across the eligibility boundary by using a
fuzzy RD methodology. Specifically, while all students who meet the requirements above
qualify, not all end up being classified as GT because parents are allowed to opt-out of the
program, or students may enroll and then withdraw.10 Further, some who do not initially meet
the requirements later become identified as GT. This is mainly because students qualify for entry
in 7th grade after not qualifying in 6th, parents appeal the recorded matrix scores by submitting an
alternative standardized test taken within the prior 12 months, data is corrected or missing data is
added later.11
8 Students can reach 16 points from the Stanford Achievement Tests through different combinations of scores on four subjects. For example a student who is in the 90th percentile in math and the 80th percentile in reading will qualify regardless of science and social studies scores. Alternatively a student could meet this requirement by scoring in the 80th percentile in all four exams. See Figure 1 for details on the score to points conversions. For the Naglieri test a score of 104 (no percentiles are given) would be equivalent to 10 matrix points. 9 Elementary students must re-qualify in 5th grade to maintain their classification in middle school. Students who qualify for GT in middle or high school generally keep their status through graduation, although they can be removed from the GT program if they perform poorly. Those who do not qualify in 5th grade have the opportunity to be re-evaluated in later years at their school’s discretion. All students are also evaluated for GT services in kindergarten, but unfortunately the matrix data was incomplete prohibiting us from evaluating the GT program in elementary schools. 10 Another reason a student may not show up in the data as GT is if his or her school does not have enough GT certified teachers to provide the required services. However, this is very rare as only 2 of the 41 traditional middle schools in LUSD had no GT students in 7th grade in 2009-10.
11 Below we show that the missing data does not appear to substantially influence our results. Additionally, results for 6th grade show a similar sized likelihood of being GT to the left of the boundary, suggesting that qualification in 7th grade rather than 6th is not an important factor.

8
Table 1 also shows means from the lottery sample in panel B. The students in the lottery
are significantly stronger academically than the average GT student in panel A, consistent with
our view that the lottery results reflect a LATE for students in the upper portion of the GT
distribution while the RD estimates reflect impacts on the “marginal” GT students. For example,
in 7th grade the lottery participants score 0.6 standard deviations higher than mean GT student.12
Lottery participants are also wealthier and whiter than the average GT student. A key element
from the lottery sample is the attrition rate. Of the 542 students that entered the lottery, 18.8%
are not in the school district by 7th grade, and in fact, most of these students leave the sample
before 6th. There is potential for attrition bias in the lottery sample, however, as lottery losers
who leave are likely different from winners who leave as evidenced by the slight differences in
achievement of winners and losers in Table 1. We will address potential attrition bias in two
ways – by reweighting the sample to look like the pre-lottery sample on observables, and through
the use of a new bounding analysis proposed by Engberg, Epple, Imbrogno, Sieg and Zimmer
(2010).13
III. Model and Specification
1. GT Program Evaluation Using Regression Discontinuity
The objective of the RD analysis is to estimate a LATE that differentiates students who
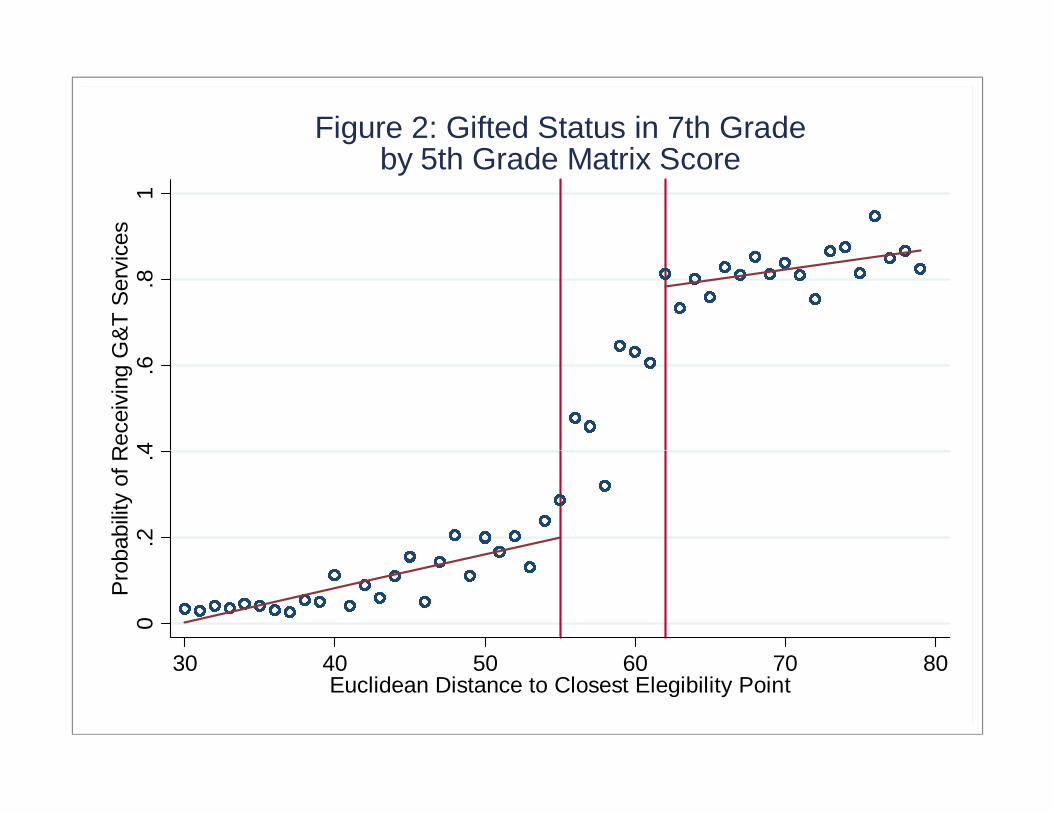
enroll in GT from students who do not, but who are otherwise equivalent. Figure 2 shows the
increase in GT identification two years after evaluation (7th grade) as a function of the students’
matrix points. The gradual increase up to 28% at the first cutoff (of students with a matrix score
12 Throughout this paper we standardize scale scores from each exam within grade and year across the district. 13 We also test for selective attrition in the RD sample but find little evidence to suggest it is a problem there.
9
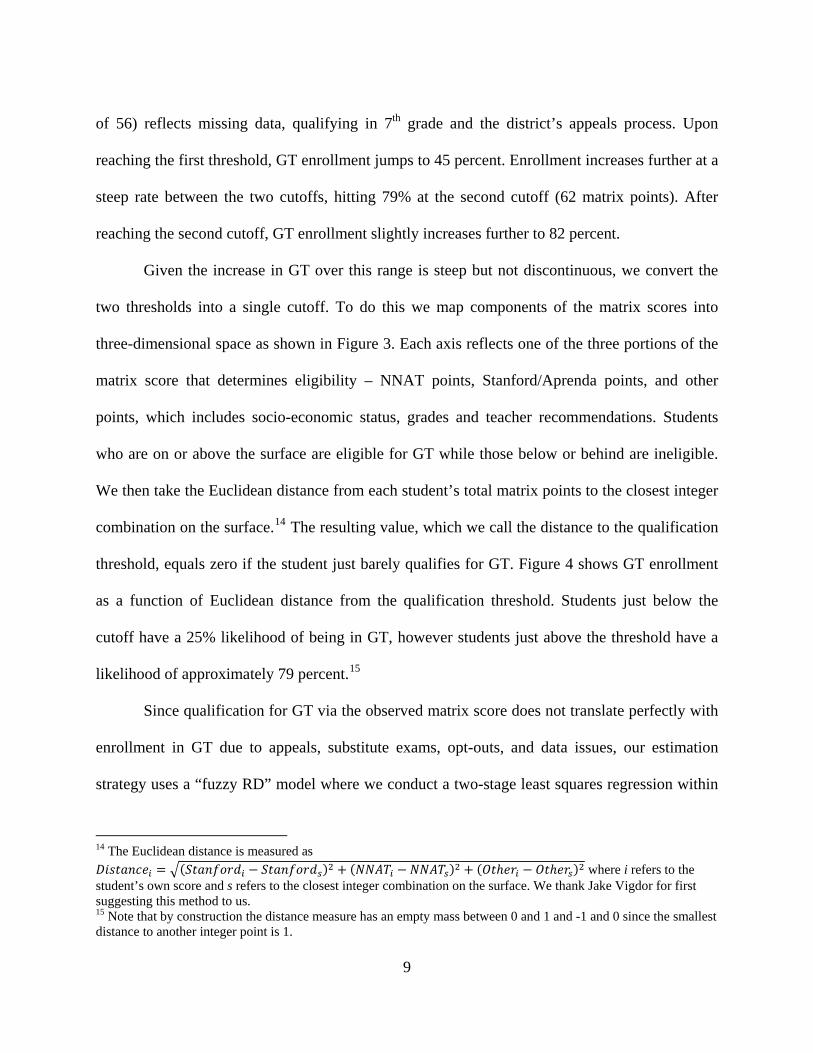
of 56) reflects missing data, qualifying in 7th grade and the district’s appeals process. Upon
reaching the first threshold, GT enrollment jumps to 45 percent. Enrollment increases further at a
steep rate between the two cutoffs, hitting 79% at the second cutoff (62 matrix points). After
reaching the second cutoff, GT enrollment slightly increases further to 82 percent.
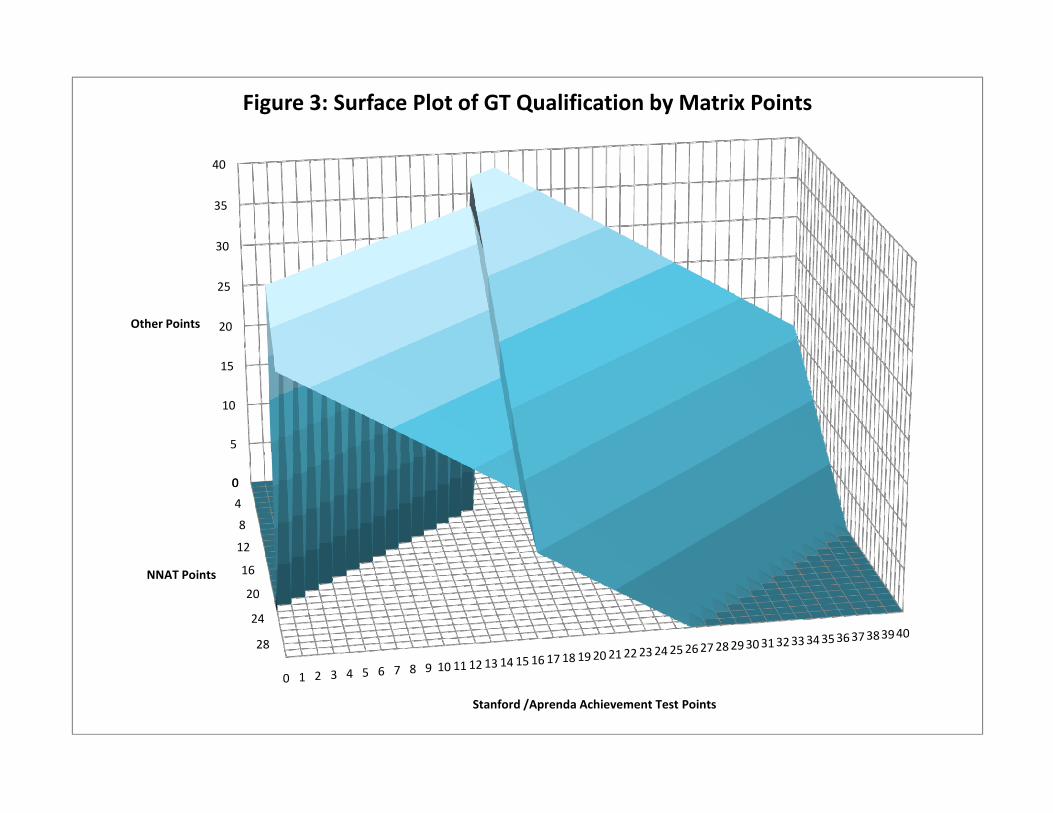
Given the increase in GT over this range is steep but not discontinuous, we convert the
two thresholds into a single cutoff. To do this we map components of the matrix scores into
three-dimensional space as shown in Figure 3. Each axis reflects one of the three portions of the
matrix score that determines eligibility – NNAT points, Stanford/Aprenda points, and other
points, which includes socio-economic status, grades and teacher recommendations. Students
who are on or above the surface are eligible for GT while those below or behind are ineligible.
We then take the Euclidean distance from each student’s total matrix points to the closest integer
combination on the surface.14 The resulting value, which we call the distance to the qualification
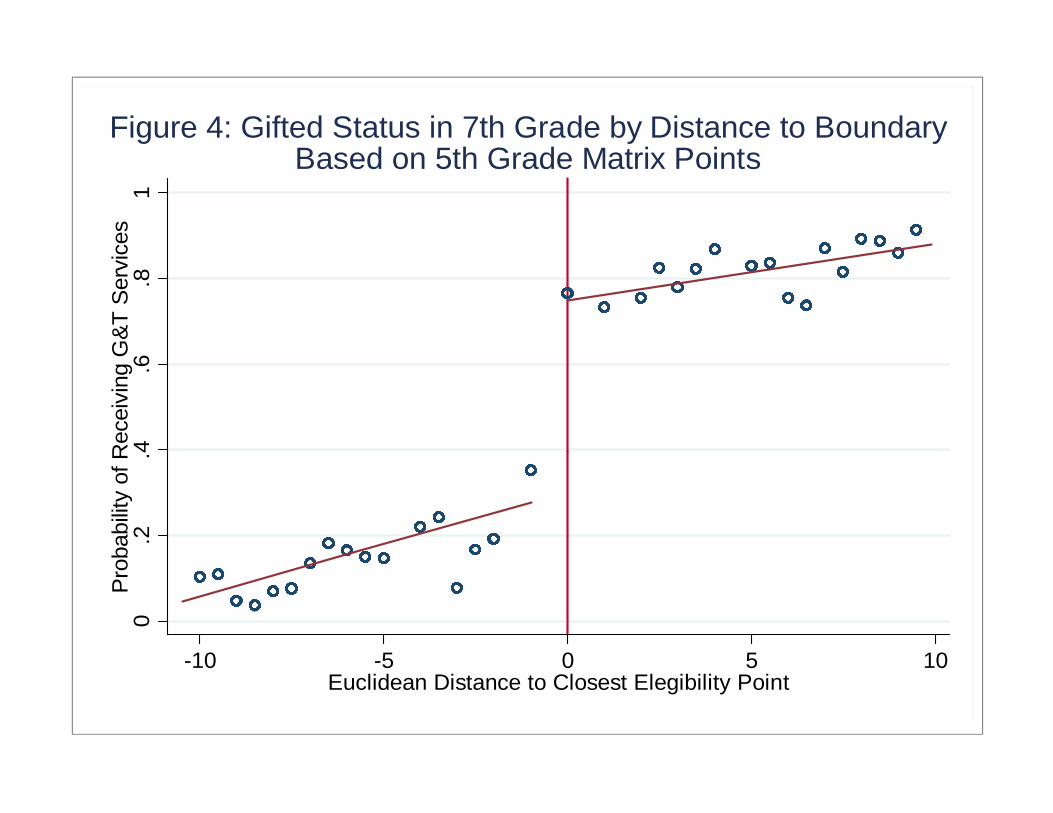
threshold, equals zero if the student just barely qualifies for GT. Figure 4 shows GT enrollment
as a function of Euclidean distance from the qualification threshold. Students just below the
cutoff have a 25% likelihood of being in GT, however students just above the threshold have a
likelihood of approximately 79 percent.15
Since qualification for GT via the observed matrix score does not translate perfectly with
enrollment in GT due to appeals, substitute exams, opt-outs, and data issues, our estimation
strategy uses a “fuzzy RD” model where we conduct a two-stage least squares regression within
14 The Euclidean distance is measured as
where i refers to the student’s own score and s refers to the closest integer combination on the surface. We thank Jake Vigdor for first suggesting this method to us. 15 Note that by construction the distance measure has an empty mass between 0 and 1 and -1 and 0 since the smallest distance to another integer point is 1.
10
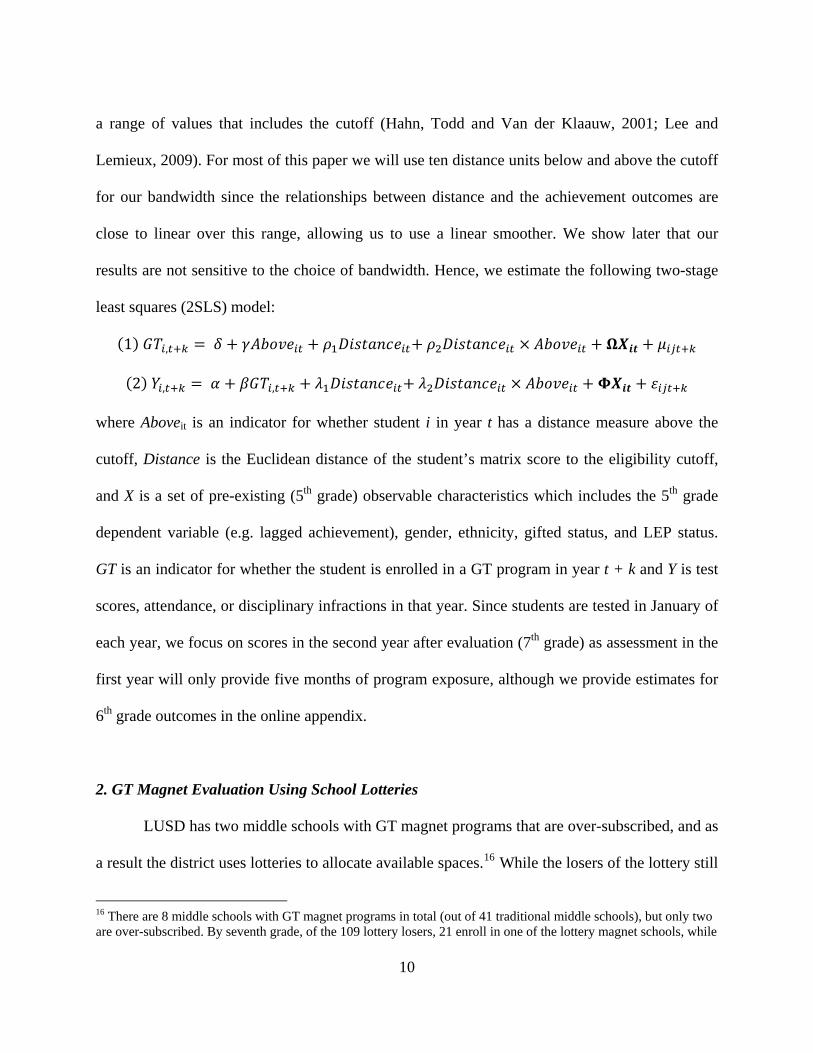
a range of values that includes the cutoff (Hahn, Todd and Van der Klaauw, 2001; Lee and
Lemieux, 2009). For most of this paper we will use ten distance units below and above the cutoff
for our bandwidth since the relationships between distance and the achievement outcomes are
close to linear over this range, allowing us to use a linear smoother. We show later that our
results are not sensitive to the choice of bandwidth. Hence, we estimate the following two-stage
leas es (2t squar SLS) model:
, 1
2 , ,
where Aboveit is an indicator for whether student i in year t has a distance measure above the
cutoff, Distance is the Euclidean distance of the student’s matrix score to the eligibility cutoff,
and X is a set of pre-existing (5th grade) observable characteristics which includes the 5th grade
dependent variable (e.g. lagged achievement), gender, ethnicity, gifted status, and LEP status.
GT is an indicator for whether the student is enrolled in a GT program in year t + k and Y is test
scores, attendance, or disciplinary infractions in that year. Since students are tested in January of
each year, we focus on scores in the second year after evaluation (7th grade) as assessment in the
first year will only provide five months of program exposure, although we provide estimates for
6th grade outcomes in the online appendix.
2. GT Magnet Evaluation Using School Lotteries
LUSD has two middle schools with GT magnet programs that are over-subscribed, and as
a result the district uses lotteries to allocate available spaces.16 While the losers of the lottery still
16 There are 8 middle schools with GT magnet programs in total (out of 41 traditional middle schools), but only two are over-subscribed. By seventh grade, of the 109 lottery losers, 21 enroll in one of the lottery magnet schools, while

11
have the opportunity to receive GT services in their neighborhood school, the two magnet
schools are considered to be premium schools because of their large proportions of GT students
and focus on advanced curricula.17
Our analysis compares the performance of students who win the lottery and attend one of
the magnet GT programs to those who lose the lottery and either attend a neighborhood GT
program in the district, a magnet school based on a different specialty, or a charter school. Hence
in the lottery sample we estimate the following 2SLS model conditional on applying for
admission to magnet program with a lottery:
3
4
where GTMagnet is an indicator for attending any GT magnet program, including those that do
not hold a lottery, Admitted is an indicator for being offered a slot at a program with a lottery, X
is a set of student level controls, and and are lottery fixed-effects.18
One important caveat to the lottery is that students who have an older sibling in the
school are exempted from the lottery and automatically given admission. Unfortunately, LUSD
was unable to provide us with data on siblings. Nonetheless it is likely that this would have, at
most, a negligible impact on our estimates. First of all, while one might be concerned that
students with older siblings differ from others in some unobservable way, the pre-selection
only 5 attend one of the other six GT magnet programs. On the other hand, of the 265 lottery winners, only 3 attend one of the other six GT magnets in 7th grade. 17 One of the two lottery schools also has an attendance zone. GT students from the attendance zone bypass the lottery, hence we drop from our sample any student zoned to that school. 18 Since we focus only on one cohort, 5th graders in 2007-08 (who are in 7th grade in 2009-10), there is a single lottery fixed-effect indicator in each regression. Models with 6th grade outcomes, and hence two cohorts of students, have three indicators. Also note that coding GTMagnet for students who attend a non-lottery GT magnet as zero instead of one has no effect on the results.
12
process for entry - all students need to qualify for GT based on their matrix points and need to
follow the same application process for entry into the magnet - mitigates the scope for this type
of selection substantially. Second, if such a selection process was occurring we would expect to
see differences in observables between students offered a slot in the magnet and those not
offered one. As we will show later our lottery sample is very well balanced between “winners,”
including those accepted under the sibling rule, and “losers.”
An additional concern is whether the presence of an older sibling generates a differential
impact on magnet students. For example, this could happen if having an older sibling in the
school provides a student with help on homework or assistance dealing with teachers. While we
cannot completely rule out such a situation, we note that many lottery losers will have older
siblings in the school they ultimately attend as well, particularly if they attend their local schools.
Hence, unless older sibling benefits differ by magnet status, this phenomenon should have little
impact on the estimates.
IV. Regression Discontinuity Estimates of GT Impacts 1. Data Our data consists of the administrative records from 2007-08 to 2009-10. While we have
data for universal assessments conducted in 2006-07, many schools were given exemptions from
the new rules that year in order to allow for an orderly transition to the new system. As such, we
start our sample in 2007-08, the second year of the mandatory GT assessment, and examine
outcomes through the 2009-10 school year. For outcomes we use scale scores standardized
across LUSD within grade and year on the Stanford Achievement Test, as well as attendance
rates and counts of disciplinary infractions warranting an in-school suspension or more severe

13
punishment. The test results are in standard deviation units for math, reading, language, science
and social studies exams.19 After restricting the sample to a 20 unit band around the cutoff, we
look at achievement of approximately 2,600 students in one 7th grade cohort and 5,500 students
in two 6th grade cohorts who were evaluated for GT in 5th grade.20
2. Tests of Validity of RD Design
A primary concern with any regression-discontinuity analysis is that there is a potential
for manipulation of the forcing variable (qualification for GT) that determines treatment. Such
manipulation could bias the results if it is correlated with outcomes (Lee and Lemieux, 2009). In
Online Appendix Figure 1, we provide density plots around the discontinuity. Differences in
density around the discontinuity are similar in size to changes at other parts of the distribution,
suggesting that manipulation is unlikely to be occurring.21
In Table 2 we provide tests of discontinuities in pre-existing (5th grade) student
characteristics.22 We find no discontinuities in race, gender, LEP status, prior gifted status,
special education status, eligibility for free or reduced-price lunch, disciplinary infractions,
19 While some LEP students are evaluated using the Aprenda exam, a Spanish-language alternative to the Stanford Achievement Tests, only 0.5% of 5th grade students in LUSD take only the Aprenda exam and hence have no Stanford scores. Thus, we drop students who only have Aprenda scores. 20 Within this bandwidth the total matrix scores have an inter-quartile range of 48 to 65 with a minimum of 39 and a maximum of 79. 21 Ideally one would like to conduct McCrary’s (2008) test. Since there are no observations between 1 and 0 or -1 and 0 (see note 16) and there is positive mass between integers further out, this could mistakenly generate a positive result. Hence, instead we test for discontinuities at the two cutoffs in the total matrix points to check for manipulation. In both cases the test is statistically insignificant. 22 A related concern is that laid out by Barreca, Guldi, Lindo and Waddell (2010) that heaping in running variables could lead to biased estimates if the heaps are correlated with unobservables and the bandwidths are small enough so that heaps are concentrated only on one side of the cutoff. We do not find any evidence of heaping in the matrix scores. Nonetheless, by construction some heaping will occur in the transformation from matrix scores to Euclidean distances. This is not a problem in our context, however, as our bandwidths are wide enough to include substantial observations both at heaping and non-heaping points on both sides of the cutoff. We will also show later that our results are quite robust to choice of bandwidth.
14
attendance rates, and achievement with the exception of math.23 Given that math is the only
covariate that is significant we believe this to be a spurious result. Nonetheless, since
achievement is highly correlated over time we correct for this by providing results both with and
without controls that include the lagged (5th grade) dependent variable.
In column (15) we test whether there is any difference in whether a component of the
matrix is missing and find no supporting evidence. This suggests that the fact that some students
are missing data is unlikely to affect our estimates. The next two columns address teacher
evaluations.24 The concern is that if teachers know that a student is short of the qualification
threshold they may provide a large enough score for certain types of students to overcome it. If
this were the case we would expect to find a discontinuity in the teacher scores or the points in
the matrix the student gets from his or her teacher. We find no statistically significant
discontinuity in either measure of teacher recommendation. Nonetheless, concerns may still
remain about teacher manipulation. Hence, later we provide an additional specification test to
check for bias from teacher manipulation through their recommendations.
Finally, in columns (18) though (20) we test whether there is a discontinuous likelihood
of being enrolled two years after evaluation. Given that Davis, et al. (2010) find evidence that
high income students are more likely to stay in public schools if identified as GT, we check if
such a phenomenon occurs in LUSD. We find no statistically significant change in the likelihood
of enrollment at the discontinuity regardless of the student’s economic status. Hence, given these
23 Online Appendix Figures 2 – 4 provide graphical representations of these results. Tests that do not condition on appearing in the data in 7th grade are similar and are provided in Online Appendix Table 1, along with tests using the 6th grade sample. These are also similar for all measures except for females which shows a small but statistically significant increase. In Online Appendix Table 2 we provide estimates without clustering of standard errors. These show no change in the significance levels of the estimates. 24 Although teacher recommendations are due before achievement scores are calculated, district officials informed us that many teachers submit their recommendations late.

15
results and those described above we see little evidence that GT qualifications were manipulated
in a way that would violate the assumptions underlying the RD methodology.
3. Results
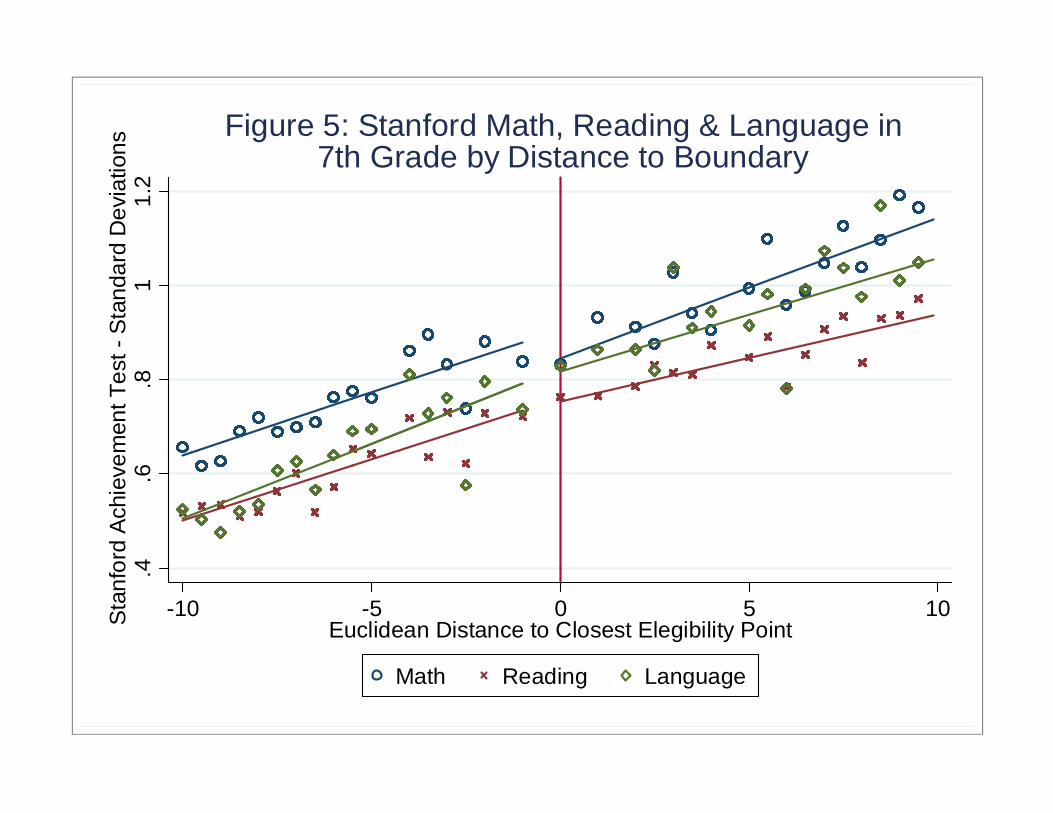
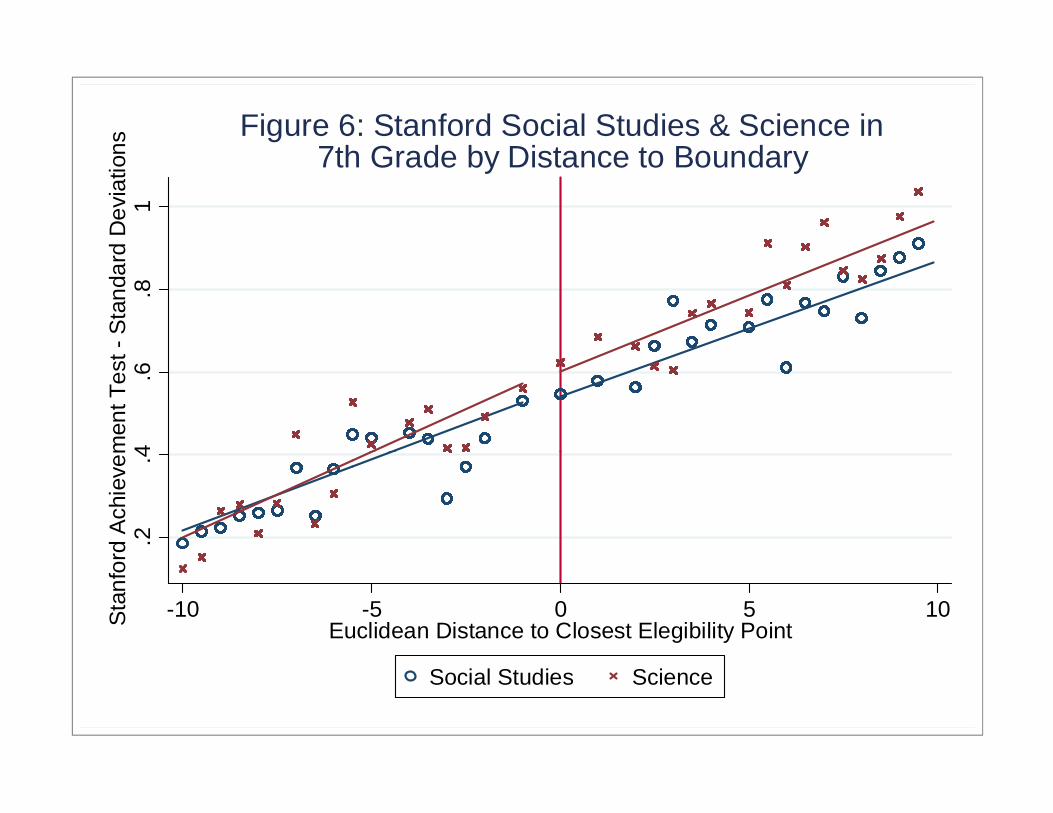
Figure 5 presents the initial reduced-form results for three of the five achievement tests,
and Figure 6 for the other two. These achievement test results are from 7th grade, and thus
encompass about a year and a half of GT program exposure. Our analysis compares students of
up to ten distance units above the GT qualification boundary with students who are no more than
ten units below.25 The coefficient estimates presented in the first panel of Table 3 as well as the
means provided in Figure 5 show that there is no improvement in reading or language Stanford
scores after a year and a half of GT participation, and that there is a negative and significant
point estimate for math. Figure 6 confirms the findings in columns (4) and (5) of Table 3 of no
discernable impacts on achievement in social studies or science.
Panel B of Table 3 provides estimates from our preferred specification of equation (2)
that contains student level controls measured during 5th grade including the lagged dependent
variable, race, gender, economic disadvantage, LEP status, and gifted status. In this panel, all of
2SLS estimates are close to zero while math, reading and social science are negative and all t-
statistics are below one. Drawing 95% confidence intervals around the estimates, we can rule out
modest positive impacts of GT on marginal students of 0.06 standard deviations (sd) in math,
25 Online Appendix Figure 5 shows that our Euclidean distance measure correlates very well with total matrix points in a linear fashion.

16
0.09 sd in reading, 0.15 sd in language, 0.13 sd in social studies and 0.23 sd in science. The point
estimates themselves, however, clearly suggest a zero effect.26
In columns (6) and (7) we examine impacts on non-cognitive outputs, disciplinary
infractions and attendance rates. While there is no effect on disciplinary infractions, we do find a
marginally significant negative effect on attendance rates. The drop in attendance rates of 1.1
percentage points is equivalent to attending school two fewer days in a 180 day school year. As
we will demonstrate below, however, this estimate is sensitive to specification.
Panel C presents results that correct for the possibility of teacher manipulation. Even
though our earlier tests did not suggest it to be a substantial problem, we are especially
concerned because an administrator acknowledged that time deadlines are lax for
recommendations leaving opportunities for teachers to “top up” the scores of marginal GT
students to put them over the threshold. We address this possibility by replacing a student’s
matrix points with a synthetic matrix score if the points from a teacher recommendation are
potentially pivotal. That is, for students whose other matrix components place them within 10
points of the cutoff, the teacher recommendation, with a maximum of 10 points, is potentially
determinative.27 Thus for these students we replace their total matrix score with the predicted
value from a regression using the full 5th grade sample of total matrix points on all matrix
components excluding teacher points:
26 Online Appendix Table 3 provides results for 6th grade. These are similar to those for 7th grade and are more precise due to the addition of an extra year of data. For social studies we can rule out effects of 0.15 sd while for other tests we can rule out impacts of 0.09 sd and higher. Appendix Table 4 provides results with the lagged dependent variable but without the other covariates. These are similar to the results in Panel B of Table 3. Finally Appendix Table 5 shows the results to be robust to the inclusion of middle school fixed-effects. 27While teacher recommendations would not be pivotal for students within 10 points above the cutoff, only adjusting scores on one side of the cutoff could introduce bias, particularly if teachers only have information on some of the components at the time they make their recommendations. Hence, we replace scores within 10 points above the cutoff with the synthetic scores as well.
17
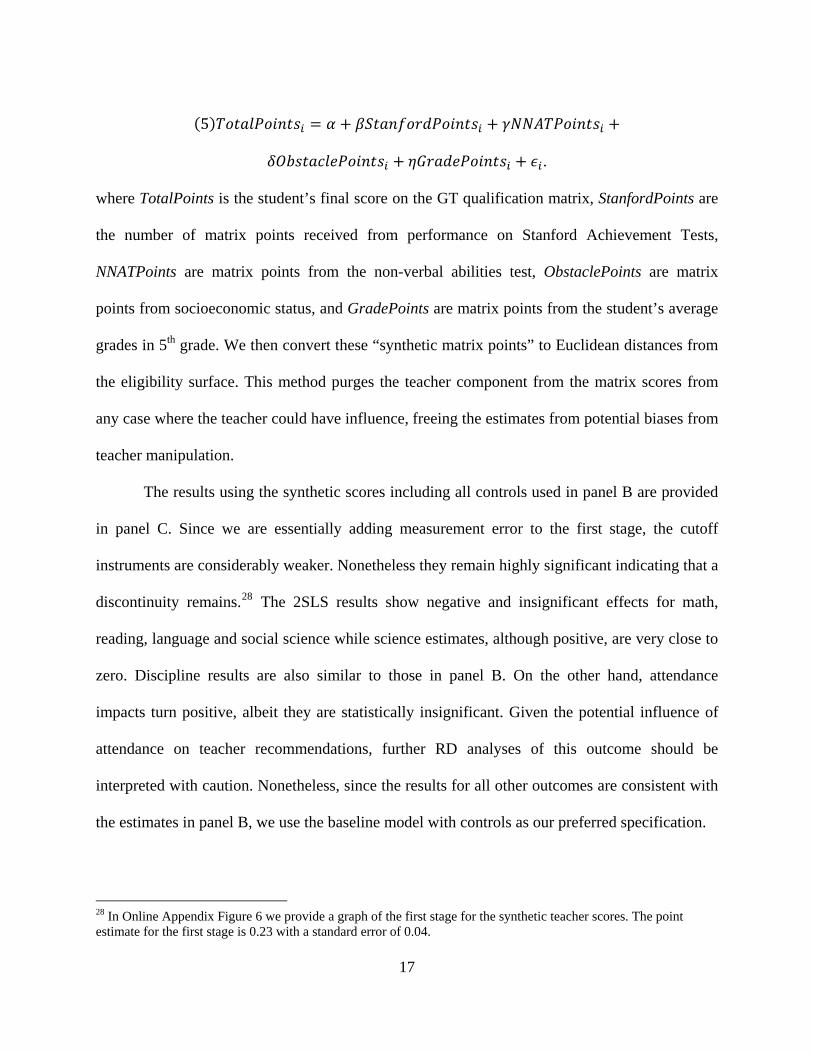
5
.
where TotalPoints is the student’s final score on the GT qualification matrix, StanfordPoints are
the number of matrix points received from performance on Stanford Achievement Tests,
NNATPoints are matrix points from the non-verbal abilities test, ObstaclePoints are matrix
points from socioeconomic status, and GradePoints are matrix points from the student’s average
grades in 5th grade. We then convert these “synthetic matrix points” to Euclidean distances from
the eligibility surface. This method purges the teacher component from the matrix scores from
any case where the teacher could have influence, freeing the estimates from potential biases from
teacher manipulation.
The results using the synthetic scores including all controls used in panel B are provided
in panel C. Since we are essentially adding measurement error to the first stage, the cutoff
instruments are considerably weaker. Nonetheless they remain highly significant indicating that a
discontinuity remains.28 The 2SLS results show negative and insignificant effects for math,
reading, language and social science while science estimates, although positive, are very close to
zero. Discipline results are also similar to those in panel B. On the other hand, attendance
impacts turn positive, albeit they are statistically insignificant. Given the potential influence of
attendance on teacher recommendations, further RD analyses of this outcome should be
interpreted with caution. Nonetheless, since the results for all other outcomes are consistent with
the estimates in panel B, we use the baseline model with controls as our preferred specification.
28 In Online Appendix Figure 6 we provide a graph of the first stage for the synthetic teacher scores. The point estimate for the first stage is 0.23 with a standard error of 0.04.
18
To test for heterogeneity in program impacts across student characteristics, Table 4
provides 2SLS estimates for 7th grade for various student populations. In general, we find little
evidence of differences by gender, demographics, or economic status. The only distinction is that
the attendance estimates are more negative for women and black students, but we are cautious in
drawing interpretations from this given the results in panel C of Table 3.
In Table 5 we test the sensitivity to our RD estimates to model specification using our
preferred model with controls. We find that our estimates hold regardless of whether we add
middle school fixed-effects, limit the data to observations with no missing matrix components,
use smaller or wider bandwidths, or conduct local linear regressions with optimal bandwidths
determined by leave-one-out cross validation. However, when we use a quadratic smoother as
the functional form, the estimates show significant improvements in language and science
achievement scores. These results become insignificant using a cubic smoother due to larger
standard errors. Further inspection, however, suggests that this estimate is being driven by
excessive curvature at the discontinuity. Online Appendix Figures 7 and 8 show that the
quadratic estimates are mainly driven by random variation at the discontinuity and hence tend to
overestimate what appears to be the true impact. As such, we believe a linear smoother captures
the correct estimates.
A further concern is that the lack of positive effects may be due to top-coding of the
exams. Since GT students are high-achievers many of them may not be able to exhibit growth on
achievement tests as they are very close to answering every question correctly. To address this,
in Online Appendix Figures 9 – 13 we provide distribution plots of raw scores on each of the 7th
grade Stanford Achievement Tests for students with Euclidean distances between -10 and 10. In
19
all cases the mass of the distribution is centered far from the maximum score. For example in
math the modal score is 62 out of 80 while it is 67 out of 84 for reading leaving substantial room
for improvement.
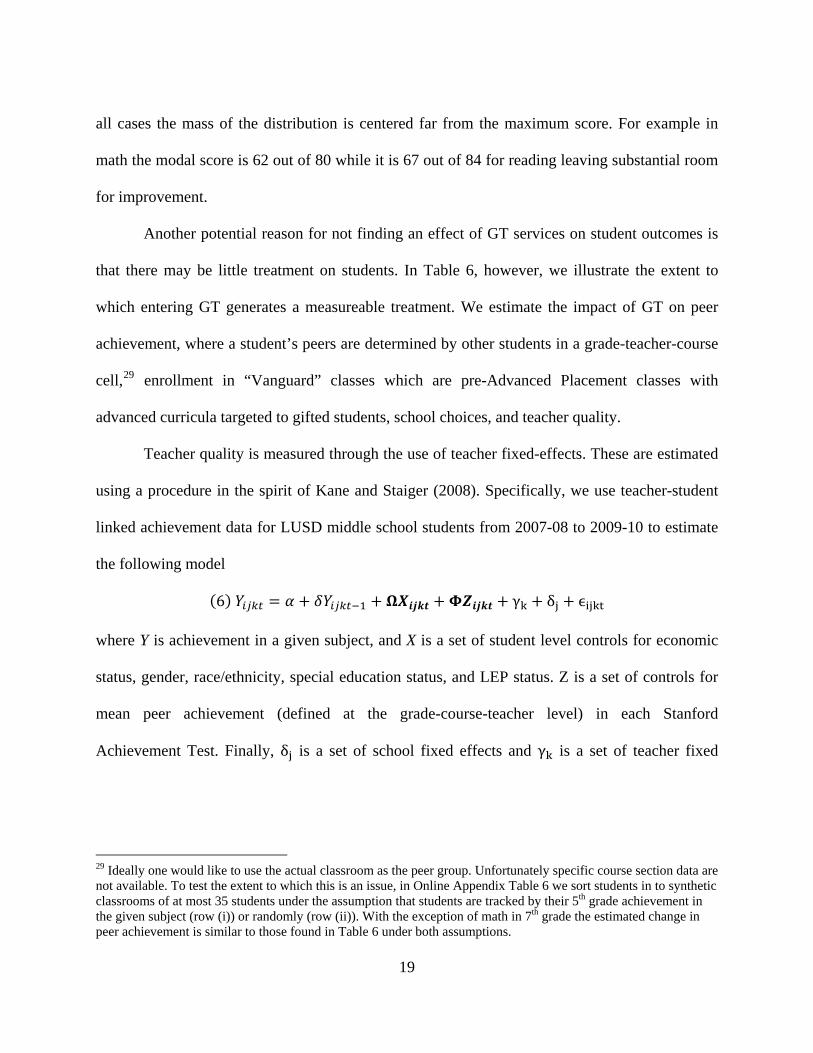
Another potential reason for not finding an effect of GT services on student outcomes is
that there may be little treatment on students. In Table 6, however, we illustrate the extent to
which entering GT generates a measureable treatment. We estimate the impact of GT on peer
achievement, where a student’s peers are determined by other students in a grade-teacher-course
cell,29 enrollment in “Vanguard” classes which are pre-Advanced Placement classes with
advanced curricula targeted to gifted students, school choices, and teacher quality.
Teacher quality is measured through the use of teacher fixed-effects. These are estimated
using a procedure in the spirit of Kane and Staiger (2008). Specifically, we use teacher-student
linked achievement data for LUSD middle school students from 2007-08 to 2009-10 to estimate
the following model
6 γ δ
where Y is achievement in a given subject, and X is a set of student level controls for economic
status, gender, race/ethnicity, special education status, and LEP status. Z is a set of controls for
mean peer achievement (defined at the grade-course-teacher level) in each Stanford
Achievement Test. Finally, δ is a set of school fixed effects and γ is a set of teacher fixed
29 Ideally one would like to use the actual classroom as the peer group. Unfortunately specific course section data are not available. To test the extent to which this is an issue, in Online Appendix Table 6 we sort students in to synthetic classrooms of at most 35 students under the assumption that students are tracked by their 5th grade achievement in the given subject (row (i)) or randomly (row (ii)). With the exception of math in 7th grade the estimated change in peer achievement is similar to those found in Table 6 under both assumptions.
20
effects.30 Kain and Staiger (2008) show that a similar framework closely replicates the results
from a randomized allocation of students to teachers.31
Table 6 shows in columns (1) to (5) that peer achievement is between 0.24 and 0.35
standard deviations higher for GT students relative to non-GT students.32 The table also shows
that GT students are more likely to enroll in Vanguard classes and attend a GT magnet program.
Interestingly, most of the school switching does not appear to come from students leaving their
zoned school for GT magnets. Rather, students appear to move from schools other than their
zoned school – mostly non-GT magnets – to the GT magnets. Finally, and perhaps surprisingly,
GT students do not appear to get assigned better teachers as measured by teacher fixed effects.
This may be due to the fact that in many schools both GT and non-GT students can access
advanced classes taught by the same teacher. Nonetheless, the change in peers and the increase
in enrollment in advanced classes suggest that the lack of achievement improvements arises in
spite of what is generally viewed to be positive treatments. We also note that results for 6th grade
are stronger as they show peer differences of 0.37 to 0.46 standard deviations as well as larger
differences in Vanguard class enrollment. These are provided in Online Appendix Table 8.
30 We estimate this model such that each observation is assigned a weight equal to the teacher’s share of classes taught to a student in a given subject. For example if a student takes a class in US history and another class in geography, then the student will have two observations in the social studies regression, one for each class, where he would be given a weight of ½ for each observation. Additionally, since the Stanford exams are given in January, we assign to each student the teachers they had in the spring of the previous academic year and the fall of the current academic year. 31 Our model diverges from Kain and Staiger (2008) in two key ways. First, they use a random effects rather than fixed effects framework. We prefer the latter as it allows for weaker identification assumptions. Second, they utilize a Bayesian smoother that adjusts estimates for teachers with few observations towards the mean. While this strategy is important when trying to identify the influence of teachers on students, it is inappropriate in our context where we are trying to see if GT students receive higher quality teachers as teachers with fewer observations will tend to be younger and less experienced and hence pushing their estimates to the mean would give us biased measures of actual teacher quality. 32 Reduced form and first stage results are provided in Online Appendix Table 7.
21
Below we investigate potential explanations for these findings, but first we turn to our analysis of
GT magnet lotteries.
IV. Estimates of the Impact of Attending a GT Magnet Using Randomized Lotteries
One reason the RD analysis does not show positive impacts from GT services on student
outcomes may be that the qualification boundary is set low enough so that students who
marginally qualify for GT services are not be able to take advantage of the purported benefits,
and thus show no differences with respect to the marginal students not using GT services.
Because the RD analysis is a LATE, it is not possible to examine GT effectiveness on other parts
of the student quality distribution. Hence, in this section we present results using lotteries for the
two GT magnet middle schools. Because the lottery is random, the comparison is across the
entire distribution of those who apply. While these students are higher achieving than marginal
GT students on average, they also cover a wide range of achievement. The disadvantage,
however, is that the lottery losers have a range of alternative experiences, so the comparison
treatment is not as clear as for the RD. Additionally, in this analysis we are asking a different
question. While in the RD we examine the impact of being in GT or not, in the lottery analysis
we identify the impact of gaining a more intense treatment conditional on being classified as GT
and applying for the treatment.
1. Data Our lottery sample is derived from the set of 5th grade students determined to be eligible
for GT in 2007-08 who apply for admission to one of the two middle schools with an over-
22
subscribed GT magnet program.33 We restrict our analysis to students who are observed to be
enrolled in LUSD in 5th grade as these are the only students for whom we have pre-lottery
characteristics. Also, this restriction reduces the likelihood of endogenous attrition as students
who enter the lottery from outside LUSD would be more likely to leave if they lose the lottery,
as many have previously attended private or charter schools. In addition, one of the two schools
has a regular program for students in the attendance zone.34 Since students zoned to the school
do not participate in the lottery, we drop them from the sample as well.
While admission for non-zoned students is determined by a lottery, our data does not
directly provide the lottery numbers or outcomes. Instead we can identify whether a student is
offered admission or put on a wait list. We can further identify whether a student is offered a
spot off of the wait list which are allocated based on the student’s lottery number. Students with
an older sibling in the school are exempt from the lottery, but as discussed above we believe the
impact of this on our results is negligible. In total the sample includes 542 students who
participate in a lottery. Of these 394 are offered admission and 148 are not. By 7th grade 440
students including 331 winners (84%) and 109 losers (74%) remain in LUSD. The treatment
received by the lottery losers varies, as they can attend GT classes in their neighborhood school,
a charter, or in a non-GT magnet school that is open to all students. Since there is some non-
33 The application process involves a single form where students may apply to up to three of the eight magnet schools. Students also list which is their 1st, 2nd and 3rd choice schools. Unfortunately our data only informs us of whether a person is offered a spot or wait listed and does not have direct information on applications. Hence if a student is offered a spot at his or her first choice school we do not know if they applied for the other school. Nonetheless, we find no cases where a student is placed on the wait list for one of the lottery schools and offered a spot or waitlisted at the second while there are multiple instances whereby students are waitlisted at a lottery school and offered a slot at a non-lottery magnet. Hence, it appears that applying to both lottery magnets was very rare behavior in our data. 34 The second school does not have zoned students, although it does include a program for students with severe physical disabilities such as blindness and deafness. Students who are enrolled in this alternative program are not included in our lottery sample.
23
compliance with the lotteries we employ a 2SLS strategy that instruments GT magnet attendance
with lottery outcomes.35
2. Tests of Validity of Lottery Design Table 7 presents the balancing tests for the lottery sample. The results strongly suggest
that the lotteries for both magnet middle schools are conducted in a random way, as the ex-ante
baseline (5th grade) sample has no significant coefficient on any of the twenty covariates we
test.36 When we look at the ex-post estimation (7th grade) sample, we again find no significant
differences between winners and losers except for math which is significantly higher for winners
at the 10% level. Although having one significant result out of twenty regressions can be
spurious, it is nonetheless possible that this is due to differential attrition between lottery winners
and losers. Indeed, when we estimate the impact of winning a lottery on attrition by 7th grade we
find that lottery winners are 11 percentage points less likely to attrit (standard error of 0.04).
We thus use these results to inform our specification and analysis in three ways. First, as
with the RD analysis, we present our results both with and without controls for lagged student
scores as well as demographic characteristics. Second, we use a weighting procedure in the
regressions that mimics the original lottery sample in order to correct for potential attrition bias.
To do this we reweight the sample by the inverse of the predicted probabilities from a probit of
attrition on 5th grade student characteristics.37 Third, we estimate bounds on the impact of GT
35 By 7th grade 67% of lottery winners attend a magnet with a lottery while 17% attend another school and 16% leave the district. For lottery losers, 18% attend a lottery campus in 7th grade while 56% attend a different school and 26% leave the district. 36 Results for the 6th grade sample are similar as are results where standard errors are not clustered. These are provided in Online Appendix Tables 9 and 10. 37 Results of the probit regression are provided in Online Appendix Table 11.
24
using a procedure proposed by Engberg, et. al. (2010). The procedure uses observable
characteristics to estimate the proportion of the sample that includes students of various types
including those who are at risk of leaving LUSD if they lose the lottery. Then, through a
generalized method of moments (GMM) estimator, upper and lower bounds are generated. The
upper bound assumes students at risk of leaving due to losing the lottery have achievement equal
to the mean of students who stay and comply with the lottery results, while the lower bound
assumes these same students score at the 95th percentile of the outcome distribution for all
staying participants.38
3. Results for GT Magnet Programs
Two-stage least squares estimates of the impact on student achievement from attending
one of the two magnet GT programs are shown in Table 8. Reduced-form estimates are provided
in Online Appendix Table 12.39 We provide both unweighted (rows 1 and 2) and inverse
probability weighted (rows 3 and 4) estimates where the latter corrects for possible attrition bias.
In rows (5) and (6) we provide upper and lower bounds that account for potential attrition bias
using the Engberg, et al. (2010) methodology.
The results in Table 8 using our preferred specification of weighting with controls (row
4) suggest that, with the exception of science, which shows a 0.28 sd improvement, there is little
impact of attending a GT magnet on achievement or attendance.40 Due to the small sample sizes
38 That is, the upper bound assumes students at risk of leaving have only average scores, while the lower bound assumes they are in the upper tail. These assumptions are those suggested by Engberg, et al. (2010). 39 The first stage is always significant at the 1% level with point estimates of 0.57 (standard error of 0.06) for unweighted and 0.47 (0.11) for weighted regressions. Detailed first-stage results are available upon request. 40 Note that teacher manipulation is not a concern in this identification strategy, hence we can use the attendance results with confidence. Additionally, we do not provide discipline results as only 4% of students in the lottery sample have any disciplinary infractions in 7th grade.
25
the estimates are somewhat imprecise, particularly using the inverse-probability weighted model.
Even so, we note that when one looks at row (4) the point estimates for math, reading and social
studies are negative and the estimate for language is effectively zero.41 Hence, we believe these
estimates provide strong evidence of a lack of positive impact of attending a magnet on
achievement other than in science.42 The bounding analysis in rows (5) and (6) confirm the
results in row (4).43 Once again we see little to suggest that there is any substantial positive
impact on math, reading, language and social studies. For science, the lower bound does drop to
zero which suggests that the positive result there may be due to attrition bias, but it nonetheless
confirms that there is at least no negative impact on science scores.44
In Table 9 we investigate to what extent there is an observable difference in treatment
from attending a GT magnet. In particular, we focus on differences in peer achievement and
teacher quality as measured by the teacher-fixed effects methodology described in Section 4.3
which are substantial. 45 Using the weighted estimates, students who attend magnets gain peers,
measured at the grade-course-teacher level, who score on average between 0.7 and 1.2 standard
41 Results for 6th grade, provided in Online Appendix Table 13, show somewhat larger, albeit still insignificant in the preferred model, impacts for math and language and no impact for science. They also show a significant negative impact on attendance of -0.6 percentage points (roughly one fewer day per year). 42 Top-coding of exams is a potentially even larger concern here than in the RD since the achievement levels of the lottery sample are higher. In Online Appendix Figures 14 - 18 we provide distribution plots of raw scores on 7th grade exams by lottery winners and losers. Although the mass of achievement is further to the right than in the RD sample, there nonetheless appears to be substantial room for achievement to improve for most students. Hence we do not believe that top-coding explains our lack of positive effects. 43 We do not provide bounding analyses for attendance as it performs poorly when the mean outcome is centered near a top-code as it tends to estimate outcomes to be above the top-code, which is the case in this sample since mean 5th grade attendance rates are 98.0 with a maximum of 100. 44 Online Appendix Table 14 shows lottery results when we use attending a lottery magnet specifically as treatment (e.g. place non-lottery magnets in same category as neighborhood GT) and when we identify students who are taken off the wait list as losing the lottery. In both cases the results are similar to baseline except that science impacts become statistically insignificant. 45 Estimates without controls and estimates for 6th grade are provided in Online Appendix Table 16 and are similar to those shown in Table 9.
26
deviations higher than peers for the lottery losers.46 Additionally, teachers are of higher quality.
A student who attends a GT magnet gains math teachers who add an average of 0.09 sd to
student achievement and English and Social Studies teachers who add 0.03 and 0.04 sd to
achievement, respectively.47 Finally, in Online Appendix Table 17 we investigate whether there
is any variation in the estimates by student types. Due to the small sample we are limited in how
finely we can cut the data, but nonetheless we find no discernable patterns across subpopulations.
Hence it is clear that GT magnet students gain large improvements in their educational
environment yet provide little evidence of improvement in achievement except in science. In the
next section we discuss some potential explanations for the lack of positive impacts in both the
RD and lottery analyses despite the apparent improvements.
V. Discussion
Given that we have established that GT students experience substantial treatments
including better peers, more advanced courses (in the RD analysis), and higher quality teachers
(in the lottery analysis), it is perplexing that we find little evidence of positive impacts on
achievement. One possibility is that our achievement measure is not well suited to discerning
improvements in gifted students. This would be particularly worrisome if we were to use a state
accountability exam targeted towards low achieving students, but less of an issue with Stanford
Achievement Test. Indeed, we have already shown that there is little evidence of bunching near
46 In Online Appendix Table 15 we provide results under assumptions of student sorting into sections by ability or randomly as was done in Appendix Table 6 for the RD analysis. The results generally show similar levels of peer improvement where the difference does not fall below 0.5 standard deviations in any case. 47 As in the RD analysis, we also look at differences in course level. While there are no significant differences in 7th grade in the likelihood of enrolling in Vanguard courses, in 6th grade students who attend magnets are approximately 10 percentage points more likely to take vanguard courses in math, English and social studies while they are 9 percentage points more likely to take Vanguard in science.
27
the maximum score (top-coding) in either the RD or lottery samples. Nonetheless, it is possible
that the additional course material taught in GT classes may not be well aligned with topics
covered in the achievement test.48 While we cannot rule out this possibility, we note that the
improvement in peers would be expected to generate higher achievement even if the curriculum
is not well targeted to the exam.
Another potential explanation is marginal students may suffer due to difficulty with more
advanced material. In this view, the eligibility cut-off may be set at an inappropriate level as it
leads the district to classify students who are unable to deal with the advanced GT material.
While this explanation could be relevant for the RD results, we demonstrate that the lottery
sample includes higher achieving students for whom the advanced material would be more
suitable. We therefore end up with a puzzle whereby we have a lack of impact from a very large
change in peer achievement and other inputs that are generally thought to improve achievement.
Given the strength with which peer effects have been found to operate in several different
contexts, one would expect that we would find achievement improvements simply from the peer
effects alone (Angrist and Lang, 2004; Duflo, Dupas and Kremer, 2010; Hoxby and Weingarth,
2006; Imberman, Kugler and Sacerdote, 2009; Lavy, Paserman and Schlosser, 2008; Lavy and
Schlosser, 2007). Nonetheless, one possible reason for finding no impact of the differential GT
resources is that the peer effect, in addition to the potential benefits found in the literature cited
above, also has a potential cost as entering GT may reduce a student’s relative ranking within the
class. This could generate negative impacts through an invidious comparison model of peer
48 Ideally, one would like to test some outcomes that might better align with the GT curriculum such as college-going, SAT scores, and AP/IB exam scores. Unfortunately, since the matrix and lottery data are only available for the last few years, not enough time has elapsed to investigate these outcomes.

28
effects where one’s own performance falls with a reduction in one’s position in the within-
classroom achievement distribution (Hoxby and Weingarth, 2006).
There is substantial evidence from the educational psychology and sociology literature,
moreover, that students who are placed in higher achieving ability groups can be psychologically
harmed. A measure that is commonly used in this literature is the idea of a student’s “self
concept,” how a student perceives his or her own abilities relative to an objective metric such as
achievement. Marsh, Chessor, Craven and Roche (1995) compare GT students to observably
similar students in mixed GT and non-GT classes and find that GT students show declines in
their math and reading self concept. Additionally, Zeidner and Schleyer (1999) find lower self
concept and more test anxiety in gifted students in ability segregated classrooms. Similar results
are also found by Preckel, Gotz and Frenzel (2010) and Ireson, Haliam and Plewis (2010).
Since we do not have direct evidence on student confidence, we make use of student
course grades to test whether the necessary conditions are met for an invidious comparison
model to be valid. It is uncertain to what extent course grades reflect absolute levels of
achievement compared to achievement relative to other students. Nonetheless, course grades are
used by students to assess their own performance, and thus may provide some information as to
how students perceive their own relative rank. Additionally, although it is difficult to establish
causality, there is nonetheless a link between grades and students’ self-concept (Marsh,
Trautweing, Ludtke, Koller and Baumert, 2005), satisfaction (Howard and Maxwell, 1980), and
self-worth/self-esteem (Crocker, Karpinski, Quinn and Chase, 2003; Owens, 1994). In Panel I of
Table 10 we provide estimates of the impact of GT enrollment on course grades in the RD model
and of attending a GT magnet on grades in the lottery analysis. In both cases there are clear
29
reductions in grades. For the RD sample grades fall by a statistically significant 4 points out of
100 (3 points changes a grade from a B+ to a B, for example) in math and by 2 to 3 points in
other subjects, although these estimates are not statistically significant for 7th grade.49 For the
lottery analysis the grade reductions are even more dramatic with drops of 7 points in math, 8 in
science, and 4 in social studies using the inverse-probability weighted regressions.
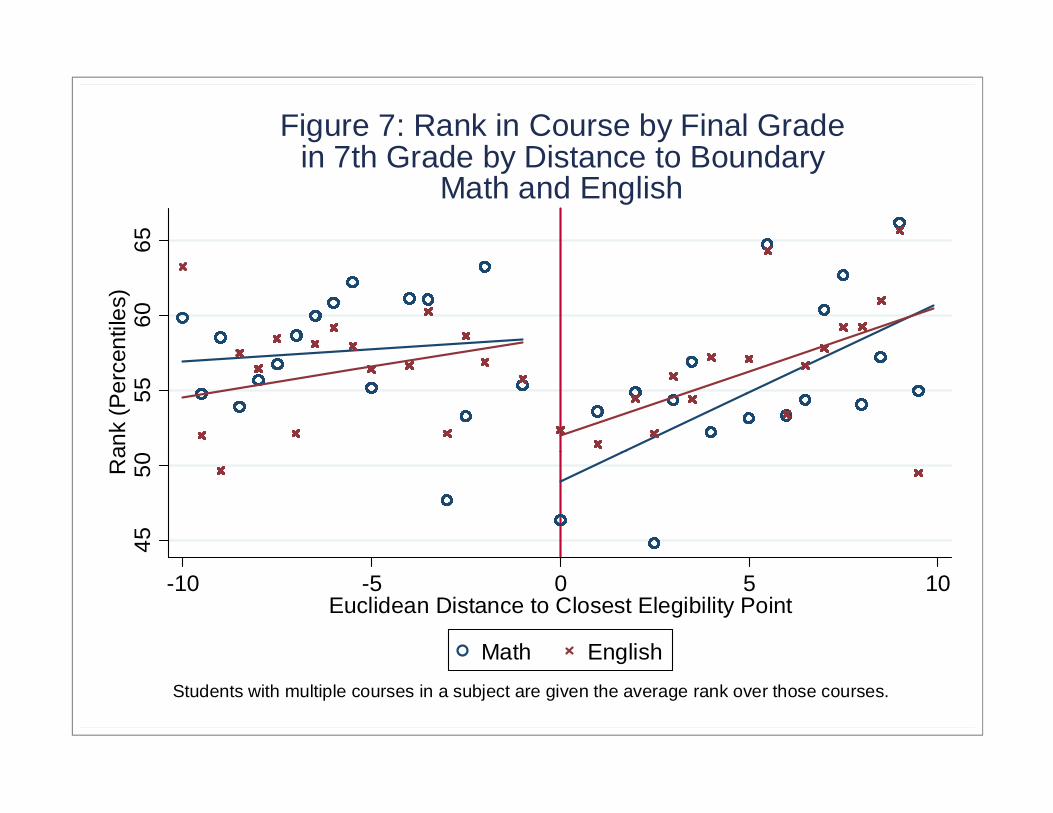
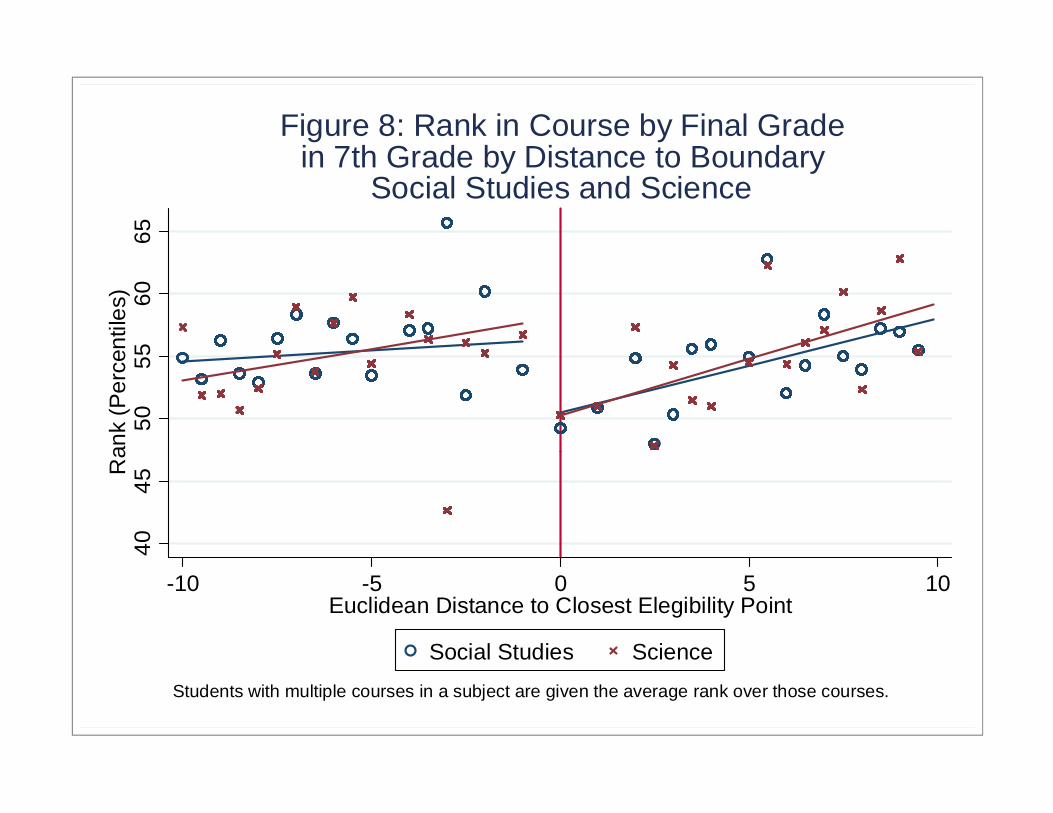
In addition to the raw grades it is useful to consider how students’ rankings within their
peer groups differ by treatment status, as this provides a direct measure of how a student
perceives his or her position in the achievement distribution. We assume that students mostly
compare themselves to their school-mates who take the same courses. Thus, we rank students
within each school-grade-course cell by their final course grades and convert these rankings to
percentiles. Figures 7 and 8 demonstrate that the rankings based on 7th grade courses exhibit
notable drops when students cross the GT eligibility threshold. In panel II.A of Table 10, we
provide regression results while adding controls for race, gender, economic disadvantage, LEP,
and prior gifted status. The results show that marginal GT students have a relative rank of 13 to
21 percentiles lower than marginal non-GT students in 7th grade. Panel II.B provides the impact
of attending a GT magnet on rank and finds that magnet students in 7th grade are nearly 30
percentile rankings lower than the non-magnet students.
To the extent that the negative estimates for grades and rank in the RD analysis reflects
absolute changes in learning, this suggests that the more difficult course work could be ill suited
to students at the eligibility margin. However, we would not expect the lottery participants to be
ill suited to more difficult coursework given their high positions in the GT achievement
49 In the RD sample we also find a significant drop in reading grades in 6th grade, and among students who take reading in 7th grade of four points. For the lottery sample, however, only a handful of students take reading in 7th grade and hence the estimates are very imprecise.
30
distribution. Additionally, we find little difference in the likelihood of enrolling in a “Vanguard”
class between lottery winners and losers which serves as a proxy for curricular differences. Thus,
it seems likely that some portion of the grade effects reflect changes in relative rank. Hence, the
necessary conditions are clearly met for invidious comparison to play a role offsetting the
expected positive impact of course selection, teacher quality, and peer effects.
VI. Summary and Conclusion In this paper, we identify the impact of providing gifted and talented services on student
achievement and behavior. We exploit a unique universal evaluation in a large urban school
district in the Southwest US where all students are evaluated for GT eligibility in 5th grade
regardless of prior GT status. This allows us to specify a regression discontinuity for students on
either side of the eligibility cutoff, and examine achievement, attendance and discipline
differences by 7th grade. We also exploit a second data set, where two of the middle schools with
GT magnet programs in this district are over-subscribed and conduct lotteries to determine
admission amongst a pool of eligible GT students. The advantage of the two different
identification strategies is that we examine not only the marginal GT students in the RD, but also
a much wider portion of the ability distribution in the lottery analysis. The caveat in our
strategies, however, is that the alternative to GT treatment varies. Marginal students not admitted
to the GT program take “regular” classes, while students that lose the lottery receive GT services
but in a less intensive atmosphere than that provided in the magnet schools.
Our analysis shows that both the RD and lottery samples meet the standard validity tests,
with the main exception that lottery losers are more likely to leave the district. We correct for
attrition in the lottery sample through inverse probability weighting for our estimates and we also

31
generate coefficient bounds using a procedure proposed by Engberg, et al. (2010).
The RD results indicate that GT services generate little impact on achievement for
students on the margin of qualifying. For the lottery analysis we also find little evidence of
improvement in achievement or attendance with the exception of science. These results are
surprising given that we find large improvements in peer achievement on the order of 0.3
standard deviations in the RD analysis, and 0.7 to 1.2 standard deviations in the lottery analysis.
In addition, we find that students on the margin of GT eligibility enroll in more advanced classes,
while students that gain admittance to the premier GT magnet schools gain higher quality
teachers. The estimates from these two samples and specifications are reduced forms, in that they
do not differentiate among the many mechanisms by which student achievement might be
impacted. Nonetheless, we are able to rule out maximum score truncation as a potential
explanation. Additionally, while a lack of alignment of the curriculum to the tests could play a
role, it does not explain the lack of response to substantial improvement in peers. Further, while
difficulty with the advanced material could explain the RD results for marginal students, it does
not explain the magnet lottery results.
Finally, we find that raw course grades and students’ relative rankings amongst his or her
peers as measured by grades fall substantially in both the RD and lottery models. Along with the
lack of achievement improvements in spite of large improvements in peer quality, this result is
consistent with an invidious comparison model of peer effects, whereby students are demoralized
or garner fewer teacher resources by being placed lower in the achievement distribution of their
class. The possibility that GT students are subject to invidious comparisons is suggestive of
limitations to the benefits of having better peers and more educational inputs.
32
VII. References Angrist, Joshua and Kevin Lang. “Does Schooling Integration Generate Peer Effects? Evidence
from Boston’s Metco Program,” American Economic Review, 94 (2004): 1613-1634. Argys, Laura, Daniel Rees, and Dominic Brewer. "Detracking America's Schools: Equity at Zero
Cost?" Journal of Policy Analysis and Management 15, no. 4 (1996): 623-645. Barecca, Alan I., Melanie Guldi, Jason M. Lindo, and Greg R. Waddell. “Running and Jumping
Variables in Regression Discontinuity Designs.” University of Oregon, mimeo (2010). Betts, Julian, and Jaimie Shkolnik. "The Effects of Ability Grouping on Student Achievement
and Resource Allocation in Secondary Schools." Economics of Education Review 19, no. 1 (2000): 1-15.
Bhatt, Rachana. "The Impacts of Gifted and Talented Education." SSRN Working Paper No. 09-
11 (2009). Crocker, Jennifer, Andrew Karpinski, Diane M. Quinn and Sara K. Chase. “When Grades
Determine Self-Worth: Consequences of Contingent Self-Worth for Male and Female Engineering and Psychology Majors.” Journal of Personality and Social Psychology 85, no. 3 (2003): 507 – 516.
Davis, Billie, John Engberg, Dennis N. Epple, Holger Sieg, and Ron Zimmer, “Evaluating the
Gifted Program of an Urban School District using a Modified Regression Discontinuity Design,” NBER Working Paper #16414, September, 2010.
Duflo, Esther, Pascaline Dupas, and Michael Kremer. “Peer Effects, Teacher Incentivers, and the
Impact of Tracking: Evidence from a Randomized Evaluation in Kenya,” American Economic Review, forthcoming.
Engberg, John, Dennis Epple, Jason Imbrogno, Holger Sieg and Ron Zimmer. “Evaluating
Education Programs That Have Lotteried Admission and Selective Attrition.” University of Pennsylvania, miemo (2010).
Epple, Dennis, Elizabeth Newton, and Richard Romano. "Ability Tracking, School Competition,
and the Distribution of Educational Benefits." Journal of Public Economics 83, no. 1 (2002): 1-48.
Figlio, David, and Marianne Page. "School Choice and the Distributional Effects of Ability
Tracking: Does Separation Increase Equality?" Journal of Urban Economics 51, no. 3 (2002): 497-514.
33
Hahn, Jinyong, Petra Todd, and Wilbert Van der Klaauw. "Identification and Estimation of Treatment Effects With a Regression-Discontinuity Design." Econometrica 69, no. 1 (2001): 201-209.
Howard, George S. and Scott E. Maxwell. “Correlation Between Student Satisfaction and
Grades: A Case of Mistaken Causation?” Journal of Educational Psychology 72, no. 6 (1980): 810 – 820.
Hoxby, Caroline and Gretchen Weingarth. “Taking Race Out of the Equation: School
Reassignment and the Structure of Peer Effects,” American Economic Association Annual Meetings, http://www.aeaweb.org/annual_mtg_papers/2006/0108_1300_0803.pdf (2006).
Imberman, Scott A., Adriana D. Kugler, and Bruce I. Sacerdote. "Katrina's Children: Evidence
on the Structure of Peer Effects from Hurricane Evacuees." University of Houston, mimeo (2009).
Ireson, Judith, Susan Haliam and Ian Plewis. “Ability Grouping in Secondary Schools: Effects
on Pupil’s Self-Concepts.” British Journal of Educational Psychology 71, no. 2 (2010): 315 – 326.
Kane, Thomas J. and Douglas O. Staiger. “Estimating Teacher Impacts on Student Achievement:
An Experimental Evaluation.” NBER Working Paper No. 14607 (2008). Kulik, Chen-lin, and James Kulik. "Ability Grouping." In Handbook of Gifted Education, edited
by Nicholas Colangelo and Gary Davis, 230-242. Boston: Allyn and Bacon (1997). Lavy, Victor, M. Daniele Paserman and Analia Schlosser. “Inside the Black Box of Ability Peer
Effects: Evidence from Variation in High and Low Achievers in the Classroom,” NBER Working Paper no. 14415 (2008).
Lavy, Victor and Analia Schlosser. “Mechanisms and Impacts of Gender Peer Effects at School,”
NBER Working Paper no. 13292 (2007). Lee, David, and Thomas Lemieux. "Regression Discontinuity Designs in Economics." NBER
Working Paper No. 14723, 2009. Marsh, Herbert W., Danuta Chessor, Rhonda Craven and Lawrence Roche. “The Effects of
Gifted and Talented Programs on Academic Self-Concept: The Big Fish Strikes Again.” American Educational Research Journal 32, no. 2 (1995): 285-319.
McCrary, Justin. “Manipulation of the Running Variable in the Regression Discontinuity Design:
A Density Test.” Journal of Econometrics 142, no. 2 (2008): 698 – 714.

34
Neal, Derek, and Diane Whitmore Schanzenbach. "Left Behind by Design: Proficiency Counts and Test-Based Accountability." Review of Economics and Statistics 92, no. 2 (2010): 263 – 283.
Owens, Timothy J. “Two Diminsions of Self-Esteem: Reciprocal Effects of Positive Self-Worth
and Self-Deprecation on Adolescent Problems.” American Sociological Review 59, no. 3 (1994): 391 - 407.
Preckel, Franzis , Thomas Gotz and Anne Frenzel. “Ability Grouping of Gifted Students: Effects
on Academic Self-Concept and Boredom.” British Journal of Educational Psychology 80 (2010), no. 3: 451 - 472.
Reback, Randall. "Teaching to the Rating: School Accountability and the Distribution of Student
Achievement." Journal of Public Economics 92, no. 5-6 (2008): 1394-1415. Zeidner, Moshe and Esther Jane Schleyer. “The Big-Fish-Little-Pond Effect for Academic Self-
Concept, Test Anxiety and School Grades in Gifted Children.” Contemporary Educational Psychology 24, no. 4 (1999): 305 – 329.
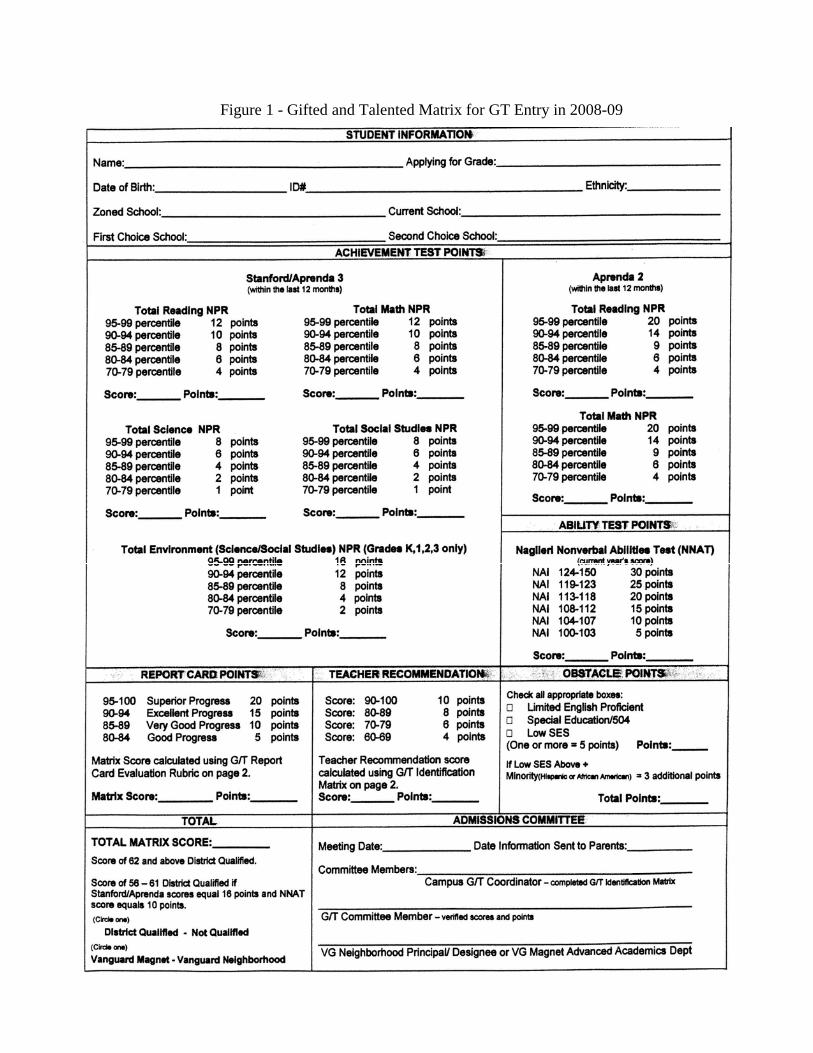
Figure 1 - Gifted and Talented Matrix for GT Entry in 2008-09
4.6
.81
Rec
eivi
ng G
&T
Ser
vice
sFigure 2: Gifted Status in 7th Grade
by 5th Grade Matrix Score0
.2.4
Prob
abilit
y of
R
30 40 50 60 70 80Euclidean Distance to Closest Elegibility Point
5
10
15
20
25
30
35
40
Other Points
Figure 3: Surface Plot of GT Qualification by Matrix Points
0 1 2 3 4 5 6 7 8 9 10 11 12 13 14 15 1617 18 1920 212223
2425262728293031323334353637
383940
00
4
8
12
16
20
24
28
Stanford /Aprenda Achievement Test Points
NNAT Points
4.6
.81
Rec
eivi
ng G
&T S
ervi
ces
Figure 4: Gifted Status in 7th Grade by Distance to BoundaryBased on 5th Grade Matrix Points
0.2
.4P
roba
bilit
y of
R
-10 -5 0 5 10Euclidean Distance to Closest Elegibility Point
.81
1.2
men
t Tes
t - S
tand
ard
Dev
iatio
nsFigure 5: Stanford Math, Reading & Language in
7th Grade by Distance to Boundary.4
.6S
tanf
ord
Ach
ieve
-10 -5 0 5 10Euclidean Distance to Closest Elegibility Point
Math Reading Language
4.6
.81
men
t Tes
t - S
tand
ard
Dev
iatio
nsFigure 6: Stanford Social Studies & Science in
7th Grade by Distance to Boundary.2
.4S
tanf
ord
Ach
ieve
m
-10 -5 0 5 10Euclidean Distance to Closest Elegibility Point
Social Studies Science
5560
65an
k (P
erce
ntile
s)Figure 7: Rank in Course by Final Grade
in 7th Grade by Distance to BoundaryMath and English
4550R
a
-10 -5 0 5 10Euclidean Distance to Closest Elegibility Point
Math English
Students with multiple courses in a subject are given the average rank over those courses.
5055
6065
ank
(Per
cent
iles)
Figure 8: Rank in Course by Final Gradein 7th Grade by Distance to Boundary
Social Studies and Science40
45R
a
-10 -5 0 5 10Euclidean Distance to Closest Elegibility Point
Social Studies Science
Students with multiple courses in a subject are given the average rank over those courses.

Gifted in 2009-10 (7th
Grade)Not Gifted in
2009-10Not in Sample in
2009-10In GT Magnet in
2009-10
Not in GT Magnet in
2009-10Not in Sample in
2009-10
Female 0.54 0.48 0.50 0.51 0.54 0.57(0.50) (0.50) (0.50) (0.50) (0.50) (0.50)
Economically Disadvantaged 0.59 0.89 0.81 0.24 0.41 0.17(0.49) (0.31) (0.39) (0.43) (0.49) (0.37)
LEP 0.23 0.37 0.28 0.02 0.06 0.04(0.42) (0.48) (0.45) (0.15) (0.24) (0.20)
Asian 0.11 0.02 0.03 0.28 0.16 0.19(0.31) (0.13) (0.18) (0.45) (0.37) (0.39)
Black 0.13 0.28 0.33 0.12 0.21 0.18(0.34) (0.45) (0.47) (0.32) (0.41) (0.38)
Hispanic 0.52 0.66 0.56 0.22 0.23 0.14(0.50) (0.47) (0.50) (0.41) (0.42) (0.35)
White 0.24 0.04 0.09 0.38 0.40 0.50(0.43) (0.19) (0.28) (0.49) (0.49) (0.50)
Gifted 0.68 0.06 0.15 0.85 0.85 0.83(0.47) (0.25) (0.36) (0.36) (0.36) (0.37)
Stanford Math 0.74 0.06 0.18 1.61 1.39 1.72(0.59) (0.39) (0.47) (0.79) (0.71) (1.03)
Stanford Reading 0.64 -0.02 0.11 1.72 1.60 1.83(0.41) (0.39) (0.47) (0.78) (0.77) (0.87)
Stanford Language 0.74 -0.16 0.01 1.61 1.48 1.83(0.59) (0.57) (0.67) (0.84) (0.76) (0.94)
Stanford Social Science 0.43 -0.61 -0.42 1.52 1.48 1.75(0.68) (0.68) (0.80) (0.86) (0.84) (0.91)
Stanford Science 0.50 -0.50 -0.30 1.47 1.36 1.61(0.66) (0.65) (0.76) (0.89) (0.79) (0.95)
Disciplinary Infractions 0.04 0.21 0.25 0.02 0.05 0.01
Table 1 - Characteristics of Students Evaluated for Middle School GT in 2007-08
B. GT Magnet Lottery Sample
A. 5th Grade Characteristics
A. All 5th Grade Students
(0.26) (0.73) (0.87) (0.15) (0.24) (0.10)Attendence Rate 98.26 97.25 96.58 98.35 97.98 97.00
(2.35) (4.52) (4.95) (2.00) (2.34) (3.75)
Stanford Math 1.11 -0.40 - 1.70 1.53 -(0.45) (0.41) - (0.84) (0.86) -
Stanford Reading 0.95 -0.31 - 1.66 1.58 -(0.37) (0.38) - (0.66) (0.72) -
Stanford Language 1.08 0.17 - 1.59 1.44 -(0.57) (0.58) - (0.80) (0.72) -
Stanford Social Science 0.88 -0.09 - 1.70 1.51 -(0.64) (0.60) - (0.88) (0.80) -
Stanford Science 1.00 -0.18 - 1.72 1.36 -(0.79) (0.71) - (0.94) (0.77) -
Disciplinary Infractions 0.28 1.25 - 0.05 0.13 -(1.11) (2.61) - (0.24) (0.86) -
Attendence Rate 97.37 95.02 - 97.84 97.57 -(3.19) (6.13) - (2.52) (3.16) -
Observations 1,919 8,748 3,652 291 149 102Standard deviations in parentheses. Achievement is measured in standard deviation units within grade and year across the district. Disciplinary infractions are the number of times a student is given a suspension or more severe punishment. Economically disadvantaged refers to students who qualify for free lunch, reduced-price lunch or another federal or state anti-poverty program.
B, 7th Grade Outcomes

Black Hispanic Female LEP Gifted in 5th Grade
Special Education
Free / Reduced-Price
Lunch
Stanford - Math
Stanford - Reading
Stanford - Language
(1) (2) (3) (4) (5) (6) (7) (8) (9) (10)
-0.000 0.014 0.024 0.039 -0.050 0.005 0.049 -0.067*** 0.006 0.006(0.029) (0.038) (0.042) (0.040) (0.047) (0.011) (0.037) (0.026) (0.026) (0.041)
Observations 2,650 2,650 2,650 2,650 2,650 2,650 2,650 2,637 2,638 2,636
Stanford - Social Studies
Stanford - Science
# of Disciplinary Infractions
Attendance Rate (%)
Any Missing Matrix Data Teacher Score Teacher
Points EnrolledEnrolled (Free/ Reduced-Price
Lunch)
Enrolled (Non-Free/ Reduced-Price Lunch)
(11) (12) (13) (14) (15) (16) (17) (18) (19) (20)
0.040 0.004 -0.001 -0.269 0.000 2.965 0.497 0.049 0.054 0.039(0.049) (0.042) (0.028) (0.190) (0.008) (2.715) (0.321) (0.030) (0.037) (0.053)
Observations 2,636 2,637 2,650 2,650 2,650 2,648 2,648 3,438 2,177 1,261
Above GT Cutoff
Above GT Cutoff
Table 2 - Reduced-Form Estimates of Discontinuities in Pre-Existing (5th Grade) Student Characteristics
Achievement is measured in standard deviations of scale scores within grade and year. Disciplinary infractions are the number of infractions warranting a suspension or more severe punishment per year. Regressions include a linear smoother with a slope shift above the cutoff. The sample is limited to students with Euclidean distances from qualifying via the GT qualification matrix of between -10 and 10. *, **, and *** denote statistical significance at the 10%, 5%, and 1% levels, respectively. Standard errors are robust to heteroskedasticity and clustered by 5th grade school. The estimation sample - students observed in LUSD two years after evaluation (7th grade) - is used is for columns (1) to (17) . Regressions using the full set of evaluated students provides similar results and is provided in the online appendix.

Math Reading Language Social Studies
Science
(1) (2) (3) (4) (5) (6) (7)
-0.061** -0.005 -0.004 -0.020 -0.011 -0.006 -0.691**(0.030) (0.029) (0.044) (0.038) (0.060) (0.120) (0.311)
0.440*** 0.443*** 0.442*** 0.440*** 0.440*** 0.436*** 0.438***(0.057) (0.057) (0.058) (0.058) (0.057) (0.058) (0.058)
-0.138** -0.011 -0.008 -0.045 -0.025 -0.014 -1.578*(0.068) (0.065) (0.100) (0.085) (0.135) (0.276) (0.802)
2,612 2,614 2,612 2,610 2,612 2,653 2,652
-0.016 -0.001 0.005 -0.007 0.008 0.003 -0.502*(0.022) (0.020) (0.031) (0.031) (0.048) (0.112) (0.268)
0.465*** 0.457*** 0.457*** 0.454*** 0.456*** 0.451*** 0.456***(0.060) (0.061) (0.061) (0.061) (0.061) (0.060) (0.060)
-0 035 -0 002 0 010 -0 016 0 017 0 007 -1 101*
Table 3 - Regression Discontinuity Estimates of Impact of Receiving G&T Services
Reduced Form
Attendance Rate (%)
A. Baseline
Dependent Variable
ModelDisciplinary Infractions
2SLS - 2nd Stage
Stanford Achievement Test
Enrolled in GT
Observations
2SLS - 1st Stage
Above GT Cutoff
Above GT Cutoff
B. With Individual Controls
Reduced Form
2SLS - 1st Stage Above GT Cutoff
2SLS - 2nd Stage Enrolled in GT
Above GT Cutoff
-0.035 -0.002 0.010 -0.016 0.017 0.007 -1.101(0.047) (0.044) (0.068) (0.068) (0.106) (0.248) (0.653)
2,597 2,600 2,596 2,594 2,597 2,650 2,649
-0.024 -0.028 -0.028 -0.054 0.002 0.088 0.346(0.028) (0.020) (0.039) (0.041) (0.059) (0.130) (0.309)
0.229*** 0.232*** 0.230*** 0.228*** 0.229*** 0.230*** 0.229***(0.038) (0.038) (0.039) (0.039) (0.038) (0.038) (0.038)-0.106 -0.121 -0.120 -0.236 0.011 0.382 1.509(0.122) (0.085) (0.170) (0.188) (0.256) (0.568) (1.328)2,579 2,580 2,579 2,576 2,578 2,619 2,618
2SLS - 2nd Stage Enrolled in GT
Observations
Achievement is measured in standard deviations of scale scores within grade and year. Disciplinary infractions are the number of infractions warranting a suspension or more severe punishment per year. Synthetic matrix scores replace matrix scores for students where a teacher recommendation could be pivotal (e.g. total points w/o the recommendation is fewer than 10 away from the relevant cutoff) with the predicted value from a regression of total points on all components excluding the teacher points. See text for details. Controls for race, gender, economic
C. Using Synthetic Matrix Scores
Reduced Form Above GT Cutoff
2SLS - 1st Stage Above GT Cutoff
Observations
2SLS - 2nd Stage Enrolled in GT

Math Reading LanguageSocial
Science ScienceDisciplinary Infractions
Attendance Rate (%)
(1) (2) (3) (4) (5) (6) (7) (8)(1) Females 0.531*** -0.023 -0.030 -0.028 -0.041 -0.003 0.177 -1.909**
(0.063) (0.054) (0.049) (0.068) (0.083) (0.114) (0.230) (0.726)Observations 1,336 1,336 1,335 1,335 1,333 1,336 1,361 1,360
(2) Males 0.410*** -0.022 0.044 0.093 0.040 0.046 -0.205 0.029(0.076) (0.081) (0.061) (0.106) (0.110) (0.147) (0.495) (1.119)
Observations 1,237 1,237 1,240 1,236 1,237 1,237 1,260 1,260(3) Free/Reduced-Price Lunch 0.512*** 0.009 -0.032 0.014 -0.016 -0.031 0.160 -0.895
(0.064) (0.050) (0.047) (0.079) (0.083) (0.113) (0.306) (0.671)Observations 1,644 1,644 1,645 1,644 1,644 1,645 1,669 1,669
(4) No Free/Reduced-Price Lunch 0.366*** -0.126 0.076 0.000 -0.023 0.095 -0.613 -1.370(0.088) (0.097) (0.076) (0.130) (0.177) (0.178) (0.606) (1.367)
Observations 929 929 930 927 926 928 952 951(5) Black 0.605*** -0.068 0.124 -0.100 0.092 0.092 -0.181 -2.006*
(0.116) (0.082) (0.081) (0.144) (0.154) (0.177) (0.366) (1.027)
First Stage
Stanford Achievement Test
Table 4 - 2SLS Estimates of Impact of Receiving G&T ServicesEstimates for Sub-Populations
(0.116) (0.082) (0.081) (0.144) (0.154) (0.177) (0.366) (1.027)Observations 435 435 435 435 433 434 447 447
(6) Hispanic 0.453*** -0.024 -0.032 0.058 -0.043 0.048 -0.067 -1.109(0.059) (0.066) (0.057) (0.087) (0.086) (0.126) (0.400) (0.865)
Observations 1,680 1,680 1,682 1,679 1,679 1,680 1,708 1,708(7) White 0.289 0.015 -0.195 0.014 0.093 -0.446 -0.151 2.301*
(0.183) (0.257) (0.221) (0.277) (0.375) (0.529) (0.513) (1.285)Observations 325 325 325 325 325 326 330 329
(8) Gifted in 5th Grade 0.368*** -0.096 0.033 0.182 0.093 0.129 0.699 -2.041(0.082) (0.102) (0.095) (0.124) (0.159) (0.230) (0.558) (1.421)
Observations 1,003 1,003 1,005 1,004 1,003 1,004 1,017 1,016(9) Not Gifted in 5th Grade 0.534*** -0.003 -0.005 -0.045 -0.035 -0.027 -0.291 -0.666
(0.071) (0.056) (0.053) (0.077) (0.090) (0.122) (0.288) (0.636)Observations 1,570 1,570 1,570 1,567 1,567 1,569 1,604 1,604
Achievement is measured in standard deviations of scale scores within grade and year. Disciplinary infractions are the number of infractions warranting a suspension or more severe punishment per year.. Controls for race, gender, economic disadvantage and lagged (5th grade) dependent varable included, along with a linear smoother with a slope shift above the cutoff included. Standard errors are robust to heteroskedasticity and clustered by 7th grade school. Sample is limited to students with Euclidean distances from qualifying via the GT qualification matrix of between -10 and 10.
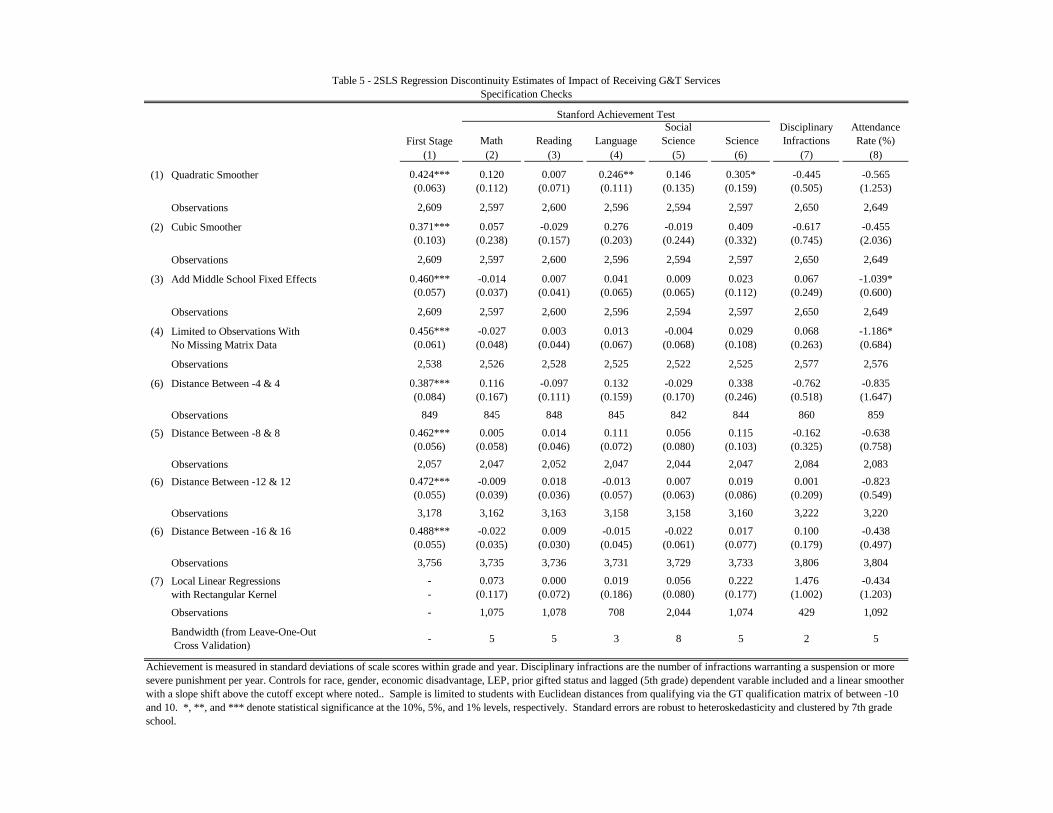
Math Reading LanguageSocial
Science ScienceDisciplinary Infractions
Attendance Rate (%)
(1) (2) (3) (4) (5) (6) (7) (8)
0.424*** 0.120 0.007 0.246** 0.146 0.305* -0.445 -0.565(0.063) (0.112) (0.071) (0.111) (0.135) (0.159) (0.505) (1.253)
Observations 2,609 2,597 2,600 2,596 2,594 2,597 2,650 2,649
0.371*** 0.057 -0.029 0.276 -0.019 0.409 -0.617 -0.455(0.103) (0.238) (0.157) (0.203) (0.244) (0.332) (0.745) (2.036)
Observations 2,609 2,597 2,600 2,596 2,594 2,597 2,650 2,649
0.460*** -0.014 0.007 0.041 0.009 0.023 0.067 -1.039*(0.057) (0.037) (0.041) (0.065) (0.065) (0.112) (0.249) (0.600)
Observations 2,609 2,597 2,600 2,596 2,594 2,597 2,650 2,649
0.456*** -0.027 0.003 0.013 -0.004 0.029 0.068 -1.186*(0.061) (0.048) (0.044) (0.067) (0.068) (0.108) (0.263) (0.684)
Observations 2,538 2,526 2,528 2,525 2,522 2,525 2,577 2,576
0.387*** 0.116 -0.097 0.132 -0.029 0.338 -0.762 -0.835(0.084) (0.167) (0.111) (0.159) (0.170) (0.246) (0.518) (1.647)
Observations 849 845 848 845 842 844 860 859
0.462*** 0.005 0.014 0.111 0.056 0.115 -0.162 -0.638(0.056) (0.058) (0.046) (0.072) (0.080) (0.103) (0.325) (0.758)
First Stage
Table 5 - 2SLS Regression Discontinuity Estimates of Impact of Receiving G&T ServicesSpecification Checks
(3) Add Middle School Fixed Effects
Stanford Achievement Test
Limited to Observations With No Missing Matrix Data
Distance Between -8 & 8
Quadratic Smoother
Cubic Smoother
(1)
(2)
(4)
(5)
(6) Distance Between -4 & 4
( ) ( ) ( ) ( ) ( ) ( ) ( ) ( )Observations 2,057 2,047 2,052 2,047 2,044 2,047 2,084 2,083
0.472*** -0.009 0.018 -0.013 0.007 0.019 0.001 -0.823(0.055) (0.039) (0.036) (0.057) (0.063) (0.086) (0.209) (0.549)
Observations 3,178 3,162 3,163 3,158 3,158 3,160 3,222 3,220
0.488*** -0.022 0.009 -0.015 -0.022 0.017 0.100 -0.438(0.055) (0.035) (0.030) (0.045) (0.061) (0.077) (0.179) (0.497)
Observations 3,756 3,735 3,736 3,731 3,729 3,733 3,806 3,804
- 0.073 0.000 0.019 0.056 0.222 1.476 -0.434- (0.117) (0.072) (0.186) (0.080) (0.177) (1.002) (1.203)
Observations - 1,075 1,078 708 2,044 1,074 429 1,092
Bandwidth (from Leave-One-Out Cross Validation) - 5 5 3 8 5 2 5
(7)
Achievement is measured in standard deviations of scale scores within grade and year. Disciplinary infractions are the number of infractions warranting a suspension or more severe punishment per year. Controls for race, gender, economic disadvantage, LEP, prior gifted status and lagged (5th grade) dependent varable included and a linear smoother with a slope shift above the cutoff except where noted.. Sample is limited to students with Euclidean distances from qualifying via the GT qualification matrix of between -10 and 10. *, **, and *** denote statistical significance at the 10%, 5%, and 1% levels, respectively. Standard errors are robust to heteroskedasticity and clustered by 7th grade school.
Local Linear Regressions with Rectangular Kernel
Distance Between -12 & 12
(6) Distance Between -16 & 16
(6)
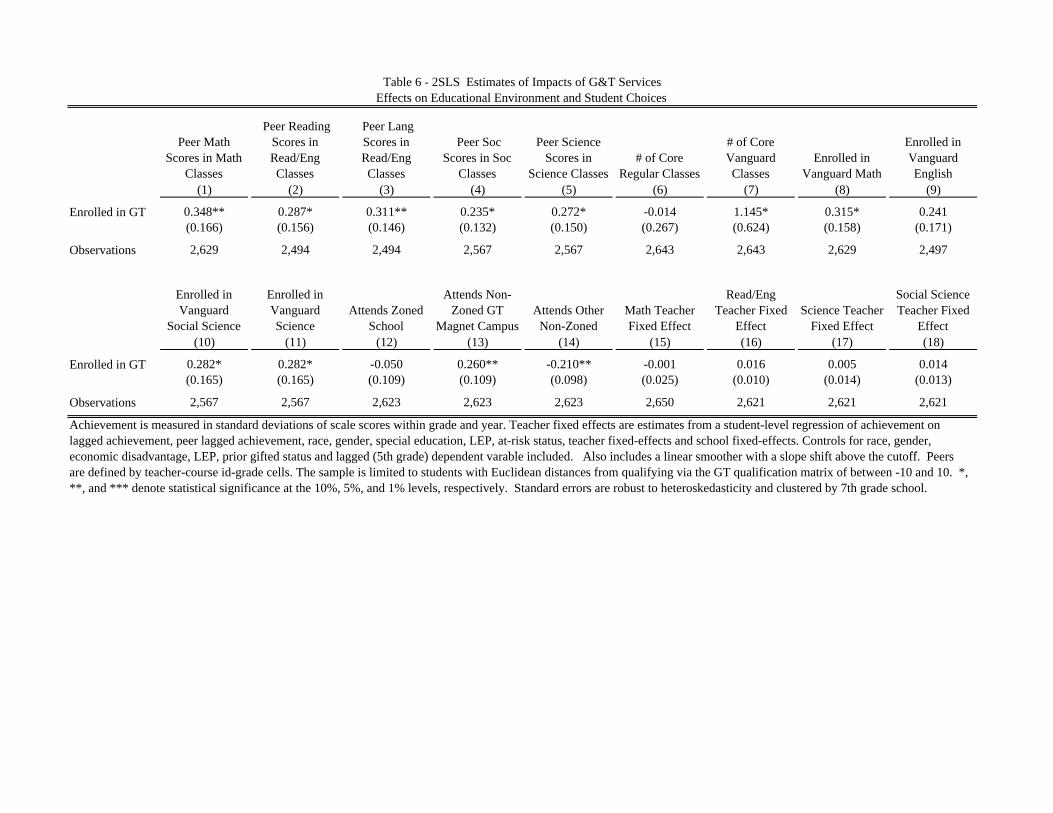
Peer Math Scores in Math
Classes
Peer Reading Scores in Read/Eng Classes
Peer Lang Scores in Read/Eng Classes
Peer Soc Scores in Soc
Classes
Peer Science Scores in
Science Classes# of Core
Regular Classes
# of Core Vanguard Classes
Enrolled in Vanguard Math
Enrolled in Vanguard English
(1) (2) (3) (4) (5) (6) (7) (8) (9)
0.348** 0.287* 0.311** 0.235* 0.272* -0.014 1.145* 0.315* 0.241(0.166) (0.156) (0.146) (0.132) (0.150) (0.267) (0.624) (0.158) (0.171)
Observations 2,629 2,494 2,494 2,567 2,567 2,643 2,643 2,629 2,497
Enrolled in Vanguard
Social Science
Enrolled in Vanguard Science
Attends Zoned School
Attends Non-Zoned GT
Magnet CampusAttends Other
Non-ZonedMath Teacher Fixed Effect
Read/Eng Teacher Fixed
EffectScience Teacher
Fixed Effect
Social Science Teacher Fixed
Effect(10) (11) (12) (13) (14) (15) (16) (17) (18)
0.282* 0.282* -0.050 0.260** -0.210** -0.001 0.016 0.005 0.014(0.165) (0.165) (0.109) (0.109) (0.098) (0.025) (0.010) (0.014) (0.013)
Observations 2,567 2,567 2,623 2,623 2,623 2,650 2,621 2,621 2,621
Table 6 - 2SLS Estimates of Impacts of G&T ServicesEffects on Educational Environment and Student Choices
Enrolled in GT
Enrolled in GT
Achievement is measured in standard deviations of scale scores within grade and year. Teacher fixed effects are estimates from a student-level regression of achievement on lagged achievement, peer lagged achievement, race, gender, special education, LEP, at-risk status, teacher fixed-effects and school fixed-effects. Controls for race, gender,
i di d LEP i if d d l d (5 h d ) d d bl i l d d Al i l d li h i h l hif b h ff Peconomic disadvantage, LEP, prior gifted status and lagged (5th grade) dependent varable included. Also includes a linear smoother with a slope shift above the cutoff. Peers are defined by teacher-course id-grade cells. The sample is limited to students with Euclidean distances from qualifying via the GT qualification matrix of between -10 and 10. *, **, and *** denote statistical significance at the 10%, 5%, and 1% levels, respectively. Standard errors are robust to heteroskedasticity and clustered by 7th grade school.
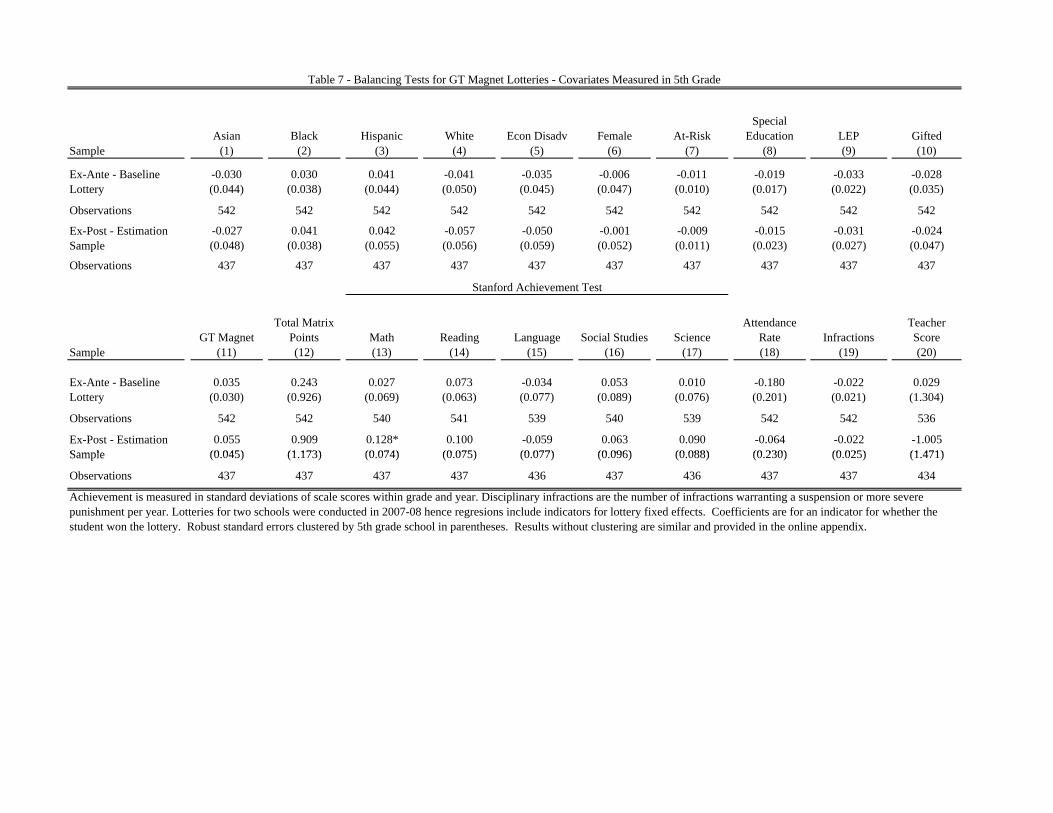
Asian Black Hispanic White Econ Disadv Female At-RiskSpecial
Education LEP Gifted(1) (2) (3) (4) (5) (6) (7) (8) (9) (10)
-0.030 0.030 0.041 -0.041 -0.035 -0.006 -0.011 -0.019 -0.033 -0.028(0.044) (0.038) (0.044) (0.050) (0.045) (0.047) (0.010) (0.017) (0.022) (0.035)
Observations 542 542 542 542 542 542 542 542 542 542
-0.027 0.041 0.042 -0.057 -0.050 -0.001 -0.009 -0.015 -0.031 -0.024(0.048) (0.038) (0.055) (0.056) (0.059) (0.052) (0.011) (0.023) (0.027) (0.047)
Observations 437 437 437 437 437 437 437 437 437 437
GT MagnetTotal Matrix
Points Math Reading Language Social Studies ScienceAttendance
Rate InfractionsTeacher Score
(11) (12) (13) (14) (15) (16) (17) (18) (19) (20)
0.035 0.243 0.027 0.073 -0.034 0.053 0.010 -0.180 -0.022 0.029(0.030) (0.926) (0.069) (0.063) (0.077) (0.089) (0.076) (0.201) (0.021) (1.304)
Observations 542 542 540 541 539 540 539 542 542 536
0.055 0.909 0.128* 0.100 -0.059 0.063 0.090 -0.064 -0.022 -1.005(0 045) (1 173) (0 074) (0 075) (0 077) (0 096) (0 088) (0 230) (0 025) (1 471)
Ex-Ante - Baseline Lottery
Sample
Table 7 - Balancing Tests for GT Magnet Lotteries - Covariates Measured in 5th Grade
Ex-Post - Estimation Sample
Ex-Post - Estimation Sample
Stanford Achievement Test
Sample
Ex-Ante - Baseline Lottery
(0.045) (1.173) (0.074) (0.075) (0.077) (0.096) (0.088) (0.230) (0.025) (1.471)
Observations 437 437 437 437 436 437 436 437 437 434
Achievement is measured in standard deviations of scale scores within grade and year. Disciplinary infractions are the number of infractions warranting a suspension or more severe punishment per year. Lotteries for two schools were conducted in 2007-08 hence regresions include indicators for lottery fixed effects. Coefficients are for an indicator for whether the student won the lottery. Robust standard errors clustered by 5th grade school in parentheses. Results without clustering are similar and provided in the online appendix.
Sample
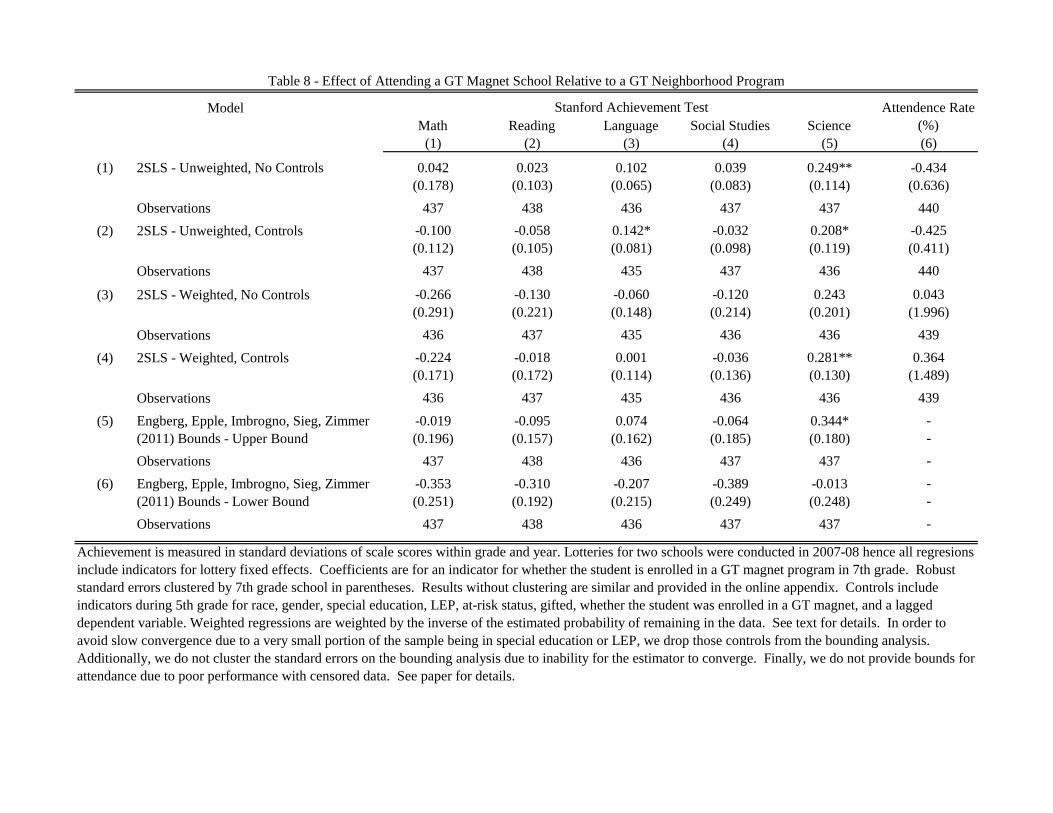
Math Reading Language Social Studies Science(1) (2) (3) (4) (5) (6)
(1) 0.042 0.023 0.102 0.039 0.249** -0.434(0.178) (0.103) (0.065) (0.083) (0.114) (0.636)
Observations 437 438 436 437 437 440(2) -0.100 -0.058 0.142* -0.032 0.208* -0.425
(0.112) (0.105) (0.081) (0.098) (0.119) (0.411)Observations 437 438 435 437 436 440
(3) -0.266 -0.130 -0.060 -0.120 0.243 0.043(0.291) (0.221) (0.148) (0.214) (0.201) (1.996)
Observations 436 437 435 436 436 439(4) -0.224 -0.018 0.001 -0.036 0.281** 0.364
(0.171) (0.172) (0.114) (0.136) (0.130) (1.489)Observations 436 437 435 436 436 439
(5) -0.019 -0.095 0.074 -0.064 0.344* -(0.196) (0.157) (0.162) (0.185) (0.180) -
Table 8 - Effect of Attending a GT Magnet School Relative to a GT Neighborhood Program
Attendence Rate (%)
2SLS - Unweighted, Controls
2SLS - Weighted, No Controls
2SLS - Weighted, Controls
Engberg, Epple, Imbrogno, Sieg, Zimmer (2011) Bounds - Upper Bound
2SLS - Unweighted, No Controls
Stanford Achievement TestModel
Observations 437 438 436 437 437 -(6) -0.353 -0.310 -0.207 -0.389 -0.013 -
(0.251) (0.192) (0.215) (0.249) (0.248) -Observations 437 438 436 437 437 -
Achievement is measured in standard deviations of scale scores within grade and year. Lotteries for two schools were conducted in 2007-08 hence all regresions include indicators for lottery fixed effects. Coefficients are for an indicator for whether the student is enrolled in a GT magnet program in 7th grade. Robust standard errors clustered by 7th grade school in parentheses. Results without clustering are similar and provided in the online appendix. Controls include indicators during 5th grade for race, gender, special education, LEP, at-risk status, gifted, whether the student was enrolled in a GT magnet, and a lagged dependent variable. Weighted regressions are weighted by the inverse of the estimated probability of remaining in the data. See text for details. In order to avoid slow convergence due to a very small portion of the sample being in special education or LEP, we drop those controls from the bounding analysis. Additionally, we do not cluster the standard errors on the bounding analysis due to inability for the estimator to converge. Finally, we do not provide bounds for attendance due to poor performance with censored data. See paper for details.
Engberg, Epple, Imbrogno, Sieg, Zimmer (2011) Bounds - Lower Bound
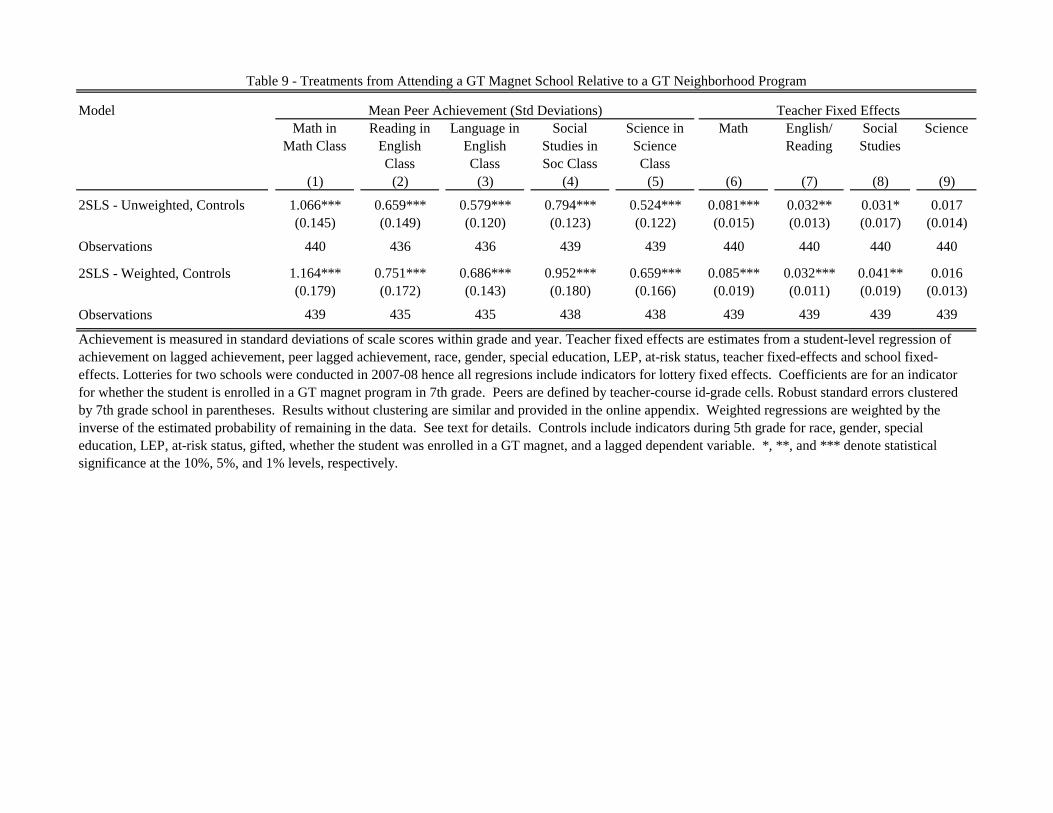
Math in Math Class
Reading in English Class
Language in English Class
Social Studies in Soc Class
Science in Science Class
Math English/Reading
Social Studies
Science
(1) (2) (3) (4) (5) (6) (7) (8) (9)
1.066*** 0.659*** 0.579*** 0.794*** 0.524*** 0.081*** 0.032** 0.031* 0.017(0.145) (0.149) (0.120) (0.123) (0.122) (0.015) (0.013) (0.017) (0.014)
Observations 440 436 436 439 439 440 440 440 440
1.164*** 0.751*** 0.686*** 0.952*** 0.659*** 0.085*** 0.032*** 0.041** 0.016(0.179) (0.172) (0.143) (0.180) (0.166) (0.019) (0.011) (0.019) (0.013)
Observations 439 435 435 438 438 439 439 439 439
Table 9 - Treatments from Attending a GT Magnet School Relative to a GT Neighborhood Program
Achievement is measured in standard deviations of scale scores within grade and year. Teacher fixed effects are estimates from a student-level regression of achievement on lagged achievement, peer lagged achievement, race, gender, special education, LEP, at-risk status, teacher fixed-effects and school fixed-effects. Lotteries for two schools were conducted in 2007-08 hence all regresions include indicators for lottery fixed effects. Coefficients are for an indicator for whether the student is enrolled in a GT magnet program in 7th grade. Peers are defined by teacher-course id-grade cells. Robust standard errors clustered by 7th grade school in parentheses. Results without clustering are similar and provided in the online appendix. Weighted regressions are weighted by the inverse of the estimated probability of remaining in the data. See text for details. Controls include indicators during 5th grade for race, gender, special education, LEP, at-risk status, gifted, whether the student was enrolled in a GT magnet, and a lagged dependent variable. *, **, and *** denote statistical
2SLS - Unweighted, Controls
2SLS - Weighted, Controls
Model Mean Peer Achievement (Std Deviations) Teacher Fixed Effects
g g gg psignificance at the 10%, 5%, and 1% levels, respectively.
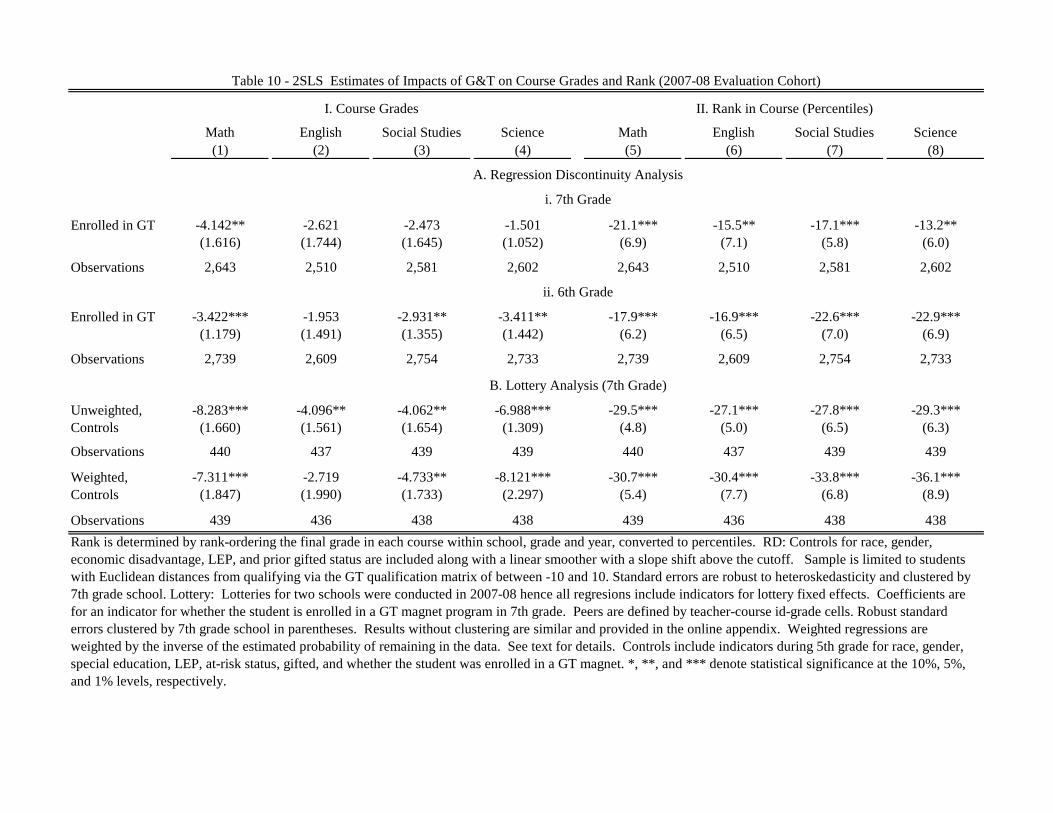
Math English Social Studies Science Math English Social Studies Science(1) (2) (3) (4) (5) (6) (7) (8)
-4.142** -2.621 -2.473 -1.501 -21.1*** -15.5** -17.1*** -13.2**(1.616) (1.744) (1.645) (1.052) (6.9) (7.1) (5.8) (6.0)
Observations 2,643 2,510 2,581 2,602 2,643 2,510 2,581 2,602
-3.422*** -1.953 -2.931** -3.411** -17.9*** -16.9*** -22.6*** -22.9***(1.179) (1.491) (1.355) (1.442) (6.2) (6.5) (7.0) (6.9)
Observations 2,739 2,609 2,754 2,733 2,739 2,609 2,754 2,733
-8.283*** -4.096** -4.062** -6.988*** -29.5*** -27.1*** -27.8*** -29.3***(1.660) (1.561) (1.654) (1.309) (4.8) (5.0) (6.5) (6.3)
Observations 440 437 439 439 440 437 439 439
Table 10 - 2SLS Estimates of Impacts of G&T on Course Grades and Rank (2007-08 Evaluation Cohort)
Unweighted, Controls
Enrolled in GT
Enrolled in GT
I. Course Grades II. Rank in Course (Percentiles)
A. Regression Discontinuity Analysis
i. 7th Grade
ii. 6th Grade
B. Lottery Analysis (7th Grade)
Observations 440 437 439 439 440 437 439 439
-7.311*** -2.719 -4.733** -8.121*** -30.7*** -30.4*** -33.8*** -36.1***(1.847) (1.990) (1.733) (2.297) (5.4) (7.7) (6.8) (8.9)
Observations 439 436 438 438 439 436 438 438Rank is determined by rank-ordering the final grade in each course within school, grade and year, converted to percentiles. RD: Controls for race, gender, economic disadvantage, LEP, and prior gifted status are included along with a linear smoother with a slope shift above the cutoff. Sample is limited to students with Euclidean distances from qualifying via the GT qualification matrix of between -10 and 10. Standard errors are robust to heteroskedasticity and clustered by 7th grade school. Lottery: Lotteries for two schools were conducted in 2007-08 hence all regresions include indicators for lottery fixed effects. Coefficients are for an indicator for whether the student is enrolled in a GT magnet program in 7th grade. Peers are defined by teacher-course id-grade cells. Robust standard errors clustered by 7th grade school in parentheses. Results without clustering are similar and provided in the online appendix. Weighted regressions are weighted by the inverse of the estimated probability of remaining in the data. See text for details. Controls include indicators during 5th grade for race, gender, special education, LEP, at-risk status, gifted, and whether the student was enrolled in a GT magnet. *, **, and *** denote statistical significance at the 10%, 5%, and 1% levels, respectively.
Weighted, Controls