is bosque farms, nm a “speed trap?” a spot...
TRANSCRIPT

Is Bosque Farms, NM a “Speed Trap?”A Spot Speed Study Report
by William A. Muckerheide, BS, MSJanuary 24, 2010
This paper has been written as a public service to those who drive in Valencia County, New Mexico,
and is dedicated to Speed Trap victims everywhere.
Copyright © 2010, by William A. Muckerheide. Permission is granted to copy or distribute this document AS IS,
and publish brief quotes for reference purposes.Posting on other web sites is politely suggested.
CONTACT INFORMATION:[email protected]
Keywords: Bosque Farms, speed trap, spot speed study, traffic safety, traffic research, speed limit,arbitrary speed limit, low speed limit, , speed variance, speed distribution, skewed speed distribution,Solomon curve, legal aspects

-2-
ABSTRACT
Using the CA Vehicle Code (40802) definition, simplified to, “an artificially low speed limitcombined with excessively high enforcement”, the answer to the question, ‘Is Bosque Farms,NM a ‘“Speed Trap?”’ is a definite “YES”.
Because driving tends to be the greatest risk to ourselves on a daily basis, plus the fact that thereare many misconceptions about traffic safety, this Report was written for the public and includesconsiderable discussion in non-technical “lingo”, plus references for the layperson.
Two hundred speed measurements of free-flowing northbound traffic were taken near Sopa’srestaurant in November, 2009, in accordance with accepted Spot Speed Study criteria. These datawere analyzed using a spreadsheet. The average speed is 48 mph, 3 mph above the posted speedlimit. Where speed limits are normally based on the 85th Percentile (here, 52 mph), averagespeed occurs here at the 24th Percentile. The 10-mph pace speed is 43-53 mph and speed limitsare recommended to be set at the upper limit of this pace speed. The Frequency Distribution isboth broad and heavily skewed positive, where several references show it should be more narrow(lower speed variance) and either symmetrical or slightly skewed negative. Using six U-shapedcurves from government sources and the lowest measured speed of 38 mph, the “equally-safe”speed under free-flow conditions is shown to be approximately 64-65 mph, indicating that actual“un-safe” speeds are greater than 65 mph under ideal conditions, a speed not excessively high ifthe posted speed is 10 mph too low.
Based on this data and its analysis, the current posted speed limit cannot be described as safetybased, i.e., it is not set for the purpose of maximizing traffic safety, the claimed intent of suchspeed limits. Assuming that the data is reasonably representative of the free-flow speeds, thecurrent posted speed limit - particularly with the excessively high level of speed enforcement -can be described as DETRIMENTAL to traffic safety.
Although much additional research would be required, it appears that substantially skewed speeddistributions may define speed traps and their unnecessarily high crash rates. Such research mayprovide a simple method to identify speed traps, the elimination of which could quickly andsubstantially decrease the existing, nationwide number of crashes and their resulting injuries anddeaths.
-3-
TABLE OF CONTENTS
ABSTRACT
TABLE OF CONTENTS
1. INTRODUCTION [p4]1.1 Just What IS a “Speed Trap”? [p5]1.2 Traffic Safety and Speed Limits [p5]1.3 Common Misconceptions about Traffic Safety and Speed Limits [p6]1.4 Understanding Traffic Safety - Discussion & Sources [p7]1.5 “Speed Variance” and Accident Rates [p8]
2. THE SPOT SPEED STUDY [p10]2.1 Methodology [p11]2.2 Data Acquisition [p12]2.3 Data Analysis and Results [p12]
3. DISCUSSION [p14]3.1 Discussion of Results [p14]3.2 “Safe” versus “Un-Safe” Traffic Speeds [p15]3.3 The Shape of the Above Frequency Distributions [p18]3.4 Some Additional Quotes on Speed Limits and Their Effects [p20]3.5 Speed Limit Change Effects from the 1996 Nevada Speed Management Workshop and the 1998 “Synthesis” Report. [p21]3.6 Other Speed limit Policy References [p23]3.7 Two Seemingly Apparent Speed Limit Inconsistencies [p26]
4. CONCLUSIONS [p27]
4.1 Recommendations for Further Research [p27]
5. NON-TRAFFIC-SAFETY SPEED TRAP CONCERNS [p28]
APPENDIX A [p29]Lillie Drive Spot Speed Study
APPENDIX B [p31]Local Speed Limit INCONSISTENCIES

-4-
1. INTRODUCTION
The reason for this “Spot Speed Study” Report: Several months ago, the Author was told by afriend that Bosque Farms is listed as a “Speed Trap” on at least two national speed trap web sites.This is true, but the comment sections of the web sites indicated some disagreement over thisconclusion, which gives rise to two questions: first, what is the definition of a “speed trap” and,second, does Bosque Farms satisfy that definition?
The Author does not personally consider this Study to be a comprehensive Traffic Safety Audit,i.e., not sufficient for speed limits changes, but DOES consider it to be sufficient to conclusivelyshow the existing speed limit to be either valid or artificial. The New Mexico DOT, however,DOES say that it’s enough for setting speed limits, in its March, 2008, “Signing and StripingManual”, page 67, here:http://www.nmshtd.state.nm.us/upload/images/Traffic_Design_Technical_Support_Bureau/SignandStripingManual.pdf
The traffic safety information contained in this Study can be easily checked by doing some fairlybrief internet searches. Included below in brackets are example Google searches, which can inturn be used for more narrow or specific searches by the reader.[SEARCH: (“bosque farms” + “speed trap”)]
A typical Spot Speed Study would be written by a Traffic Engineer for others knowledgeable inthe subject of traffic safety and would be quite brief. This Study, while useful to these experts, isalso written for the general public and, for this reason includes considerable information on thebasics of traffic safety, speed limits, etc.
The subject of traffic safety, speed limits, etc, has been researched and analyzed for manydecades. There are literally thousands of publications on the subject, from hundreds of pagedreports, books and theses to single/double-paged brochures intended for the public. As shown inthe following pages, many of them may be found using internet searches.
The Author of this Report was funded by NO ONE and, for this reason, there is no company ororganization that must be satisfied. The only supervisory/management control over the projectand its Author is the “Scientific Method”.
Author’s Qualifications (Partial):Safety and Risk AnalysisBS, MS, Nuclear Engineering, in which safety/risk analysis is an integral part.MORT-AI (9 1/2-day course) Certified Accident Investigator (cert. now expired.)Many years of Safety & Risk Analysis activities.Performing MeasurementsTeaching Assistantship in the Physics Dept. when in Grad School - taught freshman andsophomore physics labs., that include many types of measurements.ANSI-N45.2.6 ("Qualification of Inspection, Examination, and Testing Personnel . . .")Certified Level III (highest level) , Startup Test Engineer and QA/QC Inspector, Nuclearsafety-related systems.

-5-
1.1 Just What IS a “Speed Trap”?[SEARCH: (definition + “speed trap”)]
An internet search will show many definitions of the term. Of these, the best and most formalcomes from California law. As of 11/7/09, the California Vehicle Code covering “Speed Traps”is “Division 17, Chapter 3, “Illegal Evidence”, and is given HERE:http://www.dmv.ca.gov/pubs/vctop/vc/tocd17c3a1.htm
The California definition is, in part:“Speed Traps”“40802. (a) A "speed trap" is either of the following:“(2) A particular section of a highway with a prima facie speed limit that is provided by this codeor by local ordinance . . . if that prima facie speed limit is not justified by an engineering andtraffic survey conducted within five years prior to the date of the alleged violation, andenforcement of the speed limit involves the use of radar or any other electronic device thatmeasures the speed of moving objects.”
Stated more simply, a Speed Trap has TWO characteristics: first, the speed limit is artificially(unrealistically) low and; second, speed limit enforcement is vigorous (heavy).
Vigorous enforcement of the Highway 47, 45-mph speed limit has been well known for manyyears, leaving the question of whether or not the speed limit is artificially low. Thus, the purposeof this Study of whether or not Bosque Farms is a “Speed Trap” is to determine the answer tothis question.
1.2 Traffic Safety and Speed Limits[SEARCH: (“highway safety” + “speed limit”), (“traffic safety” + “speed limit”), (“highwaysafety” + “low speed limit”), etc., etc.]
Because this Report is written for the Public, and because there is a great deal of misinformationabout traffic safety in general and speed limits in particular, this sub-section is presented. It is theAuthor’s belief that driving is generally the greatest risk to life and limb we take on a daily basisand, for that reason, it is very much in our personal interest to understand the realities of trafficsafety. Practical traffic safety research has been conducted for many years, and the quality andaccuracy of the valid research has improved over the years to the present. The “U-shaped” curvespresented in some of the following references originated in the early-to-late 1960's, initially byDavid Solomon and later, Julie Cirillo, remains valid and is often referenced today, along withupdated curves. It is important to note that these curves are based on “average traffic speed”, andNOT posted speed limits. In fact, as is repeatedly shown, one of the most important facts aboutspeed limits is that they generally have minimal effect on average traffic speed. Keep the namesSolomon and Cirillo in mind - they are very frequently referenced in traffic safety publications,and are found later in this Report.
A major problem of this Author is keeping control of the massive amounts of useful informationthat can be presented in the following sub-sections. Some of it is repetitive, and it may be OK to

-6-
“skip around” a bit within the next four sub-sections. But bear in mind that this information isimportant to our personal safety and that of others on the road.
1.3 Common Misconceptions about Traffic Safety and Speed Limits[SEARCH: (“common misconceptions” + “speed limit”), (“common myths” + “speed limit”),(“common misconceptions” + “traffic safety”), etc., etc.]
Deaths per Year versus Deaths per 100 Million Miles Driven (MMD): The use of Deaths perYear can be quite misleading, particularly in terms of Risk, which is the major concern here. Forexample, Deaths per Year can increase in the next year, but at the same time, Deaths per 100MMD can - and often does - DECREASE. The reason for the increase is that more miles aredriven in that next year while the DECREASE reflects an increase in actual safety, primarily dueto improved highways and vehicles. Thus, Deaths per 100 Million Miles Driven is a much bettermeasure of actual driving Risk.
This one-page document is from the Institute of Transportation Engineers (ITE): http://www.ite.org/standards/speed_zoning.pdf
This is a two-page paper from the ITE, “TIPS” on “Lower Speed Limits”.http://www.ite.org/pdf/lower-speed.PDF For example, “Why not lower the speed limit to reduce hazards in our area? . . .“Second, some drivers will obey the lower posted speed while others will feel it’s unreasonableand simply ignore it. This disrupts the uniform traffic flow and increases accident potentialbetween the faster and the slower drivers. Research has shown that when vehicles travel aboutthe same speed, accidents are minimized.”
A traffic safety message from the Phoenix Street Transportation Dept, via the ITE, athttp://www.ite.org/traffic/documents/Phoenix/LowerSpeedLimit.pdf“If an unreasonably low speed limit is posted, most drivers will ignore the signs, while a few maytry to stay within the posted speed limit. This causes real safety concerns because of thedifference between faster and slower drivers.”
A brief speed limit perspective on pages 2, 3 and 4 of,http://www.westernite.org/Sections/itesocal/Meeting_Flyers/Meeting%20Presentations/ITE_June%202009%20-%20Speed%20Limit%20Update.pdf“Numerous before-and-after studies and research throughout the country have consistentlydemonstrated that there are no significant changes in traffic speeds following posting of new orrevised speed limits.”
Here is a one-page perspective from “The Official Website of the City of Novi, Michigan.”http://cityofnovi.org/Services/NeighborhoodServices/SpeedLimit-TIAEstablishSpeedLimits.pdf“Studies show that the more drivers deviate from the 85th percentile speed, the more likely theyare to become involved in accidents.”Andhttp://cityofnovi.org/Services/NeighborhoodServices/SpeedLimit-TIALowerSpeedLimits.pdf
-7-
Other traffic-safety Fact Sheets may be found at their,http://search.blossom.com/query/Xp3/252/link2/type0/pdf0?key=Traffic+Improvement+Association
Here is a similar two-page Brochure on speed limits from the Kansas DOT:http://opkansas.org/_Assets/pw/speed_limits.pdf
Here is a web page from the other end of the U.S., Foxborough, MA, “Speed Control Methods”:http://www.townfoxborough.us/Pages/FoxboroughMA_Police/methods
Here is an 11-page presentation from the ITE Southern CA Section. Note pages 2, 3, 4 and 6.http://www.westernite.org/Sections/itesocal/Meeting_Flyers/Meeting%20Presentations/ITE_June%202009%20-%20Speed%20Limit%20Update.pdf
This is a two-page traffic safety paper from the City of Phoenix, AZ:http://www.ite.org/traffic/documents/Phoenix/LowerSpeedLimit.pdf
This NMA web page on “Speed Limits” is the equivalent of about 2 pages and provides severalperspectives on the subject. This website is that of the National Motorists Association (NMA).There are several other summary-type web pages on the NMA web site in the next sub-section.http://www.motorists.org/speedlimits/home/the-truth-about-speed-limits/
This is a 1996 draft from the ITE’s 4M-25 Committee on Speed Zoning, via the NMA:http://www.motorists.org/speedlimits/home/a-recommended-speed-zoning-practice/It is discussed in Section 3.6 below.
1.4 Understanding Traffic Safety - Discussion & Sources[Search: “traffic safety” + “speed limit”][Advanced Search: “traffic safety” + “speed limit” site:.edu]
The sources presented in this section (and in the above searches) are somewhat more lengthythan those above, and are thus broader in scope and present more detail on the subject.
From the Delaware County, OH County Engineer, “Speed Limits”:http://www.co.delaware.oh.us/engineer/Design/speedlimits.htmStarting about 1/3 the way down is, “WHY DO WE EVEN HAVE SPEED LIMITS?”, and so on.
A brief overview of speed limit problems is, “Restoring Speed Limit Credibility”, by JamesWalker, President, JCW Consulting, in 2000, athttp://www.motorists.org/speedlimits/home/restoring-speed-limit-credibility/Another summary-type web page on the NMA web site is: “Do Speed Limits Matter?”, athttp://www.motorists.org/speedlimits/home/do-speed-limits-matter/

-8-
Via the Highway Safety Group is a 1996 slide presentation from the Federal HighwayAdministration (FHWA), by Davey L. Warren, Office of Safety and Traffic Operations R&D.http://www.hwysafety.com/FHWA96_nev_speedworkshop.pptAlthough 32 pages long, it’s a very fast read. Pay particular attention to pages 11, 12, 18, 19, 20,21, 22. On p11, note that risk is minimum (red line) at about 3-4 mph above the average trafficspeed. On p12, note that the risk is minimum between the 85th and 90th Percentiles, and notealso that the higher risk levels are the SLOWEST speeds, those below the 15th Percentile. Onp18, “Raising [speed] limit has little effect on prevailing speed of traffic”, and on p19,“Lowering limit doesn’t slow traffic”. On p21, note the Driver Compliance bars for the postedspeed limit changes of 5 to 15 mph. And on p22, note reduced Percent Change in Crashes thatresulted from “Raising the Speed Limit”. This last page illustrates the falsity of the old slogan,“speed kills” and conversely, that an artificially low speed limit causes an increase in theaccident rate. Slides from pages 18-22, on speed limit change effects are presented in sub-section 3.5 below.
For those that appreciate good graphics that show speed and safety relationships, Canada’s“SENSE”, is one. For example: http://www.sense.bc.ca/research.htmNote that this page references the (U.S.) ITE and other U.S. research publications, and presentsbrief, “nut shell” quotes from many of them. Other SENSE articles can be found at,http://www.sense.bc.ca/text.htmSENSE references much information from the U.S., e.g., “Do Higher Speed Limits CauseAccidents, What About All The Studies From The US?”, athttp://www.sense.bc.ca/disc/disc-09.htm
From the Arizona Department of Transportation, is this ‘Establishing Speed Limits - A Case of"Majority Rule"’ web page, roughly equal to two pages:http://www.azdot.gov/highways/traffic/Speed.aspThe Kansas DOT has essentially the same information in their web page at:http://www.ksdot.org/burTrafficSaf/brochures/EstablishingSpeedLimits.aspAnd their PDF file at:http://www.ksdot.org/burTrafficSaf/brochures/pdf/speedlimitspb.pdf
Another perspective is from TranSafety, Inc., in their 1997 Auto and Road User Journal, “StudyShows That Motorists Drive at Reasonable Speeds:http://www.usroads.com/journals/aruj/9709/ru970901.htm
1.5 “Speed Variance” and Accident Rates[Search: "speed limit" + "speed variance"]
In the above references, we’ve already seen mention of the phrase, “Speed Variance”. Thissubject can become quite technically complex, and much of the research is both complex andlengthy. However, there are some ways around the complexity.
Again from Canada’s “SENSE” is, http://www.sense.bc.ca/disc/disc-11.htm, which againreferences U.S. research, including the next Reference.

-9-
In 1988, Garber and Gadirau, of the Dept. Of Civil Engineering of the University of Virginia,produced a Report for the AAA titled, “Speed Variance and Its Influence on Accidents”. Theirfirst Conclusion on p34 (of 65) was, “Accident rates increase with increasing speed variancefor all classes of roads.” Their second Conclusion was, “Speed variance on a highway segmenttends to be a minimum when the difference between the design speed and the posted speed limitis between 5 and 10 mph”. And their fourth Conclusion was, “The difference between thedesign speed and the posted speed limit has a significant effect on the speed variance”. ThisReport may be found at:http://www.eric.ed.gov/ERICWebPortal/custom/portlets/recordDetails/detailmini.jsp?_nfpb=true&_&ERICExtSearch_SearchValue_0=ED312438&ERICExtSearch_SearchType_0=no&accno=ED312438
The first page of this four-page document from the Virginia DOT, “Variance in Speed, Not theSpeed Limit, Poses Greatest Risk on Interstate Roads”:http://www.virginiadot.org/projects/resources/newsl-I81-winter00%20.pdf
The Connecticut DOT, halfway down on their web page, along with other useful information, hasthe Q&A:“WILL LOWERING THE SPEED LIMIT REDUCE ACCIDENT FREQUENCY?“NO. Although lowering the speed limit is often seen as a cure-all in preventing accidents, this isnot the case. Accidents are most often the result of driver inattention and driver error.“If a posted speed limit is unrealistically low, it creates a speed variance (i.e. some drivers followthe speed limit while most drive the reasonable speed). This speed variance can contribute toaccidents.” http://www.ct.gov/dot/cwp/view.asp?Q=259744&a=1380A similar two page flyer is from the Minnesota DOT:http://www.dot.state.mn.us/speed/SpeedFlyer2002.pdf
A 2004, 22-page Paper by Park and Ritchie of the University of California at Irvine, “Exploringthe Relationship between Freeway Speed Variance, Lane Changing and Vehicle Heterogeneity”.From the Abstract (p2): “Out of these factors, speed variance is known to be highly correlatedwith the potential or actual accident rate.” And from the Introduction (p3): “Speed variance hasbeen found to be one of the major, if not the major, factor related to the road accidentfrequency.” Also see p5: “Elmberg’s (13) study shows that the conflict between road geometrywith corresponding speed limit tends to create high speed variance. In other words, a low speedlimit with good geometry will result in a wide range of speeds on the highway, which inturn will lead to an increase in accident rate. Garber et al (7, 14) proved that the differencebetween design speed and posted speed has significant effect on speed variance . . .”http://www.its.uci.edu/its/publications/papers/CTSS/UCI-ITS-TS-WP-04-4.pdf
Again from the NMA, a 2000 long article on “Safety & Setting Speed Limits”, by Dornsife:http://www.motorists.org/speedlimits/home/safety-setting-speed-limits/
From the National Academies Press, Appendix C of the TRB Special Report 254: http://books.nap.edu/openbook.php?record_id=11387&page=277p91 Footnote:

-10-
“8 At least two additional measures of speed dispersion are available for calculating operatingspeed as a basis for setting speed limits. The first is the pace speed . . . The second is theskewness of the speed distribution. Research by Taylor (1965) found a strong relationshipbetween the rate of occurrence of crashes and a skewed (i.e., nonnormal) speed distribution onrural state highways. Hence, he argued that the appropriate speed for a speed zone should bebased on changing the speed distribution from a nonnormal to a normal distribution by a“before” and “after” analysis of the actual speed distribution within the zone (Taylor 1965,51).” Also, from p123 & 124):. . . Increased skewness or dispersion in speed distributions has been associated with a higherrisk of crash involvement (Solomon 1964; Taylor 1965; Cirillo 1968; Harkey et al. 1990).
2. THE SPOT SPEED STUDY
A Google search was performed using the phrase, “spot speed study”, which resulted in about29,000 hits on 10/2/09. A partial list of the links to publications on proper Spot Speed Studymethods and procedures is as follows:
From the Massachusetts Institute of Technology:http://mit.edu/~cfc/www/CE452/Spot%20Speed%20Study.pdf
From the Iowa State University (ISU), Center for Transportation Research and Education (nowthe ISU Institute for Transportation), Handbook of Simplified Practice for Traffic Studies:http://www.ctre.iastate.edu/pubs/traffichandbook/index.htmAlso from the ISU, Center for Transportation Research and Education:http://www.ctre.iastate.edu/PUBS/traffichandbook/2SpotSpeed.pdfAnd:http://www.ctre.iastate.edu/educweb/ce355/Lectures/Speed_Studies_Handout.pdfAnd:http://www.ctre.iastate.edu/educweb/ce553/Speed_Studies_Handout.ppt.
Also from the ISU new Institute for Transportationhttp://www.intrans.iastate.edu/ltap/tech_news/2004/sep-oct/spot_speed.htmAnd:http://www.intrans.iastate.edu/pubs/traffichandbook/appA.pdf
From the University of Massachusetts Amherst, College of Engineering:http://www.ecs.umass.edu/umasssafe/PDFS%20for%20Site/Spot%20Speed%20Manual.pdfFrom the University of Massachusetts Amherst, College of Engineering:Also From Umass-Amherst:http://www.ecs.umass.edu/umasssafe/PDFS%20for%20Site/Draft%20%20Spot%20Speed%20Study%20Training.pdf
From the Brigham Young University, College of Engineering & Technology:http://class.et.byu.edu/ce361/CE361%20Lecture%20Topics_files/Lec7_%20Ch4_pp83-98%20speed%20studies.ppt
-11-
And:http://www.et.byu.edu/~msaito/CE562MS/.../LAB1-Spot-Speed-Study.doc
From the Florida Department Of Transportation, State Traffic Engineering and OperationsOffice:http://www.dot.state.fl.us/trafficoperations/Operations/Studies/Speed_Zoning_for_Highway.pdfAnd:http://www.dot.state.fl.us/TrafficOperations/Operations/Studies/MUTS/Chapter13.pdf
From the U.S. Army, Transportation Engineering Agency:http://www.tea.army.mil/pubs/nr/dod/bulletins/SpeedLimits(Oct06).pdf
From Portland State University, Maseeh College of Engineering and Computer Science:https://wiki.cecs.pdx.edu/pub/Main/SlidesCE351/Lecture_7-1.pdf
Although there are many more such references available on the Web, the Author regards these,plus other more technical/detailed References, as sufficient to adequately perform a proper SpotSpeed Study.
Thus, the requirements for the performance of a proper Spot Speed Study are:1. The measuring system must be accurate and not be apparent to drivers.2. Preferably on a weekday.3. Location on a “representative” part of the road segment, e.g., not on a curve.4. Each measured vehicle must be “free-flowing”, i.e., very light traffic, not running behind a vehicle ahead, i.e., completely unimpeded.5. At least 100 measurements.6. At least 1,000 feet from a traffic light or other free-flow impediment.7. Good weather, dry road surface.
As stated above, the Author does not consider a Spot Speed Study to adequate for a speed limitchange, even though many government agencies do. But he DOES consider the Spot SpeedStudy sufficient to identify in improper speed limit and to require a comprehensive analysis.Human lives are affected by speed limits and their changes, and best practices are necessary.
Due to a high level of enforcement, the data taken in this Study is SKEWED LOW.
2.1 Methodology
This stretch of highway was upgraded about ten years ago, which included widening for the turnlane, the sidewalks, street lighting, etc., where prior to this upgrade it was simply a 4-lanehighway with no sidewalks, and had a 45 mph posted speed limit, unchanged when constructionwas completed. The Author does not know the design speeds of either the old or newconfigurations. Overall, the road is in very good condition. There are no hills, and essentially nocurves.
-12-
Two hundred stopwatch measurements were taken on New Mexico Highway 47 (Bosque FarmsBlvd.) of northbound traffic as it passes through the Village of Bosque Farms, at the BosqueFarms Flea Market. The posted speed limit is 45 mph. Due to the wide angle between thestopwatch reference points, a separate measured distance of 793 ft and 862 ft for the left and rightlanes, respectively, was obtained, and roughly half the measurements were taken for each of thelanes. The visual reference points were easily-seen street-light and sign poles. A pronouncedeffort was made to ensure that each chosen subject vehicle was in fact “free-flowing”.
Prior to these measurements, “practice” was acquired, in the taking of 100 measurements onLillie Drive (25 mph posted speed limit). The data and results are given in Appendix A, whichshows an average speed of 29.7 mph, and that 12% of the vehicles traveled at or below theposted speed limit, thus with 88% of the vehicles “in violation” of this artificially low limit.
2.2 Data Acquisition
The data was collected using a calibration-checked (National Institute of Standards andTechnology radio station WWV @ 10 MHz) stopwatch (error is insignificant) on Nov. 2, 3 and 4in mid-afternoon during very light (free-flow) traffic conditions, for the north-bound traffic only.
When the 200 pieces of data were in hand, they were entered into a spreadsheet, which was usedfor calculating the various results.
Due to a high level of enforcement over many years, the data taken in this Study is SKEWEDLOW. The Author does not possess the required specific training and long experience toaccurately estimate just HOW LOW the data is skewed as a result of the widely and long-knownhistory of vigorous enforcement. Nevertheless, 3-5 mph intuitively “feels right”, but is perhaps abit low (conservative).
2.3 Data analysis and results
The validity of the data may be casually and simply verified by using a GPS or GPS calibration-checked speedometer and traveling northbound from the South Loop at 40-45 mph during verylight traffic conditions, waiting to be passed, speeding up and “clocking” the other vehicle. Usingthis method, as the Author has repeatedly done, one will find that most vehicles travel in the high40's to low 50's mph range.
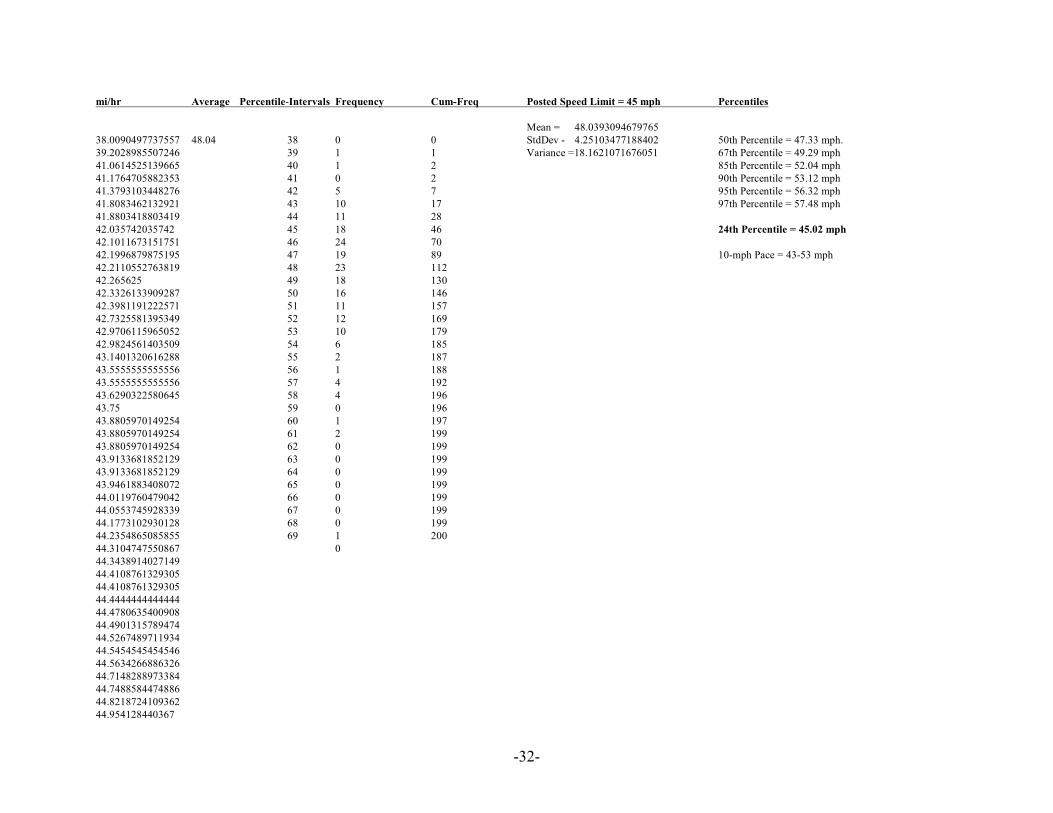
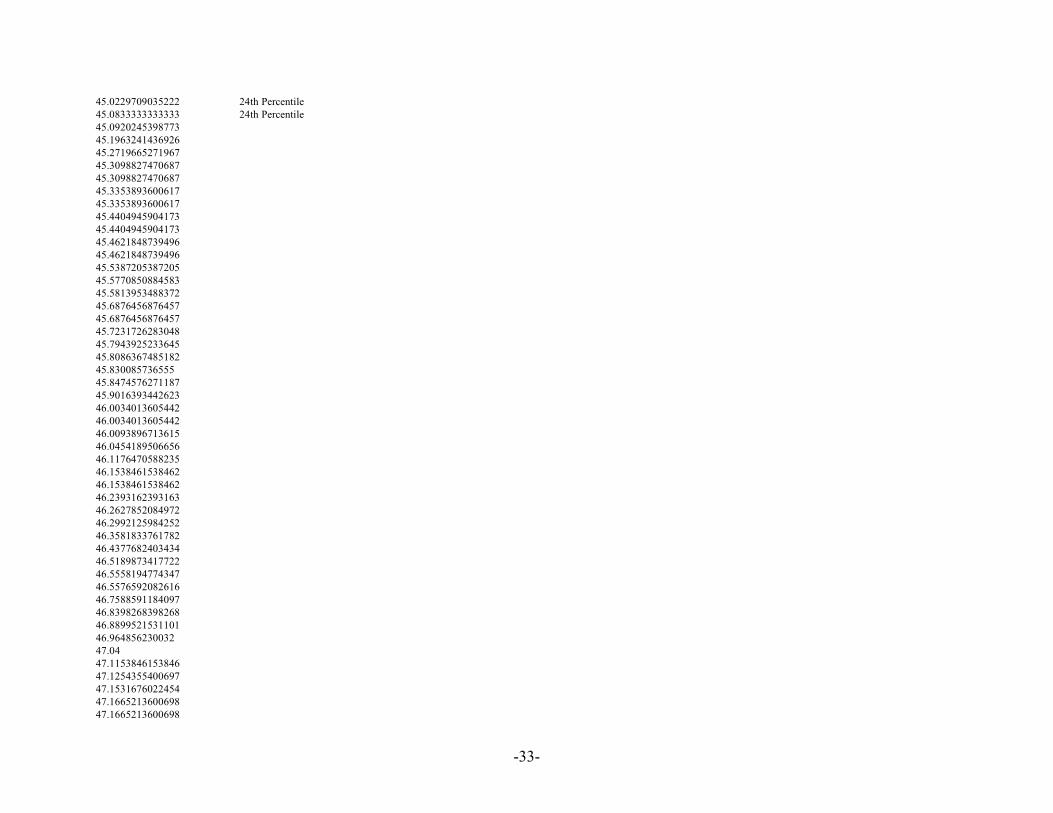
From the 200 time measurements, the speeds were calculated and placed in ascending orderusing a spreadsheet. The data and results are presented in Appendix B.
The Range of speeds is 38-68 mph.The average speed is 48 mph.The 10-mph Pace is 43-53 mph.The Variance is 18.2.The Standard Deviation is 4.25 mph.

-13-
Percentile speeds: For speeds in ascending order, the mid-point would be the 50 Percentile. Thatth
is, if there were 100 speeds, the mid-point would be half way, or at the 50% point. Similarly, the75 Percentile would be the 75 measurement. In this case, since 200 speeds are used, the 50th th th
Percentile, for example, is at the 100 speed. Pertinent percentile speeds are:th
50 Percentile = 47.3 mph.th
67 Percentile = 49.3 mph.th
85 Percentile = 52.0 mph.th
95 Percentile = 56.3 mph.th
The 24 Percentile is 45.02 mph - the posted speed limit. Thus, 24 percent of the free-flowingth
vehicles measured were at or below the posted speed limit, and 76 percent were travelingABOVE the posted speed limit.
A Frequency Distribution chart and a Cumulative Distribution chart are shown in the followingtwo charts.

-14-
3. DISCUSSION
3.1 Discussion of Results
The following Discussion is based on the assumption that the data obtained in this Study is infact representative and even though the New Mexico DOT, in its March, 2008, “Signing andStriping Manual” DOES say that it’s enough for setting speed limits, the Author of this paperdisagrees, because a formal analysis and its results would affect real safety and hence real lives,he believes that a much more thorough study should be performed. However, the data, itsanalysis and results are assumed to be representative of actual traffic conditions.
The 45-mph posted speed limit occurs in the 24 Percentile, which is far below the 85th th
Percentile speed of 52 mph. The number of technical violators is therefore 76%, which is far toohigh.
The average speed is 48 mph, 3 mph above the posted speed limit.
The 10-mph Pace is 43-53 mph. Recommended guidelines suggest using the 85 or 90th th
Percentile, or the upper limit of the 10-mph Pace speed. Using the 85 Percentile criteria, theth
posted speed limit should be 50 mph, and using the 10-mph Pace, 55 mph, keeping in mind thatthe overall measurements are skewed low as stated above.

-15-
Presuming the data taken here is in fact representative, based on the MUTCD, the rounded-down85 Percentile should be used, which is 50 mph, but not below the 67 Percentile of 49.3 mph,th th
which also gives 50 mph, which is in the 74th Percentile, but that still means that 25% of driverswould be in technical violation.
3.2 “Safe” versus “Un-Safe” Traffic Speeds.
Based on the many references reviewed by the Author, and based on the data, it’s a “toss-up” atthis point between a new posted speed limit of 50 or 55 mph, but tending toward 55 mph. Sincethe focus of this Study is solely that of traffic SAFETY, it would be reasonable in this case toattempt to answer the converse question, i.e., what speed constitutes UN-SAFE speeds? Since“safe” verus “unsafe” is not an “either/or” but more a “shades-of-grey” situation, it may be moreaccurate to ask, what ranges of speeds can be judged “safe enough” and NOT “safe enough”within the safety-intent of the law?
The Author has obtained a number of Solomon/Cirillo-type curves. One aspect of such curvesthat has seldom been mentioned is that a horizontal line drawn from one side of the curve to theother is a “constant-risk”, or an “equivalent-safety” line. For example, if we pick a point on thecurve of, say, 10 mph BELOW the average traffic speed, then draw a horizontal line to the rightfrom that point to the other side of the U-shaped curve, and then a vertical line drawn from thatpoint straight down, it will show the approximate, equally-safe higher speed.
This process must be used carefully, because every highway has its own U-shaped curve, each ofwhich will vary slightly from others and those in the references. For example, Solomon based hiscurve on mostly 2-lane highways, and in 1964. Julie Cirillo based hers on interstate highways in1968. Since our Highway 47 is a 4-lane highway with a center turn lane, neither of these twocurves is exactly representative, and this is further compounded by the safety improvements invehicles and highways that have occurred since the 1960's, which would shift both curves downand right. If the down/right shift were to be shown in these two curves, we would expect thatHighway 47 would fall between the two, and closer to the (new) Solomon curve, because aninterstate highway is much more different from HWY 47 than Solomon’s mostly 2-lane curve.Nevertheless, the SHAPES of these curves don’t change much.
What follows is the use of an imaginary horizontal line on several examples of typical U-shapedcurves in an effort to find an estimate of an equally-safe higher speed for a lower speed known tobe “acceptably” safe. This would in turn show a higher speed that is not UN-safe.
The following U-shaped curves show the risk versus variation from average traffic speed. In thisStudy, the average traffic speed is 48 mph. The low end of the measured speed range of 38 mphis assumed to be acceptably safe by those that set and enforce the 45-mph speed limit. That is, thenumber of drivers traveling at 38 mph are NOT likely to be cited for this speed because they arenot violating the speed limit. Recall that these curves are based on average traffic speed, and noton posted speed limits.

-16-
The original Solomon (1964) curve comes viaFrith and Patterson (2001). Using the “Daytime”curve, 38 mph occurs at the “-10" mark, anddrawing a horizontal line to the right from thispoint on the curve gives an equally-safe higherspeed of approximately 48 + 18, or 66 mph.[Solomon, D (1964) Accidents on Main RuralHighways related to speed, driver and vehicle.US Department of Commerce & Bureau ofPublic Roads, Washington DC.]
From the Kansas DOT,http://www.ksdot.org/burTrafficSaf/brochures/pdf/speedlimitspb.pdfWith 38 mph again at the “-10" mark, the equally-safe higher speed is approximately 48 + 15, or63mph.
From the Turner-FairbankHighway Research Center of theUS-DOT’s Federal HighwayAdministration (FHWA), is the1998 Report, “Synthesis ofSafety Research Related toSpeed and Speed Limits”.[http://www.tfhrc.gov/safety/speed/speed.htm]. The Authorpicked Fig. 4, the Harkey et al.curve based on the documentdescription, by printing thefigure and hand-drawing thatcurve. For this curve, theequally-safe higher speed isapproximately 48 + 16, or 64

-17-
mph. Note that the Institute of Transportation Engineers brochure referenced in the“Misconceptions” section above also uses this curve.
From the US DOT’s FHWA, at the“Nevada Speed ManagementWorkshop”, April, 1996:
For this curve, the equally-safe higherspeed is approximately 48 + 17, or 65mph.
This chart is from the same FHWApresentation and instead of averagetraffic speed, and uses percentiles.The minimum risk occurs betweenthe 85 and 95 Percentiles, andth th
from the data here, about 52-56mph. The equally-safe higher speedappears to be “off the chart”.

-18-
From the US DOT’sFHWA Report#FHWA/RD-85-096:Using either the bottom ortop curve, the equally-safehigher speed isapproximately 48 + 17, or65 mph.
The five, approximate equally-safe higher speeds are 66, 63, 64, 65 and 65 mph. Therefore, avehicle at a free-flow speed of about 64-65 mph travels - under good traffic and road conditions -at about the same risk-level as an “equally-safe” vehicle traveling at 38 mph. Intuitively, thishigher speed may seem to be excessively high, but not when we consider that the posted speedlimit could easily be 10 mph too low - then it would be only “ten over”.
3.3 The Shape of the Above Frequency Distributions.
In the Data Analysis and Results section, it will be noted that the “shape” of the FrequencyDistribution is non-normal, i.e., not symmetrical around the peak. Neglecting the single highest68-mph measurement, the distance from the peak to the right side is about twice the mph-widthas that to the left, i.e., the distribution is skewed positive. The effects of such lop-sided curveswere described in “An Investigation of Issues Related to Raising the Rural Interstate Speed Limitin Virginia”, by Jernigan, Lynn & Garber, March, 1988.[http://www.virginiadot.org/vtrc/main/online_reports/pdf/88-r17.pdf]It states: (p21). . . Roadways on which speed distributions are symmetrical tend to be safer than those that haveskewed distribution. It will be shown later in the crash severity section [p38/46] of this reportthat the more skewed a speed distribution is, the higher the accident rate. This theory was

-19-
postulated by Taylor (3)[1964] from the results of a study in which he found out that accidentrates were higher in areas in which speed distributions were not symmetrical:
1. There is a strong relationship between the rate of occurrence of accidents and thespeed distribution on rural state highways. The accident rate is significantlyhigher where the speed distribution is non-normal, and the accident rate isreduced when the distribution is changed to a normal one.
2. The best parameter to use in determining non-normality is the skewness of thedistribution.
3. Changing the speed distribution from non-normal to normal results in an accidentrate reduction that is about twice that found under any other set ofbefore-and-after conditions.
4. Warrants for speed zoning should be established that include the speed distribution asa factor.
5. The "before" speed distribution alone is not adequate as a warrant for speed zoning.
From p39:The probability of being involved in a crash has been shown to be related to speed distributionrather than to average speed. The theoretical relationships have been proven by a number ofaccident analyses. The greater the variation in speed of any vehicle from the average speed ofall traffic, the greater its chances of being involved in an accident (14,15). Thus, the moreuniform the speeds, the safer the driving conditions. Accident involvement rates as well asinjury and fatality rates have been shown to vary directly with the standard deviation oftraveled speeds (16). One explanation for this is that the accident involvement rate is alsocorrelated with the number of overtaking maneuvers (17). The number of overtaklngs isminimized when vehicles travel at the median speed. The more the vehicle's speed differs fromthe median either way, the more the number of overtakings increase. Additionally, feweraccidents occur on roadways on which the distribution of speeds is symmetrical, rather thanskewed in one direction or the other (3,18). [Emphasis is by this paper’s Author.]
On the above Frequency Distribution (p14), if a curve were drawn using the tops of the bars as aguide, it would look like a positively-skewed, non-normal distribution, or skewed “bell-shaped”curve. But many speed-limit references say that this curve should be symmetrical, or skewed a bitnegative for a properly set speed limit combined with a reasonable level of enforcement. If onewere to take pencil in hand and “correct” this curve to be both narrower and symmetric, with ahigher peak while keeping the area under the curve constant, what would it look like? Neglectingthe single 68-mph value and using a new range of 38-61 mph, the peak would shift from about44-45 mph up to about 49-50 mph, or about a 5-mph increase in the 50 Percentile speed toth
about 52 mph. The 85 Percentile would then be roughly 55-56 mph, and the 10-mph Pace wouldth
become about 45-55 or 46-56 mph. Admittedly, these values are approximate, but given thesafety and mathematical requirements, the Author believes them to be quite close, and the newcurve would likely show a low speed limit but with a reasonable level of enforcement, and wouldresult in an increase in safety compared to the existing curve and the real traffic conditions itdescribes. In this rough estimate, the safest speed limit would be 55 mph.
Many references describe the effect of artificially low speed limits - without mentioning highlevels of enforcement - as increasing speed variance, which means a broadening of the speed

-20-
distribution curves. It is therefore probable that vigorous enforcement is the primary contributorto the positive skewness shown in this analysis. Imagine the effect on a driver who is aware ofthe “Speed Trap” of Bosque Farms: the driver is driving at 44-46 mph, focusing on his/herspeedometer and looking ahead and in the rearview mirror for police cars, which reduces theattention paid to actual driving, while frequently being overtaken and passed by faster, saferdrivers. This obviously increases both overtakings and speed variance. It’s both technically andintuitively obvious that these effects combine to increase the accident rate.
As shown in the Results section, e.g., the posted speed limit occurs at the 24 Percentile, theth
average speed is 3 mph ABOVE the posted limit, the Conclusion section below will state that theposted speed limit is without a factual safety basis, and does satisfy the definition of a “speedtrap”.
3.4 Some Additional Quotes on Speed Limits and Their Effects
University of Nebraska Lincoln, Research Report No. TRP-02-26-92 “Evaluation of LowerSpeed Limits on Urban Highways”, by McCoy et al., 1993:SAFETY EFFECTSThe results of the analysis of the accident experience in speed zones indicate that zones withposted speed limits equal to the reasonable speed limits proposed by the NDOT method ofspeed zoning are safer than zones posted with limits that are 5 and 10 mph below thereasonable speed limits. Speed zones with speed limits 5 mph below the reasonable speed limitswere found to have 5 percent more accidents than zones with reasonable speed limits. Speedzones with speed limits 10 mph below the reasonable speed limits were found to have 10percent more accidents than zones with reasonable speed limits. Therefore, the speed zones onstate highways in urban areas should be posted with reasonable speed limits proposed by NDORmethod in order to minimize the numbers of accidents in the speed zones. Speed limits lower thanthe reasonable speed limits should not be posted. [Emphasis is by this paper’s Author.]
Based on the analysis thus far, the current speed limit is artificially low and should be increasedto either 50 or 55 mph, a decision that, in this Author’s opinion, would require additionalanalysis. Based on the above reference, the existing accident rate is from 5 to 10 percent higherthan it would be without the artificial speed limit. Note that these increased accident rates DONOT include the heavy enforcement that characterizes speed traps, which increases speedvariance even further. Thus, the increased accident rate for THIS situation could easily be greaterthan the 10 percent shown in the above Research Report.
FHWA Speed Limit Synthesis - Technical SummarySynthesis of Speed Zoning Practice, Report Number FHWA/RD-85/096, July 1985US Department of Transportation, Federal Highway Administration Turner-Fairbank Highway Research CenterConclusionBased on the best available evidence, the speed limit should be set at the speed driven by 85 to90 percent of the free-moving vehicles rounded up to the next 5 mph increment. This methodresults in speed limits that are not only acceptable to a large majority of motorists, but also fall

-21-
within the speed range where accident risk is lowest. Allowing a 5 mph tolerance, enforcementwould be targeted at drivers who are clearly at risk.No other factors need to be considered since they are reflected in the drivers' speed choice. . .
This Study data (skewed low) shows the 85 and 90 Percentiles to be 52 and 53 mph,th th
respectively, and “rounded up” results in a speed limit of 55 mph. Also, based on the “re-draw”of the Frequency Distribution curve discussed above, these Percentile numbers would likelyincrease to about 55 and 56 mph, respectively, which further supports a 55 mph speed limit.
3.5 Speed Limit Change Effects from the 1996 Nevada Speed Management Workshop andthe 1998 “Synthesis” Report.
The 1996 presentation, referenced above (p8) in the “Understanding Traffic Safety - Discussion& Sources” sub-section, was by Davey L. Warren, Office of Safety and Traffic Operations R&D,of the Federal Highway Administration. Pages 18-23 are discussed as follows:
Pages 18 and 19 show that neither raising nor lowering speed limits has a significant effect ontraffic speed:
Page 20 shows the minimal effect on driving behavior, and page 21 shows before and after speedlimit compliance that result from correcting speed limits to more correct values.

-22-
Most important of all for the purposes of this Study is page 22, which shows that improperlylowering speed limits INCREASES crashes, and properly raising speed limits DECREASEScrashes, and these references DO NOT address the speed trap characteristic of heavyenforcement.
Page 23 states the presentation conclusions as:“O Most speed limits set unreasonably low
Make technical violators out of large percent of motorists driving at safe speed.”“O Current speed limits do not reflect accident risk
Inconsistent with traffic law systemMisallocates enforcement resources”
“O Most motorists drive at a speed road and traffic permits regardless of posted speedDon’t automatically drive 5 mph over limit”
“O Speed limits have lost their informational valueEngineering of credible limits which are appropriate and enforceable the key tomanaging risk”
These references are:http://www.hwysafety.com/FHWA96_nev_speedworkshop.ppt http://www.tfhrc.gov/safety/speed/speed.htm#ssrel

-23-
Note that Figure 7 in the second reference matches page 20 in the first. Pertinent quotes are:Parker (1997) , taking advantage of routine speed zoning changes being made by State and localagencies, evaluated the effects of raising and lowering speed limits by various amounts at 98non-freeway sites in 22 States.
Free-flow speeds were measured for a 24-hr period before the speed limit was altered and on thesame day of the week about one year later. Before and after speeds were measuredsimultaneously at comparison sites where speed limits were not altered to control for timetrends. As shown in figure 7, raising and lowering speed limits had little or no effect on speeds.Although maximum speed changes up to 3 mi/h (5 km/h) were observed at individual sites, theaverage change in the mean and 85th percentile speeds was less than 1 mi/h and similar tosites that were not changed.
Parker (1992) found little change in crashes on low and moderate speed roads in Michiganwhere speed limits were altered under the State's normal speed zoning process. For the 21 siteswhere the speed limit was increased, crashes decreased about 3 percent compared to sites notchanged. Crashes also decreased approximately 2 percent at the 47 sites where speed limitswere lowered. Neither change was statistically significant. [Emphasis is by this paper’s Author.]
The References are: M. R. Parker, Jr., "Synthesis of Speed Zoning Practices.," Report No. FHWA/RD-85/096,Federal Highway Administration, Washington, DC, 1985.
M. R. Parker, Jr., "Effects of Raising and Lowering Speed Limits on Selected RoadwaySections," Report No. FHWA-RD-92-084, Federal Highway Administration, Washington, DC,January 1997.
Note that “enforcement resources” are by no means limited to speed limit enforcement, or forthat matter traffic-law enforcement, e.g., drug abuse, burglaries, etc., etc.
3.6 Other Speed limit Policy References.
From the U.S. DOT’s Federal Highway Administration’s Report No. FHWA/RD-85/096Technical Summary, "Synthesis of Speed Zoning Practice" which states:Based on the best available evidence, the speed limit should be set at the speed driven by 85 to90 percent of the free-moving vehicles rounded up to the next 5 mph increment. This methodresults in speed limits that are not only acceptable to a majority of the motorist, but also fallwithin the speed range where accident risk is lowest.No other factors need to be considered since they are reflected in the drivers speed choice.[Emphasis is by this paper’s Author.]
Based on the measurements here, this reference would require a speed limit of 55 mph for at leastthis segment of Highway 47.

-24-
From the American Association of State Highway and Transportation Officials (AASHTO) :A 1969 “Resolution of the annual meeting of the American Association ofState Highway Officials”On the basis of the forgoing review, the Subcommittee on Speed Zoning recommends to theAASHTO Operating Committee on Traffic for consideration as an AASHTO Policy on SpeedZoning that:The 85th percentile speed is to be given primary consideration in speed zones below 50 milesper hour, and the 90th percentile speed is to be given primary consideration in establishingspeed zones of 50 miles per hour or above. To achieve the optimum in safety, it is desirable tosecure a speed distribution with a skewness index approaching unity.
Based on the measurements here, and the above Frequency Distribution “correction”, thisreference would require a speed limit of 55 mph for at least this segment of Highway 47.Furthermore, the 1969 publication year shows that the 85 Percentile method to have been in useth
as accepted practice for at least forty years.
From the Institute of Transportation Engineers (ITE) Committee 4M-25, Speed Zone Guidelines,Draft version referenced via the Transportation Research Board of the National ResearchCouncil. http://trb.org/publications/nchrp/nchrp_rpt_500v5.pdf, “Guidance for Implementation of theAASHTO Stratagic Highway Safety Plan”, which in turn references:http://www.ibiblio.org/rdu/ite-szg.html2. The speed limit within a speed zone shall be set at the nearest 5 mph increment to the 85thpercentile of free flowing traffic or the upper limit of the pace of the 10 mph pace. . . In no caseshould the speed limit be set below the 67th percentile speed of free flowing traffic.It would be premature to draw any firm conclusions since the research is still underway.However the findings to date suggest that, on average, current speed limits are set too low to beaccepted as reasonable by the vast majority of the drivers. Only about 1 in 10 speed zones hasbetter than 50 percent compliance. The posted limits make technical violators out of motoristsdriving at reasonable and safe speeds. For the traffic law system to minimize accident risk, then speed limits need to be properly setto define maximum safe speed. Our studies show that most speed zones are posted 8 to 12 mi/hbelow the prevailing travel speed and 15 mi/h or more below the maximum safe speed.Increasing speed limits to more realistic levels will not result in higher speeds but wouldincrease voluntary compliance and target enforcement at the occasional violator and high riskdriver. [Emphasis is by this paper’s Author.]
From the California State Traffic Manual, Chapter 8:http://www.dot.ca.gov/hq/traffops/signtech/signdel/pdf/TMChapter8.pdf.Speed limits established on the basis of the 85th percentile conform to the consensus of thosewho drive highways as to what speed is reasonable and prudent, and are not dependant on thejudgement of one or a few.And:
Further studies have shown that establishing a speed limit at less than the 85thpercentile (Critical Speed) generally results in an increase in accident rates. [Emphasis is by this paper’s Author.]

-25-
From the Washington State DOT website:http://www.wsdot.wa.gov/NR/rdonlyres/36221729-2EEE-40AE-B10A-6EC5707B0C0A/0/SpeedLimitsInfov02.pdf.
But if you lower the speed limits, people drive slower, Right? The answer is no, just as peopledon't automatically drive faster when the speed limit is raised. These are common miscon-ceptions, along with the mistaken belief that speed limit signs will decrease the accident rate andincrease safety, and highways with posted speed limits are safer than unposted highways.
From the FHWA’s “Roadway Delineation Practices Handbook”:http://safety.fhwa.dot.gov/PED_BIKE/docs/rdwydelin.pdf[p 217 of 240: Publication No. FHWA-SA-93-001]Notice of DefectThe highway agency has a duty to correct a dangerous condition when it receives notice of thehazard. Most courts say the State must have had notice of the hazard for a sufficient time toafford them a reasonable opportunity to repair thecondition or take precautions against thedanger. When a dangerous condition is the result of the State’s own negligence, the noticerequirement does not apply. The State does not need notice of faulty construction, maintenance,or repair of its roadways, because the State should know its own actions. However, if the dangerdid not result from the active negligence of the public entity, it must perform repairs once it hasnotice of the defect. [Emphasis is by this paper’s Author.] This Report should constitute“notice of the hazard”, i.e., “Notice of Defect”.
The New Mexico Department of Transportation Signing & Striping Manual of March2008:[http://www.nmshtd.state.nm.us/upload/images/Traffic_Design_Technical_Support_Bureau/SignandStripingManual.pdf]This Manual, used by the NM DOT for setting speed limits, states, on p15, “The proper use oftraffic control devices should provide the reasonable and prudent road user with theinformation necessary to use the streets, highways, pedestrian facilities, and bikeways, bothsafely and lawfully. Uniformity of the meaning and application of traffic control devices isvital to their effectiveness.” In the case of Highway 47 in Bosque Farms, the traffic controldevices do NOT satisfy this “proper use”.
It also states, on p66-67, “Since the presence of an unrealistic speed limit increases speed differentials and theprobability of crashes, it is important to use an engineering traffic study to determine theappropriate speed limit. It is also important to reevaluate the speed limit on roadwaysegments that have undergone a significant change in roadway characteristics orsurrounding land use.
If the probability of crashes increases as stated above - and it DOES - then, over time, the numberof crashes WILL increase. AND THE NM DOT AGREES: on p67 (p2.2-3), it also states,“Studies repeatedly show that establishing the speed limit below the 85th-percentile speed
increases the number of crashes.” Yet, in this Bosque Farms Speed Trap, the 45-mph posted speed limit was found to be at the 24th Percentile, and the 85thPercentile found in the SSS Report measured this speed at 52 mph.

-26-
Also, “Research shows that the safest speed limit approximates the 85th-percentile speed . ..”, and, “Although not as common as the 85th-percentile speed, another good indicator of
an appropriate speed limit is the upper limit of the pace . . .” Yet, in this Bosque FarmsSpeed Trap, the “upper limit of the pace” was found to be 53 mph.
Thus, “straight from the horses mouth”, the existing speed limit
“increases the number of crashes” and is NOT “the safest speed
limit”.Keep in mind, as stated above, the measured speeds are SKEWED LOW due to the heavyenforcement.
Also note that the methodology used here MORE THAN satisfies the NM DOT requirements fora “Spot Speed Study”, which the NM DOT Manual defines as, “A structured process using anengineering and traffic study to determine the proper speed limit.”.
Because the measured data and its analysis produce results that are so far “off” from what propertraffic conditions should be, corrections should perhaps be made in two stages. First, acomprehensive Engineering Survey which would at minimum result in a change to a 50-mphlimit, plus with a great reduction in enforcement, i.e., limited to actually unsafe drivers, in orderto produce a more usable data set and curve-shape; second, after a one to two-year settling-downperiod, another comprehensive Engineering Survey which would likely result in a second speedlimit increase, while maintaining enforcement to only UN-safe drivers. Another reason for a two-Survey procedure is this additional Study requirement due to the apparent neglect over the last20-30 years.
3.7 Two Seemingly Apparent Speed Limit Inconsistencies
First. Approximately 10 years ago, this section of Highway 47 underwent a major upgrade, withthe addition of a center turn lane, sidewalks, street lighting, etc. Prior to this upgrade, the postedspeed limit was 45 mph, and this limit did not change after the upgrade was completed. Yet thiswas a major upgrade - simple logic would suggest that the speed limit should have increased dueto the higher level of safety that resulted from the upgrade and its improved design. But it did nothappen, and this appears to be quite inconsistent with traffic safety requirements.
Second. The stretch of Highway currently patrolled by the Bosque Farms Police Dept. is from theIsleta Reservation boundary south through Peralta to the Los Lunas boundary. But the speedlimits over this stretch do not seem to make sense. Traveling south, the speed limit changes from45 to 40 mph at the South Loop and, in a relative sense, this is logical. But further south, justnorth of Peralta Power, the limit again changes to 45 mph, going into a curve. At this point thereis no turn lane as with the upgraded stretch in Bosque Farms. Admittedly, the Author is not atraffic engineer, but this appears to be quite inconsistent with traffic safety requirements. It seemsdoubtful that any of the speed limits along this stretch have received a proper Engineering Surveyfor many years or, if they have, were not acted upon. Speed limit change final decisions do notrest upon traffic engineers - they rest upon lawmakers.

-27-
Author’s single “editorial” comment: Some years ago, I was briefly involved with a SafetyAnalysis Report (SAR) for a “nuclear facility” that would easily fit in a one-car garage, and wasso far out in the boondocks that if it was intentionally blown sky-high and simultaneouslydisintegrated, the impact on public safety would be zero then and in the future. This SAR likelycost the taxpayer well over a million dollars. Yet, even though each vehicle traveling this stretchof highway pays roughly 15 cents in gasoline taxes (not including all the other taxes) each time ittravels this stretch, somehow the responsible public officials cannot or will not spend the moneyfor 2 or 3 people for 3-5 days to measure, analyze and properly set these speed limits which,based on this Study, are in fact causing traffic accidents.
4. CONCLUSIONS
The Title of this paper is, ‘Is Bosque Farms, NM a “Speed Trap?”’ Based on the definition of aspeed trap - vigorous enforcement of an artificially low speed limit - and this analysis, the answerto this question is a definite YES.
Based on the above Percentiles, Frequency Distribution skew, the information and referencespresented in the Discussion section, etc., the current posted speed limit cannot be described assafety based. It is simply not set for the purpose of maximizing traffic safety. In fact, assumingthat the data is reasonably representative of the free-flow speeds, the current posted speed limit -particularly with the excessively high level of speed enforcement - can be described asDETRIMENTAL to traffic safety. That is, based upon the above NDOT Report and others, theexisting posted speed limit for this segment of Highway 47 directly results in approximately afive to ten percent (or GREATER, see Sec. 3.4, p20.) higher accident rate than would exist usinga reasonable speed limit combined with reasonable enforcement.
Because of the speed-trap characteristics, the average speed and the Frequency Distribution peakresulting from the measurements are almost certainly lower than they would be with a safety-based speed limit combined with enforcement limited to actually unsafe drivers. It was shown inthe Discussion section that, based on the above analysis, it’s a “toss-up” between 50 and 55 mph(tending toward 55 mph) as the best one in terms of safety. Although speed limit changes arewell known to have little effect on average traffic speed, a safety-based speed limit of 55 mph -combined with reasonable enforcement - would likely result in an average speed increase ofperhaps 2-4 mph to around 50-52 mph (above-measured 85 Percentile), would therefore narrowth
the Frequency Distribution curve and reduce or eliminate its positive skewness, and result - aftera settling-down period - in a consequent decrease in the accident rate. Or conversely, an increasein safety.
4.1 Recommendations for Further Research
Although much additional research would be required, it appears that substantially skewed speeddistributions such as the one that resulted from this Spot Speed Study and its analysis (p.14) maydefine a speed trap, with its excessively low posted limit combined with excessively high speedenforcement, and unnecessarily high crash rate. Such research may provide a simple method to

-28-
identify speed traps with their consequently and unnecessarily high accident rates, the eliminationof which could quickly and substantially decrease the existing, nationwide number of crashes andtheir resulting injuries and deaths.
The requirements for the performance of a proper Spot Speed Study are given in Section 2. These requirements are reasonably straightforward and could be used by individuals or smallgroups, perhaps even as high school science projects. Also, reasonably-priced radar guns areavailable on the Internet which, if calibration-checked using a GPS and properly used, wouldsubstantially reduce the amount of work required. Perhaps one of the major speed trap web siteswould post the raw data and any analyses, thus making the data available to the traffic safetyresearch community.
5. NON-TRAFFIC-SAFETY SPEED TRAP CONCERNS
The scope of this Spot Speed Study and Report has been limited to traffic SAFETY. However,the posted speed limit is a “law”, and there are thus basic legal aspects beyond the scope of thisReport not addressed here. Because there are existing legal ramifications that directly result fromthis analysis, some of these legal ramifications are addressed in a companion Paper titled, “TheBosque Farms, NM Speed Trap: Some Basic Legal Aspects”, located HERE.[LINK]

-29-
APPENDIX ALillie Drive Spot Speed Study and Results
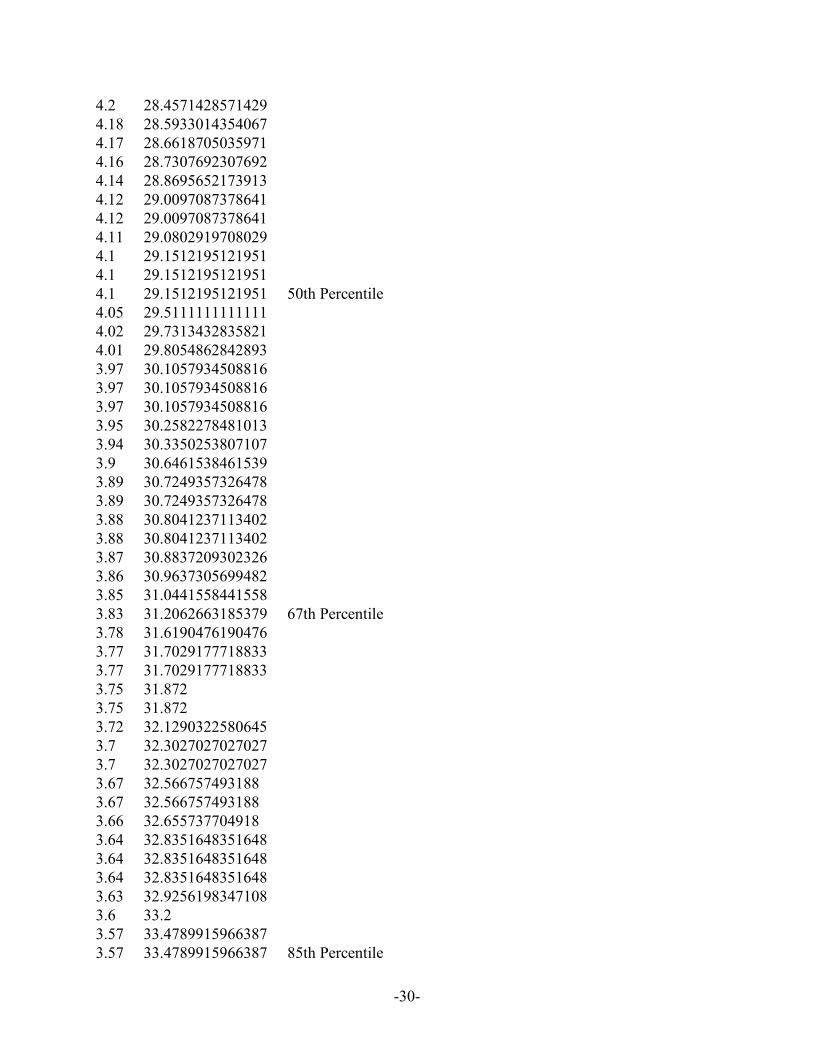
The following data and results show that 12 percent of the drivers travel at or below the posted25-mph speed limit or, conversely, 88% violate that limit.
Time mi/hr Percentiles Interval Frequency5.42 22.0516605166052 22 05.3 22.5509433962264 23 35.2 22.9846153846154 24 45.05 23.6673267326733 25 45.04 23.7142857142857 26 65 23.904 27 114.99 23.9519038076152 28 74.95 24.1454545454545 29 94.92 24.2926829268293 30 94.91 24.3421588594705 31 124.85 24.6432989690722 32 74.74 25.2151898734177 12th Percentile 33 104.73 25.2684989429175 34 64.72 25.3220338983051 35 44.65 25.7032258064516 36 44.61 25.9262472885033 37 34.6 25.9826086956522 17th Percentile 38 04.58 26.0960698689956 39 04.58 26.0960698689956 40 04.57 26.1531728665208 41 04.55 26.2681318681319 42 04.53 26.3841059602649 43 04.52 26.4424778761062 44 04.5 26.56 45 04.5 26.56 46 04.48 26.6785714285714 47 04.46 26.7982062780269 48 04.46 26.7982062780269 49 04.42 27.0407239819005 14.34 27.53917050691244.34 27.53917050691244.31 27.73085846867754.3 27.79534883720934.28 27.92523364485984.27 27.99063231850124.24 28.1886792452834.24 28.1886792452834.24 28.1886792452834.2 28.4571428571429
-30-
4.2 28.45714285714294.18 28.59330143540674.17 28.66187050359714.16 28.73076923076924.14 28.86956521739134.12 29.00970873786414.12 29.00970873786414.11 29.08029197080294.1 29.15121951219514.1 29.15121951219514.1 29.1512195121951 50th Percentile4.05 29.51111111111114.02 29.73134328358214.01 29.80548628428933.97 30.10579345088163.97 30.10579345088163.97 30.10579345088163.95 30.25822784810133.94 30.33502538071073.9 30.64615384615393.89 30.72493573264783.89 30.72493573264783.88 30.80412371134023.88 30.80412371134023.87 30.88372093023263.86 30.96373056994823.85 31.04415584415583.83 31.2062663185379 67th Percentile3.78 31.61904761904763.77 31.70291777188333.77 31.70291777188333.75 31.8723.75 31.8723.72 32.12903225806453.7 32.30270270270273.7 32.30270270270273.67 32.5667574931883.67 32.5667574931883.66 32.6557377049183.64 32.83516483516483.64 32.83516483516483.64 32.83516483516483.63 32.92561983471083.6 33.23.57 33.47899159663873.57 33.4789915966387 85th Percentile
-31-
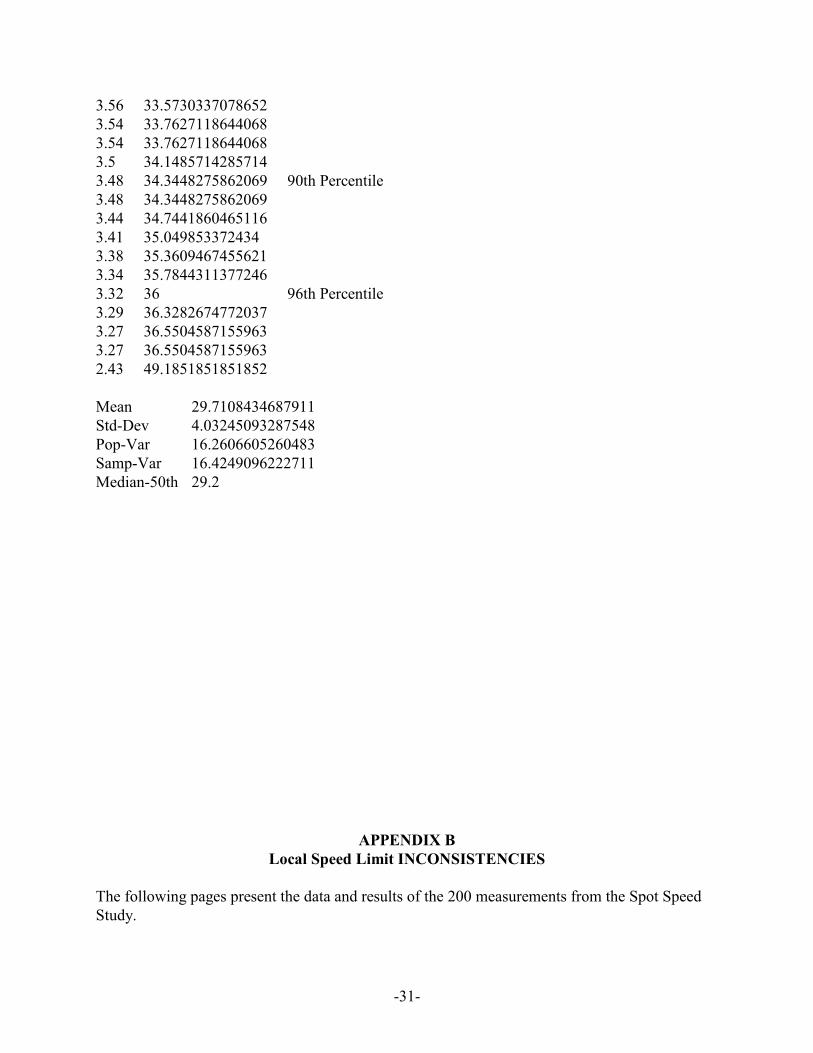
3.56 33.57303370786523.54 33.76271186440683.54 33.76271186440683.5 34.14857142857143.48 34.3448275862069 90th Percentile3.48 34.34482758620693.44 34.74418604651163.41 35.0498533724343.38 35.36094674556213.34 35.78443113772463.32 36 96th Percentile3.29 36.32826747720373.27 36.55045871559633.27 36.55045871559632.43 49.1851851851852
Mean 29.7108434687911Std-Dev 4.03245093287548Pop-Var 16.2606605260483Samp-Var 16.4249096222711Median-50th 29.2
APPENDIX BLocal Speed Limit INCONSISTENCIES
The following pages present the data and results of the 200 measurements from the Spot SpeedStudy.
-32-
mi/hr Average Percentile-Intervals Frequency Cum-Freq Posted Speed Limit = 45 mph Percentiles
Mean = 48.039309467976538.0090497737557 48.04 38 0 0 StdDev - 4.25103477188402 50th Percentile = 47.33 mph.39.2028985507246 39 1 1 Variance =18.1621071676051 67th Percentile = 49.29 mph41.0614525139665 40 1 2 85th Percentile = 52.04 mph41.1764705882353 41 0 2 90th Percentile = 53.12 mph41.3793103448276 42 5 7 95th Percentile = 56.32 mph41.8083462132921 43 10 17 97th Percentile = 57.48 mph41.8803418803419 44 11 2842.035742035742 45 18 46 24th Percentile = 45.02 mph42.1011673151751 46 24 7042.1996879875195 47 19 89 10-mph Pace = 43-53 mph42.2110552763819 48 23 11242.265625 49 18 13042.3326133909287 50 16 14642.3981191222571 51 11 15742.7325581395349 52 12 16942.9706115965052 53 10 17942.9824561403509 54 6 18543.1401320616288 55 2 18743.5555555555556 56 1 18843.5555555555556 57 4 19243.6290322580645 58 4 19643.75 59 0 19643.8805970149254 60 1 19743.8805970149254 61 2 19943.8805970149254 62 0 19943.9133681852129 63 0 19943.9133681852129 64 0 19943.9461883408072 65 0 19944.0119760479042 66 0 19944.0553745928339 67 0 19944.1773102930128 68 0 19944.2354865085855 69 1 20044.3104747550867 044.343891402714944.410876132930544.410876132930544.444444444444444.478063540090844.490131578947444.526748971193444.545454545454644.563426688632644.714828897338444.748858447488644.821872410936244.954128440367
-33-
45.0229709035222 24th Percentile45.0833333333333 24th Percentile45.092024539877345.196324143692645.271966527196745.309882747068745.309882747068745.335389360061745.335389360061745.440494590417345.440494590417345.462184873949645.462184873949645.538720538720545.577085088458345.581395348837245.687645687645745.687645687645745.723172628304845.794392523364545.808636748518245.83008573655545.847457627118745.901639344262346.003401360544246.003401360544246.009389671361546.045418950665646.117647058823546.153846153846246.153846153846246.239316239316346.262785208497246.299212598425246.358183376178246.437768240343446.518987341772246.555819477434746.557659208261646.758859118409746.839826839826846.889952153110146.96485623003247.0447.115384615384647.125435540069747.153167602245447.166521360069847.1665213600698

-34-
47.166521360069847.266881028938947.290209790209847.33158355205647.331583552056 50th Percentile47.373029772329347.419354838709747.457627118644147.581354441512847.581354441512847.623239436619747.749338040600247.76604386677547.79151943462947.804878048780547.918511957484547.960848287112648.088888888888948.196721311475448.260481712756548.389982110912348.433303491495148.434925864909448.434925864909448.520179372197348.651079136690748.715824357912248.782687105500548.782687105500548.82671480144448.837209302325648.918469217970148.918469217970148.918469217970148.918469217970149.003623188405849.226569608735249.246231155778949.2875104777871 67th Percentile49.406392694063949.411764705882449.451553930530249.453322119428149.578414839797649.62025316455749.633027522935849.724264705882449.77000919963249.8305084745763
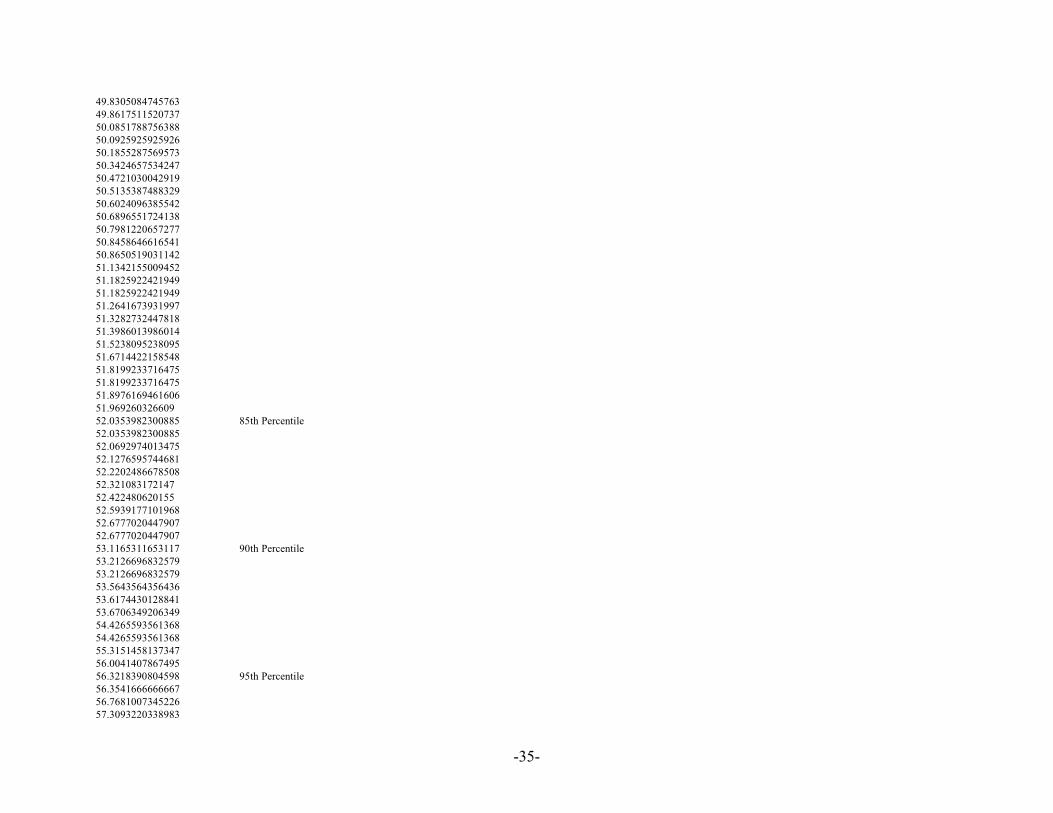
-35-
49.830508474576349.861751152073750.085178875638850.092592592592650.185528756957350.342465753424750.472103004291950.513538748832950.602409638554250.689655172413850.798122065727750.845864661654150.865051903114251.134215500945251.182592242194951.182592242194951.264167393199751.328273244781851.398601398601451.523809523809551.671442215854851.819923371647551.819923371647551.897616946160651.96926032660952.0353982300885 85th Percentile52.035398230088552.069297401347552.127659574468152.220248667850852.32108317214752.42248062015552.593917710196852.677702044790752.677702044790753.1165311653117 90th Percentile53.212669683257953.212669683257953.564356435643653.617443012884153.670634920634954.426559356136854.426559356136855.315145813734756.004140786749556.3218390804598 95th Percentile56.354166666666756.768100734522657.3093220338983

-36-
57.478005865102657.860962566844957.874015748031559.515951595159560.369609856262860.786516853932668.1344148319815