irrigating oil olives
TRANSCRIPT

Joe Connell, Farm Advisor UC Cooperative Extension
Butte County
Irrigating Oil Olives
University of CaliforniaCooperative Extension
Agriculture & Natural ResourcesCentral Valley Region

Olive growth habit
Olives bloom on one year old shoots
Over-cropping: decreases fruit size decreases shoot
growth decreases flowering
next season aggravates alternate
bearing

Relationship between olive tree growth and production
Farm olives with two seasons in mind: produce a moderate sized, high quality
current crop generate sufficient vegetative growth for
next season’s bloom and crop helps minimize alternate bearing

Yield components in olive
Shoot growthFruit loadFruit size and distributionOil Content

Proper irrigation is important for shoot growth & bloom, fruit sizing, total yield, and reduction of alternate bearing
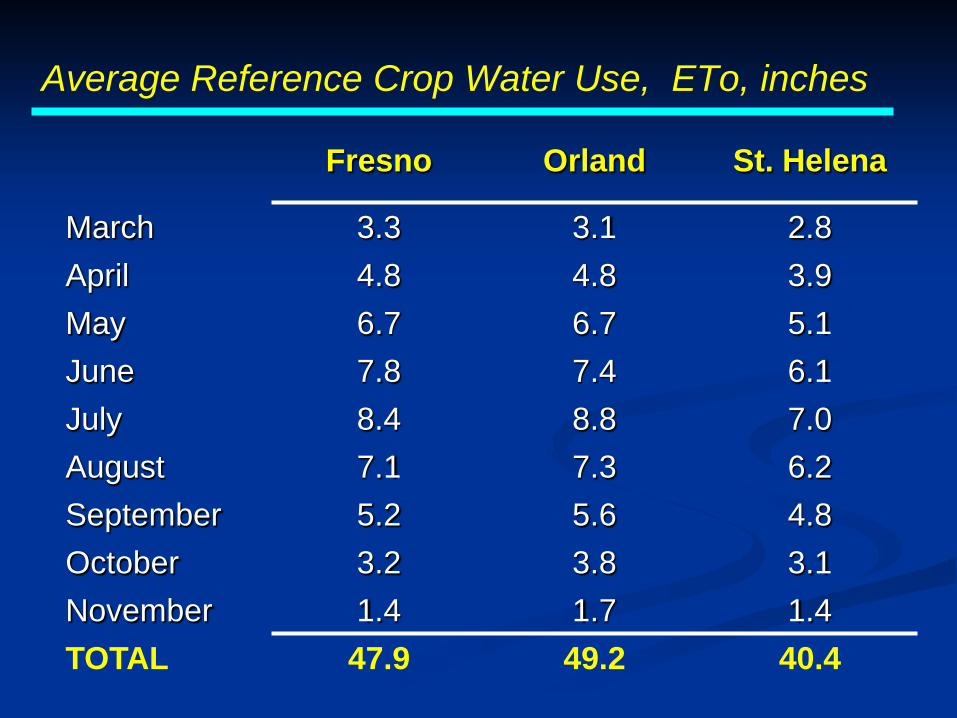
Average Reference Crop Water Use, ETo, inches
Fresno Orland St. Helena
March 3.3 3.1 2.8April 4.8 4.8 3.9May 6.7 6.7 5.1June 7.8 7.4 6.1July 8.4 8.8 7.0August 7.1 7.3 6.2September 5.2 5.6 4.8October 3.2 3.8 3.1November 1.4 1.7 1.4TOTAL 47.9 49.2 40.4

Reference ETo, olive Kc’s and orchard water use (clean cultivated) in Orland
ETo (inches) Kc ETc (inches)March 3.1 0.75 2.3April 4.8 0.75 3.6May 6.7 0.75 5.0June 7.4 0.75 5.6July 8.8 0.75 6.6August 7.3 0.75 5.5September 5.6 0.75 4.2October 3.8 0.75 2.9November 1.7 0.75 1.3TOTAL 49.2 37.0
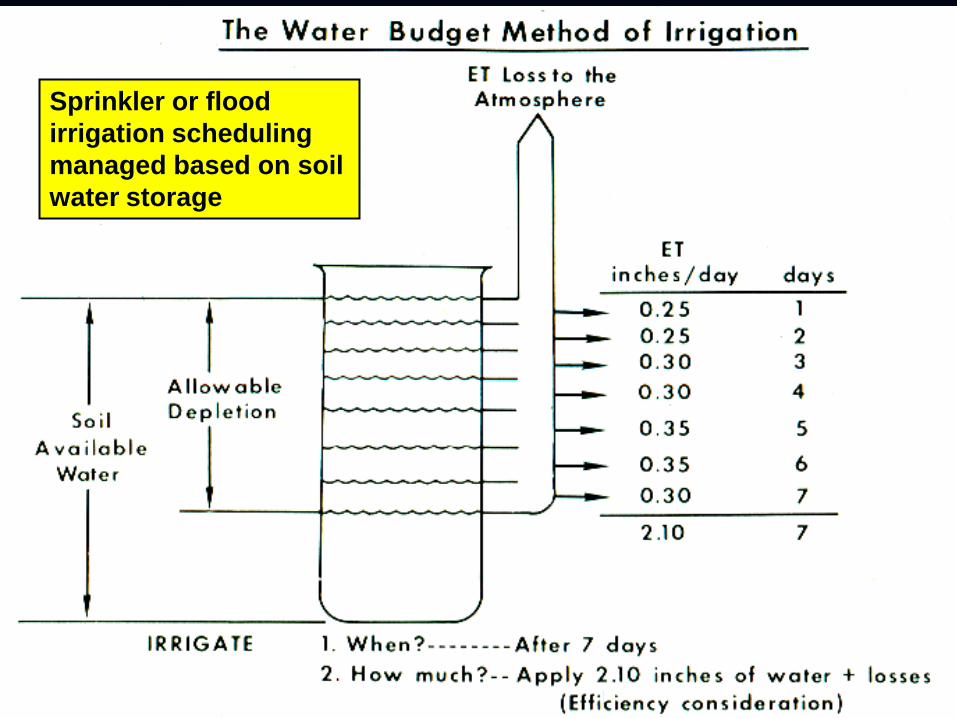
Sprinkler or flood irrigation scheduling managed based on soil water storage

Low volume irrigation scheduling
Drip
Microsprinklers
ETc determines use Drip or micro-sprinkler irrigation
replaces what trees use every day or two
Soil water holding capacity not important
Keep emitters 2-3 feet away from trunk

Low volume irrigation scheduling
Determine how much water to apply ETc – Kc, canopy size, climate (temp & day length) Days between irrigations
Determine how long to irrigate ETc between irrigations Efficiency of irrigation system Application rate of drippers or micro-sprinklers

Example: low volume irrigation scheduling If meeting full ETc 6.6 inches in July / 31 days =
0.21 inches/day Irrigated 2 days ago, assume ETc = 0.21
inch/day, must replace 0.42 inch of water use 1acre inch = 27,154 gal x 0.42 = 11,405 gallons/acre
in two days 5’ x 13’ = 670 trees/acre 11,405 / 670 = 17 gallons per tree
Determine how long to irrigate Assume single line drip w/ two, 1gal/hr emitters/tree 17 gallons use / 2 gal/hr application rate = 8.5 hrs run
time every other day to meet full ETc
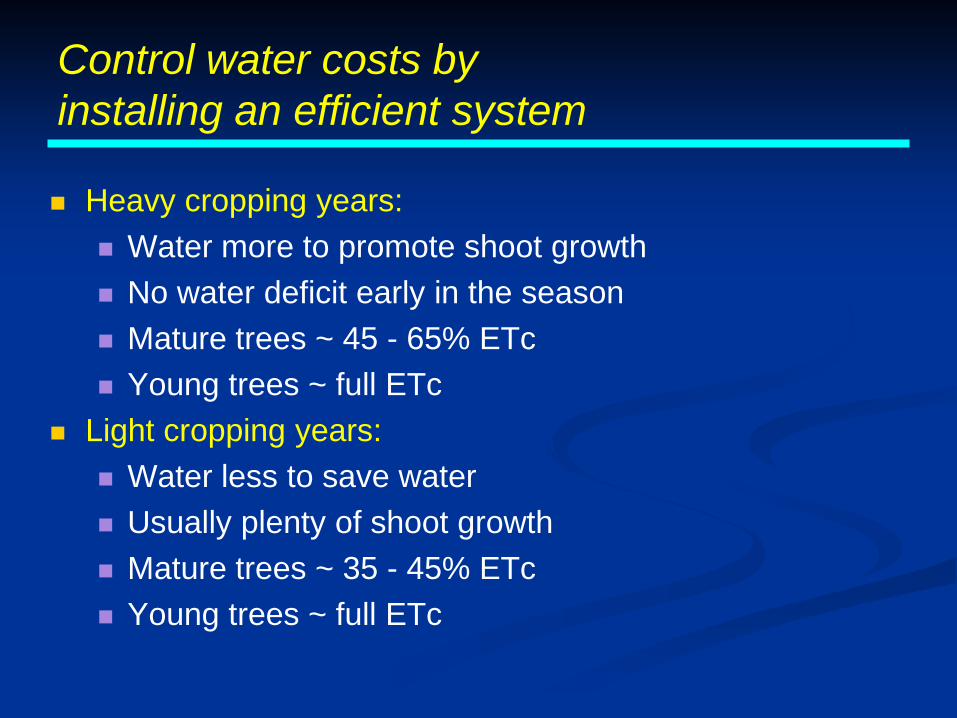
Control water costs byinstalling an efficient system
Heavy cropping years: Water more to promote shoot growth No water deficit early in the season Mature trees ~ 45 - 65% ETc Young trees ~ full ETc
Light cropping years: Water less to save water Usually plenty of shoot growth Mature trees ~ 35 - 45% ETc Young trees ~ full ETc

Dr. Steve Grattan, Irrigation Specialist, UC Davis, Joe Connell, Farm Advisor, Butte County, Maria Jose Berenguer-MereloStudied oil olive irrigation in early 2000’s, applied different irrigation treatments over the season

15% ETc 41% ETc
107% ETc90% ETc
Olive shoot growth was affected by July

0
5
10
15
20
25
30
35
40
2 Mayo 29 Mayo 26-Jun 22-julio 1-Sep 15-Oct
Bran
ch L
engt
h (c
m)
White Blue Green + white Red Orange Green Yellow
All Repetitions
Vegetative growth vs. irrigation

Water affected fruit size
02
15% ETc 40% ETc 71% ETc 107% ETc
Driest Wettest
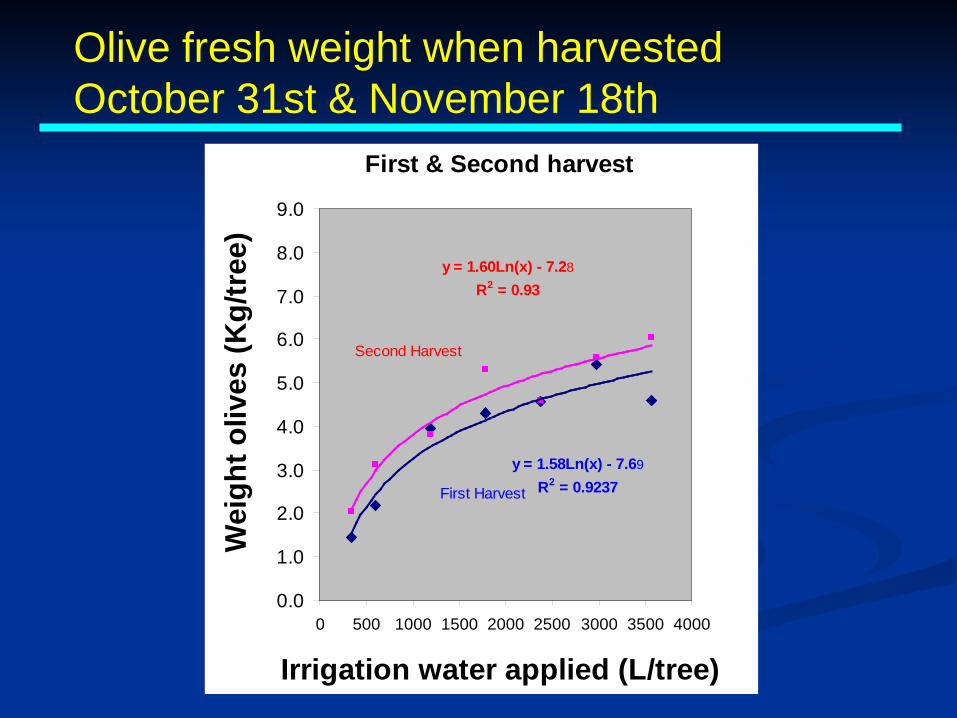
First & Second harvest
y = 1.58Ln(x) - 7.69
R2 = 0.9237
y = 1.60Ln(x) - 7.28
R2 = 0.93
0.0
1.0
2.0
3.0
4.0
5.0
6.0
7.0
8.0
9.0
0 500 1000 1500 2000 2500 3000 3500 4000
Irrigation water applied (L/tree)
Wei
ght o
lives
(Kg/
tree
)
Second Harvest
First Harvest
Olive fresh weight when harvestedOctober 31st & November 18th
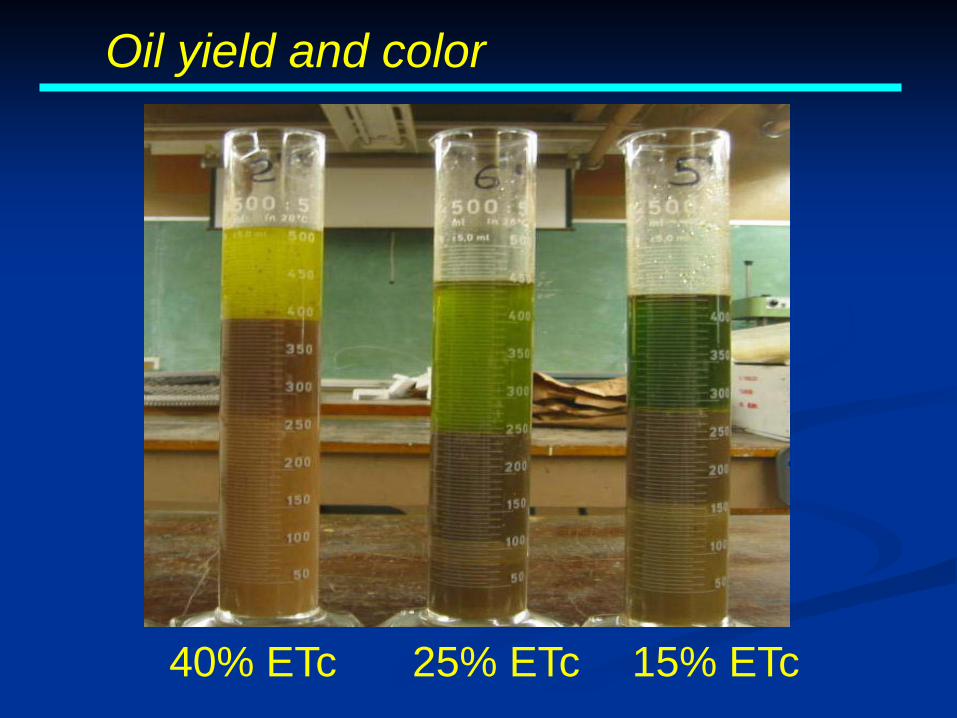
15% ETc25% ETc40% ETc
Oil yield and color

1 harvesty = -0.0188x + 23.634
R2 = 0.925
2 harvesty = -0.01x + 19.024
R2 = 0.9343
averagey = -0.0134x + 21.046
R2 = 0.9492
0
3
6
9
12
15
18
21
24
27
0 100 200 300 400 500 600 700 800 900 1000
Irrigation water applied (gallons/tre
1harvest2 harvestaverageLinear (1harvest)Linear (2 harvest)Linear (average)
% Oil content

First and second harvesty = -1E-07x 2 + 0.0005x + 0.125
R2 = 0.8705
y = -9E-08x 2 + 0.0004x + 0.2957R2 = 0.7051
0.0
0.2
0.4
0.6
0.8
1.0
0 500 1000 1500 2000 2500 3000 3500 4000
Irrigation water applied (L/tree)
Total oil production per tree
Optimum 40-70%

Best irrigation level for production ranges between 50 and 70% ETc
Higher crop yield Makes up for less oil
per fruit Good shoot growth Good return bloom

Treatments Fruitiness Bitterness Pungency15% ET 3.6 a 6.0 a 4.9 a
25% ET 3.2 b 4.2 b 3.9 b
40% ET 2.7 c 1.7 c 1.9 c
57% ET 2.6 c 0.9 d 1.1 d
71% ET 2.1 d 0.3 d 0.3 e
89% ET 1.8 d 0.2 d 0.2 e
107% ET 1.7 d 0.2 d 0.2 e
Fruitiness, bitterness, and pungency of oils is influenced by irrigation
Paul Vossen, UC Farm Advisor, Sonoma County

Best irrigation level for flavor is 35 to 55% ETc
High level of pleasant fruitiness Both ripe fruit and green character More complexity and depth Higher polyphenol content Balanced bitterness Balanced pungency Excess water = bland oils

Summary …
To optimize olive oil production, don’t fully irrigate treesOil production is optimized between 40 and
70% ETc Best production is at the high end of this range Best oil quality is at the lower end
Full irrigation increases pumping costs, promotes unnecessary vegetative growth, can reduce flowering, and increases pruning costs

Date Full ETc (in.) RDI% Irrigation (in.)Mar 1-15 1.2 100 1.2
Mar 16-31 1.2 100 1.2
Apr 1-15 1.8 100 1.8
Apr 16-30 1.8 100 1.8
May 1-15 2.3 100 2.3
May 16-31 2.5 50 1.3Jun 1-15 2.9 50 1.5Jun 16-30 2.9 25 0.7Jul 1-15 3.1 25 0.8Jul 16-30 3.3 25 0.8Aug 1-15 2.7 25 0.7Aug 16-31 2.8 50 1.4Sep 1-15 2.0 50 1.0Sep 16-30 2.0 100 2.0
Oct 1-15 1.2 100 1.2
Oct 16-31 1.3 100 1.3
Nov 1-15 0.5 100 0.5
TOTAL (in.) 35.5 21.5
RDI Water Application ETc % 60.5%
How do you implement a Regulated Deficit Irrigation strategy?
With a controlled stress…
And, irrigating at 60.5% of full ETc saved 14 in. of water

Summary …
On shallow soils, excess tree vigor can be managed by controlling waterShoot growth will slow or can be stopped
Fruit growth slows during regulated deficit irrigation (RDI) accelerates upon return to full irrigation

Summary …
Olive RDI is a strategy that can optimize oil yield and quality while reducing water costs
MUST know what you’re doing Have good control of water applicationsKnow your full ETc water requirementKnow your systems water application rateUnderstand your goal

Water problems in super high density olives
Joe Connell, Farm AdvisorUC Cooperative Extension
Butte County
Agriculture & Natural Resources
University of California Cooperative Extension

Olives do well on shallow soils with good drainage

Aerial view of the same field
Swales with poor drainage show up
Wet saturated areas, trees are gone

Wet spot at ground level

Another type of drainage problem
Replants at the low end of the field next to a road

Individual trees starting to weaken and turn yellow


Phytophthora crown rot

Water problems on young olive trees
Saturated soil…. areas of the field die Puddling around the crown…. individual trees die
Questions?Joe Connell, Farm AdvisorUC Cooperative Extension
Butte County
University of CaliforniaCooperative Extension
Agriculture & Natural ResourcesCentral Valley Region