market situation in the olive oil and table olives sectors · market situation in the olive oil and...
TRANSCRIPT

Market situation in the Olive oil
and Table olives sectors
Committee for the Common Organisation of the Agricultural
Markets – Arable crops and olive oil
30 March 2017
Lucie Zolichová, AGRI G.4

2
OLIVE OIL PRODUCTION,
CONSUMPTION & ENDING
STOCKS

3
Source: International Olive Council & MS declarations
2016/17 vs 2015/16 ● WORLD -19% ● EU -24% ● non-EU -6%
3.317
2.411
3.252
2.458
3.160
2.562 2.395
1.462
2.483
1.435
2.322
1.772
922 949 769
1.024 838 791
0
500
1000
1500
2000
2500
3000
3500
2011/12 2012/13 2013/14 2014/15(fin.) 2015/16 (prov.) 2016/17 (est.)
OLIVE OIL PRODUCTION (1000t) WORLDEUnon-EUAverage world 2011/12-2015/16
excl. pomace oil;

4
excl. pomace oil Source: International Olive Council; MS declarations
EU production in 2016/17 12% below 5-year average
1.615
618
1.782
842
1.402 1.311
399 416 464
222
475
190 295 358 132
300 320
180 76 59 92 61 109 76 10 11 14 10 17 14
2.395
1.462
2.483
1.435
2.322
1.772
0
500
1.000
1.500
2.000
2.500
3.000
2011/12 2012/13 2013/14 2014/15(fin.) 2015/16 (prov.) 2016/17 (est.)
EU OLIVE OIL PRODUCTION (1000t) excl.pomace oil
variation 2016/17 vs 2015/16
Spain (-6%)Italy (-60%)Greece (-44%)Portugal (-30%)Others EU (-18%)EU total (-24%)Average 2011/12-2015/16

5
Source: MS declarations - Annexe III point A b) et c) du règlement (CE) n° 826/2008 - Annex III point A b) and c) of Regulation (EC) No 826/2008 (*)
(tonnes)
2016/2017 EL ES FR IT CY MT PT SI HR TOTAL
September 290 290
October 1.888 9.500 400 48.842 3.435 80 1.500 65.645
November 37.212 92.500 1.300 93.283 29.410 220 2.500 256.425
December 60.100 452.500 1.100 24.036 38.960 50 500 577.246
January 49.980 522.598 200 3.066 4.580 580.423
February 16.320 152.205 50 396 168.971
March 0
April 0
May 0
June 0
Total 165.500 1.229.303 3.050 169.913 0 0 76.385 350 4.500 1.649.001
Production Estimation 2016/17 180.000 1.311.317 3.061 190.000 6.000 40 76.385 350 4.500 1.771.653
Consumption Estimation 2016/17 120.000 505.000 95.000 545.000 6.300 1.000 70.000 2.000 7.000 1.351.300
Final Stock Estimation 2016/17 (on 30.9.) 19.500 301.217 11.100 7.500 2.700 0 0 0 0 342.017
CHANGE TO PREVIOUS COMMUNICATION
MONTHLY EU OLIVE OIL PRODUCTION (2016-2017)
(*)Commission Regulation (EC) 826/2008 and Commission implementing regulation (EU) No 65/2013 amending Annex III to Regulation (EC) No 826/2008
CY, MT- NO ISAMM NOTIFICATIONS. Estimated data or IOC.
Notifications ISAMM 15.3.2017 EL, ES, IT, HR, FR, PT (correction sent 29.3.2017)
6
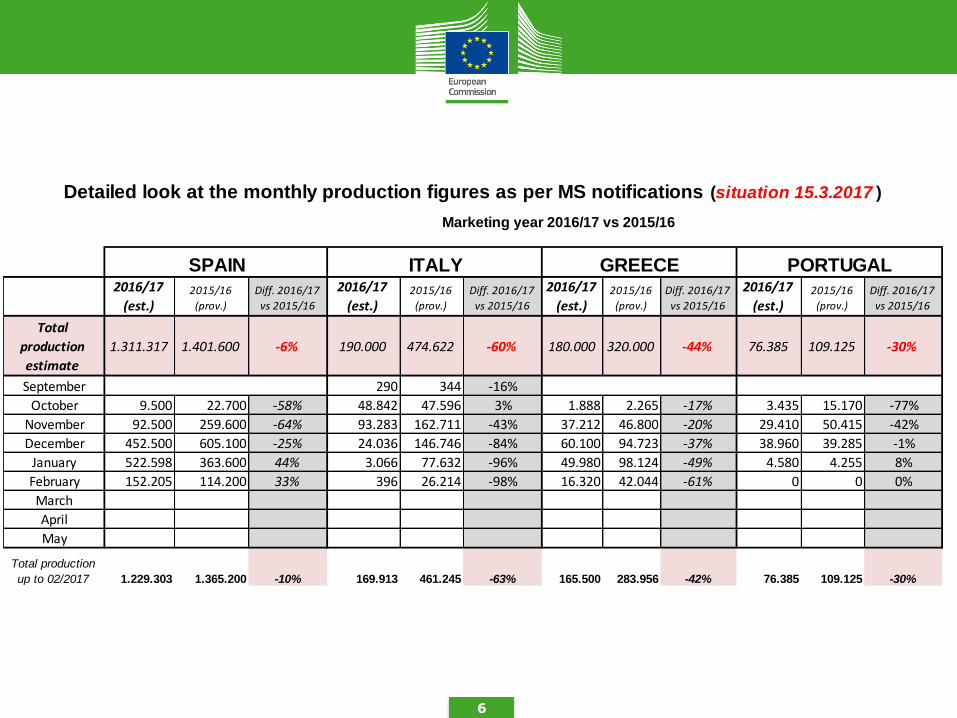
2016/17
(est.)2015/16
(prov.)
Diff. 2016/17
vs 2015/16
2016/17
(est.)2015/16
(prov.)
Diff. 2016/17
vs 2015/16
2016/17
(est.)2015/16
(prov.)
Diff. 2016/17
vs 2015/16
2016/17
(est.)2015/16
(prov.)
Diff. 2016/17
vs 2015/16
Total
production
estimate
1.311.317 1.401.600 -6% 190.000 474.622 -60% 180.000 320.000 -44% 76.385 109.125 -30%
September 290 344 -16%
October 9.500 22.700 -58% 48.842 47.596 3% 1.888 2.265 -17% 3.435 15.170 -77%
November 92.500 259.600 -64% 93.283 162.711 -43% 37.212 46.800 -20% 29.410 50.415 -42%
December 452.500 605.100 -25% 24.036 146.746 -84% 60.100 94.723 -37% 38.960 39.285 -1%
January 522.598 363.600 44% 3.066 77.632 -96% 49.980 98.124 -49% 4.580 4.255 8%
February 152.205 114.200 33% 396 26.214 -98% 16.320 42.044 -61% 0 0 0%
March
April
May
Total production
up to 02/2017 1.229.303 1.365.200 -10% 169.913 461.245 -63% 165.500 283.956 -42% 76.385 109.125 -30%
SPAIN ITALY GREECE PORTUGAL
Marketing year 2016/17 vs 2015/16
Detailed look at the monthly production figures as per MS notifications (situation 15.3.2017 )
7
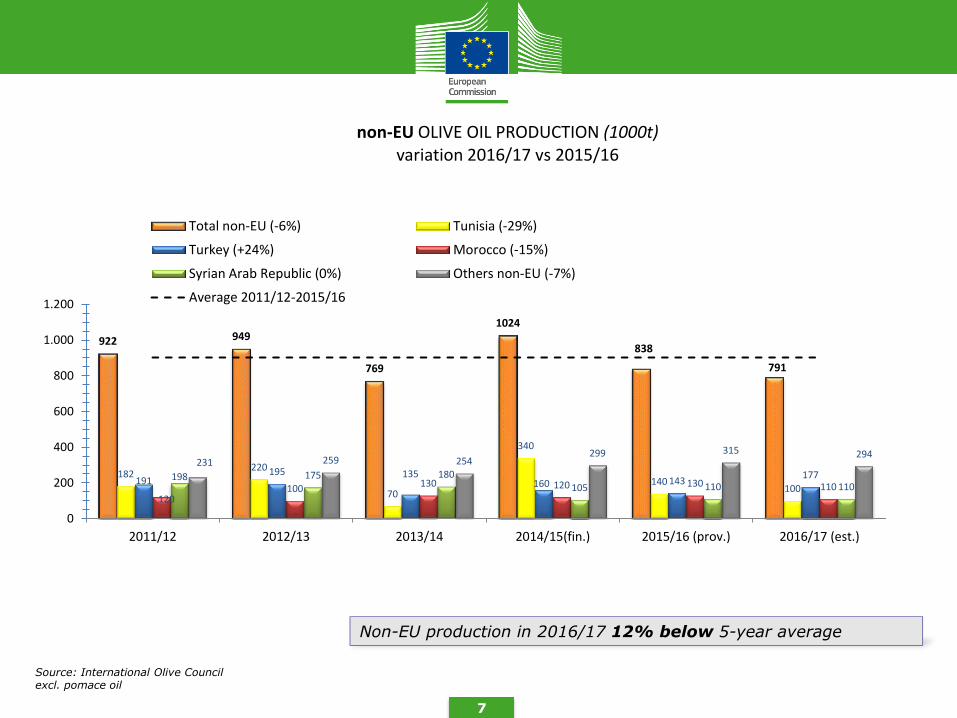
Source: International Olive Council excl. pomace oil
Non-EU production in 2016/17 12% below 5-year average
922 949
769
1024
838
791
182 220
70
340
140 100
191 195 135
160 143 177
120 100 130 120 130 110
198 175 180
105 110 110
231 259 254 299 315 294
0
200
400
600
800
1.000
1.200
2011/12 2012/13 2013/14 2014/15(fin.) 2015/16 (prov.) 2016/17 (est.)
non-EU OLIVE OIL PRODUCTION (1000t) variation 2016/17 vs 2015/16
Total non-EU (-6%) Tunisia (-29%)
Turkey (+24%) Morocco (-15%)
Syrian Arab Republic (0%) Others non-EU (-7%)
Average 2011/12-2015/16
8
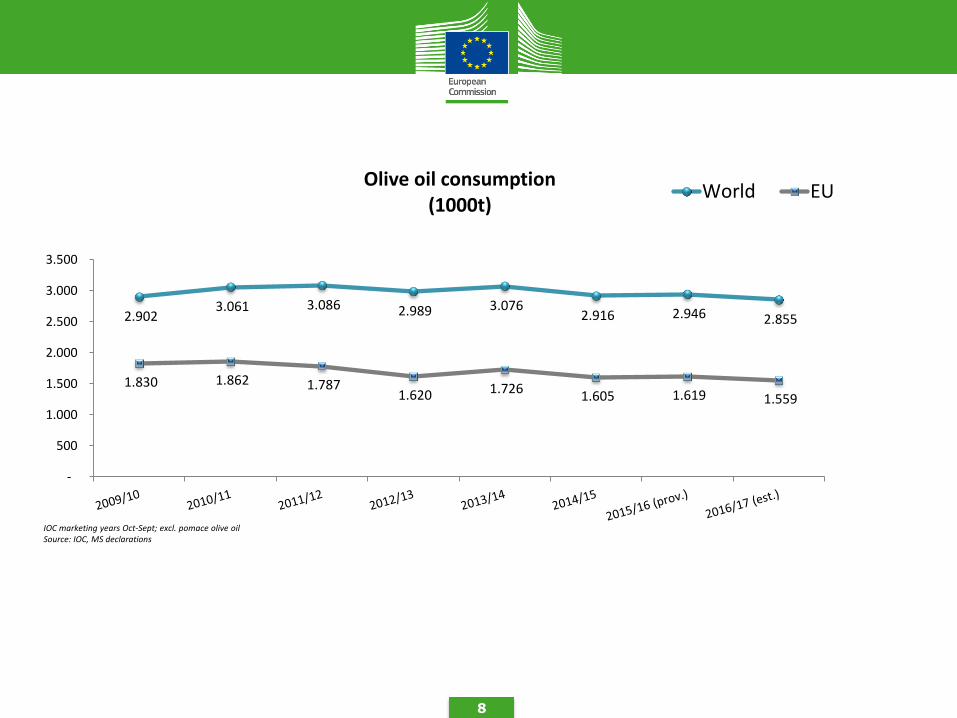
2.902 3.061 3.086 2.989 3.076
2.916 2.946 2.855
1.830 1.862 1.787 1.620 1.726
1.605 1.619 1.559
-
500
1.000
1.500
2.000
2.500
3.000
3.500
Olive oil consumption (1000t)
World EU
IOC marketing years Oct-Sept; excl. pomace olive oil Source: IOC, MS declarations
9
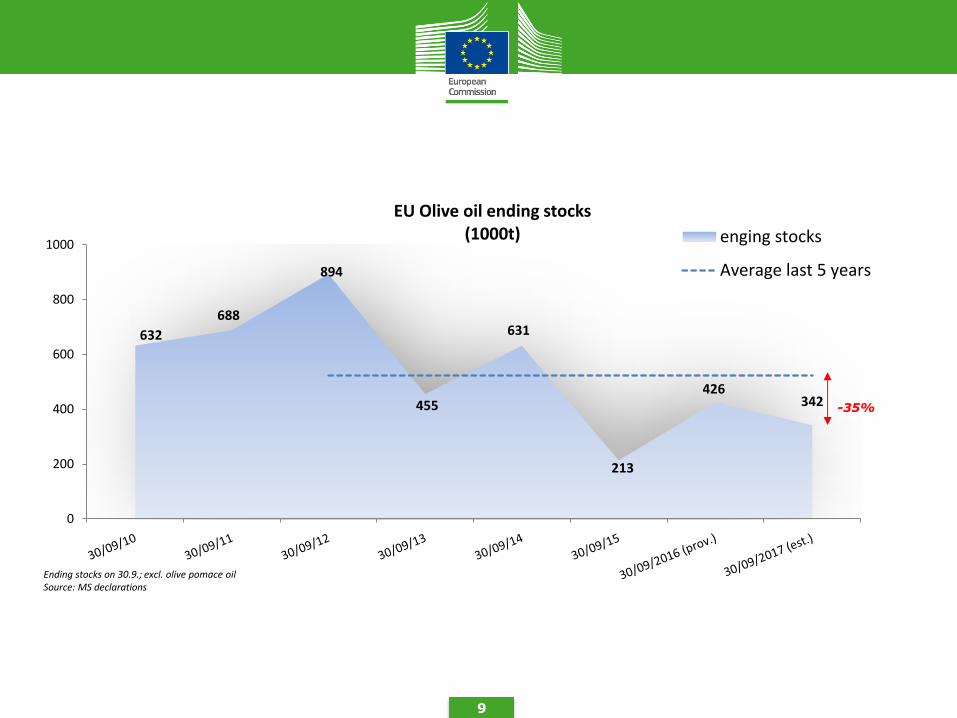
632
688
894
455
631
213
426 342
0
200
400
600
800
1000
EU Olive oil ending stocks (1000t) enging stocks
Average last 5 years
Ending stocks on 30.9.; excl. olive pomace oil Source: MS declarations
-35%

10
EU OLIVE OIL EXTRA-TRADE
11
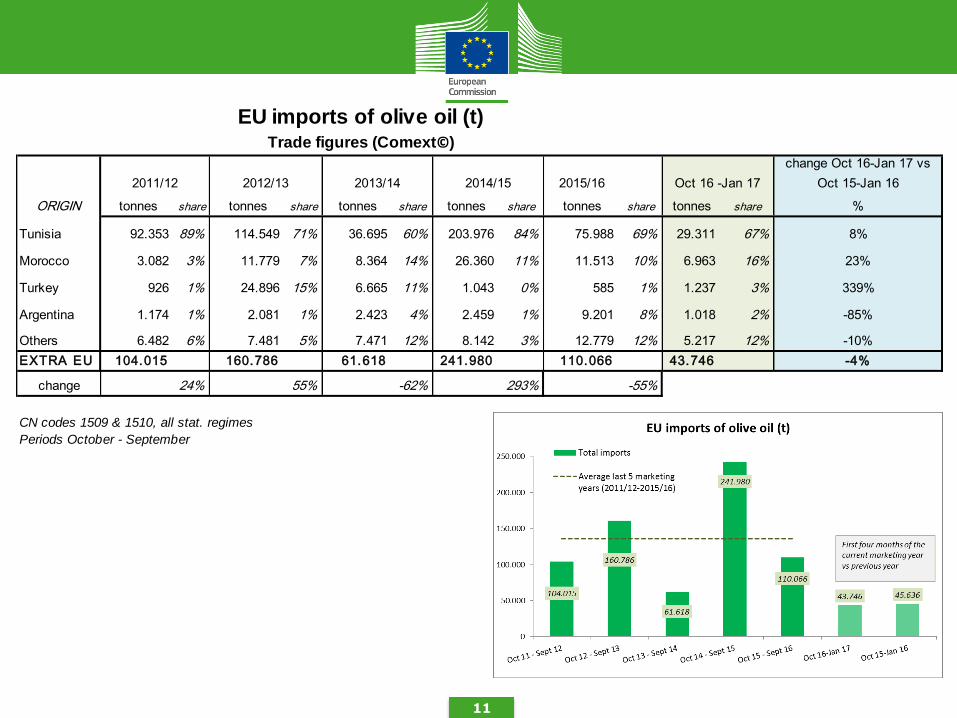
2015/16
change Oct 16-Jan 17 vs
Oct 15-Jan 16
ORIGIN tonnes share tonnes share tonnes share tonnes share tonnes share tonnes share %
Tunisia 92.353 89% 114.549 71% 36.695 60% 203.976 84% 75.988 69% 29.311 67% 8%
Morocco 3.082 3% 11.779 7% 8.364 14% 26.360 11% 11.513 10% 6.963 16% 23%
Turkey 926 1% 24.896 15% 6.665 11% 1.043 0% 585 1% 1.237 3% 339%
Argentina 1.174 1% 2.081 1% 2.423 4% 2.459 1% 9.201 8% 1.018 2% -85%
Others 6.482 6% 7.481 5% 7.471 12% 8.142 3% 12.779 12% 5.217 12% -10%
EXTRA EU 104.015 160.786 61.618 241.980 110.066 43.746 -4%
24% 55% -62% 293%
CN codes 1509 & 1510, all stat. regimes
Periods October - September
Oct 16 -Jan 17
-55%
2014/15
EU imports of olive oil (t)Trade figures (Comext©)
change
2011/12 2012/13 2013/14
12
-
5.000
10.000
15.000
20.000
25.000
30.000
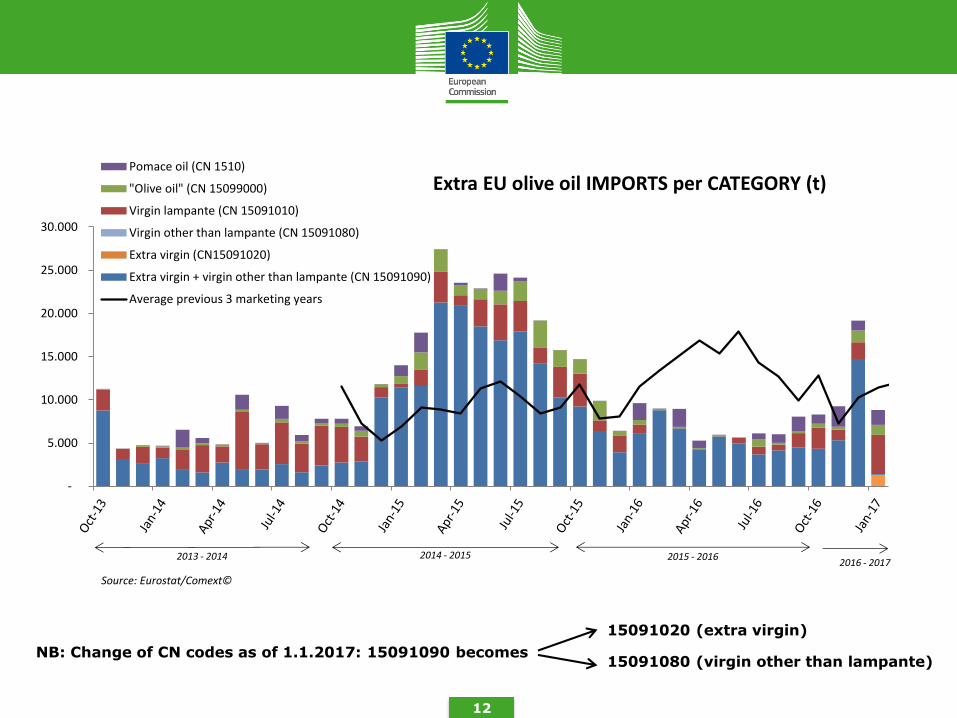
Extra EU olive oil IMPORTS per CATEGORY (t) Pomace oil (CN 1510)
"Olive oil" (CN 15099000)
Virgin lampante (CN 15091010)
Virgin other than lampante (CN 15091080)
Extra virgin (CN15091020)
Extra virgin + virgin other than lampante (CN 15091090)
Average previous 3 marketing years
2013 - 2014
2014 - 2015
2015 - 2016
2016 - 2017
Source: Eurostat/Comext©
NB: Change of CN codes as of 1.1.2017: 15091090 becomes
15091020 (extra virgin)
15091080 (virgin other than lampante)

13
Inward processing (IP) – a relief from customs duty and import VAT on goods that are imported from outside the EU to be processed, and then exported outside the EU or released for free circulation in the EU. Excise duty is also suspended when goods are entered into IP.

14
15

16
2015/16
change Oct 16-Jan 17 vs
Oct 15-Jan 16
DESTINATION tonnes share tonnes share tonnes share tonnes share tonnes share tonnes share %
USA 228.457 37% 176.170 32% 247.215 37% 201.621 35% 248.054 38% 79.944 38% 14%
Brazil 64.239 10% 64.981 12% 62.690 9% 56.093 10% 46.222 7% 15.117 7% 40%
Japan 44.873 7% 45.892 8% 53.601 8% 52.329 9% 53.719 8% 15.869 7% 13%
China 42.238 7% 36.823 7% 32.489 5% 32.972 6% 43.970 7% 13.264 6% 1%
Canada 29.343 5% 24.349 4% 31.648 5% 24.747 4% 29.288 4% 10.095 5% 24%
Australia 31.466 5% 23.803 4% 27.836 4% 18.878 3% 26.308 4% 10.834 5% 47%
Russia 20.406 3% 20.182 4% 23.247 3% 15.015 3% 16.633 3% 5.055 2% 3%
Others 160.470 26% 150.168 28% 194.810 29% 178.761 31% 191.182 29% 62.735 29% 16%
EXTRA EU 621.492 542.368 673.535 580.415 655.376 212.913 17%
change 15% -13% 24% -14% 13%
CN codes 1509 & 1510, all stat. regimes
Periods October - September
Oct 16 -Jan 17
EU exports of olive oil (t)Trade figures (Comext©)
2011/12 2012/13 2013/14 2014/15

17
-
10.000
20.000
30.000
40.000
50.000
60.000
70.000
Extra EU olive oil EXPORTS per CATEGORY (t) Pomace oil (CN 1510)
"Olive oil" (CN 15099000)
Virgin lampante (CN 15091010)
Virgin other than lampante (CN 15091080)
Extra virgin (CN 15091020)
Extra virgin + virgin other than lampante (CN 15091090)
Average previous 3 marketing years
2013 - 2014
2015 - 2016
2014 - 2015
2016 - 2017
Source: Eurostat/Comext©
NB: Change of CN codes as of 1.1.2017: 15091090 becomes
15091020
15091080

18
OLIVE OIL INTRA-TRADE
2016/2017
19
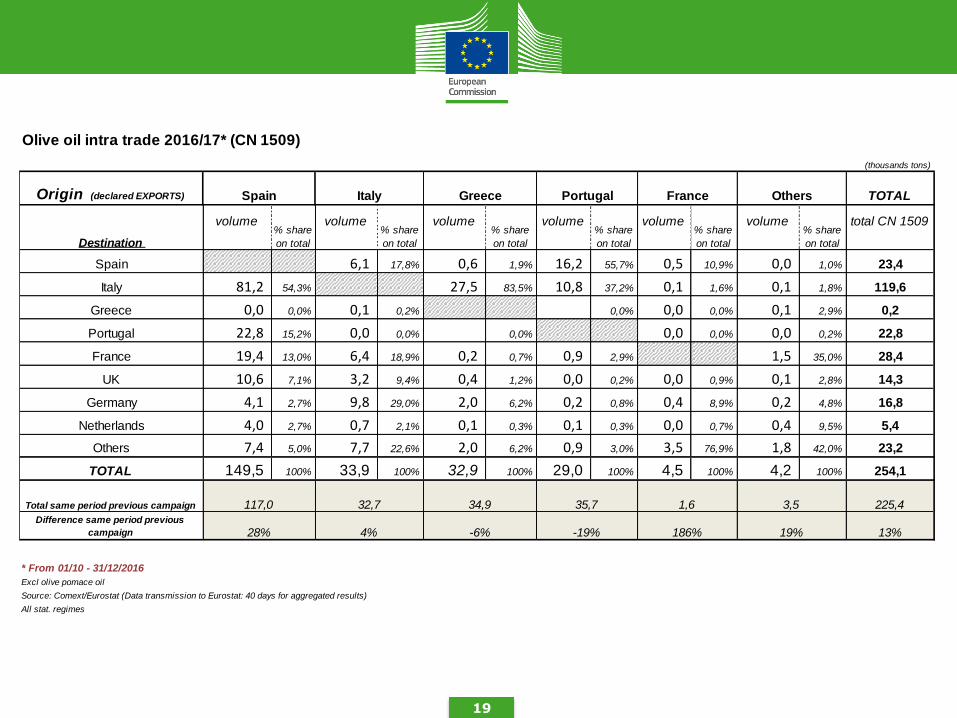
Olive oil intra trade 2016/17* (CN 1509)
(thousands tons)
Origin (declared EXPORTS) TOTAL
volume volume volume volume volume volume total CN 1509
Spain 6,1 17,8% 0,6 1,9% 16,2 55,7% 0,5 10,9% 0,0 1,0% 23,4
Italy 81,2 54,3% 27,5 83,5% 10,8 37,2% 0,1 1,6% 0,1 1,8% 119,6
Greece 0,0 0,0% 0,1 0,2% 0,0% 0,0 0,0% 0,1 2,9% 0,2
Portugal 22,8 15,2% 0,0 0,0% 0,0% 0,0 0,0% 0,0 0,2% 22,8
France 19,4 13,0% 6,4 18,9% 0,2 0,7% 0,9 2,9% 1,5 35,0% 28,4
UK 10,6 7,1% 3,2 9,4% 0,4 1,2% 0,0 0,2% 0,0 0,9% 0,1 2,8% 14,3
Germany 4,1 2,7% 9,8 29,0% 2,0 6,2% 0,2 0,8% 0,4 8,9% 0,2 4,8% 16,8
Netherlands 4,0 2,7% 0,7 2,1% 0,1 0,3% 0,1 0,3% 0,0 0,7% 0,4 9,5% 5,4
Others 7,4 5,0% 7,7 22,6% 2,0 6,2% 0,9 3,0% 3,5 76,9% 1,8 42,0% 23,2
TOTAL 149,5 100% 33,9 100% 32,9 100% 29,0 100% 4,5 100% 4,2 100% 254,1
Total same period previous campaign 225,4
Difference same period previous
campaign 13%
* From 01/10 - 31/12/2016
Excl olive pomace oil
Source: Comext/Eurostat (Data transmission to Eurostat: 40 days for aggregated results)
All stat. regimes
3,5
28% 4% -6% -19% 186% 19%
117,0 32,7 34,9 35,7 1,6
Others
Destination % share
on total
% share
on total
% share
on total
% share
on total
% share
on total
% share
on total
Spain Italy Greece Portugal France

20
EU OLIVE OIL PRICES (up to 19.3.2017)

21 Source: MS declarations (R826/2008)
EXTRA VIRGIN CATEGORY

22
Source: MS declarations (R826/2008)
VIRGIN CATEGORY

23 Source: MS declarations (R826/2008)
LAMPANTE CATEGORY

24
TABLE OLIVES

25
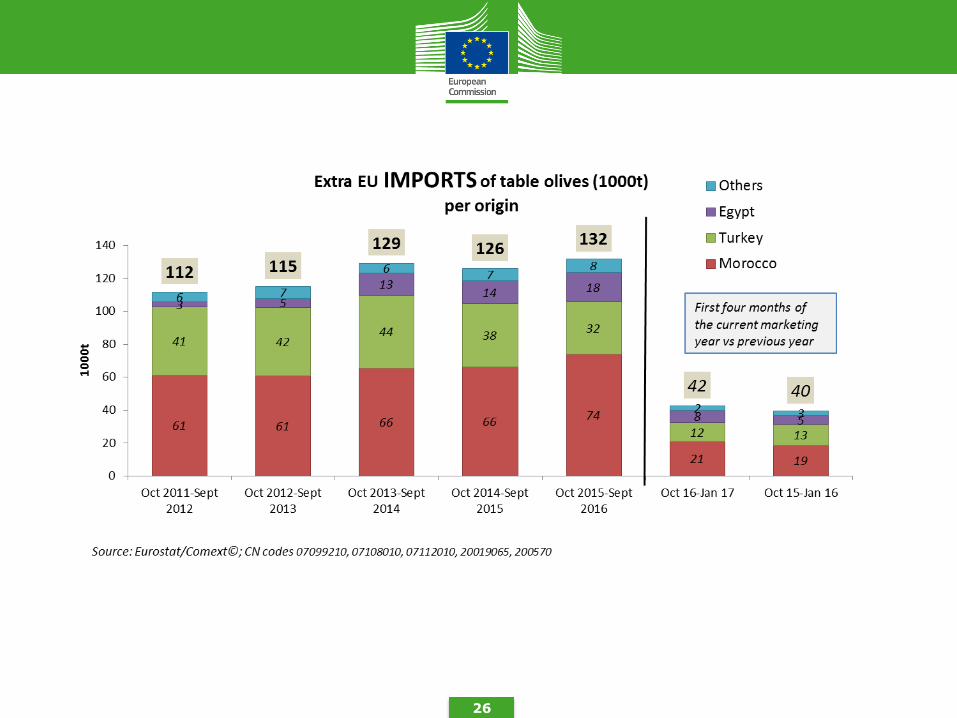
26

27

28
Thank you
More market information on olive oil:
http://ec.europa.eu/agriculture/olive-oil/index_en.htm