ironmaking process alternative
DESCRIPTION
Alternative study Blast Furnace TechnologyTRANSCRIPT

Ironmaking ProcessAlternatives Screening Study
Volume I: Summary Report
October 2000
LG Job No. 010529.01
SLURRYPIPELINE
CONCENTRATE
SLABSHIPPING
IRON OREMINE
ORE BENEFICIATIONCONCENTRATOR
SLURRYRECEIVING,
DEWATERINGPELLETPLANT
NATURALGAS
NATURAL GASPRODUCTION
DIRECTREDUCTION
PLANTS
PELLETSTOCKPILE
DRI
EAFMELTING
ELECTRICPOWER
(50% FROM COAL,50% FROM N.G.)
SLABCASTER
LMFs
STEELSLABS
ORE TOCONCENTRATOR
TO PORT
VACUUMDEGASSING

Dal\\\Da0002\01052901\common\DOE REPORT OCT 2000\Contents-Main Report.doc
Contents
Volume I: Ironmaking Alternative Study
Executive Summary...............................................................................1
Study Scope and Methodology............................................................2
Ironmaking Process Discussion and Grouping ................................3
Discussion of Ranking Analysis ..........................................................4
Summary and Conclusions ..................................................................5

\\Da0002\01052901\common\DOE REPORT OCT 2000\Report Outline.doc Page 1 of 4
Report Outline
Section 1: Executive Summary
1-1: General Discussion
1-2: Summary Conclusions
Section 2: Study Scope and Methodology
2-1: Study Scope
2-1.1 Introduction
2-1.2 Scope/Objective
2-2: Methodology and Approach
2-2.1: Introduction to the MetSim Process Simulator
2-2.2: Simulation Models of Ironmaking Processes
2-2.3: Spreadsheet Mass Balances of Process Components
2-2.4: Spreadsheet Mass Balances of Ironmaking Processes
2-3: Base Process Location
2-3.1: Base Location Assumptions
2-3.2: Location Sensitivities
2-4: Process Capital (CAPEX) and Operating Cost (OPEX)Estimates
2-4.1 Process Capital Costs (CAPEX)
2-4.2 Process Operating Costs (OPEX)

\\Da0002\01052901\common\DOE REPORT OCT 2000\Report Outline.doc Page 2 of 4
Section 3: Ironmaking Process Discussion and Grouping
3-1: Processes Considered and Initial Screening
3-1.1 Processes Considered in Initial Screening
3-1.2 Process Scenarios Selected
3-2: Process Descriptions
3-2.1 Shaft Furnace Processes
3-2.2 Rotary Kiln
3-2.3 Rotary Hearth
3-2.4 Fluidized Bed
3-2.5 Other (Reactor, etc.)
3-3: Process Groupings
3-3.1 Grouping By Product Type
3-3.2 Grouping By Stage of Commercial Development
3-3.3 Grouping By Iron Unit Feed Material
3-3.4 Grouping By Primary Reductant Type
3-3.5 Grouping By Reduction Process Type
3-3.6 Grouping By Target Nominal Size of ReductionUnit/Train
Section 4: Discussion of Ranking Analysis
4-1: Ranking Variables Considered
4-2: Sorting and Ranking By Capital Cost Estimates (Through L.S.Production)
4-3: Sorting and Ranking By Operating Cost (OPEX) EstimatesThrough Liquid Steel Production

\\Da0002\01052901\common\DOE REPORT OCT 2000\Report Outline.doc Page 3 of 4
4-4: Sorting and Ranking By Operating Cost (OPEX) EstimatesThrough Iron Unit Production
4-5: Sorting and Ranking By Simple Internal Rate of Return (I.R.R.)
4-6: Sorting and Rankings By Total Electrical Power Consumptions
4-7: Sorting and Ranking By Cumulative Process Greenhouse Gas(As CO2 only) Emissions
4-8: Sorting and Ranking By Total Cumulative (IncludingElectrical Power Generation Contribution) Greenhouse GasEmissions
4-9: Weighted Ranking Summary (All Variables)
Section 5: Summary and Conclusions
5-1: Conclusions From Sorts
5-1.1 Sorting on Capital Cost Estimates
5-1.2 Sorting on Operating Costs for Liquid Steel Production
5-1.3 Sorting on Operating Costs for Iron Unit Production
5-1.4 Sorting on Simple Internal Rate of Return (I.R.R.)
5-1.5 Sorting on Total Electric Power Consumption
5-1.6 Sorting on Cumulative Process (only) Greenhouse Gas(as CO2) Emissions
5-1.7 Sorting on Total Cumulative Greenhouse Gas (as CO2)Emissions (Including Electrical Power GenerationContribution)

\\Da0002\01052901\common\DOE REPORT OCT 2000\Report Outline.doc Page 4 of 4
5-2: Conclusions From Ranking Sorts
5-2.1 Ranking Sort on Economic Variables (1-4)
5-2.2 Ranking Sort on Energy and Environmental Variables (5-7)
5-2.3 Ranking Sort on All Variables (1-7)
5-3: General Conclusions From Sorting and Ranking Sums

\\Da0002\01052901\common\DOE REPORT OCT 2000\Section 1.doc Page 1 of 7
Section 1: Executive Summary
1-1: General Discussion
Iron in the United States is largely produced from iron ore mined in theUnited States or imported from Canada or South America. The iron ore istypically smelted in Blast Furnaces that use primarily iron ore, ironconcentrate pellets metallurgical coke, limestone and lime as the rawmaterials. Under current operating scenarios, the iron produced fromthese Blast Furnaces is relatively inexpensive as compared to currentalternative iron sources, e.g. direct iron reduction, imported pig iron, etc.
The primary problem the Blast Furnace Ironmaking approach is thatmany of these Blast furnaces are relatively small, as compared to thenewer, larger Blast Furnaces; thus are relatively costly and inefficient tooperate. An additional problem is also that supplies of high-grademetallurgical grade coke are becoming increasingly in short supply andcosts are also increasing. In part this is due to the short supply and costs ofhigh-grade metallurgical coals, but also this is due to the increasingnecessity for environmental controls for coke production.
After year 2003 new regulations for coke product environmentalrequirement will likely be promulgated. It is likely that this also willeither increase the cost of high-quality coke production or will reduce theavailable domestic U.S. supply. Therefore, iron production in the UnitedStates utilizing the current, predominant Blast Furnace process will bemore costly and would likely be curtailed due to a coke shortage.
Therefore, there is a significant need to develop or extend the economicviability of Alternate Ironmaking Processes to at least partially replacecurrent and declining blast furnace iron sources and to provide incentivesfor new capacity expansion.

\\Da0002\01052901\common\DOE REPORT OCT 2000\Section 1.doc Page 2 of 7
In the chart below, Steelmaking Feed Materials (1999) are denoted. It canbe seen that Hot Metal (primarily from Blast Furnaces) constitutesapproximately 58% of the Iron Unit Feed to Steelmaking. Recycled SteelScrap provides about 38% of the feed and Direct Reduced Iron (DRI) wasonly 4% of the raw materials for Steelmaking.
STEELMAKING FEED MATERIALS
Steel Production (1999)Total 788 million metric ton
4.1%
37.8%
57.7%
0.4%
SCRAP
DRI
HOT METAL
OTHER
The chart, Steelmaking by Process Type, summarizes the predominantSteelmaking processes used in the world. The majority of the Steel (60%)is produced by Oxygen reactor processes (i.e. BOF, QBOP, etc.).Following behind is the Electric Arc Process (EAF) with 33% and aresidual quantity (4%) by the open hearth process.
STEELMAKING BY PROCESS TYPE
Steel Production (1999)Total 788 million metric ton
60%
4% 3%
33%OXYGEN
ELECTRIC
OPEN HEARTH
OTHER

\\Da0002\01052901\common\DOE REPORT OCT 2000\Section 1.doc Page 3 of 7
Based on a total new Iron Unit Production, the overwhelming percentage(92%) is either Blast Furnace Hot Metal or pig iron. A minoritypercentage (7%) is from Direct Reduction Processes and the balance isother iron sources.
IRON UNIT PRODUCTION
Iron Production (1999)Total 583.61 million metric ton
7%
92%
1%
DRI
PIG IRON
OTHER
Of the Alternative Direct Iron Reduction Processes, 67% of the DRI isproduced by the Midrex Shaft Furnace DRI processes. The second-mostproduction of DRI (23%) is by the HYLSA processes. The balance is splitbetween SL/RN (3%), Finmet (2%) and Other (predominately Corex at5%). It is significant that the Shaft Furnace processes produce nearly 90%of the total Alternative Iron Units.
Although there are a number of Alternative Ironmaking Processes in thestartup phase or development for commercial operation (e.g. Circored,Iron Carbide, the Rotary Hearth Processes, Tecnored, etc.), non as yetchallenge the Shaft Furnace Processes. One of the constraints on theseShaft Furnace processes is that they require either high-grade lump ore orpellets as their iron unit raw material feed. Costs for such feeds aregoing up and there are limitations in supply.
The fine ore processes appear to present one possible avenue for economicAlternative Ironmaking Process development. The lower costs of the fineores make the fluidized bed processes that utilize them potentially-attractive targets for development. Processes where fine ore is combinedwith low-cost coal reduction (e.g. Tecnored, the Rotary Hearth Processes,

\\Da0002\01052901\common\DOE REPORT OCT 2000\Section 1.doc Page 4 of 7
etc.) also are potential Alternative Ironmaking processes that wouldwarrant further development.
DRI PRODUCTION BY PROCESS TYPE
World DRI production by Process (1999)Total 38.61 million metric ton
2%
23%
0%
67%
3%5%
FINMET
HYL
IRON CARBIDE
MIDREX
SL/RN
OTHER

\\Da0002\01052901\common\DOE REPORT OCT 2000\Section 1.doc Page 5 of 7
1-2: Summary Conclusions
The primary conclusions of this comparative Study of AlternativeIronmaking Process scenarios are:
• The processes with the best combined economics (CAPEX and OPEXimpacts in the I.R.R. calculation) can be grouped into those Fine Orebased processes with no scrap charge and those producing Hot Metalfor charge to the EAF.
• A pronounced sensitivity to Steel Scrap Cost was felt less by the HotMetal Processes and the Fine Ore Processes that typically do not utilizemuch purchased scrap.
• In terms of evolving processes, the Tecnored Process (and in particular,the lower-operating cost process with integral co-generation ofelectrical power) was in the most favorable groupings at all scrap costsensitivities.
• It should be noted also that the Conventional Blast Furnace processutilizing Non-Recovery coke (from a continuous coking process withintegral co-generation of electrical power) and the lower-capital costMini Blast Furnace also showed favorable Relative Economics for thelow and median Scrap Cost sensitivities.
• The lower-cost, more efficient MauMee Rotary Hearth Process thatuses a Briquetted Iron Unit Feed (instead of a dried or indurated ironore pellet) also was in the most favorable process groupings.
Those processes with lower-cost raw materials (i.e. fine ore and/or non-metallurgical coal as the reductant) had favorable combined economics.In addition, the hot metal processes (in part due to the sensible heatimpacts in the EAF and due to their inherently lower costs) also hadfavorable combined economics.
As a group, the Hot Metal processes had lower Total CumulativeElectrical Power Consumption, lower Process Emissions and lower TotalEmissions (including Electrical Power generation). These were reflectedalso in the Ranking Sum Analysis. The exception was the Shaft FurnaceDRI process (Midrex) that was in the lower group for the environmental-related variables.

\\Da0002\01052901\common\DOE REPORT OCT 2000\Section 1.doc Page 6 of 7
As an ancillary conclusion of this study, there is significant potential toextend the viable economic life of the existing Blast Furnace Processinfrastructure (and perhaps future Mini Blast Furnace) by furtherdeveloping and exploiting the evolving continuous Non-Recovery Cokingprocesses. Lockwood Greene is aware of several such processes that arebeing developed. Some have had some pilot plant-scale production andapplication testing, others are in the planning stages for pilotdemonstration.
What these processes have in common are:
• All do not have the environmental burden of producing and disposingof the noxious chemical by-products of the coking process.
• All are energy efficient (mostly autogenous) and produce waste heatthat could be utilized directly or to co-generate electrical power.
• Some utilize low-cost alternate and residual carbon sources as well aslow-rank coals to produce a formed-coke product. The increasingcosts and shortage of high-grade coking coal is mitigated by the use ofthe plentiful, low-cost alternatives.
• Most of all, due to the complete combustion of the coking by-productsand to integral pollution and emission controls, these non-recoverycoking processes as a group are much more environmentallyacceptable than conventional coking processes.
In this Alternative Ironmaking Process Study, the differences in totalemissions between a conventional, co-product coke Blast Furnace and oneutilizing the continuous non-recovery coking process (coke substitutiononly) for these two, otherwise identical, cases indicated that there wasapproximately a 7% lower total emissions from the Non–RecoveryCoke/Blast Furnace process relative to the Conventional Co-ProductCoke/Blasé Furnace.
With the inclusion of co-generation that is an integral part of theContinuous Non-Recovery Coke process, there was a 22% reduction inemissions due to total cumulative electrical power related emissions. Thiskind of environmental difference may provide incentives or constraints toutilize the lower-emitting technologies.

\\Da0002\01052901\common\DOE REPORT OCT 2000\Section 1.doc Page 7 of 7
The evolution of a lower-cost, energy-efficient and environmentally-friendly coke producing process that can utilize common carbon recycleand waste materials as well as abundant low-rank coal as the primarycarbon sources will have a significant impact on production of Iron Units.
This alternative may extend the life of the existing Blast Furnaceinfrastructure and it may present significant options for the adoption ofthe more-flexible and lower capital cost (per iron unit capacity) Mini BlastFurnace or developing processes such as Tecnored.

\\Da0002\01052901\common\DOE REPORT OCT 2000\Section 2.doc Page 1 of 33
Section 2: Study Scope and Approach
2-1: Study Scope
2-1.1: Introduction:
Iron in the United States is largely produced from iron ore mined in theUnited States or imported from Canada or South America. The iron ore istypically smelted in Blast Furnaces that use primarily iron ore, metallurgicalcoke, limestone and lime as the raw materials. Some alternate fuel sources,small percentages supplied by direct coal or natural gas injection, are alsoutilized in place of the coke. Under current operating scenarios, the ironproduced from these Blast Furnaces is relatively inexpensive as compared tocurrent alternative iron sources, e.g. direct iron reduction, imported pig iron,etc.
The primary problem the Blast Furnace Ironmaking approach is that manyof these Blast furnaces are relatively small, as compared to the newer, largerBlast Furnaces; thus are relatively costly and inefficient to operate. Anadditional problem is also that supplies of high-grade metallurgical gradecoke are becoming increasingly in short supply and costs are also increasing.In part this is due to the short supply and costs of high-grade metallurgicalcoals, but also this is due to the increasing necessity for environmentalcontrols for coke production.
Proposed and mandated environmental regulations for coke production willsignificantly increase the shortfall of domestic coke production during theinterim extension period from 1998-2003 during which new coke productiontechnologies and environmental control strategies are to be developed. Afteryear 2003 new regulations for coke product environmental requirement willlikely be promulgated. It is likely that this also will either increase the costof high-quality coke production or will reduce the available domestic U.S.supply. Therefore, iron production in the United States utilizing the current,predominant Blast Furnace process will be more costly and would likely becurtailed due to a coke shortage.
Utilization of higher percentages of imported coke in the existing BlastFurnace infrastructure will not solve the problems of short supply

\\Da0002\01052901\common\DOE REPORT OCT 2000\Section 2.doc Page 2 of 33
completely since the typically inferior quality of these sources result in lessBlast Furnace productivity and higher operating and maintenance costs.This imported coke will likely also increase in cost and become unavailableas the market demands increase.
There may be restrictions or tariffs on the use of such imported coke if it isproduced under conditions such that significant environmental emissionsresult. As is the current case, almost all of the offshore sources of importedcoke (and the domestic sources with few exceptions) do not meet current orproposed U.S. environmental standards for emissions. As a consequence,this may not be a significant viable source of supply after year 2003.
Therefore, there is a significant need to develop or extend the economicviability of Alternate Ironmaking Processes to at least partially replacecurrent and declining blast furnace iron sources and to provide incentivesfor new capacity expansion.
2-1.2: Scope/Objective:
A study was initiated to compare a number of Alternative IronmakingProcesses by Lockwood Greene Engineers in January, 2000 based on thefollowing Scope-of-Work. This work was done in conjunction withLockwood Greene Technologies who contracted for the study to LockheedMartin Energy Research Corporation, the operating agency for the U. S.Department of Energy at the Oak Ridge Laboratories facility.
The objective of the study was to evaluate a number of alternative provenand promising ironmaking processes that will feed iron units to current andfuture steelmaking processes. An initial review of available technologieswas made with a view toward grouping for evaluation similar or derivativeprocesses. These groupings plus initial energy and mass balanceconsiderations allowed a preliminary screening, selection and finalgroupings of the promising process alternatives.
Reasonably accurate and relatively precise methodologies were utilized todevelop quantitative measurements of process capital and operating costs,energy consumption and environmental emissions. A standard scenario ofthe requirements to produce 1.0 MM annual metric tons (tonnes) of refinedliquid steel (by an Electric Arc Furnace and Ladle Refining Furnace,

\\Da0002\01052901\common\DOE REPORT OCT 2000\Section 2.doc Page 3 of 33
EAF/LRF scenario) was utilized to normalize the basis of comparison for allironmaking technologies.
The true objective of the study was to define those alternative ironmakingprocesses that were lowest in costs while remaining environmentallyfriendly.
2-2: Methodology and Approach
Each process considered were defined and specified, where possible, to thesame level of confidence. In-house Lockwood Greene Engineers detailedprocess flow diagrams; spreadsheet mass balance models and processsimulation models were utilized as the basis for the comparisons. For eachprocess, the beginning point of evaluation was the primary iron unit sourceand the final point of evaluation was the refined liquid steel product. Inaddition, specific Process Vendor inputs to define the specifics of the heatand mass balances and the capital and operating costs were also utilized.
The primary reason for this approach was to have a relative comparison ofthe cumulative energy consumptions (as electric power, fuel or otherconsumables) and to provide a basis for the cumulative emission of carbonwaste gases. For purposes of comparison, all carbon gases leaving theprocess were taken to be as CO2.
The overall mass and component balances for each of the sequence and trainof various preparation processes and unit operations preceding theironmaking and steelmaking processes defines the specific sizing and costfactor requirements for the preceding processes. In addition, the quantitiesof raw materials, fuels and other commodities were defined for operatingcost development. The relationships for the primary raw materialsthemselves are also built up from their various components also.
Each component is defined and represented by a rigorous workingspreadsheet heat and material balance model. The combination of thevarious components results in a similar built-up spreadsheet model for theprimary raw materials. Extending that further, these raw materialsproduction models are combined and strung together to form the unitprocess models.

\\Da0002\01052901\common\DOE REPORT OCT 2000\Section 2.doc Page 4 of 33
For example, the steps to produce an iron ore pellet are illustrated in Figure2-2.1 below:
Preceding the production of iron ore pellets are the unit processes of:
• Iron Ore Mining• Iron Ore Concentrating• Transport of Concentrate (e.g. slurry pipeline)• Then Pelletizing
Similarly, the iron ore pellets are the primary raw material for the DirectReduction Process to product Direct Reduced Iron which, in turn, is theprimary raw material for the Electric Arc Steelmaking Process to producerefined liquid steel. The detailed component Block Flow Diagrams (BFDs)for the major raw materials for the Ironmaking Processes (e.g. electricalpower, tonnage oxygen, burnt lime, non-recovery and co-product coke, etc.)are presented in the Appendix A-3. Also presented in Appendix A-3 areBFDs for the major Ironmaking Processes showing the similar methodology
IRON OREMINING
DIESEL FUEL
EXHAUST GASES
IRON ORECONCENTRATOR
WASTE ROCK
IRON ORE
ELECTRICPOWER
TAILINGS
ORECONCENTRATE CONCENTRATE
TRANSPORT(PIPELINE)
ELECTRICPOWER
ORECONCENTRATE ORE
PELLETIZING
ELECTRICPOWER
FUEL
FLUE GASES
OTHER
INDURATED IRONORE PELLETS
DIRECTREDUCTION
PROCESS
FUEL
ELECTRICPOWER
FLUE GASES
DRIELECTRIC ARCFURNACE
STEELMAKING
FUEL
ELECTRICPOWER
INDURATED IRONORE PELLETS
LIME/MgO(FLUX)
ELECTRODES
CHARGE C
STEEL SCRAP
FLUE GASES
SLAG
SCRAP
DUST
LIQUID STEEL
FIGURE 2-2.1BASE PROCESS - DRI/EAF
OXYGEN

\\Da0002\01052901\common\DOE REPORT OCT 2000\Section 2.doc Page 5 of 33
for the built-up spreadsheet balance models utilized as the basis fordefinition and comparison in this study.
2-2.1: Introduction to the MetSim Process Simulator
The basis for analysis of all chemical and metallurgical processes is the massand energy balance. Plant design, capital costs, operating costs, andtechnical evaluations are all dependent on such calculations. MetSim is ageneral-purpose process simulation system designed to assist the engineerin performing mass and energy balances of complex processes. MetSim usesan assortment of computational methods to effect an optimum combinationof complexity, user time, and computer resource usage.
MetSim can perform mass and energy balance calculations for:
• Process feasibility studies• Alternative flowsheet evaluations• Pilot plant data evaluation• Full scale plant design calculations• Operating plant improvement studies• Actual plant operations and control.
MetSim performs mass and energy balances for chemical/metallurgicalprocesses using the sequential modular approach. A major advantage of thisapproach is that intermediate results may be obtained from any stage of theprocess in an intelligible form. In conformance with the sequential modularapproach, MetSim comprises modules containing subsets of equationsdescribing the design specifications and performance characteristics for eachprocess step. The system solves the equation subset for each module,allowing for an individual analysis of each unit operation in the flowsheet.
Given data on design variables and input stream composition, each modulecalculates all of the output stream variables that can then be used as inputstream values for the next process step. The modules access data on allindependent stream variables from the data arrays contained within theAPL (the computer language used for writing MetSim code) globalworkspace. Additional input data required to solve the equations in eachmodule are requested by the program and are stored as global variables.

\\Da0002\01052901\common\DOE REPORT OCT 2000\Section 2.doc Page 6 of 33
The user may supply actual data obtained from operating or pilot plants,from similar processes, or from estimates supplied by the engineer.
Unlike most other process simulators, MetSim eliminates the need for userinvolvement in recycle stream tearing. MetSim employs a techniquewhereby the user is required only to provide initial estimates of the recyclestream content of critical process streams.
For process adjustment and control, MetSim uses feedforward and feedbackcontrollers. Because of similarity between the dynamic behavior of MetSimcontrol and that of process control in operating plants, unstable controlstrategies can often be located during the modeling stage, avoiding costlyfield modification and retrofit.
The successful application of the MetSim system of programs involves morethan simply entering fixed data on standardized input sheets. Due to widevariation in chemical and mineral processing techniques, available data,process criteria, and output data requirements, the development of processmodels is as much an art as it is a science. It involves familiarity withmathematical modeling, numerical analysis and process control. The usermust be familiar with process engineering mass and energy balancecalculations. Thus it supplements, not replaces, sound engineering practicesand judgment.

\\Da0002\01052901\common\DOE REPORT OCT 2000\Section 2.doc Page 7 of 33
2-2.2: Simulation Models of Ironmaking Processes
A primary component in developing and defining the combined componentSpreadsheet Heat and Mass balance models of the various IronmakingProcesses are the MetSim Simulation Models of the Ironmaking Processes.As discussed earlier, the balances for the various Ironmaking Processes arenormalized using the basis of production as being 1.0 MM tonnes of RefinedLiquid Steel (RLS) per year as the common denominator. In all casesconsidered, the RLS production route utilized the various forms of ironproduced (i.e. liquid hot metal, cold pig iron, direct reduced iron, etc.) by thevarious Ironmaking Process as the primary iron source to an appropriateEAF/LRF operation.
The commercially-available MetSim process simulation software system(Proware, Phoenix, AZ) as described in Section 2.2.1 was utilized to developthe rigorous simulation models of most of the various IronmakingProcesses. MetSim provides the system by which the fundamental chemicalreactions and equilibria in the Gas, Liquid and Solid phases of Ironmakingcan be simulated under a simultaneous equilibrium operating conditions.However, the model developer must define these fundamental chemicalreactions, the chemical yields or extent of reaction, the components for thevarious phases and organize the model to simulate the entire flowsheet ofthe Ironmaking Process.
Such a process simulation model (as opposed to a simple spreadsheetbalance model) will actually predict the behavior and performance of theentire process. The entire flowsheet itself including: the process, thereducing gas production and recirculating streams, the cooling waterrequirements, and the off-gases or emissions are modeled.
Controls and process control loops are provided (as in the actual operatingprocess) to allow the modeler to specify and constrain the processperformance and product requirements. As changes are made in theassumptions for raw materials, process inputs or for operating conditionsare made by the modeler, the prediction of the variations of the outcomes ofthe simulated process can provide sensitivities of production, yield, productquality, etc.
\\Da0002\01052901\common\DOE REPORT OCT 2000\Section 2.doc Page 8 of 33
Lockwood Greene has developed such models for the following IronmakingProcesses:
• Base Case Midrex Shaft Furnace
• Hylsa HYL IVM (Reformerless with Hot DRI Charge to EAF)
• Tecnored Shaft Melter
• HiSmelt Oxygen Reactor
• Redsmelt Rotary Hearth Furnace
• Circored Fluid-Bed Reduction Process (Natural Gas Reductant)
• Circofer Fluid-Bed Reduction Process (Coal Reductant)
• Generic Iron Carbide Process (Single-Stage, Two-Stage or Multi-Stage)
The model outputs for a typical Ironmaking sensitivity cases for each modelare presented in Appendix E.
What is important here is that these basic simulation models were used inthis Study to evaluate and verify Vendor-Supplied heat and material balancedata, production data and operating assumptions. Once verified, theMetSim models for the Ironmaking Processes were used to “tune” or adjustthe Spreadsheet Models for the overall process (through EAF/LRF LRS) toprovide realistic raw material, component and energy (fuel plus electricalpower) balance systems.

\\Da0002\01052901\common\DOE REPORT OCT 2000\Section 2.doc Page 9 of 33
This methodology is illustrated in Figure 2-2.2 below:
2-2.3 Spreadsheet Mass Balances of Process Components
As illustrated above, each of the raw material components utilized as feedsto the Ironmaking or Steelmaking processes were also defined byappropriate spreadsheet heat and material balances. These were preparedfor the major components and also for the intermediate Unit Processes sothat the cumulative fuel and electrical energy requirements could beaccounted for. In addition, these component balance models provide thebasis for defining the cumulative process carbon-gas emissions (all taken tobe as CO2) for each process and process step to serve as relative indicatorsfor comparison of the diverse Ironmaking Processes.
IRONMAKINGPROCESS
SPREADSHEETMODEL
COMPONENT 1PRODUCTION
SPREAD SHEETMODEL
COMPONENT 3PRODUCTION
SPREAD SHEETMODEL
COMPONENT 2PRODUCTION
SPREAD SHEETMODEL
EAF
STEELMAKINGPROCESS
SPREADSHEETMODEL
METSIMIRONMAKING
PROCESSHEAT & MAT.
BALANCE MODEL
METSIMSTEELMAKING
PROCESSHEAT & MAT.
BALANCE MODEL
IRONMAKINGPROCESS
SPREADSHEET
STEELMAKINGPROCESS
SPREADSHEET
RIGOROUS HEAT &MATERIAL BALANCE
MODELS (METSIM)
SUM INDIVIDUALCONTRIBUTIONS TO
ELECTRICAL POWER ANDGREENHOUSE GAS
EMISSIONS
FIGURE 2-2.2METHODOLOGY FOR EACH
IRONMAKING PROCESSINDIVIDUAL COMPONENT
BALANCES(I.E. RAW MATERIALS, ELECTRIC
POWER, FUELS, ETC.)

\\Da0002\01052901\common\DOE REPORT OCT 2000\Section 2.doc Page 10 of 33
The spreadsheet model balance utilized for the components are provided inAppendix B for:
• Electrical Power Generation – Coal, Natural Gas & Fuel Oil (Basis forCumulative Greenhouse Gas Emission per kWhr– As CO2)
• Lump Iron Ore
• Pelletizing Binder –Bentonite
• Coal
• Burnt Lime/Dolomite
• Oxygen Gas
• Carbon Electrode
• Co-Product (Conventional By-Product) Coke
• Non-Recovery Coke Process With Co-Generation (Based on AntaeusEnergy Process)
• Other Raw Material Assumptions
2-2.4 Spreadsheet Mass Balances of Ironmaking Processes
As illustrated above in Figure 2-2.2, the component mass balancespreadsheets are integrated with the Unit Process spreadsheets of theupstream operations preceding Ironmaking and Steelmaking. These, inturn, integrate with the detailed process spreadsheet mass balances for theindividual Ironmaking Processes and the subsequent EAF/LRF operationsto produce LRS.
The following examples of the totally-integrated process spreadsheetsutilized in the study are illustrating the level of detail utilized to establishthe process balances, define fuel and energy consumptions and estimateprocess emissions. The complete spreadsheet listings are provided inAppendix D:
• 100% DRI Charged to EAF - 1.0% Carbon• 100% DRI Charged to EAF – 2.5% Carbon• 30% DRI Charged to EAF - 1.0% Carbon• 100% Scrap Charged to EAF (For Reference Only)

\\Da0002\01052901\common\DOE REPORT OCT 2000\Section 2.doc Page 11 of 33
Spreadsheet summary balances were prepared for the major IronmakingProcess scenarios (i.e. various process types and EAF production scenariosfor LRS) selected from the initial screening analysis. These provide thecomponent quantities and logic from which process Operating Costs,emission estimates and energy consumptions are developed as a basis forprocess comparison.
Process descriptions of the Ironmaking Processes considered in the studyare provided in Appendix A-1 and simplified Ironmaking Process FlowDiagrams (PFDs) are provided in Appendix A-2.
The Summary Spreadsheets for the process scenarios are provided inAppendix C:
SHAFT FURNACE DRI – VARIATION IN CARBON AND SCRAP CHARGE
• Base Case: 100% Shaft Furnace DRI (i.e. Midrex) Charge to EAF, 1.0wt.% DRI (Recycle Steel Scrap Only)
• 100% Shaft Furnace DRI (i.e. Midrex) Charge to EAF, 2.5 wt.% Carbon(Recycle Steel Scrap Only)
• 100% Steel Scrap Charge to EAF (For Reference Only)
• 30% Shaft Furnace DRI/70% Scrap Charge to EAF (a Common IndustryPractice), 1.0 wt.% DRI Carbon
• 30% Shaft Furnace DRI/70% Scrap Charge to EAF (a Common IndustryPractice), 2.5 wt.% DRI Carbon
• Hylsa Shaft Furnace Without Reformer (HYL IVM), Hot DRI Charge toEAF
HOT METAL VARIATIONS
• 30% Blast Furnace Hot Metal/70% Scrap Charge to EAF, Co-ProductCoke
• Mini Blast Furnace Comparison @ 30% H.M./70% Scrap Charge to EAF,Co-Product Coke

\\Da0002\01052901\common\DOE REPORT OCT 2000\Section 2.doc Page 12 of 33
• 30% Blast Furnace Hot Metal/70% Scrap Charge to EAF, Non-RecoveryCoke
• 30% Cold Pig Iron/70% Scrap Charge to EAF, 4.5% Carbon
• 30% Tecnored Hot Metal/70% Scrap Charge to EAF, 4.5% CarbonH.M. With Integral Co-Generation of Electrical Power
• 30% Tecnored Hot Metal/70% Scrap Charge to EAF, 4.5% CarbonH.M. Without Co-Generation of Electrical Power
• Corex (VAI)/Midrex with 60% Hot Metal and 40% DRI Charge to EAF
• HiSmelt (ISCON) with 34.5% Hot Metal Charge to EAF
ROTARY HEARTH FURNACES
• Redsmelt (Mannesmann) Hot Metal With Only Recycle Scrap Charge toEAF
• MauMee R&E Briquette DRI/EAF With Only Recycle Scrap Charge toEAF
• ITMK3 (Midrex RHF) to EAF With Only Recycle Scrap Charge to EAF
FLUID-BED DRI/HBI
• Circored (Lurgi)/HBI/EAF With Only Recycle Scrap Charge to
• Circofer (Lurgi)/HBI/SAF/EAF With Only Recycle Scrap Charge toEAF
• Finmet (VAI)/HBI/EAF With Only Recycle Scrap Charge to EAF
• Generic Iron Carbide (ICH)/EAF With Only Recycle Scrap to EAF(Represents Nucor/ICH, Qualitech/Kawasaki, Procedyne Processes)
• 40% Iron Carbide Charge/60% Scrap to EAF (Believed to be MaximumPractical or Feasible Charge Ratio)
OTHER PROCESSES
• SL/RN (Stelco-Lurgi) Rotary Kiln With Only Recycle Scrap Charge toEAF

\\Da0002\01052901\common\DOE REPORT OCT 2000\Section 2.doc Page 13 of 33
2-3: Base Process Location
2-3.1 Base Location Assumptions
In an initial screening of a number of Ironmaking process, both provencommercial and developing processes, it was recognized that the location ofthe process could have a significant impact on the technical and economicviability of that process. A number of factors related to location wereconsidered to be potentially critical in evaluating and comparing processes.Some of these are related to raw material supply, others to proximity tomarkets for the products and some relate to local economic considerations ofraw materials or labor costs.
These factors relating to location include:
• Proximity to ore source
• Proximity to pellet source (for those processes utilizing pellets)
• Local fuel (i.e. reductant) sources
• Costs, skills and productivity of local labor force
• Local market for product (assumed to be steel slabs from downstreamSteelmaking operations)
• Availability of low-cost steel scrap sources of adequate purity for EAFSteelmaking
• Local environmental regulations, constraints, etc.
It was clear in the initial evaluation and screening of potential alternativeironmaking processes (to that of Blast Furnace Iron – hot metal or pig iron),that local proximity to low-cost reductant sources (i.e. either natural gas orappropriate coal resources) would be a significant swing variable in rankingof the potential alternate processes. This local proximity to fuel would notonly impact on the choice of reductant type, it would influence the choice ofprocess type, i.e. that which would utilize natural gas or that which wouldutilize coal as the primary reductant. These considerations arepredominately economic, but could also be related to environmental impactor a desired steelmaking process iron unit feed.

\\Da0002\01052901\common\DOE REPORT OCT 2000\Section 2.doc Page 14 of 33
2-3.2 Location Sensitivities
• Proximity to ore source
The most significant component of Operating Costs for the Ironmakingprocesses is the cost of iron units supplied to the process. Another factor isthe form of the iron unit raw material delivered (i.e. as high-grade lump ore,pellets from iron ore concentrate or iron ore fines). A significant additionalfactor is the availability of supply of the desired iron unit raw material. Allof these factors are related to the location of the Ironmaking process relativeto the source of the iron unit raw material.
Since some Ironmaking process performance factors relate to the quality ofthe iron unit feed, close proximity to the source may provide a morefavorable access to the most desirable feed material. This can impact of therelative performance of one process over another. For example, there maybe alternate methods of delivery (e.g. slurry pipeline) or availability ofquantities at significantly-lower cost per iron unit for ore fines. Processesthat can directly utilize them, perhaps without further beneficiation orpalletizing, could have a local advantage.
Similarly, raw material cost factors (i.e. material handling and delivery costs,availability of low-cost fines, etc.) may influence significantly the choice ofIronmaking process. Availability of suitable port, rail or other deliveryfactors for raw materials and acceptable access to the raw material sourcesmay partially mitigate a location-related factor for the iron unit feeds.
In this study, an upper Midwest U.S.A. location was chosen (i.e. NorthernOhio or Indiana) to provide a Target Location that would have all of therequired factors for raw material delivery so as to not significantly bias therelative Ironmaking process evaluation and comparisons. Delivered rawmaterial costs and availability are acceptable for that location and would notnecessary favor one process over another. However, in this fashiondelivered costs of raw materials (including supply and transportation) werethus normalized, but not necessarily optimized, for all processes.

\\Da0002\01052901\common\DOE REPORT OCT 2000\Section 2.doc Page 15 of 33
• Proximity to pellet source
For those processes utilizing indurated iron concentrate pellets, there couldbe significant impacts of location relative to the source of concentrates ordirect reduction grade (DR) pellets. An ironmaking project that includes it’sown source of ore, concentrates and subsequent pellet production, mayfavor selection of an ironmaking process that benefits most directly by thatconstancy of feed quantity and quality. An example of this is the ShaftFurnace DRI processes, Midrex or Hylsa.
During high-iron production times, there could even be shortages of supplyof the most desirable pellet feeds for some Ironmaking processes. Closenessto the source of pellets may present an advantage in availability or deliveredcost. As described above, the choice of an upper Midwest U.S.A. locationwas designed to neither present an advantage or to be a disadvantage to theselection or comparison of Ironmaking processes.
• Local fuel sources
Second in importance related to Location, is that of the fuel (or reductant)source and/or type. There will definitely be advantages, similar to thosefor iron unit supply, to any of the Ironmaking processes is they can belocated close to a readily-available, low-cost fuel supply. As noted above,the fuel supply (rate and quality) and delivered cost will be a primaryconsideration in the selection of the Ironmaking process type.
If low-cost coals of the proper type are available in a particular locationversus a higher-cost supply of natural gas, this may influence the selectionof a coal-based reductant ironmaking process. If metallurgical coal (forconventional coke production) is in short supply or is at a premium cost,selection of a process (e.g. rotary hearth, Tecnored or non-recovery coking)that can utilize lower-cost, readily-available, low-rank coals may be the onlyprocess option. A similar situation where synthesis gas in quantity (i.e.Sasol Gas at Saldanha, SA.) is available may dictate the ironmaking processselection due to favorable fuel gas properties for that process.
In some locations, low-cost natural gas or suitable coal may not even beavailable locally. Thus, the relative costs of importing the quantities of fuelnecessary could influence significantly the choice of Ironmaking process or

\\Da0002\01052901\common\DOE REPORT OCT 2000\Section 2.doc Page 16 of 33
the overall project economics. The choice of an upper Midwest projectlocation does not necessarily favor one fuel source over another.
• Costs, skills and productivity of local labor force
Labor costs as a fraction of the Operating Costs for iron or steel product are arelatively-low percentage (≈10% or less of the totals). Differences in laborrates from one site location to the other would not significantly impact onthe overall production costs. An important factor may be local laborproductivity. In some countries, or in some regions of North America,effective productivity of labor not compensated for in the labor rates, mayhave an impact on the costs of production for some of the Ironmakingprocesses. There are significant differences in the manpower requirementsfor some of the ironmaking scenarios (when normalized to North Americanstandards) that could influence the choice of process or overall projecteconomics.
More importantly, however, some Ironmaking processes, in particular thosehigher-technology processes in development or in their first-of-a-kindprototype phase, could require a more highly-skilled labor force to operateor maintain. This may not be readily available, would command an extra-ordinarily-high premium on labor rates or would require importation ofskilled labor for some processes in some locations. This could influencesignificantly the choice of process related to a specific location.
The upper Midwest location should neither present an advantage nor adisadvantage to any specific Ironmaking process. It would have an overallfavorable labor market due to the high skill and experience levels of theavailable work force and a general familiarity with heavy industrialprocesses such as ironmaking and steelmaking.
• Local market for product
In general, the upper Midwest U.S.A. location would be a favorable one fora steel slab product produced from any of the Ironmaking processes. Theability of some Ironmaking processes (particularly those producing DRI) toproduce a favorably low impurity scrap substitute iron feed, could favor theproduction of low-impurity steel for specific industry (e.g. deep drawingquality auto body grades, etc.). However, the market for all types of steel
\\Da0002\01052901\common\DOE REPORT OCT 2000\Section 2.doc Page 17 of 33
from this general location would not favor one type of process over theother.
Shipment or transportation of the finished steel slab product would also begenerally favorable with options including water shipment, rail or truckshipment of the steel product. There is also the possibility of closeintegration with an existing customer for a steel slab product that wouldeliminate the necessity of product shipping.
• Availability of low-cost steel scrap
A significant finding of this Alternative Ironmaking Study is that theselection of an Ironmaking process (for ultimate EAF/LRF steelmaking) isdirectly influenced by the availability, cost and purity of steel scrap. This isnot only a significant factor in the selection of the appropriate Ironmakingprocess, but in the net final cost of the final LRS product. It may be thatthose ironmaking processes that most efficiently combine with the EAFsteelmaking to minimize the quantity or quality (i.e. costs or availability) ofsteel scrap would be the only economically-viable Ironmaking processes ofchoice in a high cost steel scrap market.
Discussed in Section 2-4 and in Section 4, the steel scrap price sensitivity is aprimary factor in Ironmaking process selection. With the fluctuation insteel scrap prices with the past two years over a range of approximately +/-50% from the average (see Figure 2-3.1 below), ironmaking processes (incombination with EAF/LRF) that are viable at median or lower scrap pricesare not viable at the above average scrap price.

\\Da0002\01052901\common\DOE REPORT OCT 2000\Section 2.doc Page 18 of 33
Steelmaking that requires a higher scrap charge would have a net result ofhigher steelmaking costs.
This also works against those Ironmaking processes that are designed to bescrap substitutes, i.e. DRI producers such as the shaft furnaces. It is a trueperspective that Shaft Furnace DRI facilities that were installed just one ortwo years ago under a favorable economic climate (e.g. moderate scrapprices) became uneconomically viable and with no competitive market atlow scrap prices.
• Local environmental regulations, constraints, etc.
A key part of the initial evaluation and process screening phases of thisAlternative Ironmaking Study was the overall impact on greenhouse gasemissions for each process (as represented in the Study by total thecumulative carbon gas emissions as CO2). Not only is this factor animportant one in comparing the various processes, it is one that couldimpact on the ability to install a particular process at a specific location.
There are several forces are working against each other. One is that the totallocal emissions for a given process may exceed the Local environment
FIGURE 2-3.1: STEEL SCRAP PRICE COMPOSITE($/mt WEEKLY FROM JANUARY 1998)
$0.00$20.00$40.00$60.00$80.00
$100.00$120.00$140.00$160.00$180.00
0 20 40 60 80 100 120 140 160
WEEKLY FROM JAN. 1998
SCRAP COMP. MEDIAN PRICE
\\Da0002\01052901\common\DOE REPORT OCT 2000\Section 2.doc Page 19 of 33
regulatory standards or limits; thus prohibiting selection of that process forthat specific location or requiring extra-ordinary mitigation and control. Asecond factor is that of the cumulative total emissions for the entire train ofthe process (i.e. ore mining, concentration, pelletizing, etc.) may be high andthus would have a broad impact on the total environment. A lastenvironmental factor is that the total electrical power requirements for aprocess are high. This also would have a broad impact on the totalenvironment since there are significant emissions (on the average for aU.S.A. location, See Appendix A-3.1) associated with electrical powergeneration that cannot be ignored when comparing processes to produceLRS.
It will be noted in the comparative analysis below (Section 4-7) that coal-based reductant processes typically have significantly more emissions (asCO2) than natural gas reductant processes. A local environmentalrestriction or constraint may dictate the use of an Ironmaking process withlower local emission levels.
Two specific ironmaking scenarios were evaluated in this Study where thereis a significant difference of the impact of emissions from the cokingproduction processes. The production of coke for use in a blast furnace is asignificant contributor to the overall emissions of the blast furnace process.The first scenario is one that the conventional Blast Furnace processproduces hot metal utilizing conventional co-product coke production. Thesecond is one where the blast furnace produces hot metal utilizing anevolving, continuous non-recovery coke production process. For thesecases, no differences in the blast furnace productivity or chargerequirements were assumed as a result of the use of one type of coke or theother.
(Note: Physical and chemical parameters for the briquetted form cokeproduced by the non-recovery process may indicate that, in fact, the blastfurnace productivity could be higher.)
The comparison of the total emissions for these two, otherwise identical,cases indicated that there was approximately a 7% lower total emissionsfrom the Non–Recovery Coke/Blast Furnace process relative to theConventional Co-Product Coke/Blasé Furnace. With the inclusion of co-generation that is an integral part of the Continuous Non-Recovery Coke

\\Da0002\01052901\common\DOE REPORT OCT 2000\Section 2.doc Page 20 of 33
process, there was a 22% reduction in emissions due to total cumulativeelectrical power related emissions. This kind of environmental differencemay provide incentives or constraints to utilize the lower-emittingtechnologies.
2-4: Process Capital (CAPEX) and Operating Cost Estimates
2-4.1: Process Capital Costs (CAPEX)
The Relative Capital Cost (CAPEX) estimates for each of the AlternativeIronmaking Processes were developed from appropriate Iron andSteelmaking Unit Operation internal LGE Cost, Feasibility or DetailedDesign Studies. In addition, some specific Process Vendor inputs wereutilized to provide a most recent estimate basis or where the appropriate in-house data were not available. The installed cost estimates were factoredusing internal LGE factors for the costs for similar scopes for process areasor plant type for each of the Ironmaking Processes. Where common costareas are present for different Ironmaking processes, e.g. pelletizing plant ,the basis costs were factored for each Ironmaking process according tocapacity requirements.
The costs used were updated to a year 2000 basis and normalized using theprocess Mass Balances (Appendix C) to a uniform 1.0 million metric tonnesper year Refined Liquid Steel (RLS) production basis. Specific differences inscope required for a particular Ironmaking process were accounted for inthe individual components considered in the overall process CAPEXestimates (summarized in detail in Volume II, Appendix F-5). The CAPEX isreported as $/annual metric tonne of production.
The analysis of the relative CAPEX estimates for the various Ironmakingprocess scenarios will be presented in Section 4.2.

\\Da0002\01052901\common\DOE REPORT OCT 2000\Section 2.doc Page 21 of 33
The built-up CAPEX costs are presented in Appendix F-5 and aresummarized in the Table 2-4.1 below:
Table 2-4.1
CAPITAL COST ESTIMATES - IRONMAKING AND EAF/LRF PROCESSES
APPENDIX PROCESS CAPEX
NO. ($/ANNUAL mt L.S.)
SHAFT FURNACE DRI PROCESSES:
C-1 100% Shaft Furnace DRI charge to EAF, 1.0 wt.% Carbon $365.36
C-2 100% Shaft Furnace DRI charge to EAF, 2.5 wt.% Carbon $365.45
C-3 100% Steel Scrap charge to EAF $173.68
C-4 30% Shaft Furnace DRI/70% Scrap to EAF, 1.0 wt.% DRI Carbon $231.85
C-5 30% Shaft Furnace DRI/70% Scrap to EAF, 2.5 wt.% DRI Carbon $232.70
C-6 HYLSA Shaft Furnace without reformer, Hot DRI charge to EAF $362.60
HOT METAL VARIATIONS
C-7 30% Blast Furnace Hot Metal/70% Scrap to EAF, Co-Product Coke $243.64
C-7a 30% Blast Furnace Hot Metal/70% Scrap to EAF, Mini Blast Fce. $198.05
C-8 30% Blast Furnace Hot Metal/70% Scrap to EAF, Non-Recov. Coke $243.63
C-9 30% Cold Pig Iron/70% Scrap to EAF, 4.5% Carbon Pig $248.06
C-10 30% Technored Hot Metal/70% Scrap to EAF, with Co-Generation $196.48
C-11 30% Technored Hot Metal/70% Scrap to EAF, without Co-Gen. $187.71
C-12 COREX/MIDREX with 60% Hot Metal/40% DRI charge to EAF $373.50
C-13 HISMELT with 32.7% Hot Metal charge to EAF $259.63
ROTARY HEARTH FURNACES
C-14 REDSMELT Hot Metal with only Recycle Scrap to EAF $334.67
C-15 MAUMEE Briquette DRI/EAF with only Recycle Scrap to EAF $292.32
C-16 ITMK3 to EAF with only recycle scrap charge to EAF $296.10
FLUID-BED DRI/HBI
C-17 CIRCORED/HBI/EAF with only Recycle Scrap charge to EAF $232.37
C-18 CIRCOFER/HBI/SAF/EAF with only Recycle Scrap charge to EAF $239.63
C-19 FINMET/HBI/EAF with only Recycle Scrap Charge to EAF $263.47
C-20a Generic IRON CARBIDE/EAF with only Recycle Scrap to EAF $347.59
C-20b Generic IRON CARBIDE/EAF with 60% Scrap charge to EAF $257.24
OTHER PROCESSES
C-21 SL/RN Rotary Kiln with only Recycle Scrap charge to EAF $344.39

\\Da0002\01052901\common\DOE REPORT OCT 2000\Section 2.doc Page 22 of 33
2-4.2 Process Operating Costs (OPEX)
The approach followed in developing the operating costs for the variousIronmaking Processes was to build up the operating costs (OPEX) from theindividual components of each process scenario.
The bases for these costs include:
• Consumable components as defined by the mass and fuel balances(Appendix B).
• Electrical power consumptions from experience or Process Vendor data.
• Labor estimates were factored from man-hour/mt data supplied byProcess Vendors and from LGE experience with similar processes.
• Costs and/or fuel costs for transport of materials.
• Allowances for maintenance materials and supplies based on Vendorfactors.
• As appropriate, allowances for G&A were added.
Each process component cost was built up using the above factors for eachunit operation involved in producing and delivering the consumable to theironmaking process.
In tables in Appendix F-1, the Consumable Component costs are definedand summarized for:
• Bentonite Binder
• Coal (lump delivered to use)
• Burnt Lime/Dolomite
• Lump Iron Ore
• Fine Iron Ore
• Iron Ore Concentrate
• Iron Ore Pellets
• Co-Product Coke Production

\\Da0002\01052901\common\DOE REPORT OCT 2000\Section 2.doc Page 23 of 33
• Non-Recovery Coke/with Co-Generation
• Steel Scrap Composite Price Basis
2-4.3 Ironmaking Process Consumptions & Relative Operating Costs
The Ironmaking Process Consumptions and their Relative Operating Costsare built up from the costs of the various consumable materials in a similarmanner.
• Consumable components as defined by the mass and fuel balances forthe Ironmaking Processes (Appendices C & D).
• Electrical power consumptions from experience or Process Vendor data.
• Labor estimates were factored from man-hour/mt data supplied byProcess Vendors and from LGE‘s in-house experience for similarprocesses.
• Costs for transport of materials included in material costs.
• Allowances for maintenance materials and supplies based on Vendorfactors.
• Other consumable cost assumptions, e.g. composite steel scrap; overalllabor cost per man-hour, natural gas, electrical power, and otherdelivered materials are based on an upper Mid-West U.S.A. location.These were derived from negotiated commodity costs achieved for arecent large-scale project in that region. (Note: Costs for electricalpower, fuel, etc. were first-quarter 2000. They were not changed due torecent escalations. It is believed that most relative comparisons will stillbe valid.)
• As appropriate, allowances for G&A and/or Vendor fees were added.
Each Ironmaking Process Cost was derived from the summation of theindividual costs of each unit operation involved in producing the Iron Unitsand subsequent production of EAF/LRF Refined Steel Product.
The Process Operating Costs, (OPEX), developed in the above fashion arebelieved to be relatively precise as a basis for comparing the variousprocesses on an equalized footing. By normalizing all processes throughthe production of the Refined Liquid Steel product, all types of iron units

\\Da0002\01052901\common\DOE REPORT OCT 2000\Section 2.doc Page 24 of 33
produced by the Ironmaking Processes can be compared. Thus hot metalproducing processes are comparable on an equalized basis to direct reducediron producing processes. The relative accuracy of each of the componentsof the OPEX based on closure of the mass balances should produce a fairoverall cost for each process that can be compared accurately to each other.
It is also believed that the absolute accuracy of these OPEX costs is alsorelatively precise. Spot checks of the estimated costs and comparisons withrecent detailed feasibility studies using Vendor data of these and similarprocesses have verified the accuracy of the built up operating costcalculation procedure.

\\Da0002\01052901\common\DOE REPORT OCT 2000\Section 2.doc Page 25 of 33
The Table 2-4.2 provides a summary of the primary Ironmaking ProcessOperating Costs (as presented in detail in Volume II, Appendix F-4):
Table 2-4.2
OPERATING COST ESTIMATES - IRONMAKING AND EAF/LRF PROCESSES
APPENDIX PROCESS OPEX FOR I.U. OPEX FOR L.S.
NO. ($/ANN. mt I.U.) ($/ANN. mt L.S.)
SHAFT FURNACE DRI PROCESSES:
C-1 100% Shaft Furnace DRI charge to EAF, 1.0 wt.% Carbon $132.44 $205.39
C-2 100% Shaft Furnace DRI charge to EAF, 2.5 wt.% Carbon $132.55 $206.42
C-3 100% Steel Scrap charge to EAF $0.00 $197.39
C-4 30% Shaft Furnace DRI/70% Scrap to EAF, 1.0 wt.% DRI Carbon $137.51 $203.36
C-5 30% Shaft Furnace DRI/70% Scrap to EAF, 2.5 wt.% DRI Carbon $136.14 $204.72
C-6 HYLSA Shaft Furnace without reformer, Hot DRI charge to EAF $125.52 $196.15
HOT METAL VARIATIONS
C-7 30% Blast Furnace Hot Metal/70% Scrap to EAF, Co-Product Coke $142.86 $204.39
C-7a 30% Blast Furnace Hot Metal/70% Scrap to EAF, Mini Blast Fce. $142.86 $204.39
C-8 30% Blast Furnace Hot Metal/70% Scrap to EAF, Non-Recov. Coke $110.77 $192.97
C-9 30% Cold Pig Iron/70% Scrap to EAF, 4.5% Carbon Pig $145.12 $212.79
C-10 30% Technored Hot Metal/70% Scrap to EAF, with Co-Generation $125.95 $192.41
C-11 30% Technored Hot Metal/70% Scrap to EAF, without Co-Gen. $163.09 $205.72
C-12 COREX/MIDREX with 60% Hot Metal/40% DRI charge to EAF $208.88 $228.34
C-13 HISMELT with 32.7% Hot Metal charge to EAF $137.85 $198.19
ROTARY HEARTH FURNACES
C-14 REDSMELT Hot Metal with only Recycle Scrap to EAF $101.83 $190.67
C-15 MAUMEE Briquette DRI/EAF with only Recycle Scrap to EAF $66.44 $177.03
C-16 ITMK3 to EAF with only recycle scrap charge to EAF $67.60 $181.12
FLUID-BED DRI/HBI
C-17 CIRCORED/HBI/EAF with only Recycle Scrap charge to EAF $78.79 $185.27
C-18 CIRCOFER/HBI/SAF/EAF with only Recycle Scrap charge to EAF $96.20 $188.55
C-19 FINMET/HBI/EAF with only Recycle Scrap Charge to EAF $79.42 $185.12
C-20a Generic IRON CARBIDE/EAF with only Recycle Scrap to EAF $66.19 $177.84
C-20b Generic IRON CARBIDE/EAF with 60% Scrap charge to EAF $100.79 $192.65
OTHER PROCESSES
C-21 SL/RN Rotary Kiln with only Recycle Scrap charge to EAF $74.08 $183.10
Basis: $120/mt Composite Steel Scrap Cost
The Ironmaking Process Operating Cost details are summarized inAppendix F-4 for the following process scenarios:

\\Da0002\01052901\common\DOE REPORT OCT 2000\Section 2.doc Page 26 of 33
SHAFT FURNACE DRI PROCESSES
• Base Process Shaft Furnace (i.e. Midrex), 100% DRI charge to EAF, 1.0wt.% DRI Carbon (Appendix C-1)
• Base Process Shaft Furnace (i.e. Midrex), 100% DRI charge to EAF, 2.5wt.% DRI Carbon (for reference, Appendix C-2)
• Electric Arc Furnace Steelmaking, 100% Steel Scrap Charge (forreference, Appendix C-3)
• Base Process Shaft Furnace (i.e. Midrex), 30% DRI/70% Steel Scrapcharge to EAF (a common industry practice), 1.0 wt.% DRI Carbon(Appendix C-4)
• Base Process Shaft Furnace (i.e. Midrex), 30 % DRI/70% Steel Scrapcharge to EAF (for reference, Appendix C-5)
• HYLSA IVM Shaft Furnace without reformer, 100% hot DRI charge toEAF, (Appendix C-6)
HOT METAL VARIATIONS
• Blast Furnace Hot Metal (30% H.M./70% Steel Scrap charge to EAF),Conventional Co-Product Coke (Appendix C-7)
• Mini Blast Furnace Comparison (30% H.M./70% Steel Scrap charge toEAF), Co-Product Coke
• Blast Furnace Hot Metal (30% H.M./70% Steel Scrap charge to EAF),Non-Recovery Coking process with Co-Generation (for comparison,Appendix C-8)
• Cold Pig Iron (30% P.I./70% Steel Scrap charge to EAF), ConventionalCo-Product Coke (Appendix C-9)
• Tecnored Hot Metal (30% H.M./70% Steel Scrap charge to EAF) withintegral Co-Generation of Electrical Power (Appendix C-10)
• Tecnored Hot Metal (30% H.M./70% Steel Scrap charge to EAF) withoutCo-Generation of Electrical Power (Appendix C-11)
• Corex (VAI)/Midrex Shaft Furnace combination process, 60% H.M./40%DRI charge to EAF (Appendix C-12)

\\Da0002\01052901\common\DOE REPORT OCT 2000\Section 2.doc Page 27 of 33
• HiSmelt Enriched Oxygen Reactor Process, 32.7% H.M. feed to EAF(Appendix C-13)
ROTARY HEARTH DRI FURNACES
• REDSMELT (Mannessmann) process to produce RHF DRI, Hot Metalutilizing a SAF, recycle scrap only charge to EAF (Appendix C-14)
• MauMee Research & Engineering Briquette DRI charge (100% with onlyrecycle scrap charge to EAF) (Appendix C-15)
• ITMK3 (Midrex RHF) process producing reduced shot iron pelletscharge to Melter/EAF (100% with only recycle scrap charge to EAF)(Appendix C-16) (Note: Other Rotary Hearth Processes, e.g. Inmetco,Iron Dynamics, FastMet/FastMelt, etc. are so generically similar to thoseabove, that they were not individually considered.)
FLUID-BED DRI/HBI
• Circored (Lurgi) natural gas based circulating fluid bed/bubbling bedfine ore process with 100% HBI charge to EAF (Appendix C-17)
• Circofer (Lurgi) fine coal and fine ore circulating fluid bed/bubbling bedwith HBI charge to SAF and low-carbon, low-Si H.M. charge to EAF(Appendix C-18)
• Finmet (VAI) multi-stage fluidized bed fine ore process, natural gasbased, 100% HBI charge to EAF (Appendix C-19)
• Generic Iron Carbide Process (to represent all process variations and/orconfigurations) with 100% IC charge to EAF (Appendix C-20)
• Generic Iron Carbide Process with 40% IC/60% Scrap charge to EAF(considered to be a practical limit for charging iron carbide to the EAF)
OTHER PROCESSES
• SL/RN (Stelco-Lurgi) Rotary Kiln reduction process to produce 100%sponge iron charge to EAF with only recycled Scrap (Appendix C-21)

\\Da0002\01052901\common\DOE REPORT OCT 2000\Section 2.doc Page 28 of 33
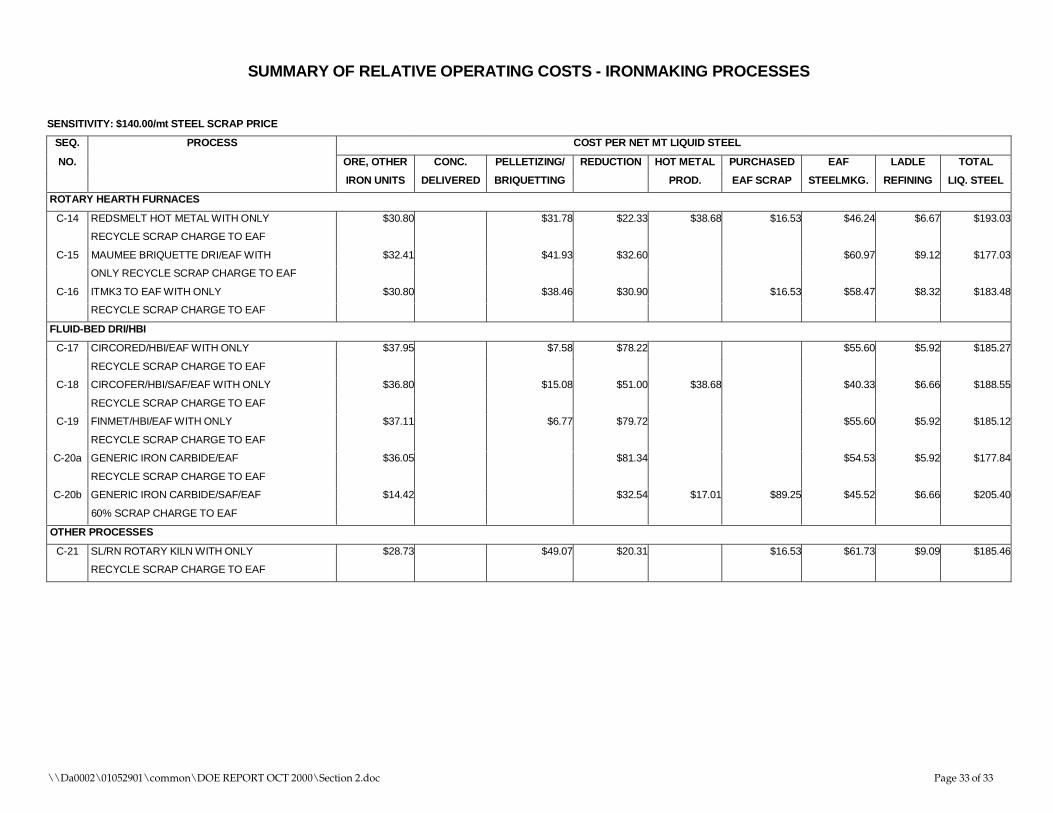
Table 2-4.3($100/mt Scrap Cost Sensitivity)
SUMMARY OF RELATIVE OPERATING COSTS - IRONMAKING PROCESSESSENSITIVITY: $100.00/mt STEEL SCRAP PRICE
SEQ. PROCESS COST PER NET MT LIQUID STEEL
NO. ORE, OTHER CONC. PELLETIZING/ REDUCTION HOT METAL PURCHASED EAF LADLE TOTAL
IRON UNITS DELIVERED BRIQUETTING PROD. EAF SCRAP STEELMKG. REFINING LIQ. STEEL
SHAFT FURNACE DRI PROCESSES:
C-1 100% SHAFT FURNACE DRI CHARGE $64.31 $24.10 $49.99 $60.17 $6.82 $205.39
TO EAF, 1.0 WT.% CARBON
C-2 100% SHAFT FURNACE DRI CHARGE $64.39 $24.13 $49.99 $61.09 $6.82 $206.42
TO EAF, 2.5 WT.% CARBON
C-3 100% STEEL SCRAP CHARGE TO EAF $102.80 $67.21 $6.82 $176.83
C-4 30% SHAFT FURNACE DRI/70% SCRAP $21.33 $10.30 $16.87 $73.64 $59.68 $6.82 $188.64
TO EAF, 1.0 WT.% DRI CARBON
C-5 30% SHAFT FURNACE DRI/70% SCRAP $21.34 $10.31 $17.14 $73.64 $60.73 $6.82 $189.99
TO EAF, 2.5 WT.% DRI CARBON
C-6 HYLSA SHAFT FURNACE WITHOUT $64.31 $24.10 $42.76 $58.16 $6.82 $196.15
REFORMER, HOT DRI CHARGE TO EAF
HOT METAL VARIATIONS
C-7 30% BLAST FURNACE HOT METAL/70% $3.99 $18.45 $32.75 $73.66 $53.98 $6.82 $189.65
SCRAP TO EAF, CO-PRODUCT COKE
C-8 30% BLAST FURNACE HOT METAL/70% $4.07 $10.29 $29.41 $73.66 $53.98 $6.82 $178.23
SCRAP TO EAF, N.R. COKE
C-9 30% COLD PIG IRON/70% SCRAP $3.99 $18.45 $33.56 $73.66 $61.57 $6.82 $198.05
TO EAF, 4.5% CARBON PIG
C-10 30% TECNORED HOT METAL/70% SCRAP $21.28 $23.86 $73.66 $52.05 $6.82 $177.67
TO EAF, WITH CO-GENERATION
C-11 30% TECNORED HOT METAL/70% SCRAP $21.28 $37.17 $73.66 $52.05 $6.82 $190.98
TO EAF, WITHOUT CO-GENERATION
C-12 COREX/MIDREX WITH 60% HOT METAL $41.73 $34.17 $10.67 $75.27 $49.51 $6.82 $218.17
40% DRI CHARGE TO EAF
C-13 HISMELT WITH 32.7% HOT METAL $23.46 $25.96 $81.03 $52.06 $8.31 $190.82
TO CHARGE TO EAF

\\Da0002\01052901\common\DOE REPORT OCT 2000\Section 2.doc Page 29 of 33
SUMMARY OF RELATIVE OPERATING COSTS - IRONMAKING PROCESSES
SENSITIVITY: $100.00/mt STEEL SCRAP PRICE
SEQ. PROCESS COST PER NET MT LIQUID STEEL
NO. ORE, OTHER CONC. PELLETIZING/ REDUCTION HOT METAL PURCHASED EAF LADLE TOTAL
IRON UNITS DELIVERED BRIQUETTING PROD. EAF SCRAP STEELMKG. REFINING LIQ. STEEL
ROTARY HEARTH FURNACES
C-14 REDSMELT HOT METAL WITH ONLY $30.80 $31.78 $22.33 $38.68 $11.81 $46.24 $6.67 $188.31
RECYCLE SCRAP CHARGE TO EAF
C-15 MAUMEE BRIQUETTE DRI/EAF WITH $32.41 $41.93 $32.60 $60.97 $9.12 $177.03
ONLY RECYCLE SCRAP CHARGE TO EAF
C-16 ITMK3 TO EAF WITH ONLY $30.80 $38.46 $30.90 $11.81 $58.47 $8.32 $178.76
RECYCLE SCRAP CHARGE TO EAF
FLUID-BED DRI/HBI
C-17 CIRCORED/HBI/EAF WITH ONLY $37.95 $7.58 $78.22 $55.60 $5.92 $185.27
RECYCLE SCRAP CHARGE TO EAF
C-18 CIRCOFER/HBI/SAF/EAF WITH ONLY $36.80 $15.08 $51.00 $38.68 $40.33 $6.66 $188.55
RECYCLE SCRAP CHARGE TO EAF
C-19 FINMET/HBI/EAF WITH ONLY $37.11 $6.77 $79.72 $55.60 $5.92 $185.12
RECYCLE SCRAP CHARGE TO EAF
C-20a GENERIC IRON CARBIDE/EAF $36.05 $81.34 $54.53 $5.92 $177.84
RECYCLE SCRAP CHARGE TO EAF
C-20b GENERIC IRON CARBIDE/SAF/EAF $14.42 $32.54 $17.01 $63.75 $45.52 $6.66 $179.90
60% SCRAP CHARGE TO EAF
OTHER PROCESSES
C-21 SL/RN ROTARY KILN WITH ONLY $28.73 $49.07 $20.31 $11.81 $61.73 $9.09 $180.74
RECYCLE SCRAP CHARGE TO EAF

\\Da0002\01052901\common\DOE REPORT OCT 2000\Section 2.doc Page 30 of 33
Table 2-4.4($120/mt Scrap Cost Sensitivity)
SUMMARY OF RELATIVE OPERATING COSTS - IRONMAKING PROCESSESSENSITIVITY: $120.00/mt STEEL SCRAP PRICE
SEQ. PROCESS COST PER NET MT LIQUID STEEL
NO. ORE, OTHER CONC. PELLETIZING/ REDUCTION HOT METAL PURCHASED EAF LADLE TOTAL
IRON UNITS DELIVERED BRIQUETTING PROD. EAF SCRAP STEELMKG. REFINING LIQ. STEEL
SHAFT FURNACE DRI PROCESSES:
C-1 100% SHAFT FURNACE DRI CHARGE $64.31 $24.10 $49.99 $60.17 $6.82 $205.39
TO EAF, 1.0 WT.% CARBON
C-2 100% SHAFT FURNACE DRI CHARGE $64.39 $24.13 $49.99 $61.09 $6.82 $206.42
TO EAF, 2.5 WT.% CARBON
C-3 100% STEEL SCRAP CHARGE TO EAF $123.36 $67.21 $6.82 $197.39
C-4 30% SHAFT FURNACE DRI/70% SCRAP $21.33 $10.30 $16.87 $88.36 $59.68 $6.82 $203.36
TO EAF, 1.0 WT.% DRI CARBON
C-5 30% SHAFT FURNACE DRI/70% SCRAP $21.34 $10.31 $17.14 $88.37 $60.73 $6.82 $204.72
TO EAF, 2.5 WT.% DRI CARBON
C-6 HYLSA SHAFT FURNACE WITHOUT $64.31 $24.10 $42.76 $58.16 $6.82 $196.15
REFORMER, HOT DRI CHARGE TO EAF
HOT METAL VARIATIONS
C-7 30% BLAST FURNACE HOT METAL/70% $3.99 $18.45 $32.75 $88.40 $53.98 $6.82 $204.39
SCRAP TO EAF, CO-PRODUCT COKE
C-8 30% BLAST FURNACE HOT METAL/70% $4.07 $10.29 $29.41 $88.40 $53.98 $6.82 $192.97
SCRAP TO EAF, N.R. COKE
C-9 30% COLD PIG IRON/70% SCRAP $3.99 $18.45 $33.56 $88.40 $61.57 $6.82 $212.79
TO EAF, 4.5% CARBON PIG
C-10 30% TECNORED HOT METAL/70% SCRAP $21.28 $23.86 $88.40 $52.05 $6.82 $192.41
TO EAF, WITH CO-GENERATION
C-11 30% TECNORED HOT METAL/70% SCRAP $21.28 $37.17 $88.40 $52.05 $6.82 $205.72
TO EAF, WITHOUT CO-GENERATION
C-12 COREX/MIDREX WITH 60% HOT METAL $41.73 $34.17 $10.67 $75.27 $49.51 $6.82 $218.17
40% DRI CHARGE TO EAF
C-13 HISMELT WITH 32.7% HOT METAL $23.46 $25.96 $88.40 $52.06 $8.31 $198.19
TO CHARGE TO EAF

\\Da0002\01052901\common\DOE REPORT OCT 2000\Section 2.doc Page 31 of 33
SUMMARY OF RELATIVE OPERATING COSTS - IRONMAKING PROCESSESSENSITIVITY: $120.00/mt STEEL SCRAP PRICE
SEQ. PROCESS COST PER NET MT LIQUID STEEL
NO. ORE, OTHER CONC. PELLETIZING/ REDUCTION HOT METAL PURCHASED EAF LADLE TOTAL
IRON UNITS DELIVERED BRIQUETTING PROD. EAF SCRAP STEELMKG. REFINING LIQ. STEEL
ROTARY HEARTH FURNACES
C-14 REDSMELT HOT METAL WITH ONLY $30.80 $31.78 $22.33 $38.68 $14.17 $46.24 $6.67 $190.67
RECYCLE SCRAP CHARGE TO EAF
C-15 MAUMEE BRIQUETTE DRI/EAF WITH $32.41 $41.93 $32.60 $60.97 $9.12 $177.03
ONLY RECYCLE SCRAP CHARGE TO EAF
C-16 ITMK3 TO EAF WITH ONLY $30.80 $38.46 $30.90 $14.17 $58.47 $8.32 $181.12
RECYCLE SCRAP CHARGE TO EAF
FLUID-BED DRI/HBI
C-17 CIRCORED/HBI/EAF WITH ONLY $37.95 $7.58 $78.22 $55.60 $5.92 $185.27
RECYCLE SCRAP CHARGE TO EAF
C-18 CIRCOFER/HBI/SAF/EAF WITH ONLY $36.80 $15.08 $51.00 $38.68 $40.33 $6.66 $188.55
RECYCLE SCRAP CHARGE TO EAF
C-19 FINMET/HBI/EAF WITH ONLY $37.11 $6.77 $79.72 $55.60 $5.92 $185.12
RECYCLE SCRAP CHARGE TO EAF
C-20a GENERIC IRON CARBIDE/EAF $36.05 $81.34 $54.53 $5.92 $177.84
RECYCLE SCRAP CHARGE TO EAF
C-20b GENERIC IRON CARBIDE/SAF/EAF $14.42 $32.54 $17.01 $76.50 $45.52 $6.66 $192.65
60% SCRAP CHARGE TO EAF
OTHER PROCESSES
C-21 SL/RN ROTARY KILN WITH ONLY $28.73 $49.07 $20.31 $14.17 $61.73 $9.09 $183.10
RECYCLE SCRAP CHARGE TO EAF

\\Da0002\01052901\common\DOE REPORT OCT 2000\Section 2.doc Page 32 of 33
Table 2-4.5($140/mt Scrap Cost Sensitivity)
SUMMARY OF RELATIVE OPERATING COSTS - IRONMAKING PROCESSESSENSITIVITY: $140.00/mt STEEL SCRAP PRICE
SEQ. PROCESS COST PER NET MT LIQUID STEEL
NO. ORE, OTHER CONC. PELLETIZING/ REDUCTION HOT METAL PURCHASED EAF LADLE TOTAL
IRON UNITS DELIVERED BRIQUETTING PROD. EAF SCRAP STEELMKG. REFINING LIQ. STEEL
SHAFT FURNACE DRI PROCESSES:
C-1 100% SHAFT FURNACE DRI CHARGE $64.31 $24.10 $49.99 $60.17 $6.82 $205.39
TO EAF, 1.0 WT.% CARBON
C-2 100% SHAFT FURNACE DRI CHARGE $64.39 $24.13 $49.99 $61.09 $6.82 $206.42
TO EAF, 2.5 WT.% CARBON
C-3 100% STEEL SCRAP CHARGE TO EAF $143.92 $67.21 $6.82 $217.95
C-4 30% SHAFT FURNACE DRI/70% SCRAP $21.33 $10.30 $16.87 $103.09 $59.68 $6.82 $218.09
TO EAF, 1.0 WT.% DRI CARBON
C-5 30% SHAFT FURNACE DRI/70% SCRAP $21.34 $10.31 $17.14 $103.10 $60.73 $6.82 $219.45
TO EAF, 2.5 WT.% DRI CARBON
C-6 HYLSA SHAFT FURNACE WITHOUT $64.31 $24.10 $42.76 $58.16 $6.82 $196.15
REFORMER, HOT DRI CHARGE TO EAF
HOT METAL VARIATIONS
C-7 30% BLAST FURNACE HOT METAL/70% $3.99 $18.45 $32.75 $103.13 $53.98 $6.82 $219.12
SCRAP TO EAF, CO-PRODUCT COKE
C-8 30% BLAST FURNACE HOT METAL/70% $4.07 $10.29 $29.41 $103.13 $53.98 $6.82 $207.70
SCRAP TO EAF, N.R. COKE
C-9 30% COLD PIG IRON/70% SCRAP $3.99 $18.45 $33.56 $103.13 $61.57 $6.82 $227.52
TO EAF, 4.5% CARBON PIG
C-10 30% TECNORED HOT METAL/70% SCRAP $21.28 $23.86 $103.13 $52.05 $6.82 $207.14
TO EAF, WITH CO-GENERATION
C-11 30% TECNORED HOT METAL/70% SCRAP $21.28 $37.17 $103.13 $52.05 $6.82 $220.45
TO EAF, WITHOUT CO-GENERATION
C-12 COREX/MIDREX WITH 60% HOT METAL $41.73 $34.17 $10.67 $75.27 $49.51 $6.82 $218.17
40% DRI CHARGE TO EAF
C-13 HISMELT WITH 32.7% HOT METAL $23.46 $25.96 $103.13 $52.06 $8.31 $212.92
TO CHARGE TO EAF
\\Da0002\01052901\common\DOE REPORT OCT 2000\Section 2.doc Page 33 of 33
SUMMARY OF RELATIVE OPERATING COSTS - IRONMAKING PROCESSES
SENSITIVITY: $140.00/mt STEEL SCRAP PRICE
SEQ. PROCESS COST PER NET MT LIQUID STEEL
NO. ORE, OTHER CONC. PELLETIZING/ REDUCTION HOT METAL PURCHASED EAF LADLE TOTAL
IRON UNITS DELIVERED BRIQUETTING PROD. EAF SCRAP STEELMKG. REFINING LIQ. STEEL
ROTARY HEARTH FURNACES
C-14 REDSMELT HOT METAL WITH ONLY $30.80 $31.78 $22.33 $38.68 $16.53 $46.24 $6.67 $193.03
RECYCLE SCRAP CHARGE TO EAF
C-15 MAUMEE BRIQUETTE DRI/EAF WITH $32.41 $41.93 $32.60 $60.97 $9.12 $177.03
ONLY RECYCLE SCRAP CHARGE TO EAF
C-16 ITMK3 TO EAF WITH ONLY $30.80 $38.46 $30.90 $16.53 $58.47 $8.32 $183.48
RECYCLE SCRAP CHARGE TO EAF
FLUID-BED DRI/HBI
C-17 CIRCORED/HBI/EAF WITH ONLY $37.95 $7.58 $78.22 $55.60 $5.92 $185.27
RECYCLE SCRAP CHARGE TO EAF
C-18 CIRCOFER/HBI/SAF/EAF WITH ONLY $36.80 $15.08 $51.00 $38.68 $40.33 $6.66 $188.55
RECYCLE SCRAP CHARGE TO EAF
C-19 FINMET/HBI/EAF WITH ONLY $37.11 $6.77 $79.72 $55.60 $5.92 $185.12
RECYCLE SCRAP CHARGE TO EAF
C-20a GENERIC IRON CARBIDE/EAF $36.05 $81.34 $54.53 $5.92 $177.84
RECYCLE SCRAP CHARGE TO EAF
C-20b GENERIC IRON CARBIDE/SAF/EAF $14.42 $32.54 $17.01 $89.25 $45.52 $6.66 $205.40
60% SCRAP CHARGE TO EAF
OTHER PROCESSES
C-21 SL/RN ROTARY KILN WITH ONLY $28.73 $49.07 $20.31 $16.53 $61.73 $9.09 $185.46
RECYCLE SCRAP CHARGE TO EAF

\\Da0002\01052901\common\DOE REPORT OCT 2000\Section 3.doc Page 1 of 50
Section 3: Ironmaking Process Discussionand Grouping
3.1 Processes Considered and Initial Screening
The goal of the Alternative Ironmaking Process Study was to analyze anumber of different ironmaking processes in a manner to evaluate theirindividual potential and to provide a consistent method for relativecomparison. To compare the processes given the diverse nature of the typesof iron unit products that were produced and differing percentages of thoseiron units being utilized to produce steel, it was decided to normalize eachironmaking process by integrating it with an Electric Arc Furnace (EAF)steelmaking scenario. A net production of 1.0 MM tonnes of Refined LiquidSteel (as produced by the EAF/LRF process) was the normalized finalproduct on which the processes were compared. In this fashion variousproportions of the iron production and various states of the iron (e.g. as hotmetal, cold pig iron, direct reduced iron, etc.) could be compared utilizing atypical commercial scenario.
It was the intent from the outset of the Study to compare proven commercialprocess with evolving or “first-of-a-kind” technologies not yet commerciallyproven. In addition, conceptual processes or those being researched anddeveloped into potentially viable technologies were also given considerationin the Study. An initial screening and judgmental evaluation of theprocesses and potential production scenarios resulted in approximately 20Ironmaking production scenarios that were selected to be evaluated andcompared in more detail.
The heat and mass balance modeling techniques discussed in Section 2-2were utilized to develop bases for Capital and Operating Cost estimates,definition of cumulative emissions as represented by carbon gas (as CO2)and cumulative electrical power consumption. To combine the impacts ofCapital and Operating Costs, a simple Internal Rate of Return (IRR)calculation was made for each of the processes. These and other variablesrelating to the Iron and Steelmaking production scenarios for each processwere used as a basis for comparison and ranking.
\\Da0002\01052901\common\DOE REPORT OCT 2000\Section 3.doc Page 2 of 50
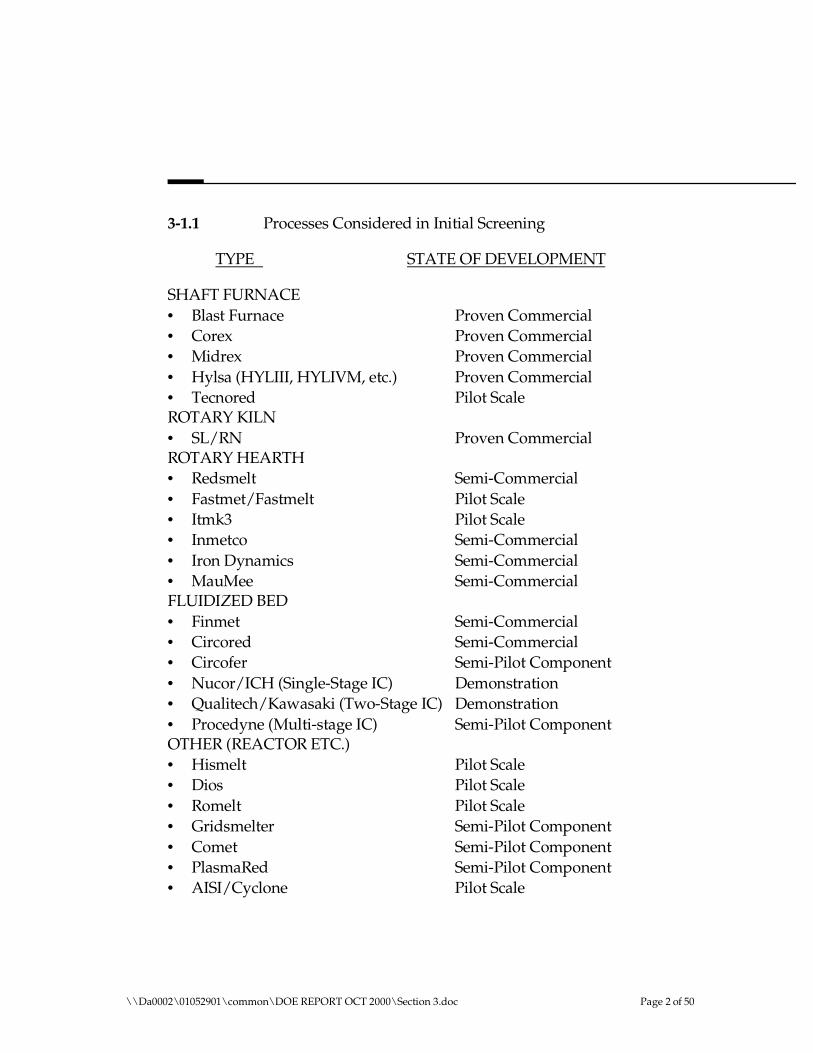
3-1.1 Processes Considered in Initial Screening
TYPE STATE OF DEVELOPMENT
SHAFT FURNACE• Blast Furnace Proven Commercial• Corex Proven Commercial• Midrex Proven Commercial• Hylsa (HYLIII, HYLIVM, etc.) Proven Commercial• Tecnored Pilot ScaleROTARY KILN• SL/RN Proven CommercialROTARY HEARTH• Redsmelt Semi-Commercial• Fastmet/Fastmelt Pilot Scale• Itmk3 Pilot Scale• Inmetco Semi-Commercial• Iron Dynamics Semi-Commercial• MauMee Semi-CommercialFLUIDIZED BED• Finmet Semi-Commercial• Circored Semi-Commercial• Circofer Semi-Pilot Component• Nucor/ICH (Single-Stage IC) Demonstration• Qualitech/Kawasaki (Two-Stage IC) Demonstration• Procedyne (Multi-stage IC) Semi-Pilot ComponentOTHER (REACTOR ETC.)• Hismelt Pilot Scale• Dios Pilot Scale• Romelt Pilot Scale• Gridsmelter Semi-Pilot Component• Comet Semi-Pilot Component• PlasmaRed Semi-Pilot Component• AISI/Cyclone Pilot Scale

\\Da0002\01052901\common\DOE REPORT OCT 2000\Section 3.doc Page 3 of 50
The distinction above is:
• Proven Commercial The process is operating commercially inmore than one economically-viableinstallation.
• Semi-Commercial The process is undergoing startup in afirst-of-a-kind commercial scaleinstallation or is still in processdemonstration phase.
• Demonstration The process has operated at a first-of-a-kind commercial scale, but is no longerbeing operated.
• Pilot Scale The process has been operated at anintegrated pilot scale.
• Semi-Pilot Component Parts of the process have been operatedat a pilot scale.
In an initial evaluation and screening of the above processes, it wasdetermined that some of the processes could not be definitively comparedsince not enough open information was available to close an energy andmass balance. Sparse data that were available for such processes, in somecases, did not indicate that there was a sufficient incentive to attempt toevaluate in detail.
In other cases, the Ironmaking processes were not at a sufficient stage ofdevelopment or had a potential economic advantage to warrant furtherconsideration. An example of this was the production of Direct ReducedIron at a high carbon content (i.e. at 2.5 wt.% C versus 1.0 wt.% C) in theshaft furnace (Midrex or Hylsa) processes. Changes in kinetics andreduction gas composition requirements to achieve the higher-carbon DRIproduct (some as iron carbide) did not indicate that there was a significantadvantage over the lower Carbon DRI product when used for EAF/LRFsteelmaking.
In some cases, in particular the rotary hearth, oxygen reactor types and ironcarbide processes, the Ironmaking processes of several Vendors weresufficiently similar as to not warrant separate treatment. Therefore, a typicalIronmaking process or a generic process was selected for the comparativeevaluation.

\\Da0002\01052901\common\DOE REPORT OCT 2000\Section 3.doc Page 4 of 50
It should be noted that a number of Oxygen Reactor-based processes havebeen tested and are under investigation. There were typically not enoughdetailed operating and/or complete process descriptions available to definethese processes with enough detail to be at the same level of precision as theother, more-conventional, Ironmaking processes. The Hismelt process wasselected for further evaluation and is deemed to be typical of this group.Others may have better, or less favorable, attributes, but could not be furtherexplored or compared with the other Ironmaking processes.
A number of Plasma-based processes were also initially considered. TheAuthor has personal process development experience in Direct Plasma orereduction and/or melting processes. Lockwood Greene has also hadconfidential discussions with Plasma-Met Technology; thus there is aninternal base of information on such processes. However, the extraordinaryelectrical power requirements for these processes and low efficiency (notrigorously defined, but estimated from available data) did not indicate anycompetitive potential. As a group, these were not selected for furtherdefinition or evaluation.
An abridged list of Ironmaking process scenarios for further evaluation andcomparison was selected. These are the ones for which the detailedcomparisons and ranking analyses were done (See Section 4).
3-1.2 Process Scenarios Selected:
SHAFT FURNACE DRI – VARIATION IN CARBON AND SCRAP CHARGE
• Base Case: 100% Shaft Furnace DRI (i.e. Midrex) Charge to EAF, 1.0wt.% DRI (Recycle Steel Scrap Only)
• 100% Steel Scrap Charge to EAF (For Reference Only)
• 30% Shaft Furnace DRI/70% Scrap Charge to EAF (a Common IndustryPractice), 1.0 wt.% DRI Carbon
• Hylsa Shaft Furnace Without Reformer (HYL IVM), Hot DRI Charge toEAF

\\Da0002\01052901\common\DOE REPORT OCT 2000\Section 3.doc Page 5 of 50
HOT METAL VARIATIONS
• 30% Blast Furnace Hot Metal/70% Scrap Charge to EAF, Co-ProductCoke
• Mini Blast Furnace Comparison @ 30% H.M./70% Scrap Charge to EAF,Co-Product Coke
• 30% Blast Furnace Hot Metal/70% Scrap Charge to EAF, ContinuousNon-Recovery Coke with Co-Generation of Electric Power
• 30% Cold Pig Iron/70% Scrap Charge to EAF, 4.5% Carbon
• 30% Tecnored Hot Metal/70% Scrap Charge to EAF, 4.5% CarbonH.M. With Integral Co-Generation of Electrical Power
• 30% Tecnored Hot Metal/70% Scrap Charge to EAF, 4.5% CarbonH.M. Without Co-Generation of Electrical Power
• Corex (VAI)/Midrex with 60% Hot Metal and 40% DRI Charge to EAF
• HiSmelt (ISCON) with 34.5% Hot Metal Charge to EAF
ROTARY HEARTH FURNACES
• Redsmelt (Mannesmann) Hot Metal With Only Recycle Scrap Charge toEAF
• MauMee R&E Briquette DRI/EAF With Only Recycle Scrap Charge toEAF
• ITMK3 (Midrex RHF) to EAF With Only Recycle Scrap Charge to EAF
FLUID-BED DRI/HBI
• Circored (Lurgi)/HBI/EAF With Only Recycle Scrap Charge to
• Circofer (Lurgi)/HBI/SAF/EAF With Only Recycle Scrap Charge toEAF
• Finmet (VAI)/HBI/EAF With Only Recycle Scrap Charge to EAF
• Generic Iron Carbide (ICH)/EAF With Only Recycle Scrap to EAF(Represents Nucor/ICH, Qualitech/Kawasaki, Procedyne Processes)
• 40% Iron Carbide Charge/60% Scrap to EAF (Believed to be MaximumPractical or Feasible Charge Ratio)

\\Da0002\01052901\common\DOE REPORT OCT 2000\Section 3.doc Page 6 of 50
OTHER PROCESSES• SL/RN (Stelco-Lurgi) Rotary Kiln With Only Recycle Scrap Charge to
EAF
3-2: Process Descriptions and Flow Diagrams
The following are brief descriptions and pictorial Process Flow Diagrams ofSelected Ironmaking Processes:
3-2.1 SHAFT FURNACE PROCESSES:
Blast Furnace
PROCESS BACKGROUND:The blast furnace process is based upon a moving bed reduction furnacewhich reduces iron ore with coke and limestone. Reduction is carried out attypical reduction temperatures. The process produces liquid pig iron.
PROCESS DESCRIPTION:The blast furnace process consists of weighing of the burden, charging ofthe blast furnace, hot product dispersal from the blast furnace and offgascleanup system. The blast furnace is a tall shaft-type furnace with a verticalstack superimposed over a crucible-like hearth. Iron bearing materials (ironore, sinter, pellets, mill scale, steelmaking slag, scrap, etc.), coke and flux(limestone and dolomite) are charged into the top of the shaft. A blast ofheated air and also, in most cases, a gaseous, liquid or powdered fuel areintroduced through openings at the bottom of the shaft just above the hearthcrucible. The heated air burns the injected fuel and most of the coke chargedin from the top to produce the heat required by the process and to providereducing gas that removes oxygen from the ore. The reduced iron melts andruns down to the bottom of the hearth. The flux combines with theimpurities in the ore to produce a slag which also melts and accumulates ontop of the liquid iron in the hearth. The total furnace residence time is about6 to 8 hours. The hot metal produced is sent to a steelmaking shop or a pig-casting machine. The slag goes to a water-spray granulator, a cry slag pit ora slag dump. The gas from the top of the furnace goes through the gascleaning system, and then a portion goes to fire the hot blast stoves with thebalance being used in other parts of the plant. The dust is removed from the

\\Da0002\01052901\common\DOE REPORT OCT 2000\Section 3.doc Page 7 of 50
gas in the cleaning system and goes to the sinter plant to be agglomeratedfor recycling back into the blast furnace.
PROCESS ADVANTAGES
Proven performanceRaw material flexibility
BLAST FURNACE PLANT FLOWSHEET
EXHAUSTSTACK
FLUE GAS
LUMPIRON ORE LIMESTONE
BLAST FURNACE
DUST CATCHER
HOT METALSUBMARINE CAR
HOT SLAGto Disposal
to BOF or openhearth
to pig castingmachine
ElectricPrecipitator
CokeOvens
SEPARATOR COOLINGTOWER
COKEPELLETS
PREHEATEDAIR
Corex
The iron oxide feed to a Corex reduction shaft is in the form of lump ore orpellets. Non-coking coal is used in the Corex process as the strength of cokeneeded in the cohesive zone of the blast furnace to provide sufficientpermeability to the bed is not required. All other coke functions such as fuelsupply, basis for the reduction gas generation and carborization of the hotmetal can be fulfilled as well by non-coking coal. Similar to the blast furnaceprocess, the reduction gas moves in counter flow to the descending burdenin the reduction shaft. Then, the reduced iron is discharged from thereduction shaft by screw conveyors and transported via feed legs into themelter gasifier. The gas containing mainly of CO and H2, which is producedby the gasification of coal with pure O2 leaves the melter gasifier attemperatures between 1000 and 1050C. Undesirable products of the coal

\\Da0002\01052901\common\DOE REPORT OCT 2000\Section 3.doc Page 8 of 50
gasification such as tar, phenols, etc. are destroyed and not released to theatmosphere. The gas is cooled to 800-850C and cleaned from dust particles.After reduction of the iron ore in the reduction shaft, the top gas is cooledand cleaned to obtain high caloric export gas. The main product, the hotmetal can be further treated in either EAF or BOF or can be cast and sold aspig iron.
PROCESS ADVANTAGES
Use of low cost non-coking coal
IRON OREHOPPER
VOEST-ALPINE COREX PROCESS FLOWSHEETPELLETS/
LUMP ORE
COAL
OXYGEN
REDUCTIONSHAFT
MELTERGASIFIER
HOT METAL AND SLAG
EXPORT GASTOP GAS
SCRUBBER
HOT GAS CYCLONE
SETTLING POND
SCRUBBER
COOLING GAS
DUST
Midrex Shaft Furnace
PROCESS BACKGROUND:
The Midrex ™ Direct Reduction process is based upon a low pressure,moving bed shaft furnace where the reducing gas moves counter-current tothe lump iron oxide ore or iron oxide pellet solids in the bed. The reducinggas (from 10-20% CO and 80-90% H2) is produced from natural gas usingMidrex’s CO2 reforming process and their proprietary catalyst (instead ofsteam reforming).

\\Da0002\01052901\common\DOE REPORT OCT 2000\Section 3.doc Page 9 of 50
A single reformer is utilized instead of a reformer/heater combination. Thereformed gas does not need to be cooled before introduction to the process.There is also no need for a separate CO2 removal system.
The process can produce cold or hot DRI as well as HBI for subsequent useas a scrap substitute feed to a steelmaking melting furnace (SAF, EAF oroxygen steelmaking process).
Over 50 Midrex™ Modules have been built worldwide since 1969. Theyhave supplied over 60% of the worlds DRI since 1989.
PROCESS DESCRIPTION:
The iron oxide feed to a Midrex ® shaft furnace can be in the form of pellets,lump ore or a mixture of the two (in 0 to 100% proportions). The solid feedis discharged into a feed hopper on top of a proportioning hopper thatevenly distributes the solids into the shaft furnace.
A dynamic seal leg keeps the reducing gas inside the furnace. The shaftfurnace operates at low pressure, under 1 bar gauge, which allows dynamicseals to be used on the furnace inlet and discharge. The iron ore burden inthe shaft furnace is first heated, then reduced by the upward flowing,counter-current reducing gas that is injected through tuyeres located in abustle distributor at the bottom of the cylindrical section of the shaft. Theore is reduced to a metallization typically in the range of 93% to 94% by thetime it reaches the bustle area.
Below the bustle area, it goes through a transition zone (with design toreduce agglomeration or lumping) and then reaches the lower conicalsection of the furnace. Lower carbon reduced iron (<1.5% C) is cooled usinga circulating stream of cooled exhaust gas that is introduced in the conicalsection for cold DRI discharge. Higher carbon DRI (up to 4.0% C) can beproduced by introduction of natural gas into this cooling gas. It readilyreacts (and cracks) with the highly reactive metallic DRI.
For hot discharge of DRI to be used for hot charging of EAF’s (i.e. Midrex’sHotlink™ Process) or for feed to hot briquetting presses (to produce HBI),the lower part of the furnace is modified to allow handling of hot burden.

\\Da0002\01052901\common\DOE REPORT OCT 2000\Section 3.doc Page 10 of 50
The Midrex gas generation system consists of a CO2 reformer using theirown catalyst. The feed to the reformer is a mixture of process gas recycledfrom the furnace and makeup natural gas. The top gas leaving the shaftfurnace at a temperature of 400 to 450C is cooled and dust is removed in atop gas scrubber. About two-thirds of the gas is recycled back to the process(process gas) and the rest is used as a fuel. The process gas is compressed,mixed with natural gas and is preheated in the reformer recuperator beforeentering the tubes of the reformer.
The reformed gas comprising of mostly CO and H2 exits the reformer atabout 850 °C and passes through collection headers to the reformed gas line.The ratio of H2 to CO is controlled at about 1.5 to 1.8, and reducing quality at11 to 12 for best operation.
PROCESS ADVANTAGES:
World-wide commercial useProven performance“Relatively-forgiving” operationRaw material flexibilityCO2 reformer eliminates need for steam system, reformed gas quench,reducing gas heating and CO2 removal system.
ShaftFurnace
Process GasCompressors
Top G asScrubber
Main AirB lower
Reformer
NaturalGas
Flue Gas
EjectorStack
Heat Recovery
Feed G as
Direct-ReducedIron
Fuel G as
Com bustion Air
FlueGas
MIDREX PROCESS FLOW SHEETIron
Oxide
Cooling GasScrubber
Cooling G asCompressor
NaturalGas
NaturalG as

\\Da0002\01052901\common\DOE REPORT OCT 2000\Section 3.doc Page 11 of 50
HYLSA IVM
PROCESS BACKGROUND:
The Hylsa 4M process is based on a moving bed shaft furnace (similar toHYL III process but without a reformer) which reduces iron ore pellets andlump ore, and operates at typical reduction temperatures and intermediatereduction pressures. This process requires no reformer to generate thereducing gas as the reforming of the natural gas takes place inside thereduction reactor using the metallic iron of the DRI product as the catalyst.The process can produce cold/hot DRI as well as HBI.
PROCESS DESCRIPTION:
As before, the iron oxide feed to a Hylsa 4M furnace can be pellets, lump, ora mixture of the two (from 0 to 100% of either). HYL divides the processinto three primary units: Reduction system, DRI handling system andExternal cooling system.The HYL 4M reactor operates at similar conditions to the other Hylsareactors (e.g. HYL III, etc.). The reactor has a cylindrical upper sectionwhere reduction and reforming reactions take place. The lower part isconical with a rotary valve at the end to control the flow of solidsdischarging the reactor.
The starting point of the reduction circuit is the fresh stream of natural gasthat is used as a makeup for the process. This natural gas (desulfurization isnot necessary, but is optional) is mixed with recycled gas and fed to ahumidifier, where the humidity of the total stream of reducing gas iscontrolled to adjust the carbon deposition rate on the DRI at the bottom ofthe reactor.
The reducing gas goes to the top gas heat recuperator, where sensible heat isrecovered from the reactor top gas. Then the preheated gas goes to a gasheater where its temperature is increased to above 900 °C. In the transferline to the reactor, O2 is injected in order to have some partial combustion ofthe reducing gas to increase its temperature to above 1020 °C. This gas,upon introduction into the bottom of the HYL reactor, flows upward intothe reduction zone countercurrent to the moving bed of solids. In the lowerpart of the reduction zone, insitu reforming reactions are carried when this
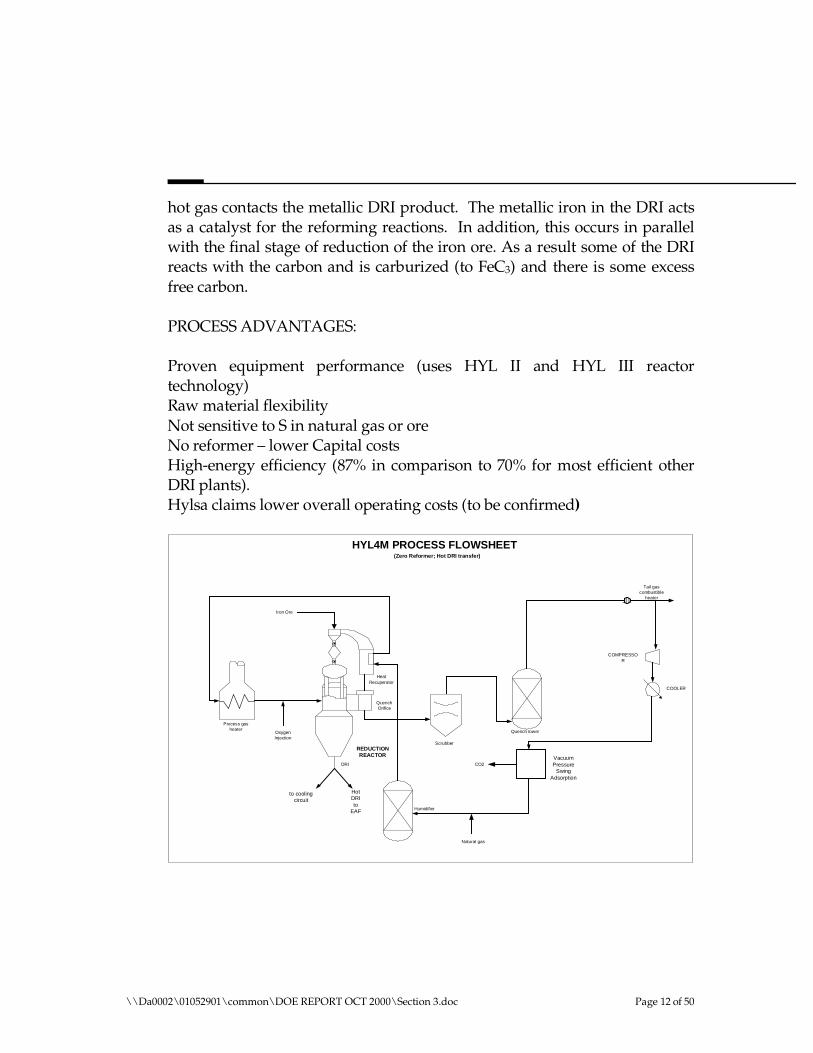
\\Da0002\01052901\common\DOE REPORT OCT 2000\Section 3.doc Page 12 of 50
hot gas contacts the metallic DRI product. The metallic iron in the DRI actsas a catalyst for the reforming reactions. In addition, this occurs in parallelwith the final stage of reduction of the iron ore. As a result some of the DRIreacts with the carbon and is carburized (to FeC3) and there is some excessfree carbon.
PROCESS ADVANTAGES:
Proven equipment performance (uses HYL II and HYL III reactortechnology)Raw material flexibilityNot sensitive to S in natural gas or oreNo reformer – lower Capital costsHigh-energy efficiency (87% in comparison to 70% for most efficient otherDRI plants).Hylsa claims lower overall operating costs (to be confirmed)
HYL4M PROCESS FLOWSHEET
COMPRESSOR
COOLER
REDUCTIONREACTOR
DRI
OxygenInjection
Humidifier
CO2
Natural gas
QuenchOrifice
HeatRecuperator
Iron Ore
Scrubber
Quench tower
Tail gascombustible
heater
Process gasheater
to coolingcircuit
HotDRIto
EAF
(Zero Reformer; Hot DRI transfer)
VacuumPressure
SwingAdsorption

\\Da0002\01052901\common\DOE REPORT OCT 2000\Section 3.doc Page 13 of 50
Tecnored
PROCESS BACKGROUND:
The Tecnored process is based upon a low pressure moving bed reductionfurnace which reduces pellets made out of iron ore fines with cement andcoke fines. Reduction is carried out at typical reduction temperatures. Theprocess produces liquid pig iron.
PROCESS DESCRIPTION:
The Technored process consists of pelletizing of the iron ore fines withcement and coke fines. The pellet size is controlled for the optimum reactionin the reduction furnace. The pellets are cured and dried at 200C and fed tothe top of the furnace. The furnace internal pressure is about 3.5 to 5.2 psig.The total furnace residence time is 30 to 40 minutes against 6 to 8 hours inblast furnace.
Lump coke is fed into side feeders in the furnace below the hot pellet area.Hot blast air at about 1550C is blown in through tuyeres located in the sideof the furnace to provide combustion air for the coke. A small amount offurnace gas is allowed to flow through the side feeders to use for pet cokedrying and preheating. Cold blast air is blown in at a higher point topromote post combustion of CO in the upper shaft. The use of coke withsulfur (pet coke) necessitates an elaborate furnace clean-up system in orderto meet environmental regulations.
The pig iron produced is tapped into a ladle on a ladle car, which can tilt theladle for deslagging. The liquid iron is desulfurized in the ladle, and slagraked into a slag pot.

\\Da0002\01052901\common\DOE REPORT OCT 2000\Section 3.doc Page 14 of 50
PROCESS ADVANTAGES
Low cost raw materialsLow melting costs using low cost fuels to reduce electric power andelectrode cost.High productivity and energy efficiency in the furnaceFull metallization (up to 99%)
PELLETIZER
MIXER
TECNOREDFURNACE
AIRPRE-HEATER
COMBUSTION AIR
EXHAUSTSTACK
EXHAUSTFAN
AIR FAN
OXIDE,REDUCTANT ANDBINDER HOPPERS
FEEDER
TECNORED PROCESS FLOWSHEET
FLUE GAS
WATER
DUST TORECYCLE
HOTDUST
FILTER
PELLETS WITHCOKE & EAF SLAG
IRON ORE CHARCOAL BINDER C
EAF SLAG &RETURN FINES
FEEDHOPPER
COAL / COKE
HOT BLAST
HOT METAL
SLAG
EAF SLAG
HEATRECOVERY

\\Da0002\01052901\common\DOE REPORT OCT 2000\Section 3.doc Page 15 of 50
3-2.2 ROTARY KILN
SL/RN
PROCESS BACKGROUND:
The SL/RN process is a kiln based process that uses lump ore, pellets, beachsand or ilmenite ore and solid carbon to produce hot or cold DRI. Theprocess operates at high temperature and atmospheric pressure. This is themost widely used coal based direct reduction process.
PROCESS DESCRIPTION:
The iron oxide feed to a SL/RN kiln is in the form of lump or pellet iron ore,reductant (low-cost non-coking coal) and limestone or dolomite (to absorbsulfur from high sulfur reductant). The rotary kiln is inclined downwardfrom the feed (elevated end) to the discharge end. The discharge end isprovided with a burner to be used for startup or to inject reductant. Typicalretention times are around 10 hours. The kiln is divided into two processregions; preheat and reduction. In the preheat section, the charge is heatedto about 1000C, free moisture is first driven off and reduction to FeO occurs.As the reductant is heated, volatile components are released and part of thegases are burned in the freeboard above the bed by the air injected into thekiln. This combustion transfers heat to the charge directly by radiation, andalso by conductive heat transfer from the kiln lining, which is first exposedto the flame and heated before contacting the charge. The charge then passesinto the metallization or reduction zone where the temperature ismaintained at about 1000C to 1100C, depending upon the type of chargeused. The final metallization is about 93% and carbon content about 0.1 to0.2%. The product DRI can be discharged hot or cold.
The combustion off-gases from the kiln contain char particles andcombustible gases. These are burned off in a afterburner and the offgas thenpasses through an evaporative cooler and an electrostatic precipitator andvented to the atmosphere.

\\Da0002\01052901\common\DOE REPORT OCT 2000\Section 3.doc Page 16 of 50
PROCESS ADVANTAGES
Use of any iron bearing materialWide variety of reductantsProven DRI technologyEconomic production of DRI
SL/RN PROCESS FLOWSHEET
IRON ORE COAL CHAR
FEEDER
AIR INLETS
GAS CLEANING
UNDERBED AIR ROTARY KILN
ROTARYCOOLER
SCREEN
DRI
RETURNCHAR
FEEDWATER
SUPERSATURATEDSTEAM
EXHAUSTSTACK
EXHAUSTFAN
FLUE GAS
ELECTROSTATICPRECIPITATOR
3-2.3 Rotary Hearth
Redsmelt
PROCESS BACKGROUND:
The Redsmelt process is based upon a rotary hearth furnace which reducesgreen pellets made out of iron ore, reductant fines and binders to producehot, metallized DRI that is charged to a Submerged Arc Furnace. Theprocess operates at high temperature and atmospheric pressure.

\\Da0002\01052901\common\DOE REPORT OCT 2000\Section 3.doc Page 17 of 50
PROCESS DESCRIPTION:
The iron oxide feed to a Redsmelt furnace is in the form of green pelletsmade of fine iron ore, reductant and binders. Binders are to give to thegreen pellets sufficient mechanical strength to support the handling shocksdownstream. Pellets are screened on a roller-type screen to a size between 8to 16 mm. Under and oversize materials are recirculated to feed thepelletizing disks. Pellets are then distributed onto the RHF in a layer up to30 kg/m2. While traveling throughout the furnace in 12 to 18 minutes,pellets are heated up to 1370C. Drying of the pellets, coal devotalitizationand iron oxide reduction takes place during the heating process. Theintimate contact between iron oxide and carbon at a very high temperatureresults in a very fast reaction rate. To prevent reoxidation of metallized ironthe final zones of the furnace are operated in sub-stoichiometric atmosphere.The hot DRI product is then fed to the submerged arc furnace (SAF) forsmelting into Hot metal and slag.
PROCESS ADVANTAGES
Iron ore fines as raw materialWide variety of solid reductantsLess reduction time (12 to 18 minutes)Proven equipment usage
PELLETIZER
MIXER
RO TAR Y-HEA RTHFUR NAC E
FLU E GA SCO NDITION ER
AIRPRE-HEATER
C OMBU STIO NAIR
HO T DRITRA NSFER
C ONTAINERS
EXH AUSTSTAC K
EXH AUSTFAN
AIR FA N
O XIDE,R EDU CTA NT A NDB IN DER HOPPERS
FEEDER
MANNESMANN DEMAG REDSMELT PROCESS FLOWSHEET
FLU E GA S
WATER
DUST TORECYCLE
HOTD UST
FILTER
GREEN PELLETSW ITH CAR BON
IRON ORE COAL BENTONITE
RECYC LE DUST
FEEDHO PPER
PELLET COATINGAD DITIVE
CO ATIN GH OPPER
DR YD ESULPHUR IZER
SCRUBBERW ATER
SC RUBBEREF FLUENT
TOTREATM ENT
WETDESULPH URIZER
SU BMERGED AR CFUR NAC E
LIME
COAL
TOBAGHOUSE
M OLTEN PIGIRON
SLAG & CAR BONWASTE
TRAN SFER CA R
LA DLETRANSFER
DESU LFURIZA TION
TO EA FSTEELMAKING
CR ANETR ANSFER

\\Da0002\01052901\common\DOE REPORT OCT 2000\Section 3.doc Page 18 of 50
Fastmet/Fastmelt
PROCESS BACKGROUND:
The FastMet process is based upon a rotary hearth furnace which reducesbriquettes made out of iron ore fines, waste iron bearing materials andpulverized coal to produce hot, metallized DRI that can be directly chargedto a specially designed electric melter (FASTMELT) or HBI.
PROCESS DESCRIPTION:
The iron oxide feed to a FastMet furnace is in the form of dried greenballsmade of iron ore and coal. They are continuously fed to the RHF by meansof a loss-in-weight vibrating pan feed system. After introduction, thegreenballs are heated in 3 burner/ reaction zones; all fired by side-wallmounted burners. Zone 1 has three burners, Zone 2 has five burners andZone 3 has two burners. All burners are designed for air/natural gas oroxygen enriched air/natural gas combustion. A water cooled chill plate ispositioned after Zone 3 for cooling of the hot DRI product to 1000-1200Cprior to discharge from the RHF. The hot DRI product can either be collectedin N2 purged transfer cans, or directly fed to the electric furnace for melting.The RHF operates under a slight negative pressure, and sealed by a waterseal trough.
The DRI melter is a custom design single phase AC electric arc furnace typemelter that has a stationary hearth and a water cooling roof. It producescarbon containing molten iron (FASTIRON) from a charge of 100% hot DRIcontinuously fed from the RHF.

\\Da0002\01052901\common\DOE REPORT OCT 2000\Section 3.doc Page 19 of 50
PROCESS ADVANTAGES
Iron ore fines as raw materialWide variety of solid reductantsLess reduction time (6-12 minutes)Lower capital investment costs than NG based DR processesProven equipment usage
DRYER
PELLETIZER
MIXER
ROTARY-HEARTHFURNACE
FLUE GASCONDITIONER
AIRPRE-HEATER
COMBUSTIONAIR
HOT DRITRANSFERCONTAINER
HBIBRIQUETTING
PRESS
WATER EXHAUSTSTACK
EXHAUSTFANSCRUBBER
AIR FAN
OXIDE,REDUCTANT ANDBINDER HOPPERS
FEEDER
FASTMET PROCESS FLOWSHEET
FLUE GAS
AIR
FLUE GAS
SOLIDS
ITMK3
PROCESS BACKGROUND:
The ITmk3 process is based upon a rotary hearth furnace similar to aFASTMET furnace which reduces dried green pellets made out of iron ore,reductant fines and binders to produce hot, metallized DRI that is chargedto a Melter which separates liquid metal from liquid slag in a short time. Theprocess operates at high temperature and atmospheric pressure.

\\Da0002\01052901\common\DOE REPORT OCT 2000\Section 3.doc Page 20 of 50
PROCESS DESCRIPTION:
The iron oxide feed to a ITmk3 furnace is in the form of dried green pelletsmade of fine iron ore, reductant and binders. Binders are to give to thepellets sufficient mechanical strength to support the handling shocksdownstream. Pellets are dried and screened for 17 to 19 mm greenballdiameter. Undersize and oversize materials are recirculated to feed thepelletizing disks. Pellets are then distributed onto the RHF. While travelingthroughout the furnace, pellets are heated up to 1350C. Drying of thepellets, coal devotalitization and iron oxide reduction takes place during theheating process.
The intimate contact between iron oxide and carbon at a very hightemperature results in a very fast reaction rate. Heating of the gangue andash components also occurs and leads to softening and subsequent initiationof slag droplet coalescence. Often a hollow, highly metalized iron shell isformed, and at the bottom of the hollow is a bead of melted slag. The hotproduct is then fed to the Melter for complete separation of Hot metal or thecold iron shots (iron nuggets) from slag. Further heating in the melterresults in the formation of molten iron droplets, collapse of the iron shellstructure followed by coalescence of iron droplets into a nugget of molteniron which is completely separated from the slag.
PROCESS ADVANTAGES
Iron ore fines as raw materialWide variety of solid reductantsLess reduction timeComplete separation of hot metal from slag

\\Da0002\01052901\common\DOE REPORT OCT 2000\Section 3.doc Page 21 of 50
DRYER
PELLETIZER
MIXER
ROTARY-HEARTHFURNACE
FLUE GASCONDITIONER
AIRPRE-HEATER
COMBUSTIONAIR
WATER EXHAUSTSTACK
EXHAUSTFANSCRUBBER
AIR FAN
OXIDE,REDUCTANT ANDBINDER HOPPERS
FEEDER
ITmk3 PROCESS FLOWSHEET
FLUE GAS
SLAGSEPARATOR
SLAG
SHOT IRON
Inmetco Process
PROCESS BACKGROUND:
The Inmetco process is based upon a rotary hearth furnace which reducesbriquettes made out of iron ore fines, waste iron bearing materials andpulverized coal to produce hot, metallized DRI that can be directly chargedto an electric melter or HBI. The process operates at high temperature andatmospheric pressure.
PROCESS DESCRIPTION:
The iron oxide feed to an Inmetco furnace is in the form of disk pellets madeof fine iron ore under 250um in size and fine coal or coke or char with lessthan 25% volatiles. They are distributed onto the RHF in a layer about 3pellets deep by means of a pivoting belt conveyor. The process uses a quickacting binder which allows the pellets to be transported to the hearthwithout significant degradation. The hearth rotates continuously and thepellets are heated by burners located around the periphery of the hearth to1250C to 1300C during a period of 10 to 15 minutes. The burners arearranged in groups, and form heating and reduction zones. The heating

\\Da0002\01052901\common\DOE REPORT OCT 2000\Section 3.doc Page 22 of 50
zone makes about 1/3 of the hearth area and the reduction zone about 2/3.The burners are located on the inner and outer circumferenceThe hot DRI product can either be collected in N2 purged transfer cans, ordirectly fed to the electric furnace for melting. The RHF operates under aslight negative pressure, and sealed by a water seal trough.
PROCESS ADVANTAGES
Iron ore fines as raw materialWide variety of solid reductantsLess reduction time (6-12 minutes)Proven equipment usage
PELLETIZER
MIXER
ROTARY-HEARTHFURNACE
FLUE GASCONDITIONER
Recuperator
COMBUSTIONAIR
HOT DRITRANSFER
CONTAINERS
EXHAUSTSTACK
EXHAUSTFAN
AIR FAN
OXIDE,REDUCTANT ANDBINDER HOPPERS
FEEDER
MANNESMANN DEMAG INMETCO PROCESS FLOWSHEET
FLUE GAS
WATER
DUST TORECYCLE
Dedusting
GREEN PELLETSWITH CARBON
RECYCLE DUST
FEEDHOPPER
SUBMERGED ARCFURNACE
LIME
COAL
TOBAGHOUSE
MOLTEN PIGIRON
SLAG & CARBONWASTE
TRANSFER CAR
LADLETRANSFER
TO EAFSTEELMAKING
CRANETRANSFER
Natural gas
FEEDER
IRON ORE COAL BINDER

\\Da0002\01052901\common\DOE REPORT OCT 2000\Section 3.doc Page 23 of 50
Iron Dynamics
PROCESS BACKGROUND:
The Iron Dynamics process is based upon a rotary hearth furnace whichreduces a carbonaceous iron oxide charge to metallic iron solids that arecharged to a SAF to complete the reduction and to melt and desulfurize thereduced iron. Melting the DRI also allows for a phase separation of theresulting liquid slag and iron.
PROCESS DESCRIPTION:
The IDI process is composed of five process areas: raw material receiving,ore and reductant (coal) grinding and preparation, pelletizing, rotary hearthreduction and submerged arc furnace smelting. After the ore is received, it isdried to the moisture content less than 0.5% using offgas from the rotaryhearth furnace. Ore is also beneficiated using magnetic separators andscreens to reduce the amount of silica. It is then ground to 50% minus 200mesh. Coal is conveyed to a coal/fluxstone pulverizer for sizing to 80%minus 200 mesh. Ground ore and coal are intensively mixed with bindersand water in a mixer and fed onto disc pelletizers. Wet pellets are dried toless than 1% moisture and preheated to 150C in a circular grate dryer. Thepellet charger receives the dried green balls and layers them onto thefurnace hearth in 11/2 – 1 in. thick layers.
The natural gas fired rotary hearth furnace has eight reaction zones.Temperature, gas flow and gas composition are controlled to provide therequired conditions in each zone to properly heat, reduce and protect thepellets. The DRI at the discharge of the furnace has about 85% metallization.
An additive facility introduces flux, coke, silica or other materials to the DRItransport bottles to control slag chemistry in the submerged arc furnace. Theoffgas system removes heat, dust, sulfur dioxide and nitrous dioxides fromthe flue gas. An afterburner combusts any remaining CO in the offgaswater-cooled duct. The gas is cooled and the Nox removed in the primarycooler. Offgas is used to preheat combustion air and supply heat to the ore,coal and pellet dryers. After the pellet dryer, the gas is filtered and Soxremoved prior to discharge from the stack. The DRI and the additives fallinto the slag layer of the Submerged Arc Furnace by gravity where smelting

\\Da0002\01052901\common\DOE REPORT OCT 2000\Section 3.doc Page 24 of 50
takes place. Average metallization here is about 95.8%. Slag is tapped fromthe furnace into slag pots and transferred to a slag processing facility.
PROCESS ADVANTAGES
Iron ore fines as raw materialWide variety of solid reductantsLess reduction timeLower capital investment costs than NG based DR processesProven equipment usage
PELLETIZER
MIXER
ROTARY-HEARTHFURNACE
FLUE GASCONDITIONER
AIRPRE-HEATER
COMBUSTIONAIR
HOT DRITRANSFER
CONTAINERS
EXHAUSTSTACK
EXHAUSTFAN
AIR FAN
OXIDE,REDUCTANT ANDBINDER HOPPERS
FEEDER
IRON DYNAMICS PROCESS FLOWSHEET
FLUE GAS
WATER
DUST TORECYCLE
HOTDUST
FILTER
DRIED PELLETSWITH CARBON
IRON ORE COAL BINDER
RECYCLE DUST
DRYDESULPHURIZER
SCRUBBERWATER
SCRUBBEREFFLUENT
TOTREATMENT
WETDESULPHURIZER
SUBMERGED ARCFURNACE
LIME
COAL
TOBAGHOUSE
MOLTEN PIGIRON
SLAG & CARBONWASTE
TRANSFER CAR
LADLETRANSFER
DESULFURIZATION
TO EAFSTEELMAKING
CRANETRANSFER
DRYER
HOT GAS
MauMee
PROCESS BACKGROUND:
The MauMee process is based upon a rotary hearth furnace which reducesgreen pellets made out of waste iron oxide materials and pulverized non-metallurgical coal to produce hot, metallized (>90%) DRI. The process

\\Da0002\01052901\common\DOE REPORT OCT 2000\Section 3.doc Page 25 of 50
operates at high temperature and atmospheric pressure, features a shortresidence time and can be used to recycle revert materials.
PROCESS DESCRIPTION:
The iron oxide feed to a MauMee furnace is in the form of green pellets/briquettes made of fine iron oxides and coal or coke that eliminates the pre-drying of the pellets. Under ideal high-temperature (2350°F) theoreticalconditions, iron oxide will react with fixed carbon to form metallic iron inthe briquette with the release of CO2. The theoretical ratio of fixed carbon toiron oxide is 1.5:1.
MauMee process has been formulated to produce metallic iron using acarbon-to-oxide ratio of 6:1, which results in the evolution of both CO andCO2 and leaves a residual carbon level of about 4%. The key to this processis controlling the CO-to-CO2 ratio to minimize reoxidation, carbonconsumption and furnace residence time. While traveling throughout thefurnace, pellets are heated up to 2350F. Drying of the pellets, coaldevotalitization and iron oxide reduction takes place during the heatingprocess. The intimate contact between iron oxide and carbon at a very hightemperature results in a very fast reaction rate. The hot DRI product canthen be supplied to the steel mill by a number of different options.
PROCESS ADVANTAGES
Iron ore fines or waste iron units as raw materialWide variety of solid reductantsLess reduction timeProven equipment usage

\\Da0002\01052901\common\DOE REPORT OCT 2000\Section 3.doc Page 26 of 50
HOT DRI
COOLERDRI
BRIQUETTESTORAGE
STACKERCONVEYOR
ROTARYHEARTH
FURNACE
FEEDER/DISTRIBUTOR
DISCHARGESYSTEM
QUENCHATOMIZING AIR
QUENCH WATER
QUENCHCHAMBER
QUENCHATOMIZING AIR 2
QUENCH WATER 2
AIR QUENCH
DUSTCOLLECTION
COMBUSTION AIRPREHEATER
FUEL
PREHEATEDCOMBUSTION AIR
FLUE GASES
PREHEATEDCOMBUSTION AIRNATURAL
GAS TOFURNACE
BLOWER
FLUEGAS
MAUMEE PROCESS FLOWSHEET
IRON OREFINES
DUST
INDUCEDDRAFT FAN
STACK
EXHAUSTGAS
FINE COALSILO
RECYCLEIRON
UNITSSLUDGESCALE
GREEN BRIQUETTES TOROTARY HEARTH FURNACE
BRIQUETTERFEED BIN
TRAMPSCREEN
TRAMPBOX
GREEN BRIQUETTEUNDERSIZE
ROLLBRIQUETTER
BRIQUETTEGRIZZLY
TO DUSTCOLLECTION
MIXER-MULLER
3-2.4 Fluidized Bed
Finmet
PROCESS BACKGROUND:
The Finmet process is a multiple fluidized bed process which utilizes a H2rich reducing gas produced by steam reforming. Reduction is carried out atintermediate reduction temperatures, but at a higher operating pressurethan most DR processes. The process produces hot briquetted iron, HBI.
PROCESS DESCRIPTION:
The iron oxide feed to the Finmet process is in the form of iron fines under12 mm in size. The fines are first dried to 0.2% moisture in a fluid bed drierat about 100C and stored in a hopper close to the reactors. In the first reactor,the oxide fines are preheated to about 550C. Then they pass through theother reducing reactors in series, where they are heated and reduced by the

\\Da0002\01052901\common\DOE REPORT OCT 2000\Section 3.doc Page 27 of 50
reducing gas. The reactor system operates at high pressure, about 11-13 barsgauge, in order to increase the productivity.
The fresh reducing gas required for the process is produced in a steamreformer with a steam to natural gas ratio of 3 to 4. The reformed gasconsisting of CO and H2 passes through a waste heat boiler to producesteam required for the reforming reaction. The reducing gas entering thebottommost reactor is distributed by the grid, passes through the fluid bedwhere reduction occurs, then exits the reactor via the cyclones, locatedinside the reactor vessel. Reduction temperatures range from 550C in the topreactor to about 800C in the lower one. The reduced ore exits the last reactorwith a metallization of 93% and carbon in the range of 1 to 3%. The reducedfines are compacted to a density of 5 g/cc in a briquetting press.
PROCESS ADVANTAGES
Direct use of low cost iron ore finesProven fluid bed technologyHigh process and plant flexibility through separate gas production, finesreduction and briquetting.
ANTHRACITECOAL OR CHAR
AIR
NATURAL GAS
SOLIDS
GAS Fine Ore Direct Reduction Process with SAF
VOEST-ALPINE FINMET
STEAM
AIR
NATURALGAS
SteamReformer
CO2Removal
AIRNATURAL
GAS
FeedSystem
IRON ORE MICRO-PELLETSFROM FEED PREPARATION
SYSTEMS
WATER
Scrubber
Reactors
OrePre-
Heater
ReducingGas
Furnace
#3
#2
#1
#4
SCRUBBERBLOWDOWN TO
THICKENER
NATURALGAS
Pig Casting Machine orSteelmaking Process
Submerged ArcFurnace
LIMETO FLUE GASTREATMENT
MOLTENPIG IRON
SLAG &CARBONWASTE
HOT DRI
Hot DRIPneumatic
TransferSystem
GasCooler
AIR

\\Da0002\01052901\common\DOE REPORT OCT 2000\Section 3.doc Page 28 of 50
Circored
PROCESS BACKGROUND:
The Circored process is a two stage fluidized bed process that operates atlow reducing temperatures and uses natural gas to produce reducing gas bymeans of reforming. The process uses ore fines that have a particle sizebetween 1mm and 0.03mm and produces HBI.
PROCESS DESCRIPTION:
The iron ore fines are first dried and heated to about 800C in a fluid bedpreheater system. The dried fines are then charged to a circulating fluidizedbed (CFB). The heat required is generated by the combustion of natural gasand air that is introduced into the CFB. The fines are reduced to about 70%metallization in CFB. The process reactions are endothermic and therequired energy is introduced in the form of preheated iron ore fines andprocess gases. The pressure in the CFB is about 4 bars and the reactiontemperature is about 630C. This temperature is lower than that used forother reduction processes, and hence avoids the sticking problems thatoccur with high temperature fines-based processes. The fluidizing gas in theCFB is a mixture of heated process gas which enters the lower part of theCFB, and the off-gas from the second stage conventional fluidized bedreactor, Stage II Reactor, FB. The retention time in the CFB is relativelyshort, of the order of 15 to 20 minutes.
A portion of the partially metallized fines are withdrawn from CFB andenter the FB reactor. The FB reactor is compartmentalized into severalsections, and has gas velocities in the range of 0.5 to 0.6 m/s. The fines reacha final metallization of 92 to 93% in the FB reactor. The off-gas leaving thetop of the FB passes on to the CFB. The product leaves the FB reactor atabout 630C, is then heated to about 680C, and briquetted.
PROCESS ADVANTAGES
Ability to process directly low cost fine oreExcellent heat and mass transfer conditions in CFBLow investment costsLow operating cost
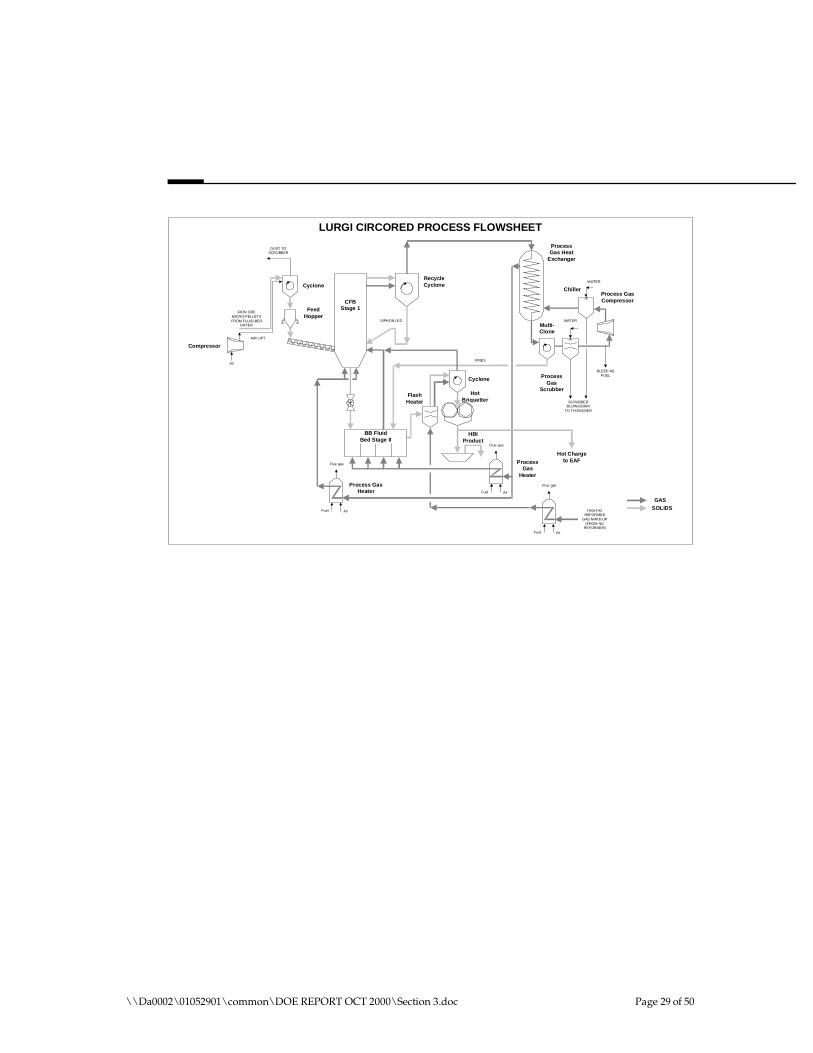
\\Da0002\01052901\common\DOE REPORT OCT 2000\Section 3.doc Page 29 of 50
Cyclone
Air
AIR LIFT
IRON OREMICRO-PELLETSFROM FLUID-BED
DRYER
FeedHopper
CFBStage 1
BB FluidBed Stage II
HotBriquetter
Cyclone
FlashHeater
HBIProduct
AirFuel
Multi-Clone
ProcessGas
Scrubber
ChillerProcess GasCompressor
SCRUBBERBLOW-DOWN
TO THICKENER
BLEED ASFUEL
ProcessGas Heat
Exchanger
RecycleCyclone
LURGI CIRCORED PROCESS FLOWSHEET
Flue gas
ProcessGas
Heater
AirFuel
Flue gas
AirFuel
Flue gas
Process GasHeater
HIGH H2REFORMED
GAS MAKE-UP(FROM NG
REFORMER)
Compressor
SIPHON LEG
FINES
WATER
WATER
DUST TOSCRUBBER
GASSOLIDS
Hot Chargeto EAF
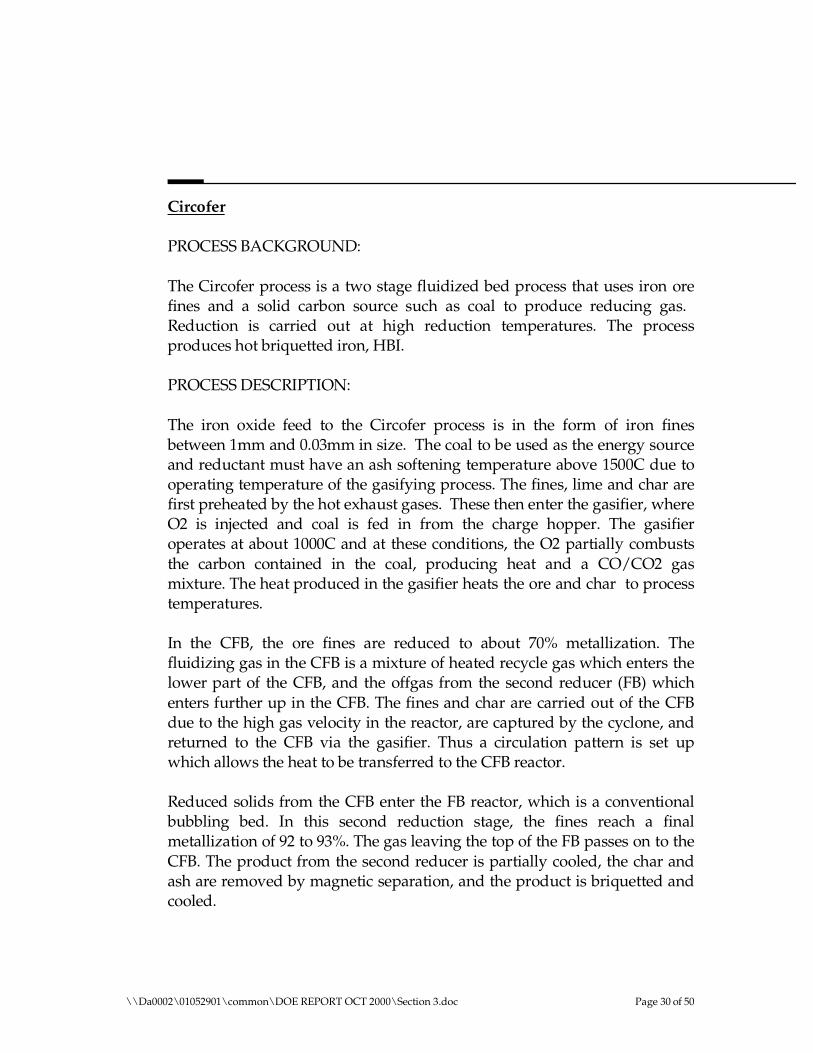
\\Da0002\01052901\common\DOE REPORT OCT 2000\Section 3.doc Page 30 of 50
Circofer
PROCESS BACKGROUND:
The Circofer process is a two stage fluidized bed process that uses iron orefines and a solid carbon source such as coal to produce reducing gas.Reduction is carried out at high reduction temperatures. The processproduces hot briquetted iron, HBI.
PROCESS DESCRIPTION:
The iron oxide feed to the Circofer process is in the form of iron finesbetween 1mm and 0.03mm in size. The coal to be used as the energy sourceand reductant must have an ash softening temperature above 1500C due tooperating temperature of the gasifying process. The fines, lime and char arefirst preheated by the hot exhaust gases. These then enter the gasifier, whereO2 is injected and coal is fed in from the charge hopper. The gasifieroperates at about 1000C and at these conditions, the O2 partially combuststhe carbon contained in the coal, producing heat and a CO/CO2 gasmixture. The heat produced in the gasifier heats the ore and char to processtemperatures.
In the CFB, the ore fines are reduced to about 70% metallization. Thefluidizing gas in the CFB is a mixture of heated recycle gas which enters thelower part of the CFB, and the offgas from the second reducer (FB) whichenters further up in the CFB. The fines and char are carried out of the CFBdue to the high gas velocity in the reactor, are captured by the cyclone, andreturned to the CFB via the gasifier. Thus a circulation pattern is set upwhich allows the heat to be transferred to the CFB reactor.
Reduced solids from the CFB enter the FB reactor, which is a conventionalbubbling bed. In this second reduction stage, the fines reach a finalmetallization of 92 to 93%. The gas leaving the top of the FB passes on to theCFB. The product from the second reducer is partially cooled, the char andash are removed by magnetic separation, and the product is briquetted andcooled.

\\Da0002\01052901\common\DOE REPORT OCT 2000\Section 3.doc Page 31 of 50
PROCESS ADVANTAGES
Direct use of low cost iron ore finesProven fluid bed technologyHigh quality product
GAS
SOLIDS
Cyclone
Air
AIR LIFT
FeedHopper
CFBStage 1
HotBriquetter
HBIProduct
Air
RecycleCyclone
LURGI CIRCOFER PROCESS FLOWSHEET
Flue gas
ProcessGas
Heater
Compressor
DUST TOSCRUBBER
COAL CHAR
IRONORE
FINESADDITIVE
Gasifier
O2
Fluid BedStage II
RecycleChar
Steam BoilerSteam to
CO2Absorber
VenturiScrubber
Dust
Bag Filter
toSettling
Pond
CO2
Steam
Iron Carbide Processes
PROCESS BACKGROUND:
Iron carbide (Fe3C) is a chemical compound of 93% iron and 7% carbon inpure form. It can be used as the only feed for BOFs and EAFs. In that role iteliminates the need for coke ovens and the blast furnace, and all theancillary equipment for coal and lime. The Iron Carbide process is a twostage fluidized bed process that operates at a lower temperature than otherDR processes. It operates at low pressures and uses steam reforming toproduce the H2 which is mixed with CH4 to make the carburizing gas. Itproduces Fe3C powder which contains about 6% carbon.PROCESS DESCRIPTION:

\\Da0002\01052901\common\DOE REPORT OCT 2000\Section 3.doc Page 32 of 50
The iron oxide feed to the iron carbide process is in the form of iron ore finesin the range of 1mm to 0.1 mm. Iron ore fines are preheated in a series ofcyclones and then pressurized to reactor pressure in lockhoppers, and fed tothe reactor by a screw feeder.
The fluidized bed reactors have the upward moving stream of 600C gascomposed of CO, CO2, H2, CH4 and H2O. The hydrogen reacts with theiron ore, combing with its oxygen to form water (the only process by-product). Carbon from the carbonaceous gases combines with the elementaliron to form iron carbide. The methane provides the gas system equilibrium.After the reactions in the fluid bed reactors, the off gases are condensed toget rid of water vapor, reconstituted with H2 and carbonaceous gases, raisedto reactor working pressure to 1.8 atm, heated to 600C, and reintroduced inthe windbox of the reactor.
An indication of the inherent thermal efficiency of the process is gained fromthe fact that the temperature of formation of iron carbide in the fluid bedreactor is only 600C as against around 1000C for reduction of iron in DRIprocesses and 1500C to produce hot metal in the blast furnace.
PROCESS ADVANTAGES
Lower operating temperatureLower production costsNo storage costs as the product does not oxidizeSteelmaking cheaper with Fe3C
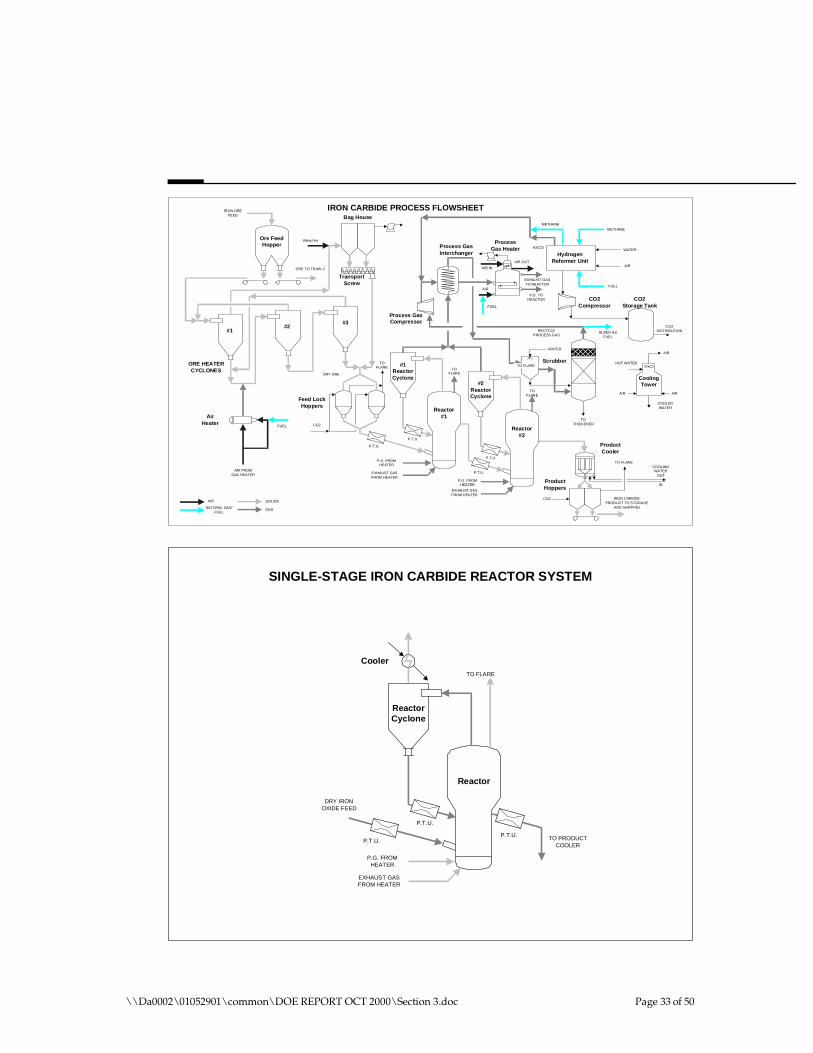
\\Da0002\01052901\common\DOE REPORT OCT 2000\Section 3.doc Page 33 of 50
IRON CARBIDE PROCESS FLOWSHEET
ORE TO TRAIN 2
Ore FeedHopper
IRON OREFEED
#1#2
#3
ORE HEATERCYCLONES
AirHeater
FUEL
Bleed Air
TOFLARE
Feed LockHoppers
CO2
TOFLARE
#1ReactorCyclone
Reactor#1
IRON CARBIDEPRODUCT TO STORAGE
AND SHIPPING
ProductHoppers
TO FLARE
CO2
ProductCooler
OUT
IN
COOLINGWATER
P.T.U.
P.T.U.
Bag House
TransportScrew
HydrogenReformer Unit
FUEL
CO2DISTRIBUTION
CO2Storage Tank
CO2Compressor
WATER
AIR
METHANEMETHANE
H2/CO
P.G. TOREACTOR
P.G. FROMHEATER
ProcessGas HeaterProcess Gas
Interchanger
Process GasCompressor
AIR
NATURAL GAS/FUEL
SOLIDS
GAS
WATER
Scrubber
RECYCLEPROCESS GAS
TOTHICKENER
HOT WATER
COOLEDWATER
AIRAIR
AIR
CoolingTower
AIR FROMGAS HEATER
AIR IN
AIR OUT
DRY ORE
BLEED ASFUEL
AIR
FUEL
EXHAUST GASTO REACTOR
EXHAUST GASFROM HEATER
TO FLARE
#2ReactorCyclone
Reactor#2
P.T.U.
TOFLARE
P.G. FROMHEATER
EXHAUST GASFROM HEATER
P.T.U.
TO FLARE
ReactorCyclone
Reactor
P.T.U.
P.T.U.
P.G. FROMHEATER
EXHAUST GASFROM HEATER
Cooler
DRY IRONOXIDE FEED
SINGLE-STAGE IRON CARBIDE REACTOR SYSTEM
P.T.U. TO PRODUCTCOOLER

\\Da0002\01052901\common\DOE REPORT OCT 2000\Section 3.doc Page 34 of 50
FB REACTORSTAGE 2
FB REACTORSTAGE 1
TWO-STAGE IRON CARBIDE REACTOR SYSTEM
CYCLONE CYCLONE
COOLER COOLER
DRY IRONOXIDE FEED
INTER-STAGETRANSPORT SYSTEM
SOLIDSRECYCLE
SOLIDSRECYCLE
ZONE 1RECYCLE GAS
ZONE 2RECYCLE GAS
ZONE 1 GASTO RECYCLE
ZONE 2 GASTO RECYCLE
REACTOR 1PRODUCT
REACTOR 2PRODUCT
GasCooler
GasCooler
Cyclone Cyclone
ZONE 1 ZONE 2
MSTB Reactor
ZONE 1 GASRECYCLE
ZONE 2 GASRECYCLE
TO ZONE 1GAS RECYCLE
TO ZONE 2GAS RECYCLE
DRY IRONOXIDE FEED
TO IRON CARBIDEPRODUCT COOLER
PROCEDYNE MSTB IRONCARBIDE REACTOR SYSTEM
TO FINESPROCESSING
TO FINESPROCESSING

\\Da0002\01052901\common\DOE REPORT OCT 2000\Section 3.doc Page 35 of 50
3-2.5 OTHER (REACTOR, ETC.)
Hismelt
PROCESS BACKGROUND:
The HIsmelt process was initially developed as an air-blown, bottom-injected, refractory-lined process. But due to excessive refractory wear, theinitial horizontal design was abandoned and a new Vertical smelt reductionvessel (SRV) was proposed.
PROCESS DESCRIPTION:
In this process, the iron ore is preheated (and optionally prereduced as far asmagnetite) in a lean-phase cyclone preheat system similar to that on manycement kilns. It is then injected into the SRV, along with coal and fluxmaterials through two water-cooled solids injection lances such that themixture is carried predominantly into the metal phase. Rapid dissolutionand smelting occur in the metal and the resulting product gases (mainlyhydrogen and carbon monoxide) rise under buoyancy to generate the largeliquid fountain, a characteristic of HIsmelt. The result is strong mixingwithin the metal and slag phases with effective elimination of any significantthermal gradients.
Hot offgas from the SRV is enriched with a small quantity of natural gas, theresulting mixture being roughly equivalent to blast furnace gas. This gas iscooled to around 1000C and split into roughly equal proportions. Oneportion is used (hot) in the preheater, whilst the other is scrubbed andsubsequently burned as fuel in the hot blast stoves.
PROCESS ADVANTAGES
Direct smeltingLow direct electrical power consumption

\\Da0002\01052901\common\DOE REPORT OCT 2000\Section 3.doc Page 36 of 50
HISMELT PROCESS FLOWSHEET
SLAG
HOTMETAL
COAL & FLUX
PREHEATEDORE700C
HOT AIR BLAST (O2ENRICHED)
1200C
WATERCOOLEDPANELS
OREFINES
SMELTREDUCTION
VESSEL (SRV)
HOTBLAST1200C
PROCESSAIR
OXYGENPLANT
FLUE
AIRBFW
STEAM TURBINE
COMB AIR
OREPREHEATER
COLD SRVGAS35C
NATURALGAS
1000C
Dios
PROCESS BACKGROUND:
The Dios process is a bath smelting process, intensively investigated inJapan. For testing program, 100t smelters are constructed from remodeledBOF converters. Successful operational procedures have been establishedand an output rate of 40t/hr of hot metal is reported.
PROCESS DESCRIPTION:
Iron ore is preheated in the first of two fluidized bed reactors in series andpre-reduced to 15-25% in the second reactor using cleaned offgas from thesmelter. It is claimed that the high thermal efficiency through pre-reductionoperation has the potential for using less expensive coal and lowerconsumption compared with BF route. In addition, a small amount of coalfines is injected into the smelter offgas to cool the offgas and provideadditional CO and H2 for pre-reduction. Coal is gravity fed into the smelter.

\\Da0002\01052901\common\DOE REPORT OCT 2000\Section 3.doc Page 37 of 50
Oxygen is injected into the smelter for combustion of primary coal and forpost combustion.
PROCESS ADVANTAGES
Direct smelting processUse of coal as reductantLow direct electrical power consumption
Romelt Process
PROCESS BACKGROUND:
The Romelt process is a bath smelting technology for converting iron oxides(either virgin iron ores or iron bearing waste materials) to blast furnace –grade pig iron using non-coking grades of coal as a fuel and reductant.Liquid, granulated, or cast pig iron have the highest “value-in-use” of allscrap substitutes, as they contain no gangue, have low residuals, and a highcarbon content, and hence enable the EAF to produce high quality steelgrades while simultaneously increasing furnace productivity.
PROCESS DESCRIPTION:
The iron oxide feed to a Romelt furnace can be any iron containing material,e.g. iron ore fines and concentrates, blast furnace and BOF dusts andsludges, mill scale, iron bearing slags from non-ferrous smelting operations,scarfs and turnings, iron dusts, etc. The non-coking coals of 15-20% volatilematter and approx. 8% ash have been used in past. The solid feeds (coal,iron oxides, and fluxes) are charged by gravity in the furnace.
A row of lower blast tuyeres on each side of the furnace introduce oxygen toagitate the bath and gasify some coal, while upper tuyeres blow oxygen forpost-combustion. The furnace operates under a slight pressure, with aninduced draft fan drawing the waste gases out of the furnace and throughthe off-gas system. Hot metal and slag are removed periodically throughseparate tapholes in either end of the furnace. The hearth and lower walls ofthe furnace are refractory lined, and the upper walls of the furnace are madeup of a series of water-cooled panels. The furnace consists of four zones:

\\Da0002\01052901\common\DOE REPORT OCT 2000\Section 3.doc Page 38 of 50
Quiescent metal zone, Quiescent slag zone, Agitated slag zone and Gascombustion zone.
The bulk of the reduction process takes place in the agitated slag zone.Interaction between the metal and slag in both the agitated and quiescentzones allows partitioning of minor elements between these two phases totake place. Gases generated in the bath (predominantly CO and H2, withsome N2) enter the combustion zone where they react with the oxygen fromthe upper blast, liberating energy.
PROCESS ADVANTAGES
Wide variety of raw materialSolid waste disposalLow direct electrical power consumption
OXIDE,REDUCTANT ANDFLUX HOPPERS
FEEDER
ICF KAISER / MISA ROMELT PROCESS FLOWSHEET
IRON ORE COAL FLUX
FAN
EXHAUSTSTACK
FLUE GAS
HOT METAL SLAG
TO STEAMTURBINE
DUST CLEANING UNITS
ROMELT FURNACE
POST COMBUSTION
HOT METAL
SLAG
WASTEHEAT
BOILER

\\Da0002\01052901\common\DOE REPORT OCT 2000\Section 3.doc Page 39 of 50
Gridsmelter
PROCESS BACKGROUND:
The Gridsmelter process is based upon a melter-gasifier that melts efficientlypre-reduced fine ore (60% to 80%) with some coke and coal in a grid smelterreactor vessel. Reduction is carried out at typical reduction temperatures.The process produces liquid pig iron as a product.
PROCESS DESCRIPTION:
The Gridsmelter process consists of a melter-gasifier for using iron-containing fines as the primary feedstock. It is a pressure vessel withinternal refractory lining of walls. The high temperature wall area and roof,where fine coal, natural gas or oil burns with preheated air or oxygen arewater-cooled. The grid that supports a coke/refractory filter bed is alsowater-cooled.
The region above the grid (high temperature zone) is very similar to theraceway of a Blast furnace. In this high temperature zone, the final reductionand liquification take place. The liquified materials pass through the filterbed in co-current with the gases. FeO droplets formed are reduced,carburized and separated from the leaving gases, falling down into thefurnace hearth. The furnace hearth contains liquid pig iron, slag and abubbling fluidized coal/coke bed. The offgas leaves the vessel in the middleof the vessel height. The gas is hot cleaned by cyclone and used for pre-reduction and preheating of the feedstock and blast preheating.
PROCESS ADVANTAGES
Wide variety of raw materials like sponge iron, iron ore fines, mill scale, etc.Takes advantage of ‘sticking effect’Low direct electrical power consumptionLiquid hot metal product

\\Da0002\01052901\common\DOE REPORT OCT 2000\Section 3.doc Page 40 of 50
ISCON GRIDSMELTER PROCESS FLOWSHEET
COAL
O2 bearing gas or coal
ORE
PRE-REDUCING CYCLONE
REFORMER
REDUCING AND SMELTINGFURNACE
SLAGHOT METAL
Comet Process
PROCESS BACKGROUND:
The Comet process, developed by the Centre de Recherches Metallurgiques(CRM), Belgium is a coal-based system that produces sponge iron from orefines and limestone in a rotary hearth furnace. A laboratory, 100-kg/hrinstallation was brought on-stream in Nov. 1996. (Cockerill Sambre, ProfilArbed, Sidmar and Hoogovens have acquired the CRM license for theprocess.)
Based on the successful results obtained, a pilot 1.5-tonne/hour plant hasbeen built at Sidmar, Ghent, Belgium. Metallization results confirm thoseobtained from the laboratory unit. Productivity, cost, price, energyconsumption and environmental impact are being established.

\\Da0002\01052901\common\DOE REPORT OCT 2000\Section 3.doc Page 41 of 50
PROCESS DESCRIPTION:
Similar to Fastmet or Inmetco.
PROCESS ADVANTAGES
Direct use of low cost iron ore finesLow cost reductantLess reduction timeProven equipment usage
FINEX Process
PROCESS BACKGROUND:
The FINEX process produces liquid iron (hot metal) using fine iron ore andnon-coking coal directly without any pre-treatment process for rawmaterials and fuel such as sintering process for raw materials and cokingprocess for coal in the blast furnace ironmaking process.
PROCESS DESCRIPTION:
FINEX Development Project in POSCO in Sanghoon Joo RIST, Republic ofKorea
The detailed objectives are as follows:
Finex, a coal-based smelting reduction process, continues to be jointlydeveloped by Posco, RIST and Voest-Alpine. This process is reported to be amore advanced smelting reduction technology than Corex. A 150-tonne/day pilot plant is under construction at the Posco Pohang Worksbased on the success achieved with a smaller 15-tonne/day unit: completionis scheduled for March 1999. It is reported that advantages include the use offine ore and non-coking coal together with lower construction costs, reducedemissions and lower manpower and production costs than the Corexprocess.

\\Da0002\01052901\common\DOE REPORT OCT 2000\Section 3.doc Page 42 of 50
PROCESS ADVANTAGES:
Direct use of ore fines (-8 mm) without sinteringDirect use of non-coking coal without the coke oven for ironmakingReduced hot metal production costAn environment-friendly ironmaking processOperational flexibility in ironmaking process.Contact : Ernst Worrell
Plasma Processes
PROCESS BACKGROUND:
In plasma smelting for direct reduction, gases and solids are passed throughan arc, much like a welding arc, and are heated. This electric heatingreplaces oxygen in conventional systems that use oxy-fuel burners.
The Plasmasmelt process produces molten iron from pre-reduced iron ore.A plasma torch consisting of a pair of tubular, water-cooled copperelectrodes discharges an electric arc which is magnetically rotated at veryhigh speeds. The electrodes are spaced closely together and duringoperation, a process gas is injected through the narrow gap between theelectrodes. The arc current can be varied independent of gas flow rate andthus, process temperatures can be controlled.
PROCESS DESCRIPTION:
In this process, the shaft is completely filled with coke. The reactions takeplace in the shaft furnace with tuyeres spaced symmetrically around thelower part of the furnace. Plasma generators and equipment for injection ofmetal oxides mixed with slag-forming material and possibly reductants areattached to the tuyeres. In front of each tuyere a cavity is formed inside thecoke column where reduction and smelting take place. At regular intervalsthe produced slag and metal are tapped from the bottom of the shaftfurnace. During iron ore smelting, the off-gas from the furnace, consistingmainly of carbon monoxide and hydrogen, are used for pre-reduction of theore.

\\Da0002\01052901\common\DOE REPORT OCT 2000\Section 3.doc Page 43 of 50
In case the ore contains metals with high vapor pressures, for example zincand lead, these metals leave the furnace with the off-gas that is then passedthrough a condenser where the metals are recovered from the gas.
PROCESS ADVANTAGES:
A negative advantage is that it takes an enormous amount of electricalpower to produce the desired results.
PlasmaRed
This process utilizes the plasma energy specifically to generate a reducinggas for DRI Production in a shaft furnace, not for metal melting or oresmelting. It has the potential for higher efficiencies of electrical powerusage.
PLASMARED PROCESS FLOWSHEET
Plasma gasifier SFilter Reduction
shaft
VenturiScrubber
CO2 removal
Coalslurry
Electricpower
Dolomite
Dolomite (S)
DR pellets1.4 t
DRI
Flare
H2O

\\Da0002\01052901\common\DOE REPORT OCT 2000\Section 3.doc Page 44 of 50
AISI Process
PROCESS BACKGROUND:
The AISI direct steelmaking project was a collaborative research programmeheavily supported by the US DOE, by the Steel industry and by academicinstitutions. But now it has been discontinued largely. Hoogovens hascontinued some work in this area as a source of semi-reduced feedstock fortheir other project, the cyclone converter furnace.
PROCESS DESCRIPTION:
The AISI process directly uses fine ores and coals to produce molten iron ina two-stage process. In the first stage, ore is pre-reduced and melted in amelting cyclone. Directly connected to the melting cyclone is a convertertype vessel where pre-reduced and melted ore undergoes final reduction.Post-combustion of gases takes place that improves energy efficiency, andthe waste gases are used for pre-reduction of the pellets. A vertical smelterwas used initially, but a design change to a horizontal reactor has been madewhich is expected to improve productivity and flexibility.
PROCESS ADVANTAGES
Direct smelting processProduces liquid hot metalReduced direct electrical power consumption
3-3: Process Groupings
In the initial screening analysis of the various Ironmaking processes, therewas an attempt to categorize or group the processes into similar groups.The purpose was to be in a position to select one or two outstandingIronmaking processes from a given group to compare with selectedprocesses from other groups. These efforts were not completely successfuldue to the diverse nature of the various Ironmaking processes, the variety offorms of iron produced and the different sources of energy utilized for theprocesses.
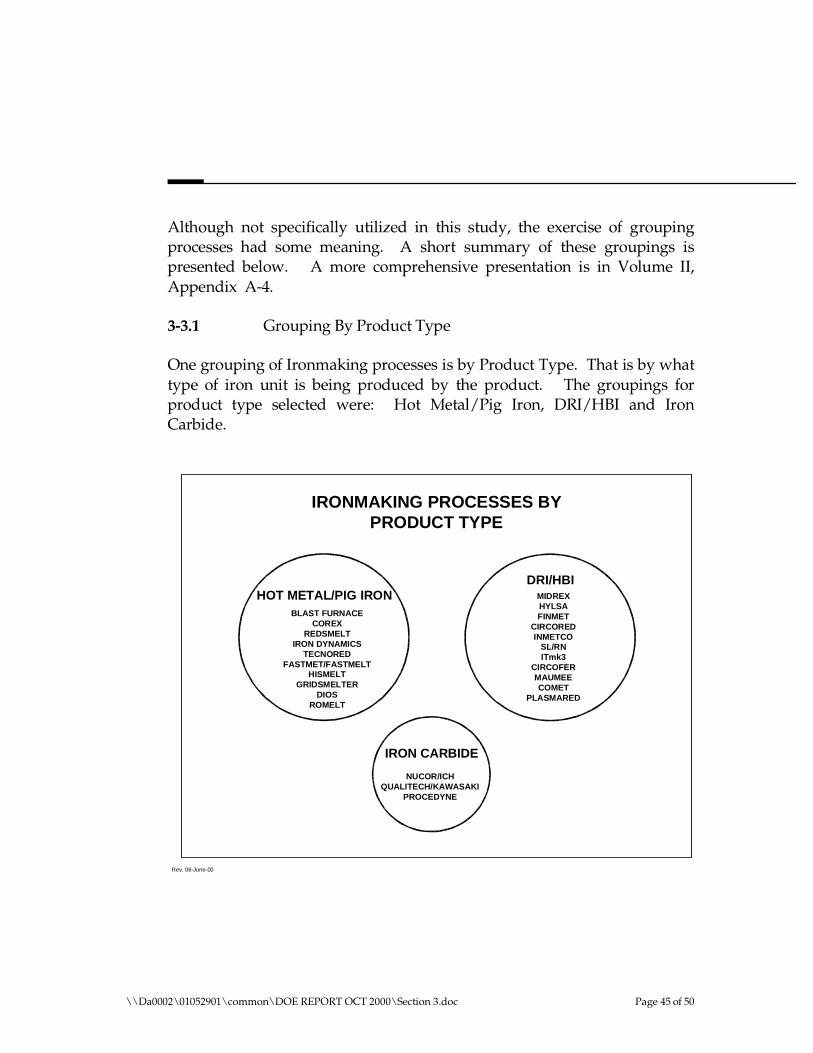
\\Da0002\01052901\common\DOE REPORT OCT 2000\Section 3.doc Page 45 of 50
Although not specifically utilized in this study, the exercise of groupingprocesses had some meaning. A short summary of these groupings ispresented below. A more comprehensive presentation is in Volume II,Appendix A-4.
3-3.1 Grouping By Product Type
One grouping of Ironmaking processes is by Product Type. That is by whattype of iron unit is being produced by the product. The groupings forproduct type selected were: Hot Metal/Pig Iron, DRI/HBI and IronCarbide.
IRONMAKING PROCESSES BYPRODUCT TYPE
HOT METAL/PIG IRONBLAST FURNACE
COREXREDSMELT
IRON DYNAMICSTECNORED
FASTMET/FASTMELTHISMELT
GRIDSMELTERDIOS
ROMELT
DRI/HBIMIDREXHYLSAFINMET
CIRCOREDINMETCO
SL/RNITmk3
CIRCOFERMAUMEECOMET
PLASMARED
IRON CARBIDE
NUCOR/ICHQUALITECH/KAWASAKI
PROCEDYNE
Rev. 06-June-00

\\Da0002\01052901\common\DOE REPORT OCT 2000\Section 3.doc Page 46 of 50
3-3.2 Grouping by Stage of Commercial Development
Another grouping of Ironmaking processes is by Stage of CommercialDevelopment. The groupings utilized are:
• Proven Commercial The process is operating commercially inmore than one economically-viableinstallation.
• Semi-Commercial The process is undergoing startup in afirst-of-a-kind commercial scaleinstallation or is still in processdemonstration phase. This also includesthose that are no longer being operated.
• Pilot Scale The process has been operated at anintegrated pilot scale.
• Semi-Pilot Component Test Parts of the process have been operatedat a pilot scale.
IRONMAKING PROCESSES BY STAGEOF COMMERCIAL DEVELOPMENT
PROVENCOMMERCIAL
BLAST FURNACEMIDREXHYLSACOREXSL/RN
SEMI-COMMERCIALFINMET
CIRCOREDIRON DYNAMICS
MAUMEENUCOR/ICH
QUALITECH/KAWASAKIINMETCO
REDSMELT
PILOT PLANT
TECNOREDHISMELT
FASTMET/FASTMELTDIOS
ROMELTITmk3
COMPONENTTEST
PROCEDYNECIRCOFER
GRIDSMELTERCOMET
PLASMARED
Rev. 06-June-00

\\Da0002\01052901\common\DOE REPORT OCT 2000\Section 3.doc Page 47 of 50
3-3.3 Grouping by Iron Unit Feed Material
An important grouping of Ironmaking processes is by the nature of theprocess Iron Unit Feed Material. Categories for grouping chosen include:
• Lump Ore/Iron Ore Pellets/Briquetted Feed/ Recycled Iron Units, etc,:The intent of this grouping (which could be sub-grouped further) was tocompare those processes that predominately utilized natural lump ironore or a prepared (e.g. palletized, briquetted, etc.) iron unit feed.
• Fine Ore: The intent of this grouping was to emphasize that processesthat utilize fine ore (or concentrates) directly without agglomeration orcomplex preparation may have distinct economic advantages.
IRONMAKING PROCESSES BYIRON UNIT FEED MATERIAL
LUMP ORE/PELLET/BRIQUETTE/RECYCLE IRON UNITS, ETC.
BLAST FURNACECOREXMIDREXHYLSASL/RN
TECNOREDFASTMET/FASTMELT
ITmk3REDSMELTINMETCO
IRON DYNAMICSMAUMEE FINE ORE
FINMETCIRCOREDCIRCOFERNUCOR/ICH
QUALITECH/KAWASAKIPROCEDYNE
HISMELTDIOS
ROMELTGRIDSMELTER
COMETPLASMARED
Rev. 06-June-00

\\Da0002\01052901\common\DOE REPORT OCT 2000\Section 3.doc Page 48 of 50
3-3.4 Grouping by Primary Reductant Type
An important categorization criteria for Ironmaking processes is to group byPrimary Reductant Type. The groupings are as follows:
• Coke: Metallurgical grade coke or coke of lesser quality (e.g. forTecnored) is the primary reductant source.
• Predominately Coal: Non-Metallurgical coal is the primary reductantand fuel.
• Natural Gas/Reformed Gas: Either natural gas (subsequentlyreformed or used directly) and Reformed Gas (e.g. Sasol gas, Corex off-gas, etc.) is the primary reductant and fuel.
• Mixed Coal/Natural Gas systems utilize a balanced mixture of coal andnatural gas as the fuel and/or reductant source.
IRONMAKING PROCESSES BYPRIMARY REDUCTANT TYPE
COKE
BLAST FURNACETECNORED
PREDOMINATELYCOALCOREX
TECNORED (OPTION)SL/RN
FASTMET/FASTMELTREDSMELTINMETCO
IRON DYNAMICSMAUMEE
CIRCOFER
NATURAL GAS/H2/REFORMED GAS
MIDREXHYLSA
CIRCOREDFINMET
NUCOR/ICHQUALITECH/KAWASAKI
PROCEDYNEPLASMARED
COAL/NATURALGAS MIXTURE
ITmk3HISMELT
DIOSROMELT
GRIDSMELTERCOMET
Rev. 06-June-00

\\Da0002\01052901\common\DOE REPORT OCT 2000\Section 3.doc Page 49 of 50
3-3.5 Grouping by Reduction Process Type
A meaningful method of categorizing Ironmaking processes is to group byReduction Process Type. The groupings utilized include:
• Shaft Furnace: Includes hot metal and DRI producing shaft furnaces.Flow of solids and liquids are counter-current to the reducing or heatinggases. Part of the reductant may be added in solid form.
• Rotary Kiln: This is processes where the primary reduction is donein a rotary kiln. Solid or gaseous reductants (or a mixture) are possible.
• Rotary Hearth: A number of processes utilize a rotary hearth as theprimary furnace where reduction occurs. Solid or gaseous reductants(or a mixture is possible).
• Fluidized Bed: There are fine ore-based processes where the ore isfluidized and transported by the reducing gas.
• Other (Reactor, etc.): The remaining Ironmaking processes where areactor is utilized for the primary reducing vessel.
IRONMAKING PROCESSES BYREDUCTION PROCESS TYPE
SHAFTFURNACE
BLAST FURNACECOREXMIDREXHYLSA
TECNORED
ROTARY HEARTHREDSMELT
FASTMET/FASTMELTITmk3
INMETCOIRON DYNAMICS
MAUMEE
FLUIDIZED BEDFINMET
CIRCOREDCIRCOFERNUCOR/ICH
QUALITECH/KAWASAKIPROCEDYNE
OTHER(REACTOR,
ETC.)HISMELT
DIOSROMELT
GRIDSMELTERCOMET
PLASMARED
ROTARYKILN
SL/RN
Rev. 06-June-00

\\Da0002\01052901\common\DOE REPORT OCT 2000\Section 3.doc Page 50 of 50
3-3.5 Grouping by Target Nominal Size of Reduction Unit/Train
This attempt at categorizing is based on the Nominal Size of the PrimaryReduction Unit or Single-Train.
IRONMAKING PROCESSES BYTARGET NOMINAL SIZE OF REDUCTION UNIT/TRAIN
LESS THAN200,000 MTPY
MAUMEEINMETCOROMELT
GRIDSMELTERCOMET
PLASMARED
200,000 TO500,000 MTPY
TECNOREDHISMELT
IRON DYNAMICSSL/RN
CIRCOFERNUCOR/ICH
QUALITECH/KAWASAKIPROCEDYNE
500,000 TO1,000,000 MTPY
REDSMELTFINMET
CIRCOREDFASTMET/FASTMELT
ITMK3DIOS
GREATER THAN1,000,000 MTPY
BLAST FURNACECOREXMIDREXHYLSA
Rev. 06-June-00
It should be noted that the categorization as done in Section 3-3.5, i.e.Grouping by Reduction Process Type is the method selected for thecomparative process evaluation.

\\Da0002\01052901\common\DOE REPORT OCT 2000\Section 4.doc Page 1 of 39
Section 4: Discussion of Ranking Analysis
4-1: Ranking Variables Considered
The methodology followed in comparing the various Ironmaking Processeswas to sort and rank the processes by the order of the specific processvariables considered. That is, the process with the lowest (or highest) valueas appropriate for a specific variable is ranked first, the next lowest (orhighest), is ranked second, and so on until the poorest process is rankedlast.The selected processes are listed in Section 3-1.2.
The ranking variables include:
• Capital Cost (CAPEX): The Relative Capital Costs as $/Annual metricton of Liquid Refined Steel Production of the Ironmaking/EAF/LRFSteelmaking processes as summarized in Section 2-4.1 and in detail inVolume II, Appendix F-5.
• Operating Costs Per Iron Unit (OPEX I.U.): The Relative OperatingCosts of the Iron Unit Production as summarized in Section 2-4.3 and indetail in Volume II, Appendix F-4.
• Operating Costs Per LRS Production: The Relative Operating Costs permt of LRS as summarized in Section 2-4.3 and in detail in Volume II,Appendix F-4.
• Simple Internal Rate Of Return (I.R.R.): Utilizing the Relative Capitaland Operating Costs for LRS, a simple rate of return calculation wasdone to combine the impacts of Capital and Operating Costs. These aresummarized in Volume II, Appendix G-1.
• Total Cumulative Electric Power Consumption: The cumulative electricpower consumption (Volume II, Appendix F-3) through production ofLRS.
• Total Cumulative Process Emissions: The Cumulative emissions ofcarbon gases (as CO2) from the Processes only (Volume II, Appendix F-3).

\\Da0002\01052901\common\DOE REPORT OCT 2000\Section 4.doc Page 2 of 39
• Total Cumulative Emissions: The cumulative emissions of carbon gases(as CO2) from the Process and the equivalent emissions from the totalcumulative electrical power through production of LRS (Volume II,Appendix F-3).
The following tables summarize the specific variable quantities compared inthe sorting and ranking exercises. These are sensitized by the cost ofpurchased steel scrap used in the EAF/LRF steelmaking processes. Thederivation and explanation of these tables for the selected processes arepresented in Volume II, Appendix G-1.

\\Da0002\01052901\common\DOE REPORT OCT 2000\Section 4.doc Page 3 of 39
Table 4-1.1: Basis: $100/mt of Steel ScrapVARIABLES FOR RANKING OF IRONMAKING PROCESSES - RESEQUENCED
SEQ. PROCESS CAPEX OPEX FOR I.U. OPEX FOR L.S. INTERNAL RATE TOTAL ELEC. PROCESS CO2 TOTAL CO2
NO. ($/ANN. mt L.S.) ($/ANN. mt I.U.) ($/ANN. mt L.S.) OF RETURN (kWhr/mt LS) (mt/mt LS) (mt/mt LS)
1 100% DRI, 1.0% C, MIDREX $365.36 $132.44 $205.39 10.57% 1,326.73 1.0514 2.2617
2 100% STEEL SCRAP $173.68 $0.00 $176.83 42.09% 822.45 0.0874 0.8909
3 30% DRI, 1.0% C/70% SCRAP $231.85 $137.51 $188.64 26.21% 1,030.37 0.4283 1.3681
4 HYLSA IVM $362.60 $125.52 $196.15 13.72% 1,267.37 0.9086 2.0646
5 30% BF H.M./70% SCRAP CP COKE $243.64 $142.86 $189.65 24.46% 795.44 0.8974 1.6746
6 30% MINI-BF H.M.* $198.05 $142.86 $189.65 30.32% 795.44 0.8974 1.6746
7 30% BF H.M./70% SCRAP NR COKE $243.63 $110.77 $178.23 29.28% 660.35 0.9594 1.5615
8 30% COLD PIG IRON/70% SCRAP $248.06 $145.12 $198.05 20.43% 1002.39 0.9027 1.8170
9 30% TECNORED H.M. W COGEN $196.48 $125.95 $177.67 36.74% 307.58 1.1545 1.4350
10 30% TECNORED H.M. W/O COGEN $187.71 $163.09 $190.98 31.30% 685.69 1.1545 1.7799
11 COREX/MIDREX WITH 60% H.M. $373.50 $161.83 $218.17 5.72% 942.91 2.9239 3.7839
12 HISMELT 32.7% H.M. $259.63 $137.85 $190.82 22.39% 847.37 0.8689 1.6418
13 REDSMELT $334.67 $101.83 $188.31 17.73% 690.28 1.3624 1.9921
14 MAUMEE BRIQUETTE DRI/EAF $292.32 $66.44 $177.03 24.66% 966.09 1.1498 2.0310
15 ITMK3 DR SHOT TO EAF $296.10 $67.60 $178.76 23.72% 825.40 1.5213 2.2742
16 CIRCORED/HBI/EAF $232.37 $78.79 $185.27 27.64% 900.84 1.1999 2.0217
17 CIRCOFER/HBI/SAF/EAF $239.63 $96.20 $188.55 25.37% 780.99 1.6404 2.3528
18 FINMET/HBI/EAF $263.47 $79.42 $185.12 24.31% 907.76 1.0742 1.9022
19 GENERIC IRON CARBIDE (100%)/EAF $347.59 $66.19 $177.84 20.24% 972.95 1.2864 2.1738
20 GENERIC I.C. (40%)/SAF/EAF* $257.24 $100.79 $179.90 27.02% 1185.22 1.3320 2.0648
21 SL/RN ROTARY KILN $344.39 $74.08 $180.74 19.55% 999.74 2.2869 3.1988

\\Da0002\01052901\common\DOE REPORT OCT 2000\Section 4.doc Page 4 of 39
Table 4-1.2: Basis: $120/mt of Steel ScrapVARIABLES FOR RANKING OF IRONMAKING PROCESSES - RESEQUENCED
SEQ. PROCESS CAPEX OPEX FOR I.U. OPEX FOR L.S. INTERNAL RATE TOTAL ELEC. PROCESS CO2 TOTAL CO2
NO. ($/ANN. mt L.S.) ($/ANN. mt I.U.) ($/ANN. mt L.S.) OF RETURN (kWhr/mt LS) (mt/mt LS) (mt/mt LS)
1 100% DRI, 1.0% C, MIDREX $365.36 $132.44 $205.39 10.57% 1,326.73 1.0514 2.2617
2 100% STEEL SCRAP $173.68 $0.00 $197.39 30.14% 822.45 0.0874 0.8909
3 30% DRI, 1.0% C/70% SCRAP $231.85 $137.51 $203.36 19.55% 1,030.37 0.4283 1.3681
4 HYLSA IVM $362.60 $125.52 $196.15 13.72% 1,267.37 0.9086 2.0646
5 30% BF H.M./70% SCRAP CP COKE $243.64 $142.86 $204.39 18.04% 795.44 0.8974 1.6746
6 30% MINI-BF H.M.* $198.05 $142.86 $204.39 22.64% 795.44 0.8974 1.6746
7 30% BF H.M./70% SCRAP NR COKE $243.63 $110.77 $192.97 23.04% 660.35 0.9594 1.5615
8 30% COLD PIG IRON/70% SCRAP $248.06 $145.12 $212.79 13.89% 1002.39 0.9027 1.8170
9 30% TECNORED H.M. W COGEN $196.48 $125.95 $192.41 29.14% 307.58 1.1545 1.4350
10 30% TECNORED H.M. W/O COGEN $187.71 $163.09 $205.72 20.25% 685.69 1.1545 1.7799
11 COREX/MIDREX WITH 60% H.M. $373.50 $161.83 $218.16 5.72% 942.91 2.9239 3.7839
12 HISMELT 32.7% H.M. $259.63 $137.85 $198.19 19.38% 847.37 0.8689 1.6418
13 REDSMELT $334.67 $101.83 $190.67 16.96% 690.28 1.3624 1.9921
14 MAUMEE BRIQUETTE DRI/EAF $292.32 $66.44 $177.03 24.66% 966.09 1.1498 2.0310
15 ITMK3 DR SHOT TO EAF $296.10 $67.60 $181.12 22.89% 825.40 1.5213 2.2742
16 CIRCORED/HBI/EAF $232.37 $78.79 $185.27 27.64% 900.84 1.1999 2.0217
17 CIRCOFER/HBI/SAF/EAF $239.63 $96.20 $188.55 25.37% 780.99 1.6404 2.3528
18 FINMET/HBI/EAF $263.47 $79.42 $185.12 24.31% 907.76 1.0742 1.9022
19 GENERIC IRON CARBIDE (100%)/EAF $347.59 $66.19 $177.84 20.24% 972.95 1.2864 2.1738
20 GENERIC I.C. (40%)/SAF/EAF* $257.24 $100.79 $192.65 21.87% 1185.22 1.3320 2.0648
21 SL/RN ROTARY KILN $344.39 $74.08 $183.10 18.81% 999.74 2.2869 3.1988

\\Da0002\01052901\common\DOE REPORT OCT 2000\Section 4.doc Page 5 of 39
Table 4-1.3: Basis: $140/mt of Steel ScrapVARIABLES FOR RANKING OF IRONMAKING PROCESSES - RESEQUENCED
SEQ. PROCESS CAPEX OPEX FOR I.U. OPEX FOR L.S. INTERNAL RATE TOTAL ELEC. PROCESS CO2 TOTAL CO2
NO. ($/ANN. mt L.S.) ($/ANN. mt I.U.) ($/ANN. mt L.S.) OF RETURN (kWhr/mt LS) (mt/mt LS) (mt/mt LS)
1 100% DRI, 1.0% C, MIDREX $365.36 $132.44 $205.39 10.57% 1,326.73 1.0514 2.2617
2 100% STEEL SCRAP $173.68 $0.00 $217.95 17.75% 822.45 0.0874 0.8909
3 30% DRI, 1.0% C/70% SCRAP $231.85 $137.51 $218.09 12.45% 1,030.37 0.4283 1.3681
4 HYLSA IVM $362.60 $125.52 $196.15 13.72% 1,267.37 0.9086 2.0646
5 30% BF H.M./70% SCRAP CP COKE $243.64 $142.86 $219.12 11.14% 795.44 0.8974 1.6746
6 30% MINI-BF H.M.* $198.05 $142.86 $219.12 14.56% 795.44 0.8974 1.6746
7 30% BF H.M./70% SCRAP NR COKE $243.63 $110.77 $207.70 16.55% 660.35 0.9594 1.5615
8 30% COLD PIG IRON/70% SCRAP $248.06 $145.12 $227.52 6.48% 1002.39 0.9027 1.8170
9 30% TECNORED H.M. W COGEN $196.48 $125.95 $207.14 21.36% 307.58 1.1545 1.4350
10 30% TECNORED H.M. W/O COGEN $187.71 $163.09 $220.45 14.74% 685.69 1.1545 1.7799
11 COREX/MIDREX WITH 60% H.M. $373.50 $161.83 $218.17 5.72% 942.91 2.9239 3.7839
12 HISMELT 32.7% H.M. $259.63 $137.85 $212.92 13.05% 847.37 0.8689 1.6418
13 REDSMELT $334.67 $101.83 $193.03 16.17% 690.28 1.3624 1.9921
14 MAUMEE BRIQUETTE DRI/EAF $292.32 $66.44 $177.03 24.66% 966.09 1.1498 2.0310
15 ITMK3 DR SHOT TO EAF $296.10 $67.60 $183.48 22.05% 825.40 1.5213 2.2742
16 CIRCORED/HBI/EAF $232.37 $78.79 $185.27 27.64% 900.84 1.1999 2.0217
17 CIRCOFER/HBI/SAF/EAF $239.63 $96.20 $188.55 25.37% 780.99 1.6404 2.3528
18 FINMET/HBI/EAF $263.47 $79.42 $185.12 24.31% 907.76 1.0742 1.9022
19 GENERIC IRON CARBIDE (100%)/EAF $347.59 $66.19 $177.84 20.24% 972.95 1.2864 2.1738
20 GENERIC I.C. (40%)/SAF/EAF* $257.24 $100.79 $205.40 16.52% 1185.22 1.3320 2.0648
21 SL/RN ROTARY KILN $344.39 $74.08 $185.46 18.06% 999.74 2.2869 3.1988

\\Da0002\01052901\common\DOE REPORT OCT 2000\Section 4.doc Page 6 of 39
4-2: Sorting and Ranking By Capital Cost Estimates(Through L.S. Production)
The first variable sorted on was the Relative Capital Costs (as $/Annual mtof RLS production based on 1.0 MM mt of RLS per year production). Theprocesses were arranged by ascending Relative Capital Costs. Theseprocesses were also assigned a Rank based on their new sequence as aresult of the Relative Capital Cost sorting. This rank variable is used later(in Section 4.9) as a basis for obtaining weighted Rankings of the processesbases on total variable combinations.
Figure 4-2.1:(Not sensitized by Purchased Scrap Cost)
IRONMAKING PROCESSES SORTED BYESTIMATED RELATIVE CAPITAL COSTS*
HIGHEST THIRD
ITMK3REDSMELT RHF
SL/RN ROTARY KILNGENERIC IRON CARBIDE (100%)
HYLSA IVM SHAFT FCE. DRI (100%)MIDREX SHAFT FURNACE DRI (100%)
COREX/MIDREX
LOWEST THIRD
100% STEEL SCRAPTECHNORED W/O COGEN
TECHNORED WITH COGENMINI BLAST FURNACE
30% DRI/70% STEEL SCRAPCIRCOREDCIRCOFER
Rev. 04-Aug-00
MIDDLE THIRD
BLAST FURNACE - N.R. COKEBLAST FURNACE - C.P. COKE
30% COLD PIG IRON/70% SCRAP40% GEN. IRON CARBIDE/60% SCRAP
HISMELTFINMET
MAUMEE BRIQUETTE RHF
*NOTE: THROUGH LIQUIDSTEEL PRODUCTION

\\Da0002\01052901\common\DOE REPORT OCT 2000\Section 4.doc Page 7 of 39
Table 4-2.1: Sort by Capital Costs(Not sensitized by Purchased Scrap Cost)
VARIABLES FOR RANKING OF IRONMAKING PROCESSES - SORTED ON CAPEX
RANK SEQ. PROCESS CAPEX
(L.S.) NO. ($/ANN. mt L.S.)
LOWEST THIRD
1 2 100% STEEL SCRAP $173.68
2 10 30% TECNORED H.M. W/O COGEN $187.71
3 9 30% TECNORED H.M. W COGEN $196.48
4 6 30% MINI-BF H.M. $198.05
5 3 30% DRI, 1.0% C/70% SCRAP $231.85
6 16 CIRCORED/HBI/EAF $232.37
7 17 CIRCOFER/HBI/SAF/EAF $239.63
MIDDLE THIRD
8 7 30% BF H.M./70% SCRAP NR COKE $243.63
9 5 30% BF H.M./70% SCRAP CP COKE $243.64
10 8 30% COLD PIG IRON/70% SCRAP $248.06
11 20 GENERIC I.C. (40%)/SAF/EAF $257.24
12 12 HISMELT 32.7% H.M. $259.63
13 18 FINMET/HBI/EAF $263.47
14 14 MAUMEE BRIQUETTE DRI/EAF $292.32
HIGHEST THIRD
15 15 ITMK3 DR SHOT TO EAF $296.10
16 13 REDSMELT $334.67
17 21 SL/RN ROTARY KILN $344.39
18 19 GENERIC IRON CARBIDE (100%)/EAF $347.59
19 4 HYLSA IVM $362.60
20 1 100% DRI, 1.0% C, MIDREX $365.36
21 11 COREX/MIDREX WITH 60% H.M. $373.50

\\Da0002\01052901\common\DOE REPORT OCT 2000\Section 4.doc Page 8 of 39
4-3: Sorting and Ranking By Operating CostsEstimates Through Liquid Steel Production
The Operating Costs for Liquid Steel Production are sensitized onPurchased Steel Scrap Cost. Sensitivity values used are: $100/mt,$120/mt and $140/mt. These are based on Published Composite SteelScrap Prices (AMM) as shown in Figure 2-3.1 reproduced below. It wasdetermined that these sensitivity values presented a balance low, medianand high Steel Scrap Costs for the last two years.
FIGURE 2-3.1: STEEL SCRAP PRICE COMPOSITE($/mt WEEKLY FROM JANUARY 1998)
$0.00$20.00$40.00$60.00$80.00
$100.00$120.00$140.00$160.00$180.00
0 20 40 60 80 100 120 140 160
WEEKLY FROM JAN. 1998
SCRAP COMP. MEDIAN PRICE

\\Da0002\01052901\common\DOE REPORT OCT 2000\Section 4.doc Page 9 of 39
Presented below are the Sorts on Liquid Steel Production Costs for the threesensitivity prices.
Figure 4-3.1(Based on $100/mt Steel Scrap Cost)
IRONMAKING PROCESSES SORTED BY ESTIMATEDRELATIVE OPERATING COSTS FOR LIQUID STEEL*
HIGHEST THIRD
MINI BLAST FURNACEHISMELT
TECNORED H.M. W/O COGENHYLSA IVM
30% COLD PIG IRON/70% SCRAPMIDREX SHAFT FCE. DRI (100%)
COREX/MIDREX
LOWEST THIRD
100% STEEL SCRAPMAUMEE BRIQUETTE RHF
TECNORED H.M. WITH COGENGENERIC IRON CARBIDE (100%)
BLAST FURNACE H.M. - N.R. COKEITMK3
GENERIC IRON CARBIDE (40%)
MIDDLE THIRDSL/RN ROTARY KILN
FINMETCIRCOREDREDSMELTCIRCOFER
MIDREX SHAFT FCE. DRI (30%)BLAST FURNACE H.M. - C.P. COKE
*NOTE: THROUGHPRODUCTION OF EAF/LRF
LIQUID STEEL
Rev. 06-Aug-00
$100/mt STEEL SCRAP COST

\\Da0002\01052901\common\DOE REPORT OCT 2000\Section 4.doc Page 10 of 39
Figure 4-3.2(Based on $120/mt Steel Scrap Cost)
IRONMAKING PROCESSES SORTED BY ESTIMATEDRELATIVE OPERATING COSTS FOR LIQUID STEEL*
HIGHEST THIRD
30% MIDREX SHAFT FCE. DRIMINI BLAST FURNACE
BLAST FURNACE H.M. - C.P. COKEMIDREX SHAFT FCE. DRI (100%)
TECNORED H.M. W/O COGEN30% PIG IRON/70% SCRAP
COREX/MIDREX
LOWEST THIRD
MAUMEE BRIQUETTE RHFGENERIC IRON CARBIDE (100%)
ITMK3SL/RN ROTARY KILN
FINMETCIRCOREDCIRCOFER
MIDDLE THIRDREDSMELT
TECNORED H.M. WITH COGEN40% GEN. IRON CARBIDE/60% SCRAP
BLAST FURNACE H.M. - NR COKEHYLSA IVM (100%)
100% STEEL SCRAPHISMELT
*NOTE: THROUGHPRODUCTION OF EAF/LRF
LIQUID STEEL
Rev. 04-Aug-00
$120/mt STEEL SCRAP COST

\\Da0002\01052901\common\DOE REPORT OCT 2000\Section 4.doc Page 11 of 39
Figure 4-3.3(Based on $140/mt Steel Scrap Cost)
IRONMAKING PROCESSES SORTED BY ESTIMATEDRELATIVE OPERATING COSTS FOR LIQUID STEEL*
HIGHEST THIRD
100% STEEL SCRAPMIDREX SHAFT FURNACE (30%)
COREX/MIDREXMINI BLAST FURNACE
BLAST FURNACE H.M. - C.P. COKETECNORED H.M. W/O COGEN
30% COLD PIG IRON/70% SCRAP
LOWEST THIRD
MAUMEE BRIQUETTE RHFGENERIC IRON CARBIDE (100%)
ITMK3FINMET
CIRCOREDSL/RN ROTARY KILN
CIRCOFER
MIDDLE THIRDREDSMELTHYLSA IVM
MIDREX SHAFT FCE. DRI (100%)GENERIC IRON CARBIDE (40%)TECNORED H.M. WITH COGEN
BLAST FURNACE H.M. - N.R. COKEHISMELT
*NOTE: THROUGHPRODUCTION OF EAF/LRF
LIQUID STEEL
Rev. 06-Aug-00
$140/mt STEEL SCRAP COST

\\Da0002\01052901\common\DOE REPORT OCT 2000\Section 4.doc Page 12 of 39
Table 4-3.1(Based on $100/mt Steel Scrap Cost)
VARIABLES FOR RANKING OF IRONMAKING PROCESSES - SORT ON L.S. OPEX
RANK SEQ. PROCESS OPEX FOR L.S.
NO. ($/ANN. mt L.S.)
LOWEST THIRD
1 2 100% STEEL SCRAP $176.83
2 14 MAUMEE BRIQUETTE DRI/EAF $177.03
3 9 30% TECNORED H.M. W COGEN $177.67
4 19 GENERIC IRON CARBIDE (100%)/EAF $177.84
5 7 30% BF H.M./70% SCRAP NR COKE $178.23
6 15 ITMK3 DR SHOT TO EAF $178.76
7 20 GENERIC I.C. (40%)/SAF/EAF* $179.90
MIDDLE THIRD
8 21 SL/RN ROTARY KILN $180.74
9 18 FINMET/HBI/EAF $185.12
10 16 CIRCORED/HBI/EAF $185.27
11 13 REDSMELT $188.31
12 17 CIRCOFER/HBI/SAF/EAF $188.55
13 3 30% DRI, 1.0% C/70% SCRAP $188.64
14 5 30% BF H.M./70% SCRAP CP COKE $189.65
HIGHEST THIRD
15 6 30% MINI-BF H.M.* $189.65
16 12 HISMELT 32.7% H.M. $190.82
17 10 30% TECNORED H.M. W/O COGEN $190.98
18 4 HYLSA IVM $196.15
19 8 30% COLD PIG IRON/70% SCRAP $198.05
20 1 100% DRI, 1.0% C, MIDREX $205.39
21 11 COREX/MIDREX WITH 60% H.M. $218.17

\\Da0002\01052901\common\DOE REPORT OCT 2000\Section 4.doc Page 13 of 39
Table 4-3.2(Based on $120/mt Steel Scrap Cost)
VARIABLES FOR RANKING OF IRONMAKING PROCESSES - SORT ON L.S. OPEX
RANK SEQ. PROCESS OPEX FOR L.S.
NO. ($/ANN. mt L.S.)
LOWEST THIRD
1 14 MAUMEE BRIQUETTE DRI/EAF $177.03
2 19 GENERIC IRON CARBIDE (100%)/EAF $177.84
3 15 ITMK3 DR SHOT TO EAF $181.12
4 21 SL/RN ROTARY KILN $183.10
5 18 FINMET/HBI/EAF $185.12
6 16 CIRCORED/HBI/EAF $185.27
7 17 CIRCOFER/HBI/SAF/EAF $188.55
MIDDLE THIRD
8 13 REDSMELT $190.67
9 9 30% TECNORED H.M. W COGEN $192.41
10 20 GENERIC I.C. (40%)/SAF/EAF $192.65
11 7 30% BF H.M./70% SCRAP NR COKE $192.97
12 4 HYLSA IVM $196.15
13 2 100% STEEL SCRAP $197.39
14 12 HISMELT 32.7% H.M. $198.19
HIGHEST THIRD
15 3 30% DRI, 1.0% C/70% SCRAP $203.36
16 5 30% BF H.M./70% SCRAP CP COKE $204.39
17 6 30% MINI-BF H.M. $204.39
18 1 100% DRI, 1.0% C, MIDREX $205.39
19 10 30% TECNORED H.M. W/O COGEN $205.72
20 8 30% COLD PIG IRON/70% SCRAP $212.79
21 11 COREX/MIDREX WITH 60% H.M. $218.16
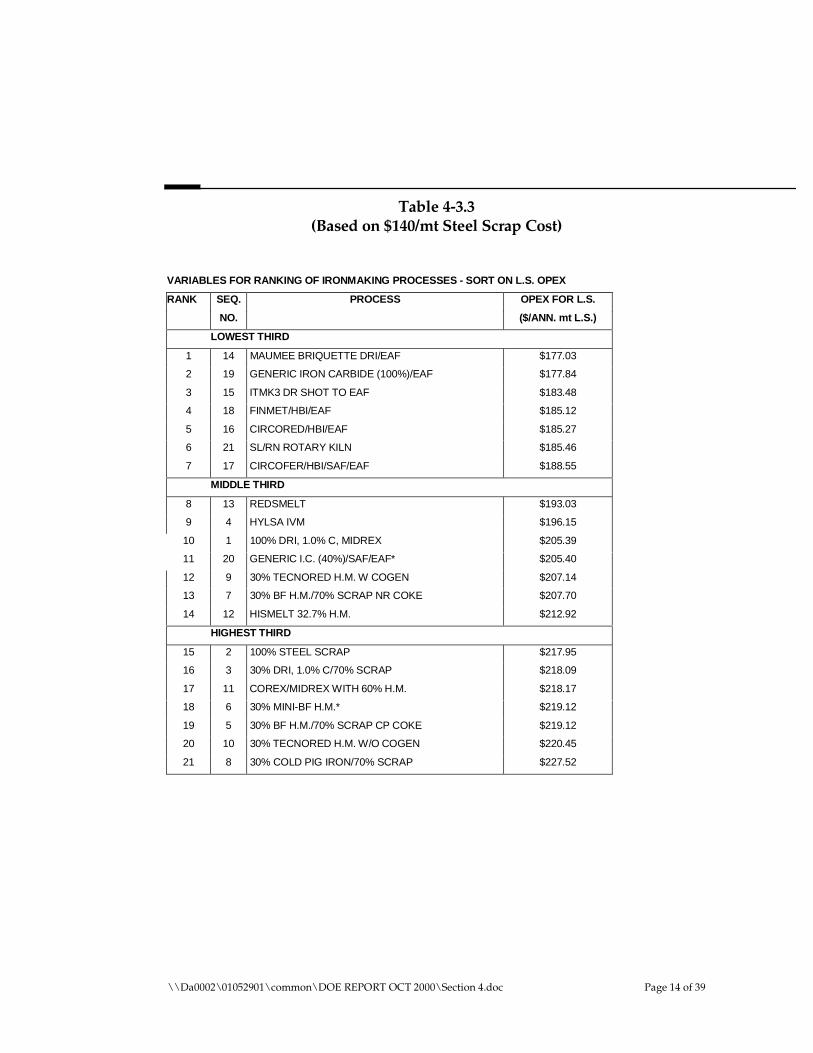
\\Da0002\01052901\common\DOE REPORT OCT 2000\Section 4.doc Page 14 of 39
Table 4-3.3(Based on $140/mt Steel Scrap Cost)
VARIABLES FOR RANKING OF IRONMAKING PROCESSES - SORT ON L.S. OPEX
RANK SEQ. PROCESS OPEX FOR L.S.
NO. ($/ANN. mt L.S.)
LOWEST THIRD
1 14 MAUMEE BRIQUETTE DRI/EAF $177.03
2 19 GENERIC IRON CARBIDE (100%)/EAF $177.84
3 15 ITMK3 DR SHOT TO EAF $183.48
4 18 FINMET/HBI/EAF $185.12
5 16 CIRCORED/HBI/EAF $185.27
6 21 SL/RN ROTARY KILN $185.46
7 17 CIRCOFER/HBI/SAF/EAF $188.55
MIDDLE THIRD
8 13 REDSMELT $193.03
9 4 HYLSA IVM $196.15
10 1 100% DRI, 1.0% C, MIDREX $205.39
11 20 GENERIC I.C. (40%)/SAF/EAF* $205.40
12 9 30% TECNORED H.M. W COGEN $207.14
13 7 30% BF H.M./70% SCRAP NR COKE $207.70
14 12 HISMELT 32.7% H.M. $212.92
HIGHEST THIRD
15 2 100% STEEL SCRAP $217.95
16 3 30% DRI, 1.0% C/70% SCRAP $218.09
17 11 COREX/MIDREX WITH 60% H.M. $218.17
18 6 30% MINI-BF H.M.* $219.12
19 5 30% BF H.M./70% SCRAP CP COKE $219.12
20 10 30% TECNORED H.M. W/O COGEN $220.45
21 8 30% COLD PIG IRON/70% SCRAP $227.52

\\Da0002\01052901\common\DOE REPORT OCT 2000\Section 4.doc Page 15 of 39
4-4: Sorting and Ranking By Operating Costs EstimatesThrough Iron Unit Production
The Operating Costs for Iron Unit Production do not need to be sensitizedon Purchased Steel Scrap Cost. Costs itemized in Tables 2-4.3 through 2-4.5 and provided in detail in Volume II, Appendix F-4 are sorted andranked below.
Figure 4-4.1
IRONMAKING PROCESSES SORTED BY ESTIMATEDRELATIVE OPERATING COSTS FOR IRON UNIT*
HIGHEST THIRD
30% MIDREX SHAFT FCE. DRIHISMELT
MINI BLAST FURNACEBLAST FURNACE H.M. - C.P. COKE
30% PIG IRON/70% SCRAPCOREX/MIDREX
TECNORED H.M. W/O COGEN
LOWEST THIRD
GENERIC IRON CARBIDE (100%)MAUMEE BRIQUETTE RHF
ITMK3SL/RN ROTARY KILN
CIRCOREDFINMET
MIDDLE THIRDCIRCOFER
40% GEN. IRON CARBIDE/60% SCRAPREDSMELT
BLAST FURNACE H.M. - NR COKEHYLSA IVM (100%)
TECNORED H.M. WITH COGENMIDREX SHAFT FCE. DRI (100%)
Rev. 04-Aug-00
*NOTE: THROUGHPRODUCTION OF EAF/LRF
LIQUID STEEL
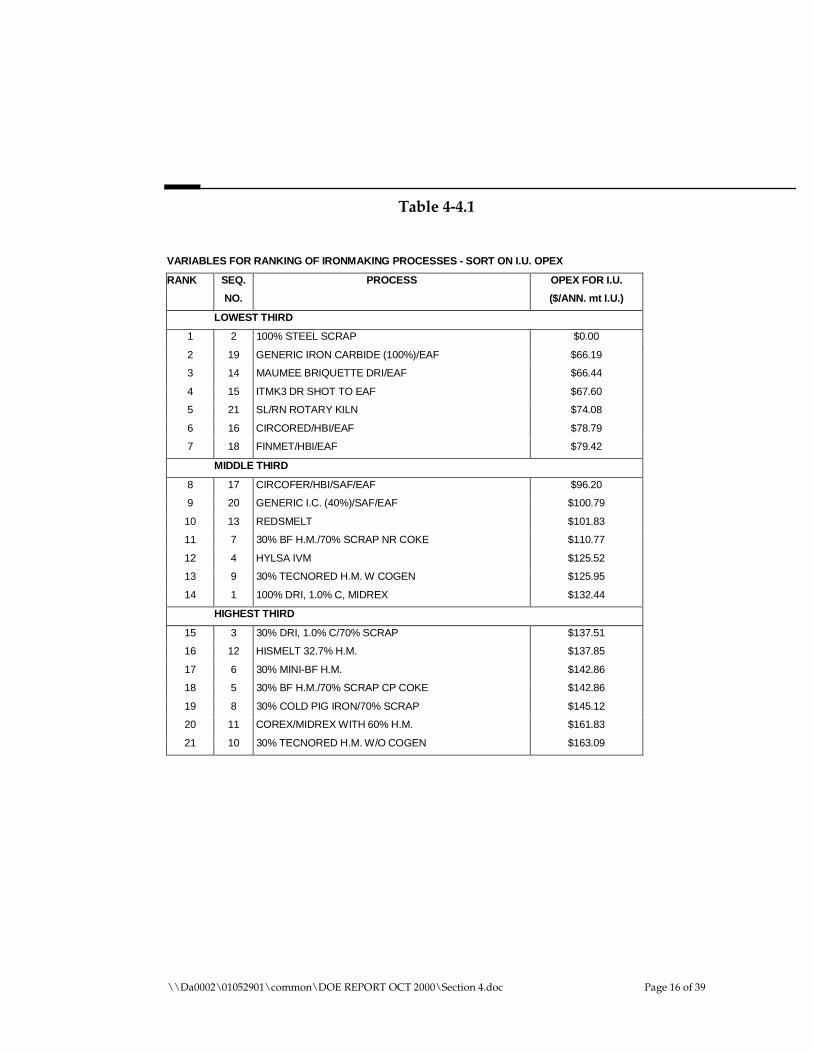
\\Da0002\01052901\common\DOE REPORT OCT 2000\Section 4.doc Page 16 of 39
Table 4-4.1
VARIABLES FOR RANKING OF IRONMAKING PROCESSES - SORT ON I.U. OPEX
RANK SEQ. PROCESS OPEX FOR I.U.
NO. ($/ANN. mt I.U.)
LOWEST THIRD
1 2 100% STEEL SCRAP $0.00
2 19 GENERIC IRON CARBIDE (100%)/EAF $66.19
3 14 MAUMEE BRIQUETTE DRI/EAF $66.44
4 15 ITMK3 DR SHOT TO EAF $67.60
5 21 SL/RN ROTARY KILN $74.08
6 16 CIRCORED/HBI/EAF $78.79
7 18 FINMET/HBI/EAF $79.42
MIDDLE THIRD
8 17 CIRCOFER/HBI/SAF/EAF $96.20
9 20 GENERIC I.C. (40%)/SAF/EAF $100.79
10 13 REDSMELT $101.83
11 7 30% BF H.M./70% SCRAP NR COKE $110.77
12 4 HYLSA IVM $125.52
13 9 30% TECNORED H.M. W COGEN $125.95
14 1 100% DRI, 1.0% C, MIDREX $132.44
HIGHEST THIRD
15 3 30% DRI, 1.0% C/70% SCRAP $137.51
16 12 HISMELT 32.7% H.M. $137.85
17 6 30% MINI-BF H.M. $142.86
18 5 30% BF H.M./70% SCRAP CP COKE $142.86
19 8 30% COLD PIG IRON/70% SCRAP $145.12
20 11 COREX/MIDREX WITH 60% H.M. $161.83
21 10 30% TECNORED H.M. W/O COGEN $163.09
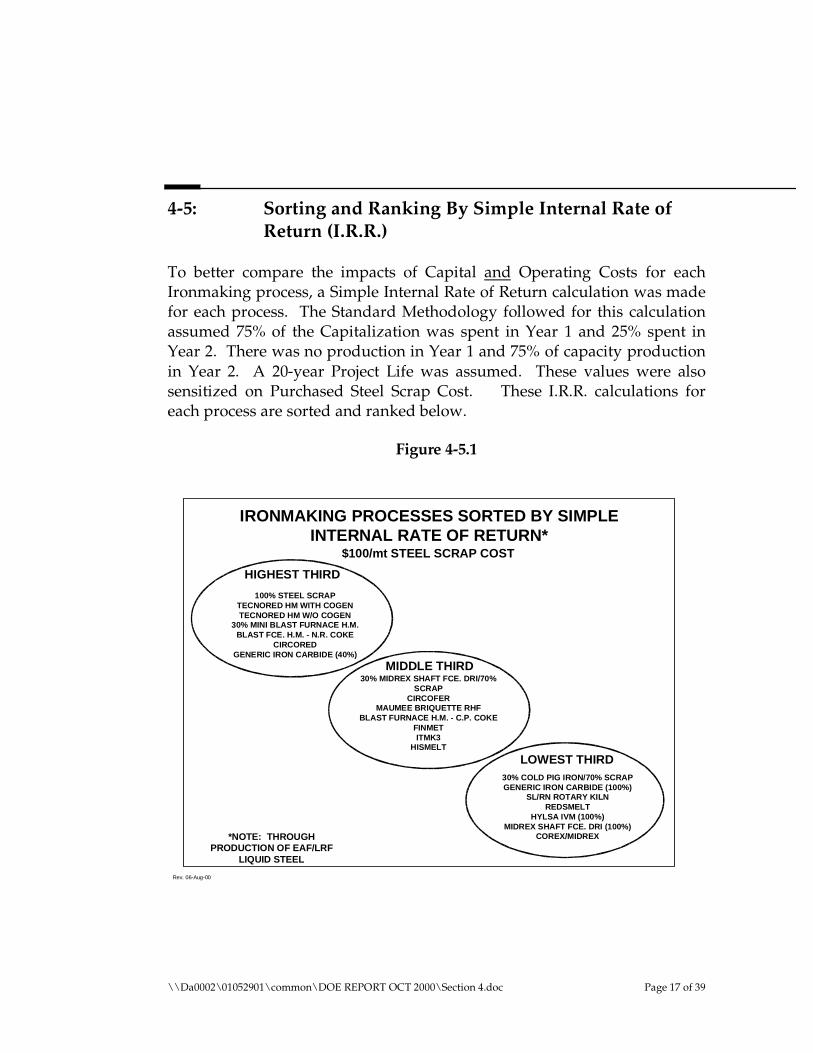
\\Da0002\01052901\common\DOE REPORT OCT 2000\Section 4.doc Page 17 of 39
4-5: Sorting and Ranking By Simple Internal Rate ofReturn (I.R.R.)
To better compare the impacts of Capital and Operating Costs for eachIronmaking process, a Simple Internal Rate of Return calculation was madefor each process. The Standard Methodology followed for this calculationassumed 75% of the Capitalization was spent in Year 1 and 25% spent inYear 2. There was no production in Year 1 and 75% of capacity productionin Year 2. A 20-year Project Life was assumed. These values were alsosensitized on Purchased Steel Scrap Cost. These I.R.R. calculations foreach process are sorted and ranked below.
Figure 4-5.1
IRONMAKING PROCESSES SORTED BY SIMPLEINTERNAL RATE OF RETURN*
LOWEST THIRD30% COLD PIG IRON/70% SCRAPGENERIC IRON CARBIDE (100%)
SL/RN ROTARY KILNREDSMELT
HYLSA IVM (100%)MIDREX SHAFT FCE. DRI (100%)
COREX/MIDREX
HIGHEST THIRD
100% STEEL SCRAPTECNORED HM WITH COGENTECNORED HM W/O COGEN
30% MINI BLAST FURNACE H.M.BLAST FCE. H.M. - N.R. COKE
CIRCOREDGENERIC IRON CARBIDE (40%)
MIDDLE THIRD30% MIDREX SHAFT FCE. DRI/70%
SCRAPCIRCOFER
MAUMEE BRIQUETTE RHFBLAST FURNACE H.M. - C.P. COKE
FINMETITMK3
HISMELT
Rev. 06-Aug-00
*NOTE: THROUGHPRODUCTION OF EAF/LRF
LIQUID STEEL
$100/mt STEEL SCRAP COST

\\Da0002\01052901\common\DOE REPORT OCT 2000\Section 4.doc Page 18 of 39
Figure 4-5.2
IRONMAKING PROCESSES SORTED BY SIMPLEINTERNAL RATE OF RETURN*
LOWEST THIRDSL/RN ROTARY KILN
BLAST FURNACE H.M. - CP COKEREDSMELT
30% COLD PIG IRON/70% SCRAPHYLSA IVM (100%)
MIDREX SHAFT FCE. DRI (100%)COREX/MIDREX
HIGHEST THIRD
100% STEEL SCRAPTECNORED HM WITH COGEN
CIRCOREDCIRCOFER
MAUMEE BRIQUETTE RHFFINMET
BLAST FCE. H.M. - N.R. COKE
MIDDLE THIRDITMK3
MINI BLAST FURNACE40% GEN. IRON CARBIDE/60% SCRAP
TECNORED W/O COGENGENERIC IRON CARBIDE (100%)
30% MIDREX SHAFT FCE. DRI/70%SCRAP
HISMELT
Rev. 04-Aug-00
*NOTE: THROUGHPRODUCTION OF EAF/LRF
LIQUID STEEL
$120/mt STEEL SCRAP COST
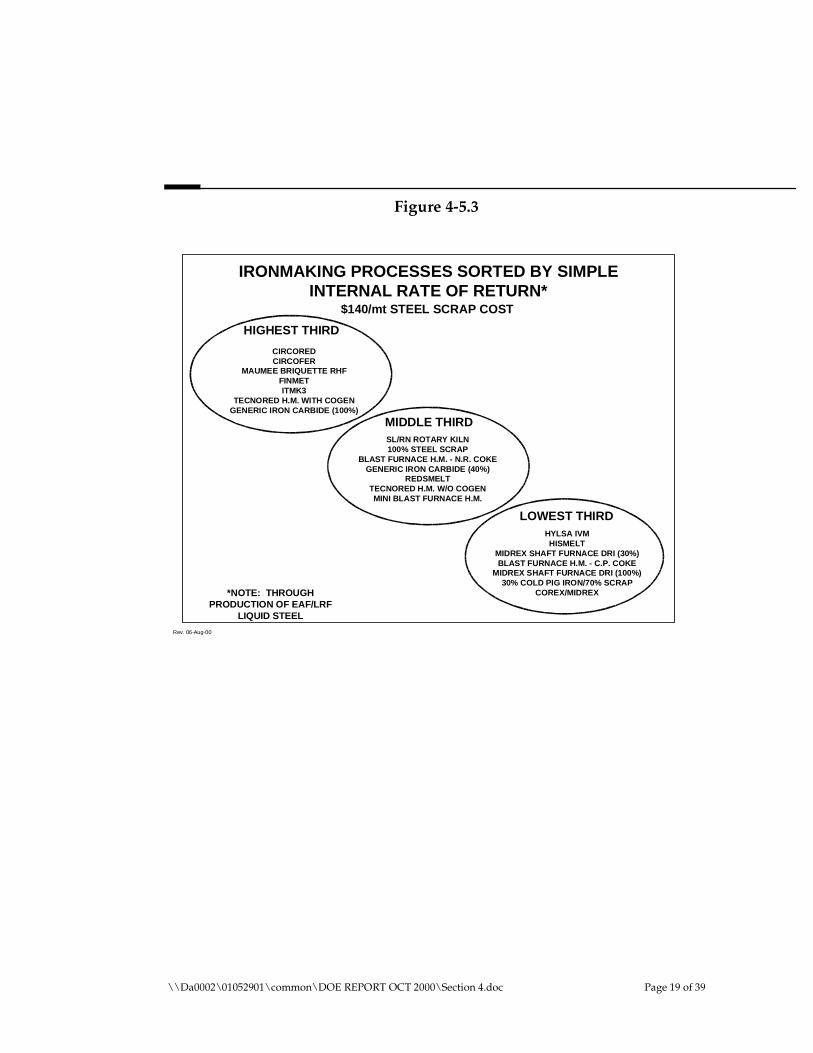
\\Da0002\01052901\common\DOE REPORT OCT 2000\Section 4.doc Page 19 of 39
Figure 4-5.3
IRONMAKING PROCESSES SORTED BY SIMPLEINTERNAL RATE OF RETURN*
LOWEST THIRDHYLSA IVM
HISMELTMIDREX SHAFT FURNACE DRI (30%)BLAST FURNACE H.M. - C.P. COKE
MIDREX SHAFT FURNACE DRI (100%)30% COLD PIG IRON/70% SCRAP
COREX/MIDREX
HIGHEST THIRD
CIRCOREDCIRCOFER
MAUMEE BRIQUETTE RHFFINMETITMK3
TECNORED H.M. WITH COGENGENERIC IRON CARBIDE (100%)
MIDDLE THIRDSL/RN ROTARY KILN100% STEEL SCRAP
BLAST FURNACE H.M. - N.R. COKEGENERIC IRON CARBIDE (40%)
REDSMELTTECNORED H.M. W/O COGEN
MINI BLAST FURNACE H.M.
Rev. 06-Aug-00
*NOTE: THROUGHPRODUCTION OF EAF/LRF
LIQUID STEEL
$140/mt STEEL SCRAP COST

\\Da0002\01052901\common\DOE REPORT OCT 2000\Section 4.doc Page 20 of 39
Table 4-5.1($100/mt Scrap Cost Sensitivity)
VARIABLES FOR RANKING OF IRONMAKING PROCESSES - SORTED ON I.R.R.
RANK SEQ. PROCESS INTERNAL RATE
NO. OF RETURN
HIGHEST THIRD
1 2 100% STEEL SCRAP 42.09%
2 9 30% TECNORED H.M. W COGEN 36.74%
3 10 30% TECNORED H.M. W/O COGEN 31.30%
4 6 30% MINI-BF H.M.* 30.32%
5 7 30% BF H.M./70% SCRAP NR COKE 29.28%
6 16 CIRCORED/HBI/EAF 27.64%
7 20 GENERIC I.C. (40%)/SAF/EAF* 27.02%
MIDDLE THIRD
8 3 30% DRI, 1.0% C/70% SCRAP 26.21%
9 17 CIRCOFER/HBI/SAF/EAF 25.37%
10 14 MAUMEE BRIQUETTE DRI/EAF 24.66%
11 5 30% BF H.M./70% SCRAP CP COKE 24.46%
12 18 FINMET/HBI/EAF 24.31%
13 15 ITMK3 DR SHOT TO EAF 23.72%
14 12 HISMELT 32.7% H.M. 22.39%
LOWEST THIRD
15 8 30% COLD PIG IRON/70% SCRAP 20.43%
16 19 GENERIC IRON CARBIDE (100%)/EAF 20.24%
17 21 SL/RN ROTARY KILN 19.55%
18 13 REDSMELT 17.73%
19 4 HYLSA IVM 13.72%
20 1 100% DRI, 1.0% C, MIDREX 10.57%
21 11 COREX/MIDREX WITH 60% H.M. 5.72%
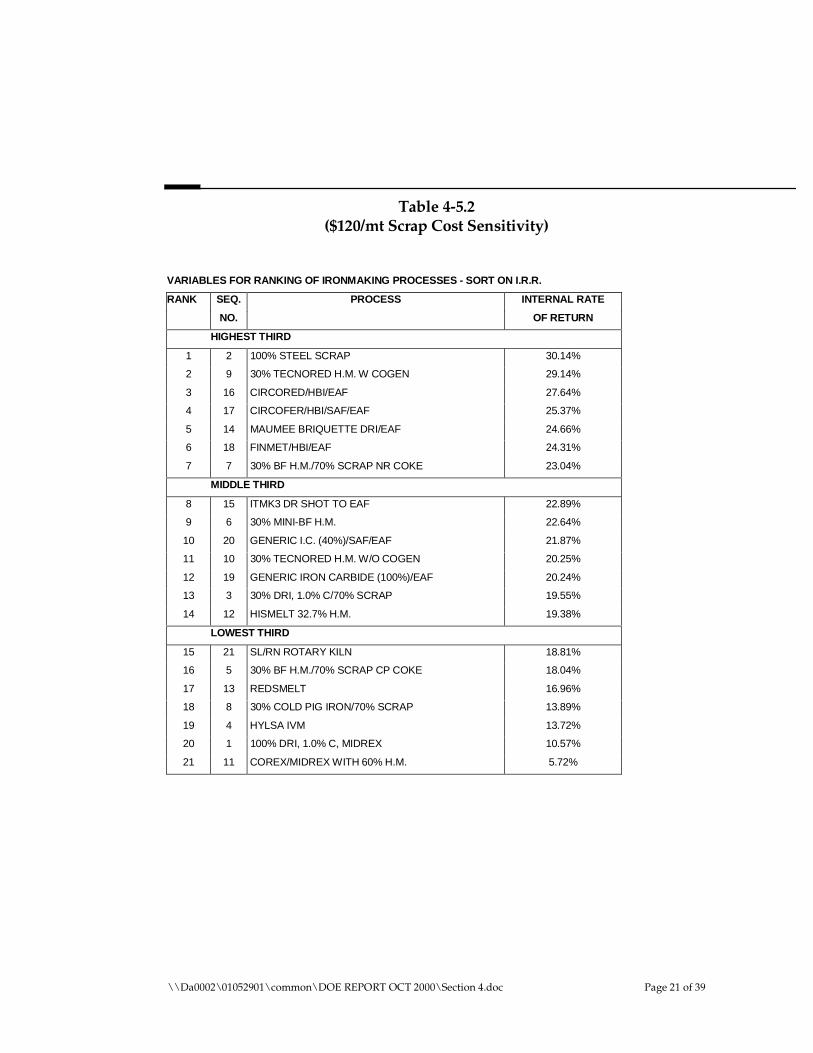
\\Da0002\01052901\common\DOE REPORT OCT 2000\Section 4.doc Page 21 of 39
Table 4-5.2($120/mt Scrap Cost Sensitivity)
VARIABLES FOR RANKING OF IRONMAKING PROCESSES - SORT ON I.R.R.
RANK SEQ. PROCESS INTERNAL RATE
NO. OF RETURN
HIGHEST THIRD
1 2 100% STEEL SCRAP 30.14%
2 9 30% TECNORED H.M. W COGEN 29.14%
3 16 CIRCORED/HBI/EAF 27.64%
4 17 CIRCOFER/HBI/SAF/EAF 25.37%
5 14 MAUMEE BRIQUETTE DRI/EAF 24.66%
6 18 FINMET/HBI/EAF 24.31%
7 7 30% BF H.M./70% SCRAP NR COKE 23.04%
MIDDLE THIRD
8 15 ITMK3 DR SHOT TO EAF 22.89%
9 6 30% MINI-BF H.M. 22.64%
10 20 GENERIC I.C. (40%)/SAF/EAF 21.87%
11 10 30% TECNORED H.M. W/O COGEN 20.25%
12 19 GENERIC IRON CARBIDE (100%)/EAF 20.24%
13 3 30% DRI, 1.0% C/70% SCRAP 19.55%
14 12 HISMELT 32.7% H.M. 19.38%
LOWEST THIRD
15 21 SL/RN ROTARY KILN 18.81%
16 5 30% BF H.M./70% SCRAP CP COKE 18.04%
17 13 REDSMELT 16.96%
18 8 30% COLD PIG IRON/70% SCRAP 13.89%
19 4 HYLSA IVM 13.72%
20 1 100% DRI, 1.0% C, MIDREX 10.57%
21 11 COREX/MIDREX WITH 60% H.M. 5.72%

\\Da0002\01052901\common\DOE REPORT OCT 2000\Section 4.doc Page 22 of 39
Table 4-5.3($140/mt Scrap Cost Sensitivity)
VARIABLES FOR RANKING OF IRONMAKING PROCESSES - SORTED ON I.R.R.
RANK SEQ. PROCESS INTERNAL RATE
NO. OF RETURN
HIGHEST THIRD
1 16 CIRCORED/HBI/EAF 27.64%
2 17 CIRCOFER/HBI/SAF/EAF 25.37%
3 14 MAUMEE BRIQUETTE DRI/EAF 24.66%
4 18 FINMET/HBI/EAF 24.31%
5 15 ITMK3 DR SHOT TO EAF 22.05%
6 9 30% TECNORED H.M. W COGEN 21.36%
7 19 GENERIC IRON CARBIDE (100%)/EAF 20.24%
MIDDLE THIRD
8 21 SL/RN ROTARY KILN 18.06%
9 2 100% STEEL SCRAP 17.75%
10 7 30% BF H.M./70% SCRAP NR COKE 16.55%
11 20 GENERIC I.C. (40%)/SAF/EAF* 16.52%
12 13 REDSMELT 16.17%
13 10 30% TECNORED H.M. W/O COGEN 14.74%
14 6 30% MINI-BF H.M.* 14.56%
LOWEST THIRD
15 4 HYLSA IVM 13.72%
16 12 HISMELT 32.7% H.M. 13.05%
17 3 30% DRI, 1.0% C/70% SCRAP 12.45%
18 5 30% BF H.M./70% SCRAP CP COKE 11.14%
19 1 100% DRI, 1.0% C, MIDREX 10.57%
20 8 30% COLD PIG IRON/70% SCRAP 6.48%
21 11 COREX/MIDREX WITH 60% H.M. 5.72%

\\Da0002\01052901\common\DOE REPORT OCT 2000\Section 4.doc Page 23 of 39
4-6: Sorting and Ranking By Total Electric PowerConsumptions
An important process variable and one also related to the total greenhousegas emissions for a process is the Total Cumulative Electrical PowerConsumption. This not only includes the Ironmaking and Steelmakingprocesses, but also all electrical power consumption (on a weighted basis)for all of the components and raw materials feed to the Iron andSteelmaking processes. The breakdown and bases of the electrical powerconsumptions are provided in the Process Summaries, Volume II,Appendices C and F.
Figure 4-6.1
IRONMAKING PROCESSES SORTED BY ESTIMATEDTOTAL ELECTRIC POWER CONSUMPTION*
HIGHEST THIRDGENERIC IRON CARBIDE (100%)
SL/RN ROTARY KILN30% PIG IRON/70% SCRAP
30% MIDREX SHAFT FCE. DRI40% GENERIC IRON CARBIDE
HYLSA IVM (100%)MIDREX SHAFT FCE. DRI (100%)
LOWEST THIRD
MIDDLE THIRD
*NOTE: THROUGHPRODUCTION OF EAF/LRF
LIQUID STEEL
Rev. 04-Aug-00
TECNORED H.M. WITH COGENBLAST FURNACE H.M. - N.R. COKE
TECNORED H.M. W/O COGENREDSMELTCIRCOFER
BLAST FURNACE H.M. - C.P. COKEMINI BLAST FURNACE
100% STEEL SCRAPITMK3
HISMELTCIRCORED
FINMETCOREX/MIDREX
MAUMEE BRIQUETTE RHF

\\Da0002\01052901\common\DOE REPORT OCT 2000\Section 4.doc Page 24 of 39
Table 4-6.1
VARIABLES FOR RANKING OF IRONMAKING PROCESSES - SORT ON TOTAL ELECTRICITY
RANK SEQ. PROCESS TOTAL ELEC.
NO. (kWhr/mt LS)
LOWEST THIRD
1 9 30% TECNORED H.M. W COGEN 307.58
2 7 30% BF H.M./70% SCRAP NR COKE 660.35
3 10 30% TECNORED H.M. W/O COGEN 685.69
4 13 REDSMELT 690.28
5 17 CIRCOFER/HBI/SAF/EAF 780.99
6 5 30% BF H.M./70% SCRAP CP COKE 795.44
7 6 30% MINI-BF H.M. 795.44
MIDDLE THIRD
8 2 100% STEEL SCRAP 822.45
9 15 ITMK3 DR SHOT TO EAF 825.40
10 12 HISMELT 32.7% H.M. 847.37
11 16 CIRCORED/HBI/EAF 900.84
12 18 FINMET/HBI/EAF 907.76
13 11 COREX/MIDREX WITH 60% H.M. 942.91
14 14 MAUMEE BRIQUETTE DRI/EAF 966.09
HIGHEST THIRD
15 19 GENERIC IRON CARBIDE (100%)/EAF 972.95
16 21 SL/RN ROTARY KILN 999.74
17 8 30% COLD PIG IRON/70% SCRAP 1,002.39
18 3 30% DRI, 1.0% C/70% SCRAP 1,030.37
19 20 GENERIC I.C. (40%)/SAF/EAF 1,185.22
20 4 HYLSA IVM 1,267.37
21 1 100% DRI, 1.0% C, MIDREX 1,326.73

\\Da0002\01052901\common\DOE REPORT OCT 2000\Section 4.doc Page 25 of 39
4-7: Sorting and Ranking By Cumulative ProcessGreenhouse Gas (As CO2 Only) Emissions
Another important process variable is the total greenhouse gas emissionsfor the Process. In this Study, this variable was calculated as being the totalcumulative carbon gas emissions only (as expresses as CO2) for allcomponent, raw material and intermediate processes through theproduction of LRS in the Ironmaking and Steelmaking processes. Thesewere derived in the detailed mass balances of the processes (Volume II,Appendices C and F).
Figure 4-7.1
IRONMAKING PROCESSES SORTED BY ESTIMATEDPROCESS ONLY CO2 EVOLUTION*
HIGHEST THIRDGENERIC IRON CARBIDE (100%)
40% GENERIC IRON CARBIDE/SCRAPREDSMELT
ITMK3CIRCOFER
SL/RN ROTARY KILNCOREX/MIDREX
LOWEST THIRD
MIDDLE THIRD
*NOTE: THROUGHPRODUCTION OF EAF/LRF
LIQUID STEEL
Rev. 04-Aug-00
100% STEEL SCRAP30% MIDREX SHAFT FCE. DRI
HISMELTBLAST FURNACE H.M. - C.P. COKE
MINI BLAST FURNACE30% COLD PIG IRON/SCRAP
HYLSA IVM
BLAST FURNACE H.M. - N.R. COKEMIDREX SHAFT FCE. DRI (100%)
FINMETMAUMEE BRIQUETTE RHF
TECNORED H.M. W/O COGENTECNORED H.M. WITH COGEN
CIRCORED

\\Da0002\01052901\common\DOE REPORT OCT 2000\Section 4.doc Page 26 of 39
Table 4-7.1
VARIABLES FOR RANKING OF IRONMAKING PROCESSES - SORT ON PROCESS CO2
RANK SEQ. PROCESS PROCESS CO2
NO. (mt/mt LS)
LOWEST THIRD
1 2 100% STEEL SCRAP 0.0874
2 3 30% DRI, 1.0% C/70% SCRAP 0.4283
3 12 HISMELT 32.7% H.M. 0.8689
4 5 30% BF H.M./70% SCRAP CP COKE 0.8974
5 6 30% MINI-BF H.M. 0.8974
6 8 30% COLD PIG IRON/70% SCRAP 0.9027
7 4 HYLSA IVM 0.9086
MIDDLE THIRD
8 7 30% BF H.M./70% SCRAP NR COKE 0.9594
9 1 100% DRI, 1.0% C, MIDREX 1.0514
10 18 FINMET/HBI/EAF 1.0742
11 14 MAUMEE BRIQUETTE DRI/EAF 1.1498
12 10 30% TECNORED H.M. W/O COGEN 1.1545
13 9 30% TECNORED H.M. W COGEN 1.1545
14 16 CIRCORED/HBI/EAF 1.1999
HIGHEST THIRD
15 19 GENERIC IRON CARBIDE (100%)/EAF 1.2864
16 20 GENERIC I.C. (40%)/SAF/EAF 1.3320
17 13 REDSMELT 1.3624
18 15 ITMK3 DR SHOT TO EAF 1.5213
19 17 CIRCOFER/HBI/SAF/EAF 1.6404
20 21 SL/RN ROTARY KILN 2.2869
21 11 COREX/MIDREX WITH 60% H.M. 2.9239

\\Da0002\01052901\common\DOE REPORT OCT 2000\Section 4.doc Page 27 of 39
4-8: Sorting and Ranking By Total Cumulative(Including Electrical Power GenerationContribution) Greenhouse Gas (As CO2 Only)Emissions
It should be noted that the contribution to the Total CumulativeGreenhouse Gas Emissions (again expressed as carbon gases as CO2 only)derived from Electrical Power Generation is Significant. Utilizing thegenerating and fuel source types for North American averages (Volume II,Appendix B-1), the contribution to the total emissions due to electricalpower generation ranges from about the same as the Process up to doublethat of the Process. Those processes that minimize the electrical powerconsumption, thus generally result in less total emissions.
Figure 4-8.1
IRONMAKING PROCESSES SORTED BY ESTIMATEDTOTAL CUMULATIVE CO2 EVOLUTION*
HIGHEST THIRD40% GENERIC IRON CARBIDE/SCRAP
GENERIC IRON CARBIDE (100%)MIDREX SHAFT FURNACE DRI (100%)
ITMK3CIRCOFER
SL/RN ROTARY KILNCOREX/MIDREX
LOWEST THIRD
MIDDLE THIRD
*NOTE: INCLUDES ELECTRICAL POWERGENERATION EMISSIONS THROUGH
PRODUCTION OF EAF/LRF LIQUID STEEL
Rev. 04-Aug-00
100% STEEL SCRAP30% MIDREX SHAFT FCE. DRITECNORED H.M. WITH COGEN
BLAST FURNACE H.M. - N.R. COKEHISMELT
BLAST FURNACE - C.P. COKEMINI BLAST FURNACE
TECNORED H.M. W/O COGEN30% COLD PIG IRON/70% SCRAP
FINMETREDSMELTCIRCORED
MAUMEE BRIQUETTE RHFHYLSA IVM

\\Da0002\01052901\common\DOE REPORT OCT 2000\Section 4.doc Page 28 of 39
Table 4-8.1
VARIABLES FOR RANKING OF IRONMAKING PROCESSES - TOTAL CUMULATIVE CO2
RANK SEQ. PROCESS TOTAL CO2
NO. (mt/mt LS)
LOWEST THIRD
1 2 100% STEEL SCRAP 0.8909
2 3 30% DRI, 1.0% C/70% SCRAP 1.3681
3 9 30% TECNORED H.M. W COGEN 1.4350
4 7 30% BF H.M./70% SCRAP NR COKE 1.5615
5 12 HISMELT 32.7% H.M. 1.6418
6 5 30% BF H.M./70% SCRAP CP COKE 1.6746
7 6 30% MINI-BF H.M. 1.6746
MIDDLE THIRD
8 10 30% TECNORED H.M. W/O COGEN 1.7799
9 8 30% COLD PIG IRON/70% SCRAP 1.8170
10 18 FINMET/HBI/EAF 1.9022
11 13 REDSMELT 1.9921
12 16 CIRCORED/HBI/EAF 2.0217
13 14 MAUMEE BRIQUETTE DRI/EAF 2.0310
14 4 HYLSA IVM 2.0646
HIGHEST THIRD
15 20 GENERIC I.C. (40%)/SAF/EAF 2.0648
16 19 GENERIC IRON CARBIDE (100%)/EAF 2.1738
17 1 100% DRI, 1.0% C, MIDREX 2.2617
18 15 ITMK3 DR SHOT TO EAF 2.2742
19 17 CIRCOFER/HBI/SAF/EAF 2.3528
20 21 SL/RN ROTARY KILN 3.1988
21 11 COREX/MIDREX WITH 60% H.M. 3.7839

\\Da0002\01052901\common\DOE REPORT OCT 2000\Section 4.doc Page 29 of 39
4-9 Weighted Ranking Summaries
A significant and powerful diagnostic tool for comparing a number ofsimilar scenarios utilizing multiple variables for comparison is theWeighted Ranking Technique. Simply stated, the Ranks (order of the Sortsin Sections 4-2 through 4-8) are arithmetically summed. These summedrankings were also sorted and grouped into the Lower Third, the MiddleThird and the Higher Third, thus producing a multi-variable comparisonfor the Ironmaking processes. In this Study, Variables 1-4 (CAPEX, OPEXfor I.U., OPEX for L.S. and I.R.R.) were one Summed Rank reflectingeconomic variables. Variables 5-7 (Electric Power, Process CO2 and TotalCO2) or the Environmental Variables were a second Summed Rank and theSum of all Variables 1-7 were a third Summed Rank reflecting all variables.It should be noted that the Steel Scrap Cost required a sensitivity on these
sums. These tabulations and groupings are summarized below and in moredetail in Volume II, Appendix G).
Figure 4-9.1($100/mt Steel Scrap Cost Sensitivity)
IRONMAKING PROCESSES SORTED BY RANKINGSUM - COST-RELATED VARIABLES 1-4
HIGHEST THIRD
BLAST FURNACE H.M. - C.P. COKEREDSMELT
HISMELTCOLD PIG IRON (30%)/SCRAP (70%)
HLYSA IVM (100%)MIDREX SHAFT FCE. DRI (100%)
COREX/MIDREX
LOWEST THIRD
100% STEEL SCRAPTECNORED H.M. WITH COGEN
CIRCOREDBLAST FURNACE H.M. - N.R. COKE
MAUMEE BRIQUETTE RHFGENERIC IRON CARBIDE (40%)
CIRCOFER
MIDDLE THIRDITMK3
GENERIC IRON CARBIDE (100%)MINI BLAST FURNACE H.M. (30%)
MIDREX SHAFT FCE. DRI (30%)FINMET
TECNORED H.M. - W/O COGENSL/RN ROTARY KILN
*NOTE: THROUGHPRODUCTION OF EAF/LRF
LIQUID STEEL
Rev. 07-Aug-00
RANKING VARIABLES1 = INSTALLED CAPITAL COST2 = OPERATING COST PER IRON UNIT3 = OPERATING COST PER MT LIQUID STEEL4 = SIMPLE INTERNAL RATE OF RETURN5 = CUMULATIVE ELECTRICAL POWER6 = CUMULATIVE PROCESS C02 EMISSIONS7 = TOTAL CUMULATIVE CO2 EMISSIONS
$100/mt STEELSCRAP COST

\\Da0002\01052901\common\DOE REPORT OCT 2000\Section 4.doc Page 30 of 39
Figure 4-9.2($120/mt Steel Scrap Cost Sensitivity)
IRONMAKING PROCESSES SORTED BY RANKINGSUM - COST-RELATED VARIABLES 1-4
HIGHEST THIRD
TECHNORED H.M. - W/O COGENHISMELT
BLAST FURNACE H.M. - C.P. COKEHYLSA IVM (100%)
COLD PIG IRON (30%)/ SCRAP (70%)MIDREX SHAFT FCE. DRI (100%)
COREX/MIDREX
LOWEST THIRD100% STEEL SCRAP
CIRCOREDMAUMEE BRIQUETTE RHF
CIRCOFERTECNORED H.M. WITH COGEN
ITMK3FINMET
MIDDLE THIRDGENERIC IRON CARBIDE (100%)
BLAST FURNACE H.M. - N.R. COKEGENERIC IRON CARBIDE (40%)
SL/RN ROTARY KILNMINI BLAST FURNACE H.M. (30%)
MIDREX SHAFT FCE. DRI (30%)REDSMELT
*NOTE: THROUGHPRODUCTION OF EAF/LRF
LIQUID STEEL
Rev. 07-Aug-00
RANKING VARIABLES1 = INSTALLED CAPITAL COST2 = OPERATING COST PER IRON UNIT3 = OPERATING COST PER MT LIQUID STEEL4 = SIMPLE INTERNAL RATE OF RETURN5 = CUMULATIVE ELECTRICAL POWER6 = CUMULATIVE PROCESS C02 EMISSIONS7 = TOTAL CUMULATIVE CO2 EMISSIONS
$120/mt STEELSCRAP COST

\\Da0002\01052901\common\DOE REPORT OCT 2000\Section 4.doc Page 31 of 39
Figure 4-9.3($140/mt Steel Scrap Cost Sensitivity)
IRONMAKING PROCESSES SORTED BY RANKINGSUM - COST-RELATED VARIABLES 1-4
HIGHEST THIRD
TECHNORED H.M. - W/O COGENHISMELT
HYLSA IVM (100%)BLAST FURNACE H.M. - C.P. COKE
MIDREX SHAFT FCE. DRI (100%)COLD PIG IRON (30%)/ SCRAP (70%)
COREX/MIDREX
LOWEST THIRD
CIRCOREDMAUMEE BRIQUETTE RHF
CIRCOFER100% STEEL SCRAP
ITMK3FINMET
GENERIC IRON CARBIDE (100%)
MIDDLE THIRDTECNORED H.M. WITH COGEN
SL/RN ROTARY KILNGENERIC IRON CARBIDE (40%)
BLAST FURNACE H.M. - N.R. COKEREDSMELT
MIDREX SHAFT FCE. DRI (30%)MINI BLAST FURNACE H. M. (30%)
*NOTE: THROUGHPRODUCTION OF EAF/LRF
LIQUID STEELRev. 07-Aug-00
RANKING VARIABLES1 = INSTALLED CAPITAL COST2 = OPERATING COST PER IRON UNIT3 = OPERATING COST PER MT LIQUID STEEL4 = SIMPLE INTERNAL RATE OF RETURN5 = CUMULATIVE ELECTRICAL POWER6 = CUMULATIVE PROCESS C02 EMISSIONS7 = TOTAL CUMULATIVE CO2 EMISSIONS
$140/mt STEELSCRAP COST

\\Da0002\01052901\common\DOE REPORT OCT 2000\Section 4.doc Page 32 of 39
Figure 4-9.4(No Steel Scrap Cost Sensitivity)
IRONMAKING PROCESSES SORTED BY RANKINGSUM - ENERGY & ENVIRONMENTAL VARIABLES 5-7
HIGHEST THIRD
CIRCOFERITMK3
GENERIC IRON CARBIDE (100%)MIDREX SHAFT FCE. DRI (100%)GENERIC IRON CARBIDE (40%)
COREX/MIDREXSL/RN ROTARY KILN
LOWEST THIRD
100% STEEL SCRAPBLAST FURNACE H.M. - N.R. COKEBLAST FURNACE H.M. - C.P. COKE
TECNORED H.M. WITH COGENHISMELT
MINI BLAST FURNACEMIDREX SHAFT FCE. DRI (30%)
MIDDLE THIRDTECNORED H.M. - W/O COGEN
COLD PIG IRON (30%)/SCRAP (70%)FINMET
REDSMELTCIRCORED
MAUMEE BRIQUETTE RHFHYLSA IVM (100%)
*NOTE: THROUGHPRODUCTION OF EAF/LRF
LIQUID STEEL
Rev. 07-Aug-00
RANKING VARIABLES1 = INSTALLED CAPITAL COST2 = OPERATING COST PER IRON UNIT3 = OPERATING COST PER MT LIQUID STEEL4 = SIMPLE INTERNAL RATE OF RETURN5 = CUMULATIVE ELECTRICAL POWER6 = CUMULATIVE PROCESS C02 EMISSIONS7 = TOTAL CUMULATIVE CO2 EMISSIONS
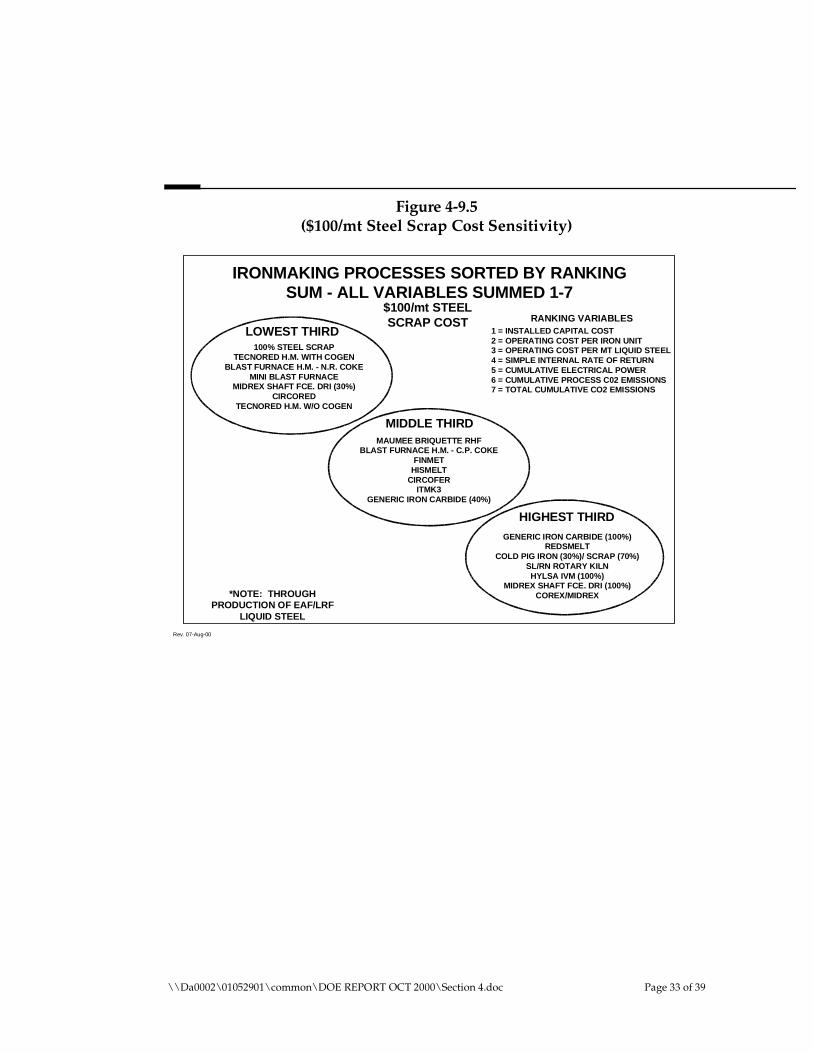
\\Da0002\01052901\common\DOE REPORT OCT 2000\Section 4.doc Page 33 of 39
Figure 4-9.5($100/mt Steel Scrap Cost Sensitivity)
IRONMAKING PROCESSES SORTED BY RANKINGSUM - ALL VARIABLES SUMMED 1-7
HIGHEST THIRD
GENERIC IRON CARBIDE (100%)REDSMELT
COLD PIG IRON (30%)/ SCRAP (70%)SL/RN ROTARY KILN
HYLSA IVM (100%)MIDREX SHAFT FCE. DRI (100%)
COREX/MIDREX
LOWEST THIRD100% STEEL SCRAP
TECNORED H.M. WITH COGENBLAST FURNACE H.M. - N.R. COKE
MINI BLAST FURNACEMIDREX SHAFT FCE. DRI (30%)
CIRCOREDTECNORED H.M. W/O COGEN
MIDDLE THIRDMAUMEE BRIQUETTE RHF
BLAST FURNACE H.M. - C.P. COKEFINMET
HISMELTCIRCOFER
ITMK3GENERIC IRON CARBIDE (40%)
*NOTE: THROUGHPRODUCTION OF EAF/LRF
LIQUID STEEL
Rev. 07-Aug-00
RANKING VARIABLES1 = INSTALLED CAPITAL COST2 = OPERATING COST PER IRON UNIT3 = OPERATING COST PER MT LIQUID STEEL4 = SIMPLE INTERNAL RATE OF RETURN5 = CUMULATIVE ELECTRICAL POWER6 = CUMULATIVE PROCESS C02 EMISSIONS7 = TOTAL CUMULATIVE CO2 EMISSIONS
$100/mt STEELSCRAP COST

\\Da0002\01052901\common\DOE REPORT OCT 2000\Section 4.doc Page 34 of 39
Figure 4-9.6($120/mt Steel Scrap Cost Sensitivity)
IRONMAKING PROCESSES SORTED BY RANKINGSUM - ALL VARIABLES SUMMED 1-7
HIGHEST THIRD
REDSMELTGENERIC IRON CARBIDE (100%)
SL/RN ROTARY KILNCOLD PIG IRON (30%)/ SCRAP (70%)
HYLSA IVM (100%)MIDREX SHAFT FCE. DRI (100%)
COREX/MIDREX
LOWEST THIRD100% STEEL SCRAP
TECNORED H.M. WITH COGENBLAST FURNACE H.M. - N.R. COKE
CIRCOREDMAUMEE BRIQUETTE RHF
FINMETMINI BLAST FURNACE H.M. (30%)
MIDDLE THIRDCIRCOFER
MIDREX SHAFT FCE. DRI (30%)HISMELT
BLAST FURNACE H.M. - C.P. COKEITMK3
TECNORED H.M. - W/O COGENGENERIC IRON CARBIDE (100%)
*NOTE: THROUGHPRODUCTION OF EAF/LRF
LIQUID STEEL
Rev. 07-Aug-00
RANKING VARIABLES1 = INSTALLED CAPITAL COST2 = OPERATING COST PER IRON UNIT3 = OPERATING COST PER MT LIQUID STEEL4 = SIMPLE INTERNAL RATE OF RETURN5 = CUMULATIVE ELECTRICAL POWER6 = CUMULATIVE PROCESS C02 EMISSIONS7 = TOTAL CUMULATIVE CO2 EMISSIONS
$120/mt STEELSCRAP COST

\\Da0002\01052901\common\DOE REPORT OCT 2000\Section 4.doc Page 35 of 39
Figure 4-9.7($140/mt Steel Scrap Cost Sensitivity)
IRONMAKING PROCESSES SORTED BY RANKINGSUM - ALL VARIABLES SUMMED 1-7
HIGHEST THIRD
TECNORED H.M. - W/O COGENSL/RN ROTARY KILN
GENERIC IRON CARBIDE (100%)HYLSA IVM (100%)
COLD PIG IRON (30%)/ SCRAP (70%)MIDREX SHAFT FCE. DRI (100%)
COREX/MIDREX
LOWEST THIRD
100% STEEL SCRAPTECNORED H.M. WITH COGEN
CIRCOREDBLAST FURNACE H.M. - N.R. COKE
MAUMEE BRIQUETTE RHFFINMET
CIRCOFER
MIDDLE THIRDITMK3
MINI BLAST FURNACE H.M. (30%)MIDREX SHAFT FCE. DRI (30%)
GENERIC IRON CARBIDE (100%)BLAST FURNACE H.M. - C.P. COKE
HISMELTREDSMELT
*NOTE: THROUGHPRODUCTION OF EAF/LRF
LIQUID STEEL
Rev. 07-Aug-00
RANKING VARIABLES1 = INSTALLED CAPITAL COST2 = OPERATING COST PER IRON UNIT3 = OPERATING COST PER MT LIQUID STEEL4 = SIMPLE INTERNAL RATE OF RETURN5 = CUMULATIVE ELECTRICAL POWER6 = CUMULATIVE PROCESS C02 EMISSIONS7 = TOTAL CUMULATIVE CO2 EMISSIONS
$140/mt STEELSCRAP COST

\\Da0002\01052901\common\DOE REPORT OCT 2000\Section 4.doc Page 36 of 39
Table 4-9.8: RANKING OF IRONMAKING PROCESSES - RESEQUENCED ORDER
(BASIS: 1.00 MM mt LIQUID STEEL PER YEAR, $120/mt STEEL SCRAP COST)
SEQ. PROCESS CAPEX OPEX I.U. OPEX L.S. I.R.R. ELEC. PROC. CO2 TOTAL CO2 TOTALS TOTALS TOTALS T.S.RANK T.S.RANK T.S.RAN K
NO. RANKING RANKING RANKING RANKING RANKING RANKING RANKING (1-4) (1-7) (5-7) (1-4) (1-7) (5-7)
(1) (2) (3) (4) (5) (6) (7)
1 100% DRI, 1.0% C, MIDREX 20 14 18 20 21 9 17 72 119 47 20 20 1
2 100% STEEL SCRAP 1 1 13 1 8 1 1 16 26 10 1 1
3 30% DRI, 1.0% C/70% SCRAP 5 15 15 13 18 2 2 48 70 22 13 9
4 HYLSA IVM 19 12 12 19 20 7 14 62 103 41 18 19 1
5 30% BF H.M./70% SCRAP CP COKE 9 18 16 16 6 4 6 59 75 16 17 11
6 30% MINI-BF H.M. 4 17 17 9 7 5 7 47 66 19 12 7
7 30% BF H.M./70% SCRAP NR COKE 8 11 11 7 2 8 4 37 51 14 9 3
8 30% COLD PIG IRON/70% SCRAP 10 19 20 18 17 6 9 67 99 32 19 18
9 30% TECNORED H.M. W COGEN 3 13 9 2 1 13 3 27 44 17 5 2
10 30% TECNORED H.M. W/O COGEN 2 21 19 11 3 12 8 53 76 23 15 13
11 COREX/MIDREX WITH 60% H.M. 21 20 21 21 13 21 21 83 138 55 21 21 2
12 HISMELT 32.7% H.M. 12 16 14 14 10 3 5 56 74 18 16 10
13 REDSMELT 16 10 8 17 4 17 11 51 83 32 14 15 1
14 MAUMEE BRIQUETTE DRI/EAF 14 3 1 5 14 11 13 23 61 38 3 5 1
15 ITMK3 DR SHOT TO EAF 15 4 3 8 9 18 18 30 75 45 6 12 1
16 CIRCORED/HBI/EAF 6 6 6 3 11 14 12 21 58 37 2 4 1
17 CIRCOFER/HBI/SAF/EAF 7 8 7 4 5 19 19 26 69 43 4 8 1
18 FINMET/HBI/EAF 13 7 5 6 12 10 10 31 63 32 7 6 1
19 GENERIC IRON CARBIDE (100%)/EAF 18 2 2 12 15 15 16 34 80 46 8 14 1
20 GENERIC I.C. (40%)/SAF/EAF 11 9 10 10 19 16 15 40 90 50 10 16 1
21 SL/RN ROTARY KILN 17 5 4 15 16 20 20 41 97 56 11 17 2

\\Da0002\01052901\common\DOE REPORT OCT 2000\Section 4.doc Page 37 of 39
Table 4-9.9: RANKING OF IRONMAKING PROCESSES - SORTED ON RANKING SUM (1-7)
BASIS: 1.00 MM mt LIQUID STEEL PER YEAR, $120/mt STEEL SCRAP COST)
SEQ. PROCESS CAPEX OPEX I.U. OPEX L.S. I.R.R. ELEC. PROC. CO2 TOTAL CO2 TOTALS TOTALS TOTALS T.S.RANK T.S.RANK T.S.RAN K
NO. RANKING RANKING RANKING RANKING RANKING RANKING RANKING (1-4) (1-7) (5-7) (1-4) (1-7) (5-7)
(1) (2) (3) (4) (5) (6) (7)
LOWEST THIRD
2 100% STEEL SCRAP 1 1 13 1 8 1 1 16 26 10 1 1
9 30% TECNORED H.M. W COGEN 3 13 9 2 1 13 3 27 44 17 5 2
7 30% BF H.M./70% SCRAP NR COKE 8 11 11 7 2 8 4 37 51 14 9 3
16 CIRCORED/HBI/EAF 6 6 6 3 11 14 12 21 58 37 2 4 1
14 MAUMEE BRIQUETTE DRI/EAF 14 3 1 5 14 11 13 23 61 38 3 5 1
18 FINMET/HBI/EAF 13 7 5 6 12 10 10 31 63 32 7 6 1
6 30% MINI-BF H.M. 4 17 17 9 7 5 7 47 66 19 12 7
MIDDLE THIRD
17 CIRCOFER/HBI/SAF/EAF 7 8 7 4 5 19 19 26 69 43 4 8 1
3 30% DRI, 1.0% C/70% SCRAP 5 15 15 13 18 2 2 48 70 22 13 9
12 HISMELT 32.7% H.M. 12 16 14 14 10 3 5 56 74 18 16 10
5 30% BF H.M./70% SCRAP CP COKE 9 18 16 16 6 4 6 59 75 16 17 11
15 ITMK3 DR SHOT TO EAF 15 4 3 8 9 18 18 30 75 45 6 12 1
10 30% TECNORED H.M. W/O COGEN 2 21 19 11 3 12 8 53 76 23 15 13
19 GENERIC IRON CARBIDE (100%)/EAF 18 2 2 12 15 15 16 34 80 46 8 14 1
HIGHEST THIRD
13 REDSMELT 16 10 8 17 4 17 11 51 83 32 14 15 1
20 GENERIC I.C. (40%)/SAF/EAF 11 9 10 10 19 16 15 40 90 50 10 16 1
21 SL/RN ROTARY KILN 17 5 4 15 16 20 20 41 97 56 11 17 2
8 30% COLD PIG IRON/70% SCRAP 10 19 20 18 17 6 9 67 99 32 19 18
4 HYLSA IVM 19 12 12 19 20 7 14 62 103 41 18 19 1
1 100% DRI, 1.0% C, MIDREX 20 14 18 20 21 9 17 72 119 47 20 20 1
11 COREX/MIDREX WITH 60% H.M. 21 20 21 21 13 21 21 83 138 55 21 21 2

\\Da0002\01052901\common\DOE REPORT OCT 2000\Section 4.doc Page 38 of 39
Table 4-9.10: RANKING OF IRONMAKING PROCESSES - SORTED ON RANKING SUM (1-4)
(BASIS: 1.00 MM mt LIQUID STEEL PER YEAR, $120/mt STEEL SCRAP COST)
SEQ. PROCESS CAPEX OPEX I.U. OPEX L.S. I.R.R. ELEC. PROC. CO2 TOTAL CO2 TOTALS TOTALS TOTALS T.S.RANK T.S.RANK T.S.RAN K
NO. RANKING RANKING RANKING RANKING RANKING RANKING RANKING (1-4) (1-7) (5-7) (1-4) (1-7) (5-7)
(1) (2) (3) (4) (5) (6) (7)
LOWEST THIRD
2 100% STEEL SCRAP 1 1 13 1 8 1 1 16 26 10 1 1
16 CIRCORED/HBI/EAF 6 6 6 3 11 14 12 21 58 37 2 4 1
14 MAUMEE BRIQUETTE DRI/EAF 14 3 1 5 14 11 13 23 61 38 3 5 1
17 CIRCOFER/HBI/SAF/EAF 7 8 7 4 5 19 19 26 69 43 4 8 1
9 30% TECNORED H.M. W COGEN 3 13 9 2 1 13 3 27 44 17 5 2
15 ITMK3 DR SHOT TO EAF 15 4 3 8 9 18 18 30 75 45 6 12 1
18 FINMET/HBI/EAF 13 7 5 6 12 10 10 31 63 32 7 6 1
MIDDLE THIRD
19 GENERIC IRON CARBIDE (100%)/EAF 18 2 2 12 15 15 16 34 80 46 8 14 2
7 30% BF H.M./70% SCRAP NR COKE 8 11 11 7 2 8 4 37 51 14 9 3
20 GENERIC I.C. (40%)/SAF/EAF 11 9 10 10 19 16 15 40 90 50 10 16 1
21 SL/RN ROTARY KILN 17 5 4 15 16 20 20 41 97 56 11 17 2
6 30% MINI-BF H.M. 4 17 17 9 7 5 7 47 66 19 12 7
3 30% DRI, 1.0% C/70% SCRAP 5 15 15 13 18 2 2 48 70 22 13 9
13 REDSMELT 16 10 8 17 4 17 11 51 83 32 14 15 1
HIGHEST THIRD
10 30% TECNORED H.M. W/O COGEN 2 21 19 11 3 12 8 53 76 23 15 13
12 HISMELT 32.7% H.M. 12 16 14 14 10 3 5 56 74 18 16 10
5 30% BF H.M./70% SCRAP CP COKE 9 18 16 16 6 4 6 59 75 16 17 11
4 HYLSA IVM 19 12 12 19 20 7 14 62 103 41 18 19 1
8 30% COLD PIG IRON/70% SCRAP 10 19 20 18 17 6 9 67 99 32 19 18
1 100% DRI, 1.0% C, MIDREX 20 14 18 20 21 9 17 72 119 47 20 20 1
11 COREX/MIDREX WITH 60% H.M. 21 20 21 21 13 21 21 83 138 55 21 21 2
Table 4-9.11: RANKING OF IRONMAKING PROCESSES - SORTED ON RANKING SUM (5-7)

\\
Da0002\01052901\
comm
on\D
OE
RE
PO
RT
OC
T2000\
Section4.d
ocP
age39
of39
(BA
SIS
:1.00M
Mm
tLIQU
IDS
TEE
LP
ER
YE
AR
,$120/mtS
TE
EL
SC
RA
PC
OS
T)
SE
Q.
PR
OC
ES
SC
AP
EX
OP
EX
I.U.
OP
EX
L.S.
I.R.R
.E
LEC
.P
RO
C.C
O2
TOTA
LC
O2
TOTA
LSTO
TALS
TOTA
LST.S
.RA
NK
T.S.R
AN
KT.S
.RA
NK
NO
.R
AN
KIN
GR
AN
KIN
GR
AN
KIN
GR
AN
KIN
GR
AN
KIN
GR
AN
KIN
GR
AN
KIN
G(1-4)
(1-7)(5-7)
(1-4)(1-7)
(5-7)
(1)(2)
(3)(4)
(5)(6)
(7)
LOW
ES
TT
HIR
D
2100%
ST
EE
LS
CR
AP
11
131
81
116
2610
11
730%
BF
H.M
./70%S
CR
AP
NR
CO
KE
811
117
28
437
5114
93
530%
BF
H.M
./70%S
CR
AP
CP
CO
KE
918
1616
64
659
7516
1711
930%
TEC
NO
RE
DH
.M.W
CO
GE
N3
139
21
133
2744
175
2
12H
ISM
ELT
32.7%H
.M.
1216
1414
103
556
7418
1610
630%
MIN
I-BF
H.M
.4
1717
97
57
4766
1912
7
330%
DR
I,1.0%C
/70%S
CR
AP
515
1513
182
248
7022
139
MID
DLE
TH
IRD
1030%
TEC
NO
RE
DH
.M.W
/OC
OG
EN
221
1911
312
853
7623
1513
830%
CO
LDP
IGIR
ON
/70%S
CR
AP
1019
2018
176
967
9932
1918
18F
INM
ET
/HB
I/EA
F13
75
612
1010
3163
327
61
13R
ED
SM
ELT
1610
817
417
1151
8332
1415
1
16C
IRC
OR
ED
/HB
I/EA
F6
66
311
1412
2158
372
41
14M
AU
ME
EB
RIQ
UE
TTE
DR
I/EA
F14
31
514
1113
2361
383
51
4H
YLS
AIV
M19
1212
1920
714
62103
4118
191
HIG
HE
ST
TH
IRD
17C
IRC
OFE
R/H
BI/S
AF/E
AF
78
74
519
1926
6943
48
1
15IT
MK
3D
RS
HO
TT
OE
AF
154
38
918
1830
7545
612
1
19G
EN
ER
ICIR
ON
CA
RB
IDE
(100%)/E
AF
182
212
1515
1634
8046
814
1
1100%
DR
I,1.0%C
,MID
RE
X20
1418
2021
917
72119
4720
201
20G
EN
ER
ICI.C
.(40%)/S
AF
/EA
F11
910
1019
1615
4090
5010
161
11C
OR
EX
/MID
RE
XW
ITH
60%H
.M.
2120
2121
1321
2183
13855
2121
2
21S
L/RN
RO
TAR
YK
ILN17
54
1516
2020
4197
5611
172

\\Da0002\01052901\common\DOE REPORT OCT 2000\Section 5.doc Page 1 of 18
Section 5: Summary and Conclusions
5-1: Conclusions From Sorts
A number of conclusions can be draw from examination of the groupingof the sorted variables developed in this Study. It can be concluded thatthose Ironmaking processes (i.e., Process Scenario through EAF/LRFproduction of LRS) that consistently ended up in the lowest (or mostdesirable) grouping, would have more desired economics or morefavorable environmental impacts than those processes that consistentlywere grouped in the Middle or Highest groupings.
In the Resequenced Selected Process Scenarios (as ordered in Table 4-9.8)there are 21 selected processes. Thus these were grouped into groups of 7for purposes of comparison. The discussions below focus processes withcommon attributes that favor their ranking in the sorted groupings. Inaddition, attention is called to any specific attribute of a process thatmoves it into a more favorable or less favorable grouping.
In this subjective analysis of the key variables developed for each processscenario, a consensus on those processes or process attributes that show afavorable potential will be developed.

\\Da0002\01052901\common\DOE REPORT OCT 2000\Section 5.doc Page 2 of 18
5-1.1: Sorting on Capital Cost Estimates
Summarizing the presentation of sorting results from Section 4-2, theLowest Grouping of Relative Capital Costs (through EAF/LRF productionof LRS) is highlighted.
Figure 5-1.1
LOWEST THIRD
100% STEEL SCRAPTECNORED W/O COGEN
TECNORED WITH COGENMINI BLAST FURNACE
30% DRI/70% STEEL SCRAPCIRCOREDCIRCOFER
Conclusions from this lowest grouping of Capital Costs include:
• Processes with fine ore feed (Tecnored with or without Co-generation,Circored, and Circofer)
• Mini Blast Furnace Process• Mixture of 30% Midrex DRI/70% Steel Scrap• Of course the lowest-cost, 100% Steel Scrap charge to the EAF
The weighting of the low-capital cost EAF process results in inclusion ofthe 30% Midrex Shaft Furnace DRI/70% Steel Scrap case. It should benoted that the similar scenarios with partial Steel Scrap charge also are inthe Middle Grouping of Capital Costs.

\\Da0002\01052901\common\DOE REPORT OCT 2000\Section 5.doc Page 3 of 18
5-1.2: Sorting on Operating Costs For Liquid Steel Production
Summarizing the presentation of sorting results from Section 4-3, theLowest Grouping of Relative Operating Costs (through EAF/LRFproduction of LRS) is highlighted for the various sensitivity cases for SteelScrap Cost.
Figure 5-1.2
IRONMAKING PROCESSES SORTED BY ESTIMATEDRELATIVE OPERATING COSTS FOR LIQUID STEEL*
LOWEST THIRD
100% STEEL SCRAPMAUMEE BRIQUETTE RHF
TECNORED H.M. WITH COGENGENERIC IRON CARBIDE (100%)
BLAST FURNACE H.M. - N.R. COKEITMK3
GENERIC IRON CARBIDE (40%)
*NOTE: THROUGHPRODUCTION OF EAF/LRF
LIQUID STEEL
Rev. 06-Aug-00
$100/mt STEEL SCRAP COST
LOWEST THIRD
MAUMEE BRIQUETTE RHFGENERIC IRON CARBIDE (100%)
ITMK3SL/RN ROTARY KILN
FINMETCIRCOREDCIRCOFER
$120/mt STEEL SCRAP COST
LOWEST THIRD
MAUMEE BRIQUETTE RHFGENERIC IRON CARBIDE (100%)
ITMK3FINMET
CIRCOREDSL/RN ROTARY KILN
CIRCOFER
$140/mt STEEL SCRAP COST
Conclusions from these lowest groupings of L.S. Operating Costs include:
• The lowest L.S. Operating Cost processes are highly dependent onSteel Scrap Prices
• Typically for all scrap cost sensitivities:- Processes with fine ore feed (Tecnored with Co-generation,
Circored, and Circofer) and Blast Furnace with non-recovery coke@ $100/mt scrap.

\\Da0002\01052901\common\DOE REPORT OCT 2000\Section 5.doc Page 4 of 18
- Fine ore feed processes (MauMee, Iron Carbide, ITMK3, Finmet,Circored, and Circofer) and SL/RN @ $120/mt and $140/mt scrapcosts.
- These include the lower-cost Rotary Hearth as well as theFluidized-Bed process.
Except at the lowest scrap price with the low-cost Hot Metal producers(i.e., Tecnored or Blast Furnace both with co-generation), the lowest costprocesses are those with low-cost iron ore fines as the primary iron unitfeed.
5-1.3: Sorting on Operating Costs For Iron Unit Production
Summarizing the presentation of sorting results from Section 4-4, theLowest Grouping of Relative Operating Costs for Iron Unit production ishighlighted.
Figure 5-1.3
LOWEST THIRD
GENERIC IRON CARBIDE (100%)MAUMEE BRIQUETTE RHF
ITMK3SL/RN ROTARY KILN
CIRCOREDFINMET

\\Da0002\01052901\common\DOE REPORT OCT 2000\Section 5.doc Page 5 of 18
Conclusions from the lowest grouping of Iron Unit Operating Costsinclude:
• The lowest Iron Unit Operating Cost processes are the fine ore feedprocesses with Fluidized Beds (Iron Carbide, Circored, Finmet).
• The Rotary Hearth processes (MauMee, ITMK3) with fine ore feed andcoal reductant.
• The Rotary Kiln (SL/RN) with coal reductant and low electrical powerconsumption.
5-1.4: Sorting on Simple Internal Rate of Return (I.R.R.)
Summarizing the presentation of sorting results from Section 4-5, thehighest Groupings of Simple Internal Rate of Return are highlightedbelow.
Figure 5-1.4
IRONMAKING PROCESSES SORTED BY SIMPLEINTERNAL RATE OF RETURN*
HIGHEST THIRD
100% STEEL SCRAPTECNORED HM WITH COGENTECNORED HM W/O COGEN
30% MINI BLAST FURNACE H.M.BLAST FCE. H.M. - N.R. COKE
CIRCOREDGENERIC IRON CARBIDE (40%)
Rev. 06-Aug-00
*NOTE: THROUGHPRODUCTION OF EAF/LRF
LIQUID STEEL
$100/mt STEEL SCRAP COST
HIGHEST THIRD
100% STEEL SCRAPTECNORED HM WITH COGEN
CIRCOREDCIRCOFER
MAUMEE BRIQUETTE RHFFINMET
BLAST FCE. H.M. - N.R. COKE
$120/mt STEEL SCRAP COST
HIGHEST THIRD
CIRCOREDCIRCOFER
MAUMEE BRIQUETTE RHFFINMETITMK3
TECNORED H.M. WITH COGENGENERIC IRON CARBIDE (100%)
$140/mt STEEL SCRAP COST

\\Da0002\01052901\common\DOE REPORT OCT 2000\Section 5.doc Page 6 of 18
It should be noted that although the Simple Internal Rate of Returncalculation is an approximation of a Project’s value, this valuablecombination of the both the economic factors of Capital Costs andOperating Costs provide a powerful method of comparing the differentIronmaking Scenarios. It should also be noted that there will be asignificant sensitivity to the variable of Liquid Steel value, particularly inan absolute comparison. In the relative comparison, it is not so important.In this analysis, a relatively-low value for the Refined Liquid Steel (RLS) of$250/mt was used to minimize any potential for biasing.
Conclusions from these Highest (i.e., best) groupings of I.R.R. for all scrapcost sensitivities include:
• The highest I.R.R. included 100% Steel Scrap charge to the EAF for$100 and $120/mt steel scrap, but did not include 100% Steel Scrap atthe $140/mt sort.
• At the high cost of Steel Scrap (i.e. $140/mt), the fine ore (fluidizedbed, MauMee RHF and the Tecnored H.M. with co-generation)processes were in the most favored (highest I.R.R) group.
• At the lowest cost for Steel Scrap (i.e., $100/mt), the efficient Hot Metalprocesses (Tecnored with and without co-generation, the ConventionalBlast Furnace with Non-Recovery Coke, and the Mini Blast Furnace)were included.
• In addition, at $100/mt Scrap, the fluidized bed processes with fine ore(Circored and Iron Carbide) were included.
• At the median Scrap Cost ($120/mt) the lower-cost MauMee RotaryHearth process and the fine ore fluidized bed (Circored, Circofer, andFinmet) were included.
The primary conclusions from above indicate that the lower-cost fine ore,the energy efficient Hot Metal processes and those processes withelectrical power co-generation (thus reducing operating costs) have thehighest economic potential as reflected by the Simple I.R.R. calculation.

\\Da0002\01052901\common\DOE REPORT OCT 2000\Section 5.doc Page 7 of 18
5-1.5: Sorting on Total Electrical Power Consumption
Summarizing the presentation of sorting results from Section 4-6, theLowest Grouping of Total Electrical Power Consumption is highlightedbelow.
Figure 5-1.5
LOWEST THIRDTECNORED H.M. WITH COGEN
BLAST FURNACE H.M. - N.R. COKETECNORED H.M. W/O COGEN
REDSMELTCIRCOFER
BLAST FURNACE H.M. - C.P. COKEMINI BLAST FURNACE
Conclusions from this lowest grouping of Total Electrical PowerConsumption include:
• The lowest Electrical Power Consumption processes are the hot metal-producing processes (with lower EAF net power) of Tecnored andConventional Blast Furnaces (with or without co-generation) and theMini Blast Furnace.
• The Rotary Hearth process (Redsmelt) and the Fluid-Bed process withfine ore feed and coal reductant (Circofer) also rank in the lowestgrouping for power consumption.
The significant common denominator here is that all of these processesuse coal (or a coal derivative) as the primary reductant.

\\Da0002\01052901\common\DOE REPORT OCT 2000\Section 5.doc Page 8 of 18
5-1.6: Sorting on Cumulative Process (only) Greenhouse Gas (asCO2) Emissions
Summarizing the presentation of sorting results from Section 4-7, theLowest Grouping of Total Cumulative Process Greenhouse Gas Emissionsis highlighted below.
Figure 5-1.6
LOWEST THIRD100% STEEL SCRAP
30% MIDREX SHAFT FCE. DRIHISMELT
BLAST FURNACE H.M. - C.P. COKEMINI BLAST FURNACE
30% COLD PIG IRON/SCRAPHYLSA IVM
Conclusions from this lowest grouping of Total Cumulative ProcessEmissions include:
• The 100% Steel Scrap EAF.
• The Hot Metal-producing process of Conventional Blast Furnace withconventional Co-Product Coke (without combustion co-generation),B.F. Pig Iron and the Mini Blast Furnace are in the lower emissionsgroup.
• The Shaft Furnace DRI processes (Midrex and HYLSA IVM) are in thelowest group likely by virtue of the low emissions from the natural gasfired shaft furnace direct reduction processes.
• The Hismelt Oxygen Reactor process also ranked in the Lowest Groupfor Process Emissions.
Note: This does not include the electrical power component that wouldinfluence total emissions.

\\Da0002\01052901\common\DOE REPORT OCT 2000\Section 5.doc Page 9 of 18
5-1.7: Sorting on Total Cumulative Greenhouse Gas (as CO2)Emissions (Including Electrical Power GenerationContribution)
Summarizing the presentation of sorting results from Section 4-8, theLowest Grouping of Total Cumulative Process Greenhouse Gas Emissionsis highlighted below.
Figure 5-1.7
LOWEST THIRD100% STEEL SCRAP
30% MIDREX SHAFT FCE. DRITECNORED H.M. WITH COGEN
BLAST FURNACE H.M. - N.R. COKEHISMELT
BLAST FURNACE - C.P. COKEMINI BLAST FURNACE
Conclusions from this lowest grouping of Total Cumulative ProcessEmissions include:
• The 100% Steel Scrap EAF
• The hot metal-producing process of Conventional Blast Furnace withconventional Co-Product Coke and with Non-Recovery Coke and theMini Blast Furnace are in the lower total emissions group
• Tecnored with co-generation (also a hot metal process)
• The Shaft Furnace DRI process (Midrex)
• The Hismelt Oxygen Reactor process also ranked in the Lowest Groupfor Total Emissions
Note: This does include the electrical power component that influencedtotal emissions.

\\Da0002\01052901\common\DOE REPORT OCT 2000\Section 5.doc Page 10 of 18
5-2: Conclusions From Ranking Sorts
The Relative Process Variables utilized for the Ranking Sort Analysiswere:
1. CAPEX2. OPEX for Iron Unit3. OPEX for Liquid Steel4. Simple Internal Rate of Return5. Total Cumulative Electrical Power6. Total Cumulative Process (Only) Emissions7. Total Cumulative Emissions (Process and Equivalent E.P. Emissions)
The Ranking Sort Analysis, or regrouping the processes on the sums oftheir numeric variable sort sequences (from Section 4), was done for allScrap Cost sensitivities of $100/mt, $120/mt and $140/mt whereappropriate. The sums of the sort sequences for variables 1-4 reflecteconomic considerations, the sums of variables 5-7 reflect energy andenvironmental considerations and the sums of all of the variables 1-7present an overall picture of the process scenarios.
5-2.1: Ranking Sort on Economic Variables (1-4)
Referring to the Table 4-9.10 and Volume II, Appendix G, for the Sort andGrouping on the Ranking sums of Economic-Related Variables 1-4, thefollowing groupings are obtained:
• Lower Grouping: Most desirable or favorable processes• Middle Grouping: Intermediate desirability• Highest Grouping: Least desirable or favorable processes
These results are presented in pictorial form in Figures 5-2.1 through 5-2.3.

\\Da0002\01052901\common\DOE REPORT OCT 2000\Section 5.doc Page 11 of 18
Figure 5-2.1Lowest Group of Sort Rank Sums (1-4)
IRONMAKING PROCESSES SORTED BY RANKINGSUM - COST-RELATED VARIABLES 1-4
LOWEST THIRD
100% STEEL SCRAPTECNORED H.M. WITH COGEN
CIRCOREDBLAST FURNACE H.M. - N.R. COKE
MAUMEE BRIQUETTE RHFGENERIC IRON CARBIDE (40%)
CIRCOFER
Rev. 14-Aug-00
RANKING VARIABLES1 = INSTALLED CAPITAL COST2 = OPERATING COST PER IRON UNIT3 = OPERATING COST PER MT LIQUID STEEL4 = SIMPLE INTERNAL RATE OF RETURN5 = CUMULATIVE ELECTRICAL POWER6 = CUMULATIVE PROCESS C02 EMISSIONS7 = TOTAL CUMULATIVE CO2 EMISSIONS
$100/mt STEELSCRAP COST
LOWEST THIRD
CIRCOREDMAUMEE BRIQUETTE RHF
CIRCOFER100% STEEL SCRAP
ITMK3FINMET
GENERIC IRON CARBIDE (100%)
LOWEST THIRD100% STEEL SCRAP
CIRCOREDMAUMEE BRIQUETTE RHF
CIRCOFERTECNORED H.M. WITH COGEN
ITMK3FINMET
$120/mt STEELSCRAP COST
$140/mt STEELSCRAP COST

\\Da0002\01052901\common\DOE REPORT OCT 2000\Section 5.doc Page 12 of 18
Figure 5-2.2Middle Group of Sort Rank Sums (1-4)
IRONMAKING PROCESSES SORTED BY RANKINGSUM - COST-RELATED VARIABLES 1-4
MIDDLE THIRDGENERIC IRON CARBIDE (100%)
BLAST FURNACE H.M. - N.R. COKEGENERIC IRON CARBIDE (40%)
SL/RN ROTARY KILNMINI BLAST FURNACE H.M. (30%)
MIDREX SHAFT FCE. DRI (30%)REDSMELT
Rev. 14-Aug-00
RANKING VARIABLES1 = INSTALLED CAPITAL COST2 = OPERATING COST PER IRON UNIT3 = OPERATING COST PER MT LIQUID STEEL4 = SIMPLE INTERNAL RATE OF RETURN5 = CUMULATIVE ELECTRICAL POWER6 = CUMULATIVE PROCESS C02 EMISSIONS7 = TOTAL CUMULATIVE CO2 EMISSIONS
$120/mt STEELSCRAP COST
MIDDLE THIRDTECNORED H.M. WITH COGEN
SL/RN ROTARY KILNGENERIC IRON CARBIDE (40%)
BLAST FURNACE H.M. - N.R. COKEREDSMELT
MIDREX SHAFT FCE. DRI (30%)MINI BLAST FURNACE H. M. (30%)
MIDDLE THIRDITMK3
GENERIC IRON CARBIDE (100%)MINI BLAST FURNACE H.M. (30%)
MIDREX SHAFT FCE. DRI (30%)FINMET
TECNORED H.M. - W/O COGENSL/RN ROTARY KILN
$140/mt STEELSCRAP COST
$100/mt STEELSCRAP COST
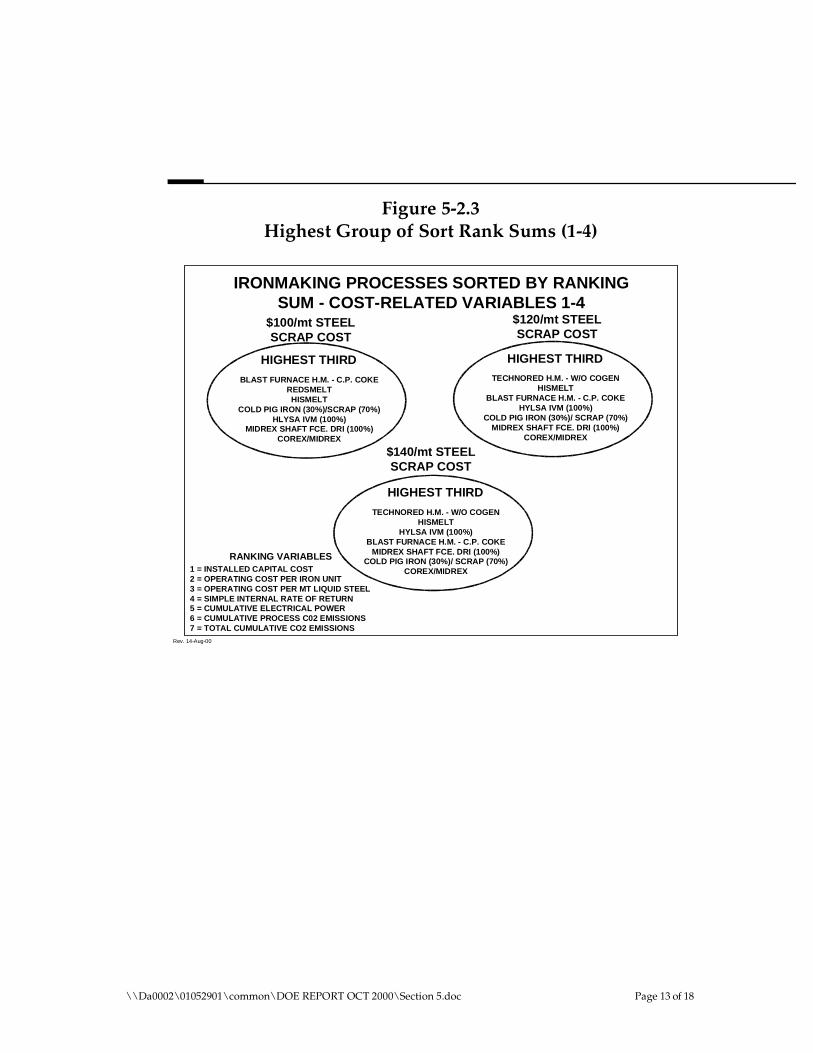
\\Da0002\01052901\common\DOE REPORT OCT 2000\Section 5.doc Page 13 of 18
Figure 5-2.3Highest Group of Sort Rank Sums (1-4)
IRONMAKING PROCESSES SORTED BY RANKINGSUM - COST-RELATED VARIABLES 1-4
HIGHEST THIRD
TECHNORED H.M. - W/O COGENHISMELT
HYLSA IVM (100%)BLAST FURNACE H.M. - C.P. COKE
MIDREX SHAFT FCE. DRI (100%)COLD PIG IRON (30%)/ SCRAP (70%)
COREX/MIDREX
Rev. 14-Aug-00
RANKING VARIABLES1 = INSTALLED CAPITAL COST2 = OPERATING COST PER IRON UNIT3 = OPERATING COST PER MT LIQUID STEEL4 = SIMPLE INTERNAL RATE OF RETURN5 = CUMULATIVE ELECTRICAL POWER6 = CUMULATIVE PROCESS C02 EMISSIONS7 = TOTAL CUMULATIVE CO2 EMISSIONS
$140/mt STEELSCRAP COST
HIGHEST THIRDTECHNORED H.M. - W/O COGEN
HISMELTBLAST FURNACE H.M. - C.P. COKE
HYLSA IVM (100%)COLD PIG IRON (30%)/ SCRAP (70%)
MIDREX SHAFT FCE. DRI (100%)COREX/MIDREX
HIGHEST THIRD
BLAST FURNACE H.M. - C.P. COKEREDSMELT
HISMELTCOLD PIG IRON (30%)/SCRAP (70%)
HLYSA IVM (100%)MIDREX SHAFT FCE. DRI (100%)
COREX/MIDREX
$120/mt STEELSCRAP COST
$100/mt STEELSCRAP COST

\\Da0002\01052901\common\DOE REPORT OCT 2000\Section 5.doc Page 14 of 18
5-2.2: Ranking Sort on Energy and Environmental Variables (5-7)
Referring to the Table 4-9.11 and Volume II, Appendix G, for the Sort andGrouping on the Ranking sums of Energy and Environmental RelatedVariables 5-7, the following groupings are obtained:
• Lower Grouping: Most desirable or favorable processes• Middle Grouping: Intermediate desirability• Highest Grouping: Least desirable or favorable processes
These results are presented in pictorial form in Figure 5-2.4 for allGroupings.
Figure 5-2.4All Groups of Sort Rank Sums (5-7)
IRONMAKING PROCESSES SORTED BY RANKINGSUM - ENERGY & ENVIRONMENTAL VARIABLES 5-7
HIGHEST THIRD
CIRCOFERITMK3
GENERIC IRON CARBIDE (100%)MIDREX SHAFT FCE. DRI (100%)GENERIC IRON CARBIDE (40%)
COREX/MIDREXSL/RN ROTARY KILN
LOWEST THIRD
100% STEEL SCRAPBLAST FURNACE H.M. - N.R. COKEBLAST FURNACE H.M. - C.P. COKE
TECNORED H.M. WITH COGENHISMELT
MINI BLAST FURNACEMIDREX SHAFT FCE. DRI (30%)
MIDDLE THIRDTECNORED H.M. - W/O COGEN
COLD PIG IRON (30%)/SCRAP (70%)FINMET
REDSMELTCIRCORED
MAUMEE BRIQUETTE RHFHYLSA IVM (100%)
*NOTE: THROUGHPRODUCTION OF EAF/LRF
LIQUID STEEL
Rev. 07-Aug-00
RANKING VARIABLES1 = INSTALLED CAPITAL COST2 = OPERATING COST PER IRON UNIT3 = OPERATING COST PER MT LIQUID STEEL4 = SIMPLE INTERNAL RATE OF RETURN5 = CUMULATIVE ELECTRICAL POWER6 = CUMULATIVE PROCESS C02 EMISSIONS7 = TOTAL CUMULATIVE CO2 EMISSIONS

\\Da0002\01052901\common\DOE REPORT OCT 2000\Section 5.doc Page 15 of 18
5-2.3: Ranking Sort on All Variables (1-7)
Referring to the Table 4-9.9 and Volume II, Appendix G, for the Sort andGrouping on the Ranking sums of All Variables 1-7, the followinggroupings are obtained:
• Lower Grouping: Most desirable or favorable processes• Middle Grouping: Intermediate desirability• Highest Grouping: Least desirable or favorable processes
These results are presented in pictorial form in Figures 5-2.5 through 5-2.7for all Groupings.
Figure 5-2.5Lowest Group of Sort Rank Sums (1-7)
IRONMAKING PROCESSES SORTED BY RANKINGSUM - ALL VARIABLES SUMMED 1-7
LOWEST THIRD100% STEEL SCRAP
TECNORED H.M. WITH COGENBLAST FURNACE H.M. - N.R. COKE
MINI BLAST FURNACEMIDREX SHAFT FCE. DRI (30%)
CIRCOREDTECNORED H.M. W/O COGEN
Rev. 14-Aug-00
RANKING VARIABLES1 = INSTALLED CAPITAL COST2 = OPERATING COST PER IRON UNIT3 = OPERATING COST PER MT LIQUID STEEL4 = SIMPLE INTERNAL RATE OF RETURN5 = CUMULATIVE ELECTRICAL POWER6 = CUMULATIVE PROCESS C02 EMISSIONS7 = TOTAL CUMULATIVE CO2 EMISSIONS
$100/mt STEELSCRAP COST
LOWEST THIRD
100% STEEL SCRAPTECNORED H.M. WITH COGEN
CIRCOREDBLAST FURNACE H.M. - N.R. COKE
MAUMEE BRIQUETTE RHFFINMET
CIRCOFER
LOWEST THIRD100% STEEL SCRAP
TECNORED H.M. WITH COGENBLAST FURNACE H.M. - N.R. COKE
CIRCOREDMAUMEE BRIQUETTE RHF
FINMETMINI BLAST FURNACE H.M. (30%)
$120/mt STEELSCRAP COST
$140/mt STEELSCRAP COST

\\Da0002\01052901\common\DOE REPORT OCT 2000\Section 5.doc Page 16 of 18
Figure 5-2.6Middle Group of Sort Rank Sums (1-7)
IRONMAKING PROCESSES SORTED BY RANKINGSUM - ALL VARIABLES SUMMED 1-7
MIDDLE THIRDCIRCOFER
MIDREX SHAFT FCE. DRI (30%)HISMELT
BLAST FURNACE H.M. - C.P. COKEITMK3
TECNORED H.M. - W/O COGENGENERIC IRON CARBIDE (100%)
Rev. 14-Aug-00
RANKING VARIABLES1 = INSTALLED CAPITAL COST2 = OPERATING COST PER IRON UNIT3 = OPERATING COST PER MT LIQUID STEEL4 = SIMPLE INTERNAL RATE OF RETURN5 = CUMULATIVE ELECTRICAL POWER6 = CUMULATIVE PROCESS C02 EMISSIONS7 = TOTAL CUMULATIVE CO2 EMISSIONS
$120/mt STEELSCRAP COST
MIDDLE THIRDITMK3
MINI BLAST FURNACE H.M. (30%)MIDREX SHAFT FCE. DRI (30%)
GENERIC IRON CARBIDE (100%)BLAST FURNACE H.M. - C.P. COKE
HISMELTREDSMELT
MIDDLE THIRDMAUMEE BRIQUETTE RHF
BLAST FURNACE H.M. - C.P. COKEFINMET
HISMELTCIRCOFER
ITMK3GENERIC IRON CARBIDE (40%)
$140/mt STEELSCRAP COST
$100/mt STEELSCRAP COST

\\Da0002\01052901\common\DOE REPORT OCT 2000\Section 5.doc Page 17 of 18
Figure 5-2.7Highest Group of Sort Rank Sums (1-7)
IRONMAKING PROCESSES SORTED BY RANKINGSUM - ALL VARIABLES SUMMED 1-7
HIGHEST THIRD
TECNORED H.M. - W/O COGENSL/RN ROTARY KILN
GENERIC IRON CARBIDE (100%)HYLSA IVM (100%)
COLD PIG IRON (30%)/ SCRAP (70%)MIDREX SHAFT FCE. DRI (100%)
COREX/MIDREX
Rev. 14-Aug-00
RANKING VARIABLES1 = INSTALLED CAPITAL COST2 = OPERATING COST PER IRON UNIT3 = OPERATING COST PER MT LIQUID STEEL4 = SIMPLE INTERNAL RATE OF RETURN5 = CUMULATIVE ELECTRICAL POWER6 = CUMULATIVE PROCESS C02 EMISSIONS7 = TOTAL CUMULATIVE CO2 EMISSIONS
$140/mt STEELSCRAP COST
HIGHEST THIRD
REDSMELTGENERIC IRON CARBIDE (100%)
SL/RN ROTARY KILNCOLD PIG IRON (30%)/ SCRAP (70%)
HYLSA IVM (100%)MIDREX SHAFT FCE. DRI (100%)
COREX/MIDREX
HIGHEST THIRD
GENERIC IRON CARBIDE (100%)REDSMELT
COLD PIG IRON (30%)/ SCRAP (70%)SL/RN ROTARY KILN
HYLSA IVM (100%)MIDREX SHAFT FCE. DRI (100%)
COREX/MIDREX
$120/mt STEELSCRAP COST
$100/mt STEELSCRAP COST

\\Da0002\01052901\common\DOE REPORT OCT 2000\Section 5.doc Page 18 of 18
5-3: General Conclusions From Sorting and Rank Sums
It should be noted that the following overall conclusions can be madefrom the sorted, grouped and ranked sum variables reflecting theIronmaking process scenarios:
• The processes with the best combined economics (CAPEX and OPEXimpacts in the I.R.R. calculation) can be grouped into those Fine Orebased processes with no scrap charge and those producing Hot Metalfor charge to the EAF.
• A pronounced sensitivity to Steel Scrap Cost was felt less by the HotMetal Processes and the Fine Ore Processes.
• In terms of evolving processes, the Tecnored Process (and in particular,the lower-operating cost process with integral co-generation ofelectrical power) was in the most favorable groupings at all scrap costsensitivities.
• It should be noted also that the Conventional Blast Furnace processutilizing Non-Recovery coke (from a continuous coking process withintegral co-generation of electrical power) also showed favorableRelative Economics for the low and median Scrap Cost sensitivities.
• The lower-cost, more efficient MauMee briquetted feed Rotary HearthProcess under initial commercialization also was grouped in the mostfavorable groups (for median and high scrap cost sensitivities).
Those processes with lower-cost raw materials (i.e., fine ore and/or non-metallurgical coal as the reductant) had favorable combined economics.In addition, the hot metal processes (in part due to the sensible heatimpacts in the EAF and due to their inherently lower costs) also hadfavorable combined economics.
As a group, the processes with the Hot Metal processes had lower TotalCumulative Electrical Power Consumption, lower Process Emissions, andlower Total Emissions (including Electrical Power generation). Thesewere reflected also in the Ranking Sums. The exception was the ShaftFurnace DRI process (Midrex) that was in the lower group for theenvironmental variables.